Abstract
Connected vehicles are a vital part of smart cities, which connect over a wireless connection and bring mobile computation and communication abilities. As a mediator, fog computing resides between vehicles and the cloud and provides vehicles with processing, storage, and networking power through Vehicular Ad-hoc networks (VANET). VANET is a time-sensitive technology that requires less time to process a request received from a vehicle. Delay and latency are the notorious issues of VANET and fog computing. To deal with such problems, in this work, we developed a priority-based fog computing model for smart urban vehicle transportation that reduces the delay and latency of fog computing. To upgrade the fog computing infrastructure to meet the latency and Quality of Service (QoS) requirements, 5G localized Multi-Access Edge Computing (MEC) servers have also been used, which resulted tremendously in reducing the delay and the latency. We decreased the data latency by 20% compared to the experiment carried using only cloud computing architecture. We also reduced the processing delay by 35% compared with the utilization of cloud computing architecture.
1. Introduction
Ensuring good Quality of Life (QoL) to every human is the fundamental task of the urbanization process, which comprises social development, economic development, and environmental protection [1]. Consequently, rapid population growth can be noticed today in urban areas. According to the United Nations (UN) [2], urban areas were the home of 55% of the global population in 2018 and will shelter 68% of people in 2050, and by the year 2050, an estimated 416 million Indians will live in cities [2]. Now the time has come to find sustainable solutions that provide good quality of life in every aspect of living and minimize upcoming challenges. A few decades ago, the Smart City emerged as the most prominent solution to all the urbanization problems and delivered optimal and efficient results with the aid of Information and Communication Technology (ICT) in various city facets. Though the facilitation of ICT in the smart city is not the only reason for a city to be smart [3], there are many other urban models that smart cities require to be interpreted as fully functional smart cities i.e., information city, digital city, and telicity [4,5]. To establish a highly urbanized population, researchers have proposed some models of the future smart city in which sustainability, technology, safety, comfort, and connectivity play a significant role to make the city smart and to provide a good quality of life to the people [1]. According to [6], the city must follow sustainable development, which is defined as making improvements to the city’s environmental quality. Context-aware economics and governance, as well as inclusiveness, are all attributes of a city’s residents.
The notion of connecting everything to the internet through smart devices, called the Internet of Things (IoT), has emerged as a game-changer for smart cities. According to [7], it has been predicted that there will be 22 billion active IoT devices by 2025, while the current rate of IoT devices at the time of analysis was 7 billion in 2018. Further advancements in related technologies such as machine-to-machine (M2M) communication, wireless sensor networks (WSN), and Ubiquitous Computing (UC) enhance the IoT network. These connected devices exchange authorized information with one another to support contextual decision-making [8].
An intelligent transportation system powered by a Vehicular Ad hoc Networks (VANETs) is one of the main goals of the smart city. VANETs improve the overall driving experience and traffic efficiency of the smart city. In the real world, VANETs minimize accident risk and traffic jams on the road by providing emergency message sending and traffic forecasting, respectively. VANETs play a vital role in autonomous cars by giving accurate information about road conditions. Furthermore, fault detection, traffic security, resource scheduling, energy consumption reduction, etc., are some of the services that VANETs provide [9].
A new concept called the Internet of Vehicles (IoV) has recently emerged to overcome the limitations of VANETs. IoV is an extension of VANETs. Although IoV and VANETs share the same goal, VANETs do not have the processing power to deal with large amounts of global information. Moreover, VANETs do not have the capability of analyzing, processing, and evaluating the global information that is acquired from the many vehicles that are a part of the network, since they are not designed to do so [10]. VANETs are designed to perform small tasks, like accident avoidance, jam avoidance etc. We will discuss IoV more in our future work.
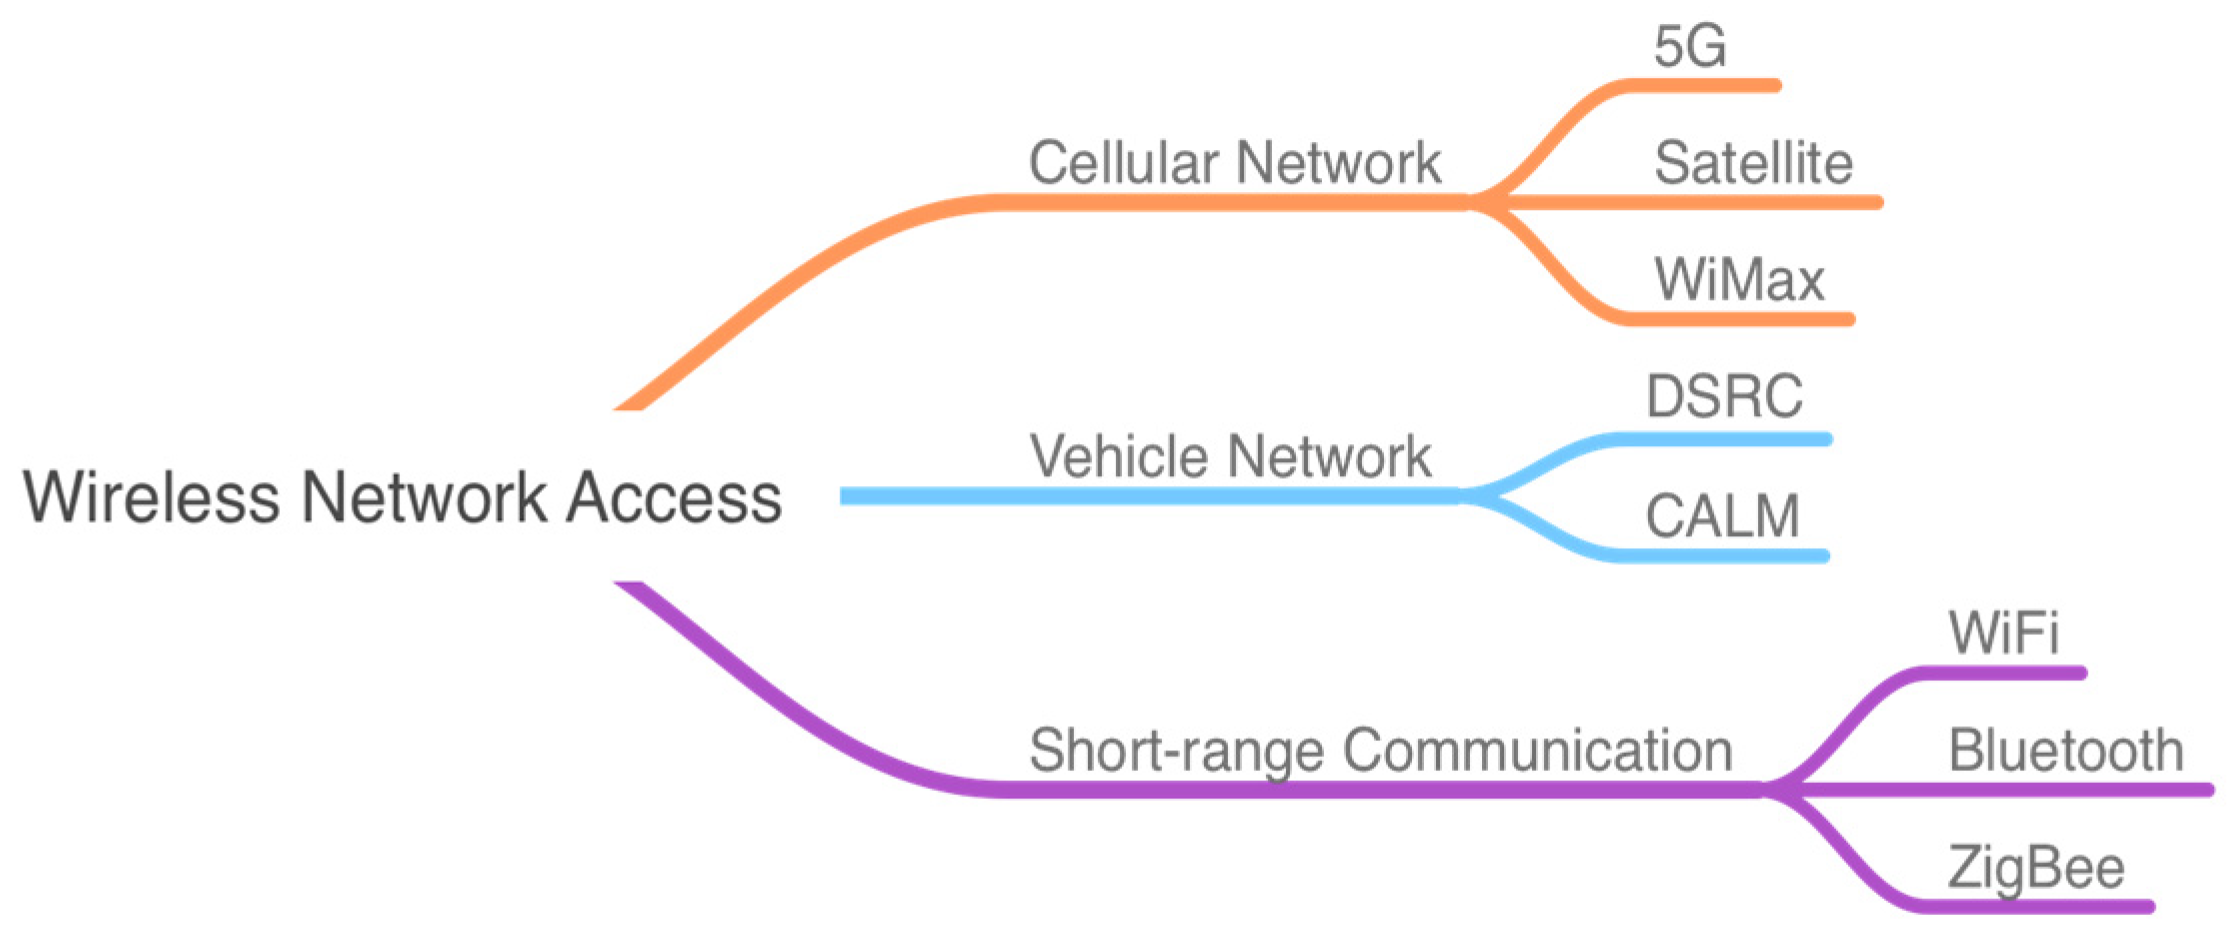
Data transmission and communication between vehicles and roadside infrastructure are the backbones of VANETs, which use several communication technologies, such as mobile networks, vehicle networks, and short-range communication [9], as shown in Figure 1.

Figure 1.
VANETs’ communication technologies.
There is no excuse to refuse the importance of cloud computing in VANET. In the back end of fog and VANETs are cloud data centers, although there are some drawbacks in the cloud while using it with VANETs due to the centralized nature of cloud computing. A high amount of data transportation between devices such as CCTV footage streaming, or traffic and road-sensory data could not be handled by centralized computing due to high latency. For example, in a city environment, the driver must decide in a short amount of time whether he should change lanes, find an empty or less crowded road before being stuck in a traffic jam, or slow down the car while finding the parking space, etc. These are some examples in which low latency is required [11]. Here, distributed computing like fog computing comes to aid of VANET’s time-sensitive applications, because fog nodes are installed at the edge of the network and stay close to the user and end devices, which is why fog processes the data and replies in real-time, unlike centralized computing in the cloud, which is far away from the communicating devices. In the front-end, VANETs support distributed computing rather than centralized computing. At the end of the day, all the data is transmitted to the cloud for permanent storage as the fog offers only temporary storage for a limited time.
1.1. Motivations
Millions of people lose their life on the road each year due to accidents. According to a WHO survey published in 2021 [12], around 1.3 million people die every year because of road accidents. Economically, road traffic accidents cost the majority of countries 3% of their GDP, and 93% of the world’s road deaths happen in low- and middle-income countries. Despite the fact that these countries own around 60% of the world’s vehicles, children and young adults between the ages of 5 and 29 are most commonly killed in car accidents. On the other hand, traffic jams also a major contributor to road deaths. According to [13], traffic congestion has had enormous social, economic, and environmental consequences in recent years. Congestion has a significant impact on the urban transportation system, particularly in highly populated areas. In 2014, traffic congestion cost the United States (US) a total of $160 billion because they had to drive 6.9 billion extra hours and buy 3.1 billion more gallons of fuel.
If the driver of a vehicle is informed at least 1 or 2 s before a collision, almost 60% of road accidents can be prevented [14], and traffic jams can be avoided if we warn the driver just before taking the wrong turn.
1.2. Our Contributions
In this research, we focus on minimizing the delay and the latency of fog computing to avoid incidents discussed above. Though fog gives responses to VANET requests in less time than the cloud, there are many challenges, such as delays in responses, irregularities in connectivity, security, heterogeneity, a vast amount of mobility, etc. [15]. To the best of our knowledge, no previous work has compared cloud and fog computing in the light of VANETs by using a 5G network. This is what we have tried to solve in this research work. We have focused on one of the most critical challenges of VANETs, which is a delay in responses. We first compared the performance of cloud and fog computing in terms of delay and latency in VANETs, then utilized our priority-based proposed model in the fog and found that our model can reduce the delay and latency by 20% and 35%, respectively, compared to cloud. Our work aims to make the smart city safe and sustainable with the innovation of fog computing, rectify the disadvantages in fog computing like latency and delay, and provide a high-speed data transmission rate by using a 5G cellular network.
Our research work contributes the following:
- A novel algorithm is developed to reduce fog computing delay and latency in smart city transportation.
- A fog computing model is proposed in which the delay and the latency of data transfer have been calculated by implementing several mathematical equations.
- For faster communication between vehicles and RSUs, we used 5G SDN.
The rest of this paper is structured as follows. In Section 2, we present the concepts of delay and latency of fog computing, 5G SDN, and IoV in smart city transportation, as discussed in the literature. We discuss fog computing architecture in detail in Section 3. The proposed model, algorithm, and workflow diagram are presented in Section 4. The model evaluation and results are discussed in Section 5. Finally, we present our conclusions in Section 6.
2. Related Work
Recently, a few studies have focused on edge-based and cloud-based smart cities. Moreover, some of surveys have examined fog computing applications in smart cities, among which only one followed a precise design. As mentioned above, determine and investigate delay and the location-sensitive vehicular utilization of smart cities through fog computing, we resolved to analyze the existing related reviews to lessen the delay and latency of fog computing in smart city advancement. These studies are based on an overview analysis of smart city fog computing.
Corcuera et al. [16] addressed new issues and difficulties of smart cities corresponding to smart vehicle transportation, and audited a few approaches and advanced technology. The domain characterization that was indicated in this audit was very much portrayed. Nonetheless, numerous elements were ignored that were benefits to executing smart cities, such as giving essential necessities and benefits to the public and advancing vehicle information assurance and appropriate manageability planning. Likewise, the audit approach was not precise; the method of choosing papers was not demonstrated. Recent smart city definitions characterize smart urban areas as metropolitan agglomerations in which a wide range of IoT devices and sensors are utilized to gather information, then apply them to deal with tremendous assets successfully.
Goudarzi et al. [17] presented a “fast hybrid multi-site computation offloading solution”. This technique offloads the task promptly, and they developed two algorithms to obtain the best. Another study [18] proposed an imaginative idea that transforms associated vehicles into mobile fog nodes based on vehicular fog computing and uses vehicle adaptability to give practical and on-request vehicular fog computing applications. Coincidentally, all of the vehicles in these works suffer from impetus issues, issues the fog nodes ought to consider.
Chiang et al. [19] suggested an agreement-based technique for verifying the accuracy and stability of the vehicular information system within a fog computing network to minimize latency and assure the validity of the vehicular network system. Palattella et al. [20] describe a fog-assisted architecture for seamless handover. As a result, the proposed architecture enabled dispersed applications such as Vehicle-to-Everything (V2X) to meet critical requirements such as time, safety, and security-sensitive network operations.
Lourenço et al. [21] present a traffic management strategy based on vehicle-to-infrastructure communication or V2I communication. At each RSU, vehicles transmit a message, and when they encounter a jam, vehicles ask for information on nearby streets from the closest RSU. Each vehicle can find alternate routes using this data. According to the results of the simulation, the proposed method had the potential to reduce travel time while having little impact on distance traveled.
For the efficient processing of IoT jobs, Hameed et al. [22] offer a capacity-based load-balancing strategy for vehicular fog distributed computing supported by a cluster. By taking into account vehicle position, speed, and direction when forming clusters that serve as a pool of computing resources, the authors suggest a dynamic clustering approach. For a vehicle to be identified as having left the cluster, the study suggests an identification process that may be used to anticipate its future position inside the dynamic network. Additionally, the authors offer a capacity-based load-distribution method for balancing load in the vehicular fog network on both an intra- and inter-cluster basis. The NS2 network simulation environment provided the most up-to-date findings for the simulations, and the results demonstrated that the suggested strategy resulted in balanced network energy usage, decreased network delay, and increased network utilization.
Kai et al. [23] summarized the current state of research on fog computing in VANETs and discussed future directions. Additionally, they explored the characteristics of fog computing and the services available for VANETs that are based on the fog computing platform. Several prospects for problems and issues were explored in this study, as well as related strategies that must be examined in the context of fog computing in VANETs. Finally, the authors addressed future research possibilities for fog computing in VANETs, with the goal of t giving readers a better grasp of fog computing for VANETs and current trends.
Castillo et al. [10] presented a seven-layer design for the Internet of Vehicles as well as the standards that would enable all parties to communicate with one another. Additionally, they addressed wireless access and routing techniques, as well as inter-vehicle communication protocols. They also reviewed some of the security requirements for the Internet of Vehicles, as well as some of the future research problems that must be addressed.
Xiaolong et al. [24] presented a comprehensive and exhaustive survey of AI for edge service optimization in the IoV. To begin, the fundamental motivations for this study were discussed. The following section introduced relevant topics and terminologies. Thirdly, an overview of critical concepts and methodologies was included.
Chunhua et al. [25] proposed a method for predicting real-time traffic statistics using a digital twin by analyzing traffic flow and velocity data collected by IoV sensors and communicated via 5G. Finally, a series of tests using a traffic dataset compiled by the Chinese city of Nanjing was run. The presented findings demonstrate the practicality of their idea in intelligent traffic flow and velocity prediction applications that require rapid reactions and high accuracy.
Xu et al. [26] analyzed a multiuser offloading system in which the quality of service was measured by the response time of services. Then, for DT-enabled IoV in edge computing, a service offloading (SOL) mechanism based on deep reinforcement learning was developed. SOL employs a deep Q-network (DQN) to generate efficient offloading decisions. DQN combines the value function approximation of deep learning and reinforcement learning. Finally, comparison trials demonstrated that SOL was effective and flexible in a variety of situations.
Huang et al. [27] presented a novel location privacy-preserving technique in a study that enabled vehicles to transmit precise real-time location information to the LBS server while avoiding detection by attackers. The suggested approach uses the location information of selected shadow cars whose routes differ from the requester to construct several virtual trajectories to send to the LBS server to deceive attackers. The results of simulations indicated that the suggested system maintained a high level of privacy and surpassed other state-of-the-art techniques in terms of location entropy and tracking success ratio.
Surbhi et al. [28] conducted an in-depth examination of IoV by analyzing its applicability in many fields and by conducting a comparison study of IoV and VANETs. According to their findings and study, it was concluded that, while the internet of vehicles has enormous promise in today’s transportation systems, various challenges must be addressed. It has applications in a variety of sectors, including safety, traffic safety, comfort, infotainment, and health care, but its applicability in further areas must be expanded.
Siddiqui et al. [29] provided an in-depth examination of state-of-the-art trust management models in the IoV that utilize a variety of computational domains. Their research focused on evaluating trust management methods in terms of the evaluation tools used, the weights applied during trust aggregation, misbehavior detection, attack resistance, and quantification of the misbehavior detection threshold set. Additionally, a brief overview of the IoV’s layered architecture, the concept of trust and its constituents, and the attacks against vehicular networks were included. Finally, the area’s open research directions are discussed.
Pokhrel [30] presented a unique networking method to the Internet of Vehicles (IoV) for their automation and orchestration by rethinking the wireless edge framework. He developed a policy-driven framework for a safe and efficient IoV networking paradigm and then conducted analytic modeling to evaluate its performance. He also developed an intent-based flow offloading technique to enable increased and customizable quality of experience.
Ousmane et al. [31] offered the creation of a complete prototype of a Software-Defined Vehicular Network. To begin, the SDN-based backbone was validated using real OpenFlow switches on real hardware. Following that, SDN-based Radio Access is evaluated using WiFi Access Points that supported the Click Modular Router and Open Switch/OpenFlow protocols. An On-Board Unit (OBU) based on a Single Board Computer was used to achieve OpenFlow switch functionality. Numerous SDN controllers were used to build routing algorithms that transport the control plane of vehicles via the backbone, to process data received from vehicles, to anticipate topology, to compute routing paths for V2V and V2I communication, and lastly to manage mobility schemes. Throughput, delay, processing time, handoff latency, and packet loss were all used to determine the communication quality.
Adnan et al. [32] summarized the present state of the art in intelligent transportation systems (ITS) and then offered a software-defined heterogeneous vehicular networking (SDHVNet) architecture for providing a highly adaptable networking infrastructure capable of on-demand network innovation. In the end, several prospective architectural issues were examined, along with their likely answers.
Forestiero [33] provided an approach based on the activity footprints for detecting anomalies in IoT with the use of a multi-agent algorithm. The method enables the linkage of specific device activities, or “digital footprints,” to real-valued vectors. The vectors were given to mobile agents that acted like each had a different bio-inspired model. This model lets an intelligent global behavior emerge from simple local movement rules that all agents can see on a virtual 2D space. Based on Pearson’s correlation, a custom similarity rule drives each agent to apply only the rules that apply to them, so that similar agents can automatically move closer together. The intelligent positioning (clustering), which was based on the vectors that had been assigned, allows one to find isolated agents, which are devices with unusual activities that need to be monitored. This is because they could be linked to intruders or malicious users. The results showed that the metaheuristic algorithm was a good idea.
After conducting an in-depth review of the literature, we have found that performance-based comparison of cloud and fog is not well reported in VANETs. Still, some unanswered questions exist. For example, how can the cloud handle the upcoming VANET requests in peak time? What will the delay be? If we apply fog computing, what will the output be? If we use 5G, then what will the impact on performance be? To address these gaps, we first compared the performance of cloud and fog computing in terms of delay and latency in VANETs, then utilized our priority-based 5G enabled proposed model in the fog.
3. Fog Computing Architecture
Fog architecture includes utilizing administrations of end devices for computational, storage and handling purposes. Fog computing or fog organizing, otherwise called fogging, is an architectural design that utilizes edge devices to perform a significant amount of calculation, storage, and correspondence locally, steered over the internet backbone. In our previous work [34], we defined fog computing as “Fog computing horizontally provides cloud computing features at the edge of user premises and distributes storage, networking, and computing hardware without compromising security, latency, and performance”.
The fog computing architecture comprises several layers, for example, virtualization and physical, observing, transport, security, transitory capacity, and handling frames an entire organization of countless interconnecting devices. For smart city improvement, it needs certain high-level innovative layers like vehicular information representation, vehicle correspondence information security, and virtualization layers. Here, we present the most popular fog computing architecture, a three-layered, three-tiered architecture, as shown in Figure 2. This is a bottom-to-top architecture consisting of the three main components of the entire fog computing system.
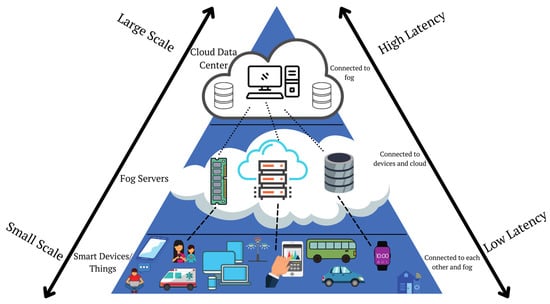
Figure 2.
Architecture of fog computing.
3.1. Layer 1
The only layer close to the user is layer 1, consisting of smart devices and things, such as smart vehicles, mobile phones, sensors, smartwatches, smart homes, etc. Layer 1 devices are connected to the fog layer through 3G, 4G, 5G, WiFi, Bluetooth, Zigbee, etc. That is why there is low latency and minimum delay while transmitting the data. In terms of area, this layer spans a small scale.
3.2. Layer 2
Fog computing resides in the middle layer of the architecture. It consists of many fog nodes, including networking abilities like routers, switches, gateways, etc., and computing power like CPUs, storage, RAM, etc. This layer is connected to the first layer as well as to the top layer, which is why it is also called the intermediate layer. Physically, this layer stays at the edge of the network. For example, fog nodes are generally installed in the buildings and in roadside infrastructure.
3.3. Layer 3
The top-most layer of fog computing architecture is the cloud layer, which consists of big data centers and powerful computers, able to handle any amount of complex data. Often, data centers are remotely located and span broad areas; this is the reason why the cloud is not recommended for time-sensitive applications. This layer is connected to the middle layer only in fog architecture.
Aazam et al. [35] extend the current three-layered architecture. They present six layers of fog computing architecture. The first layer is called the “Physical and Virtualization Layer”, in this layer, the word physical represents things like physical sensors and wireless sensor networks. The word virtualization appears for virtual sensors and virtual sensor networks. The monitoring layer keeps an eye on all types of activities happening in physical devices, including energy consumption. Data management can be performed in the third layer, called the processing layer. The fourth layer temporarily stores the data in the fog storage for a certain time, then removes it when the data is uploaded to the cloud. The security layer controls security-related issues. The top-most layer uploads the fog data to the cloud.
4. Proposed Model
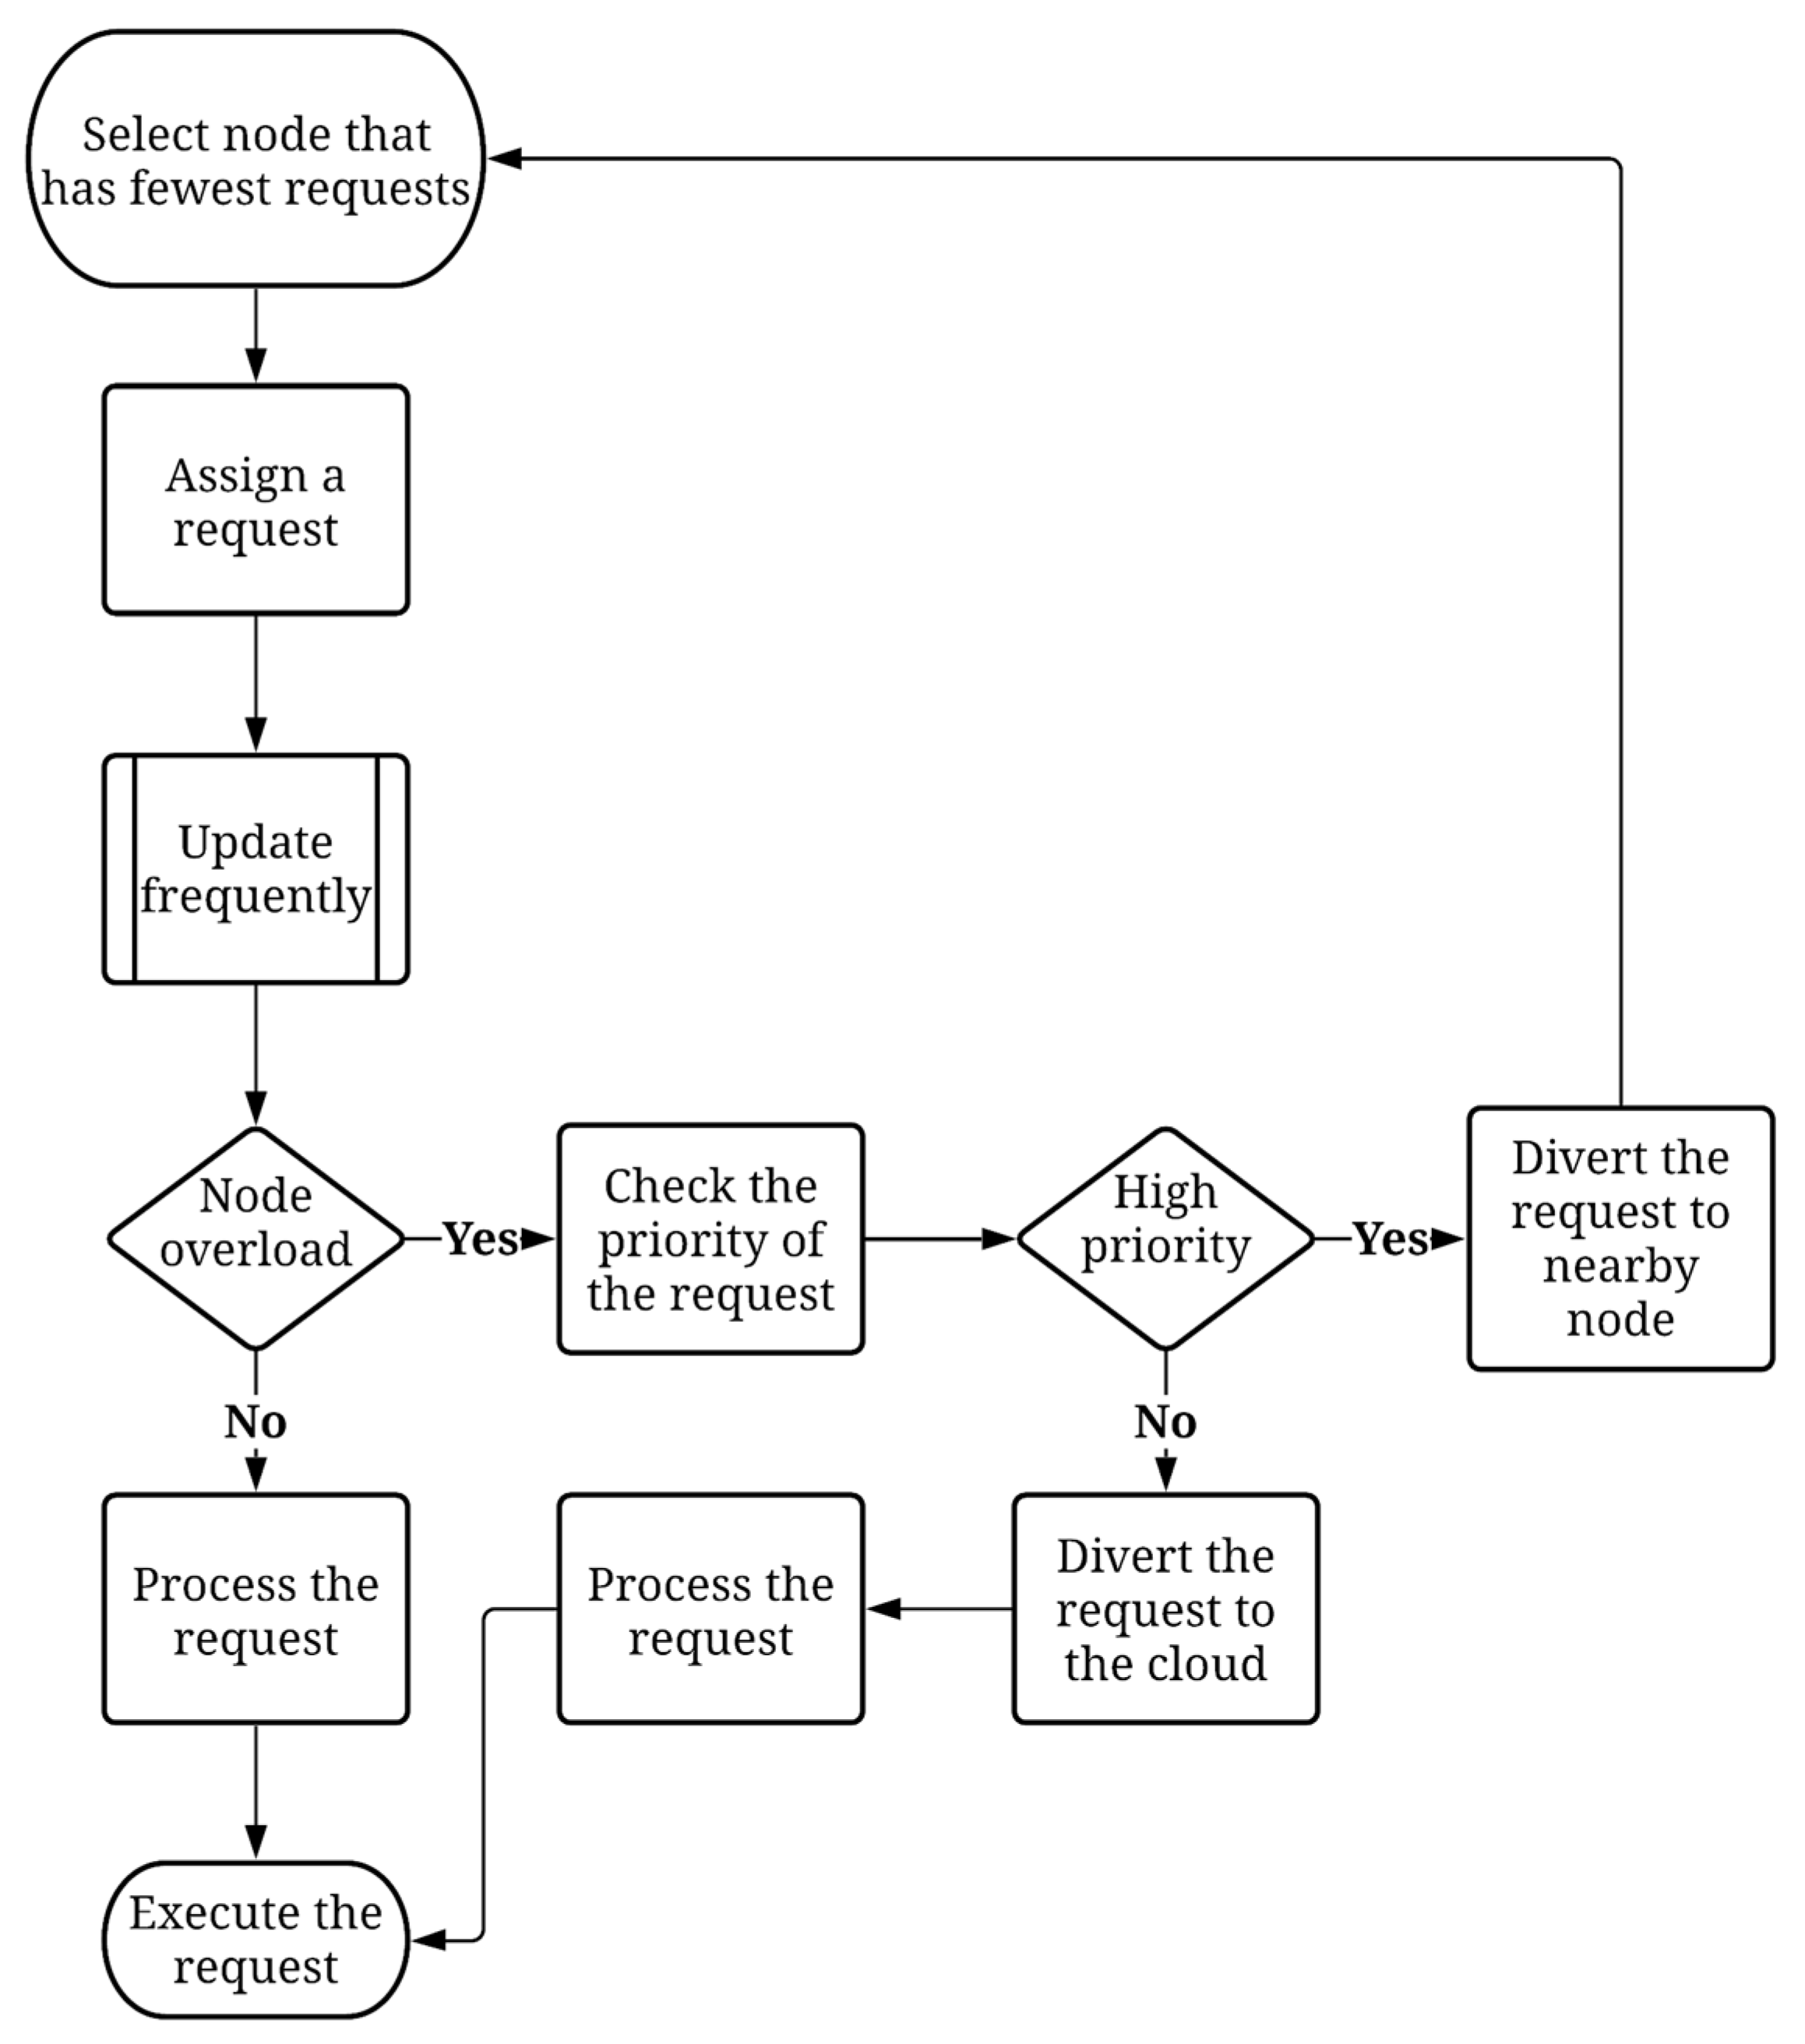
In this section, we describe our proposed model. There are several fog nodes installed in a smart city, all are connected, and a VANET enabled the vehicles. We will choose a node with minimum load or burden of the requests or tasks, then send the request to that node. Now, we will update the selected node frequently to check the current burden of the node. If the node’s burden remains the same, we will process the request and execute it successfully. If we receive the node overload status, we will check the priority of the request trying to enter the node. If the priority is high, we will assign a nearby node with minimum load to that request and process it through that new node. If the priority is low, we will send the request directly to the cloud, process it inside the data center, and then execute it.
Delay and Latency Model
For mathematical analysis, the delay and the latency of data transfer were calculated by implementing several equations. In this process, the delay mainly occurred due to the burden of the requests put on the node, instead of its capacity.
We chose node N, which has the least burden of requests, to assign a request. The burden produces the time taken report after the execution of the request, which can be calculated through Equation (1).
where is the burden of node c at the starting time and is updated frequently, and is the overall time to process the request on the processing node c, mathematically analyzed according to Equation (2).
where is the time taken for the execution of the request’s data transfer of on selected node c and is the transmission time for transferring the request data needed by a request to the chosen node N. In our case, the chosen node is c. In the balanced step, due to the location of the request.
The execution time of processing a request in the selected node N is calculated according to Equation (3).
The request execution time depends on the complexity of the request’s data. This means that the more complex the data, the longer the execution time. The complexity of the request data transfer is collected from the “Data Collector Module” (DCM), and the processing capacity of the chosen node N is collected from the “Resource Collector Module” (RCM). The processing capacity is addressed as MIPS.
To maintain the node burden, we iteratively changed the request location in different fog nodes and cloud data centers. We sent the request to a nearby fog node if the priority of the request was high, otherwise, it is sent to the cloud.
AvgDelay is the time that surpassed the peak reply time for every one of the requests and is determined as in Equation (4).
where (Rm) is a lost request due to the exceedance of replay time.
A direction failure of the request occurs when the distance between two communicating devices is greater than expected. We are able to establish the connection by using the following equation:
where represents the distance between the two communicating devices, such as a vehicle and a fog node, represent the distance from the node receiving the requests, and represent the distance from host node to the request sending vehicle.
The above equation gives the request data communication latency between volunteer vehicles “j”, where the request is the data input size assigned to the vehicle.
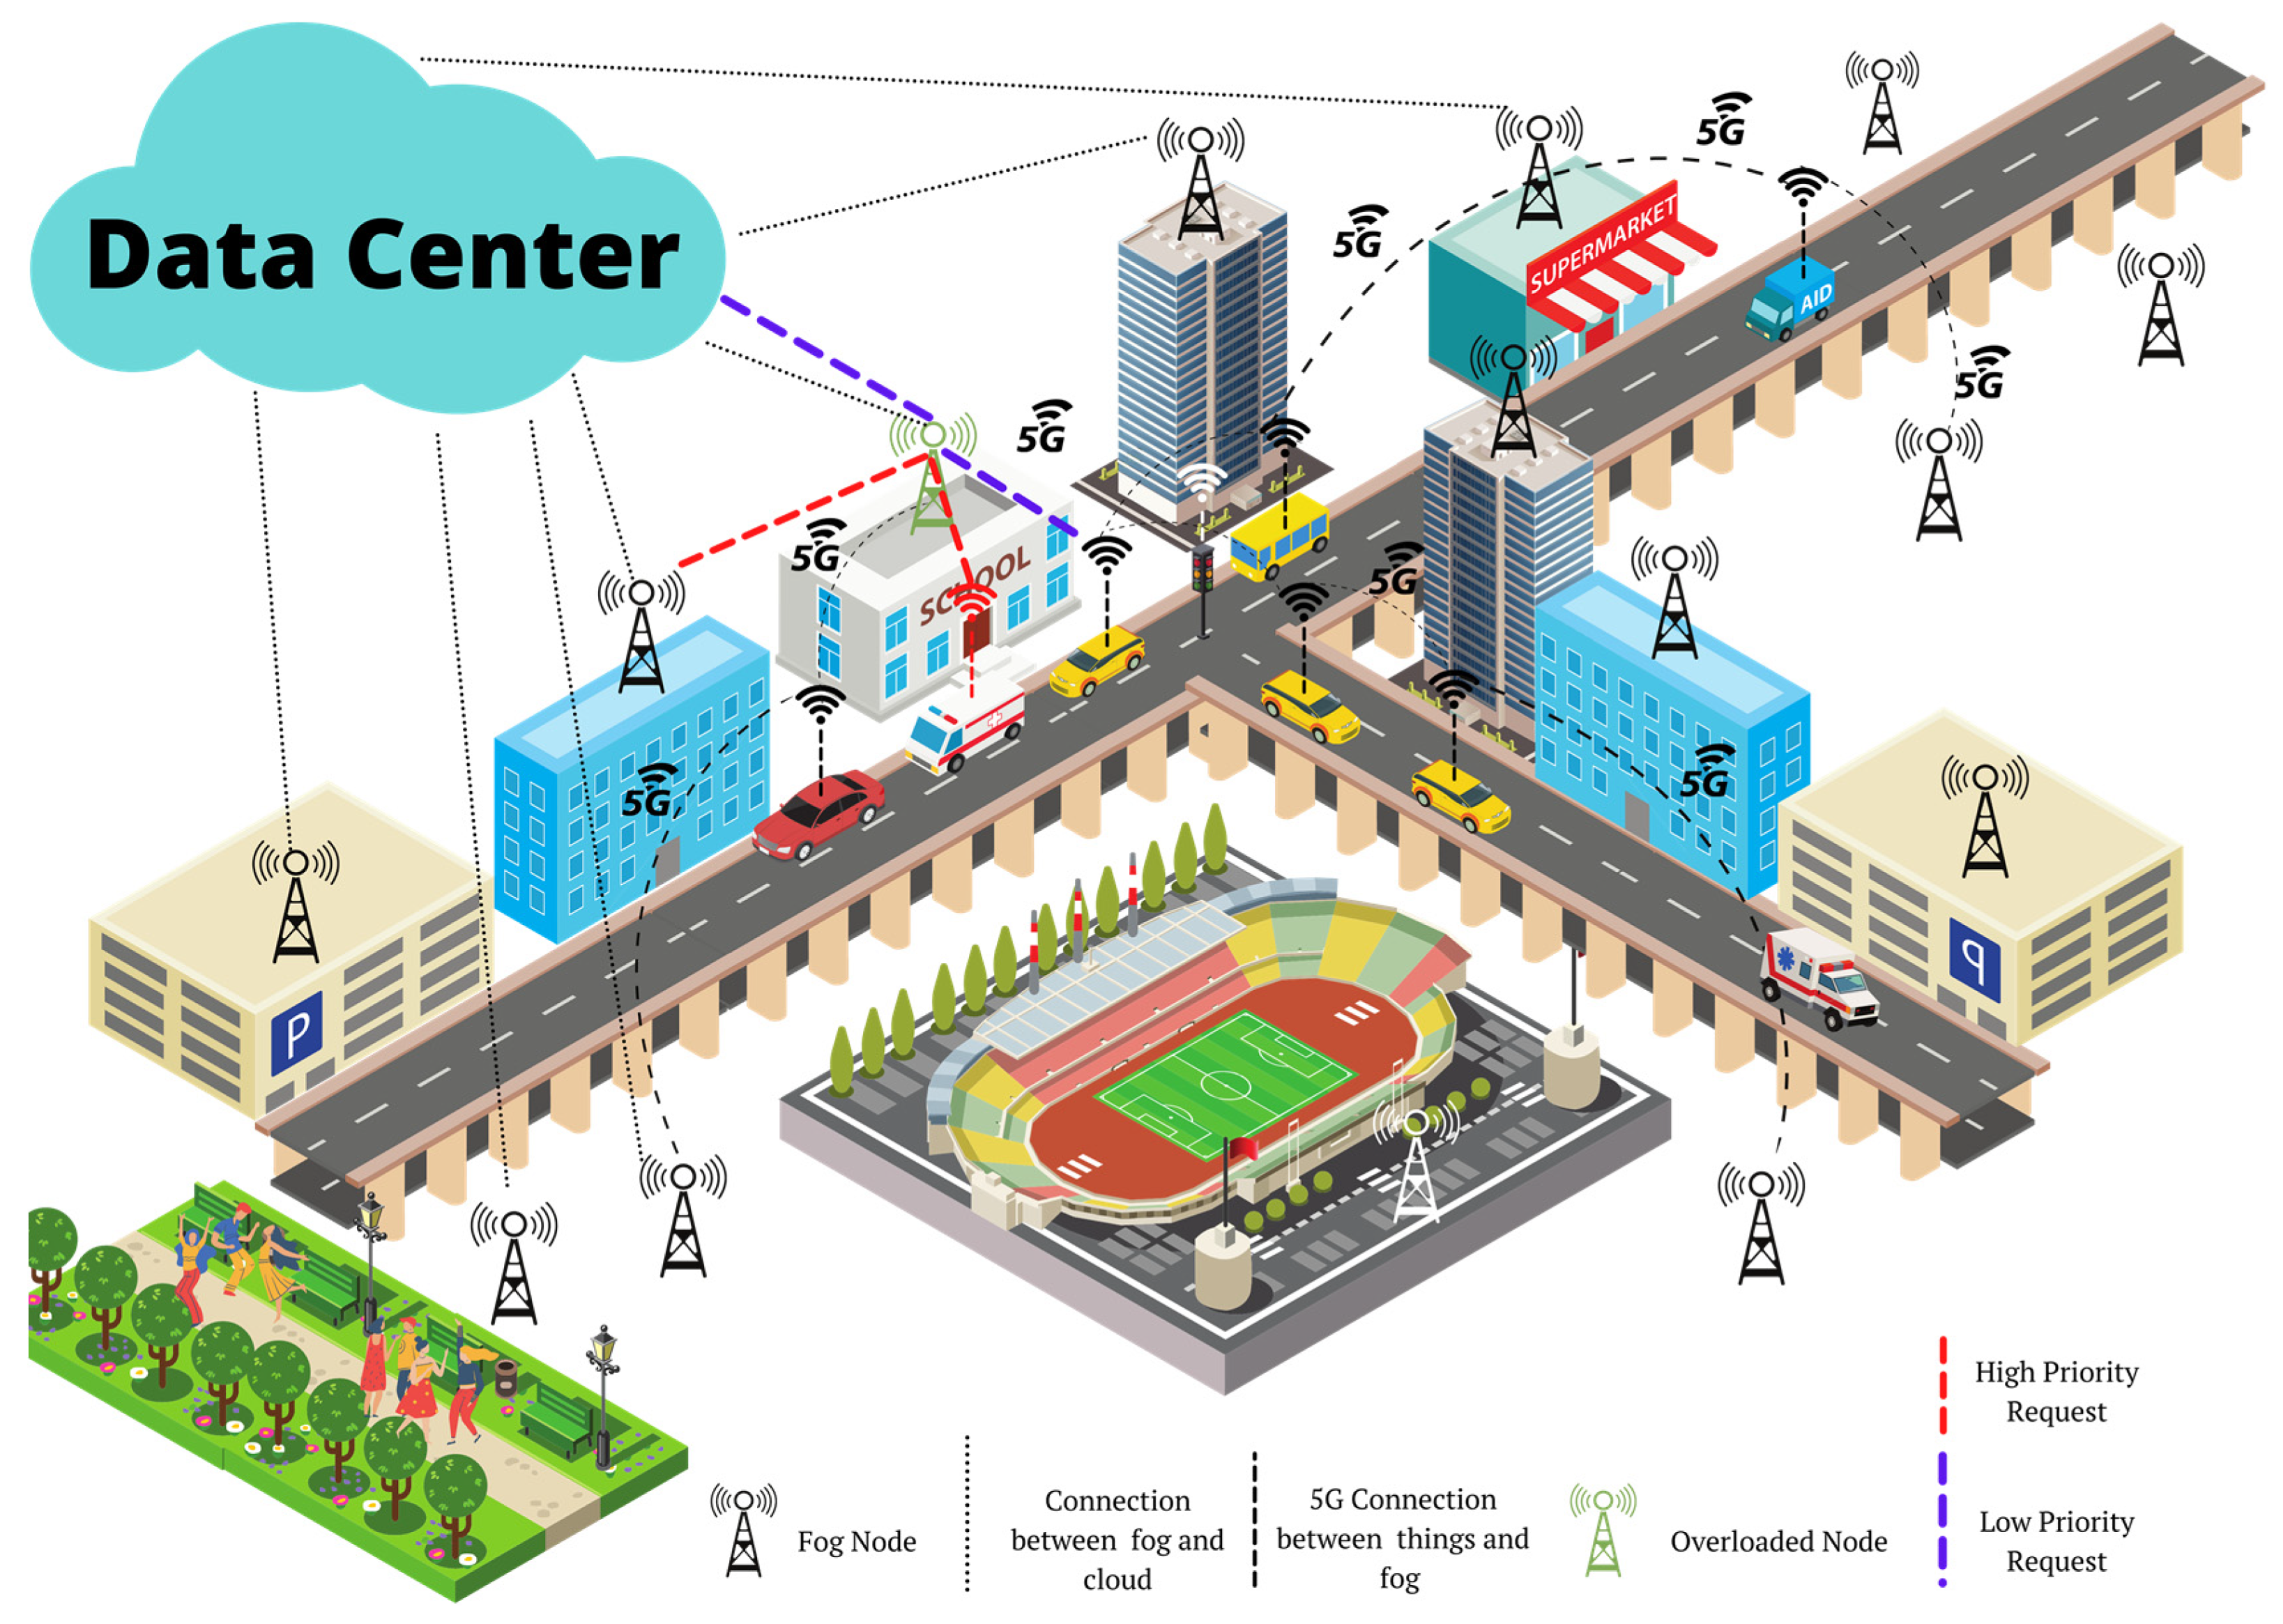
Figure 3 presents a graphical view of our model. Here we installed fog servers in each location, including the playground and public parks. Also, we installed VANETs in all the vehicles to enable communication. The dashed lines show vehicle-to-vehicle and infrastructure communication through the 5G SDN, and the dotted lines represent the connection between the fog and the cloud data center. Here we create a scenario at the school building where a fog node is overloaded. We diverted the high priority request (represented in red dashed line) to a nearby node and sent the low priority request (described in blue dashed line) to the cloud for further processing. By applying this technique, we reduced the latency and delay by 20% and 35%, respectively, which resulted in seamless communication between devices. We used a 5G cellular network for data transmission to meet future requirements for high-speed data transfer.

Figure 3.
Graphical representation of proposed model.
Algorithm 1 presents the request transmission method. Here, node N is the node that has been selected for the first time; we set the capacity of a node as 5 high priority requests at a time, more than that will lead it to be considered an overloaded node, (1) = high priority, and (0) = low priority. Figure 4 presents the workflow of our algorithm.
| Algorithm 1 Request transmission pseudo-code | |
| 1: | initialize_nearest_node N |
| 2: | while node N ≠ NULL & ≥ 0 and ≤5 |
| 3: | assign_request do |
| 4: | for update_node N |
| 5: | if node → overload then |
| 6: | if request_priority = (1) then |
| 7: | divert_to_nearest_node ≥ 0 and ≤5 |
| 8: | end |
| 9: | else |
| 10: | if request_priority = (0) then |
| 11: | send_request → cloud |
| 12: | end |
| 13: | else |
| 14: | execute_request |
| 15: | end |
| 16: | end |

Figure 4.
General flow of the request transmission process within the network.
5. Model Evaluation
Finally, the results obtained from the experimentation are presented in this section. At the time of simulation, we created three different scenarios for the fog and cloud servers. In the first scenario for fog, we applied a high load to the fog nodes to test the communication delay. In this scenario, we sent 50 high-priority requests to the fog nodes and processed them. Here, we set node burden to 80% to test the performance of the fog at high load. Table 1 describes the first fog scenario.

Table 1.
Fog scenario 1.
In the second scenario for the fog, we applied a medium load to the fog nodes to test the communication delay. In this scenario, we sent 35 high priority requests and 15 low priority requests to the fog nodes and processed them. We also diverted 5 low priority requests to the cloud. Here, we set the node burden to 60% to test the performance of fog at medium load. Table 2 describes the second fog scenario.
Table 2.
Fog scenario 2.
In the third scenario for the fog, we applied a minimum load on the fog nodes to test the communication delay. In this scenario, we sent 25 high priority requests and 25 low priority requests to the fog nodes and processed them. We also diverted 5 low priority requests to the cloud. Here, we set node burden to 30% to test the performance of fog at a minimum load. Table 3 describes the third fog scenario.
Table 3.
Fog scenario 3.
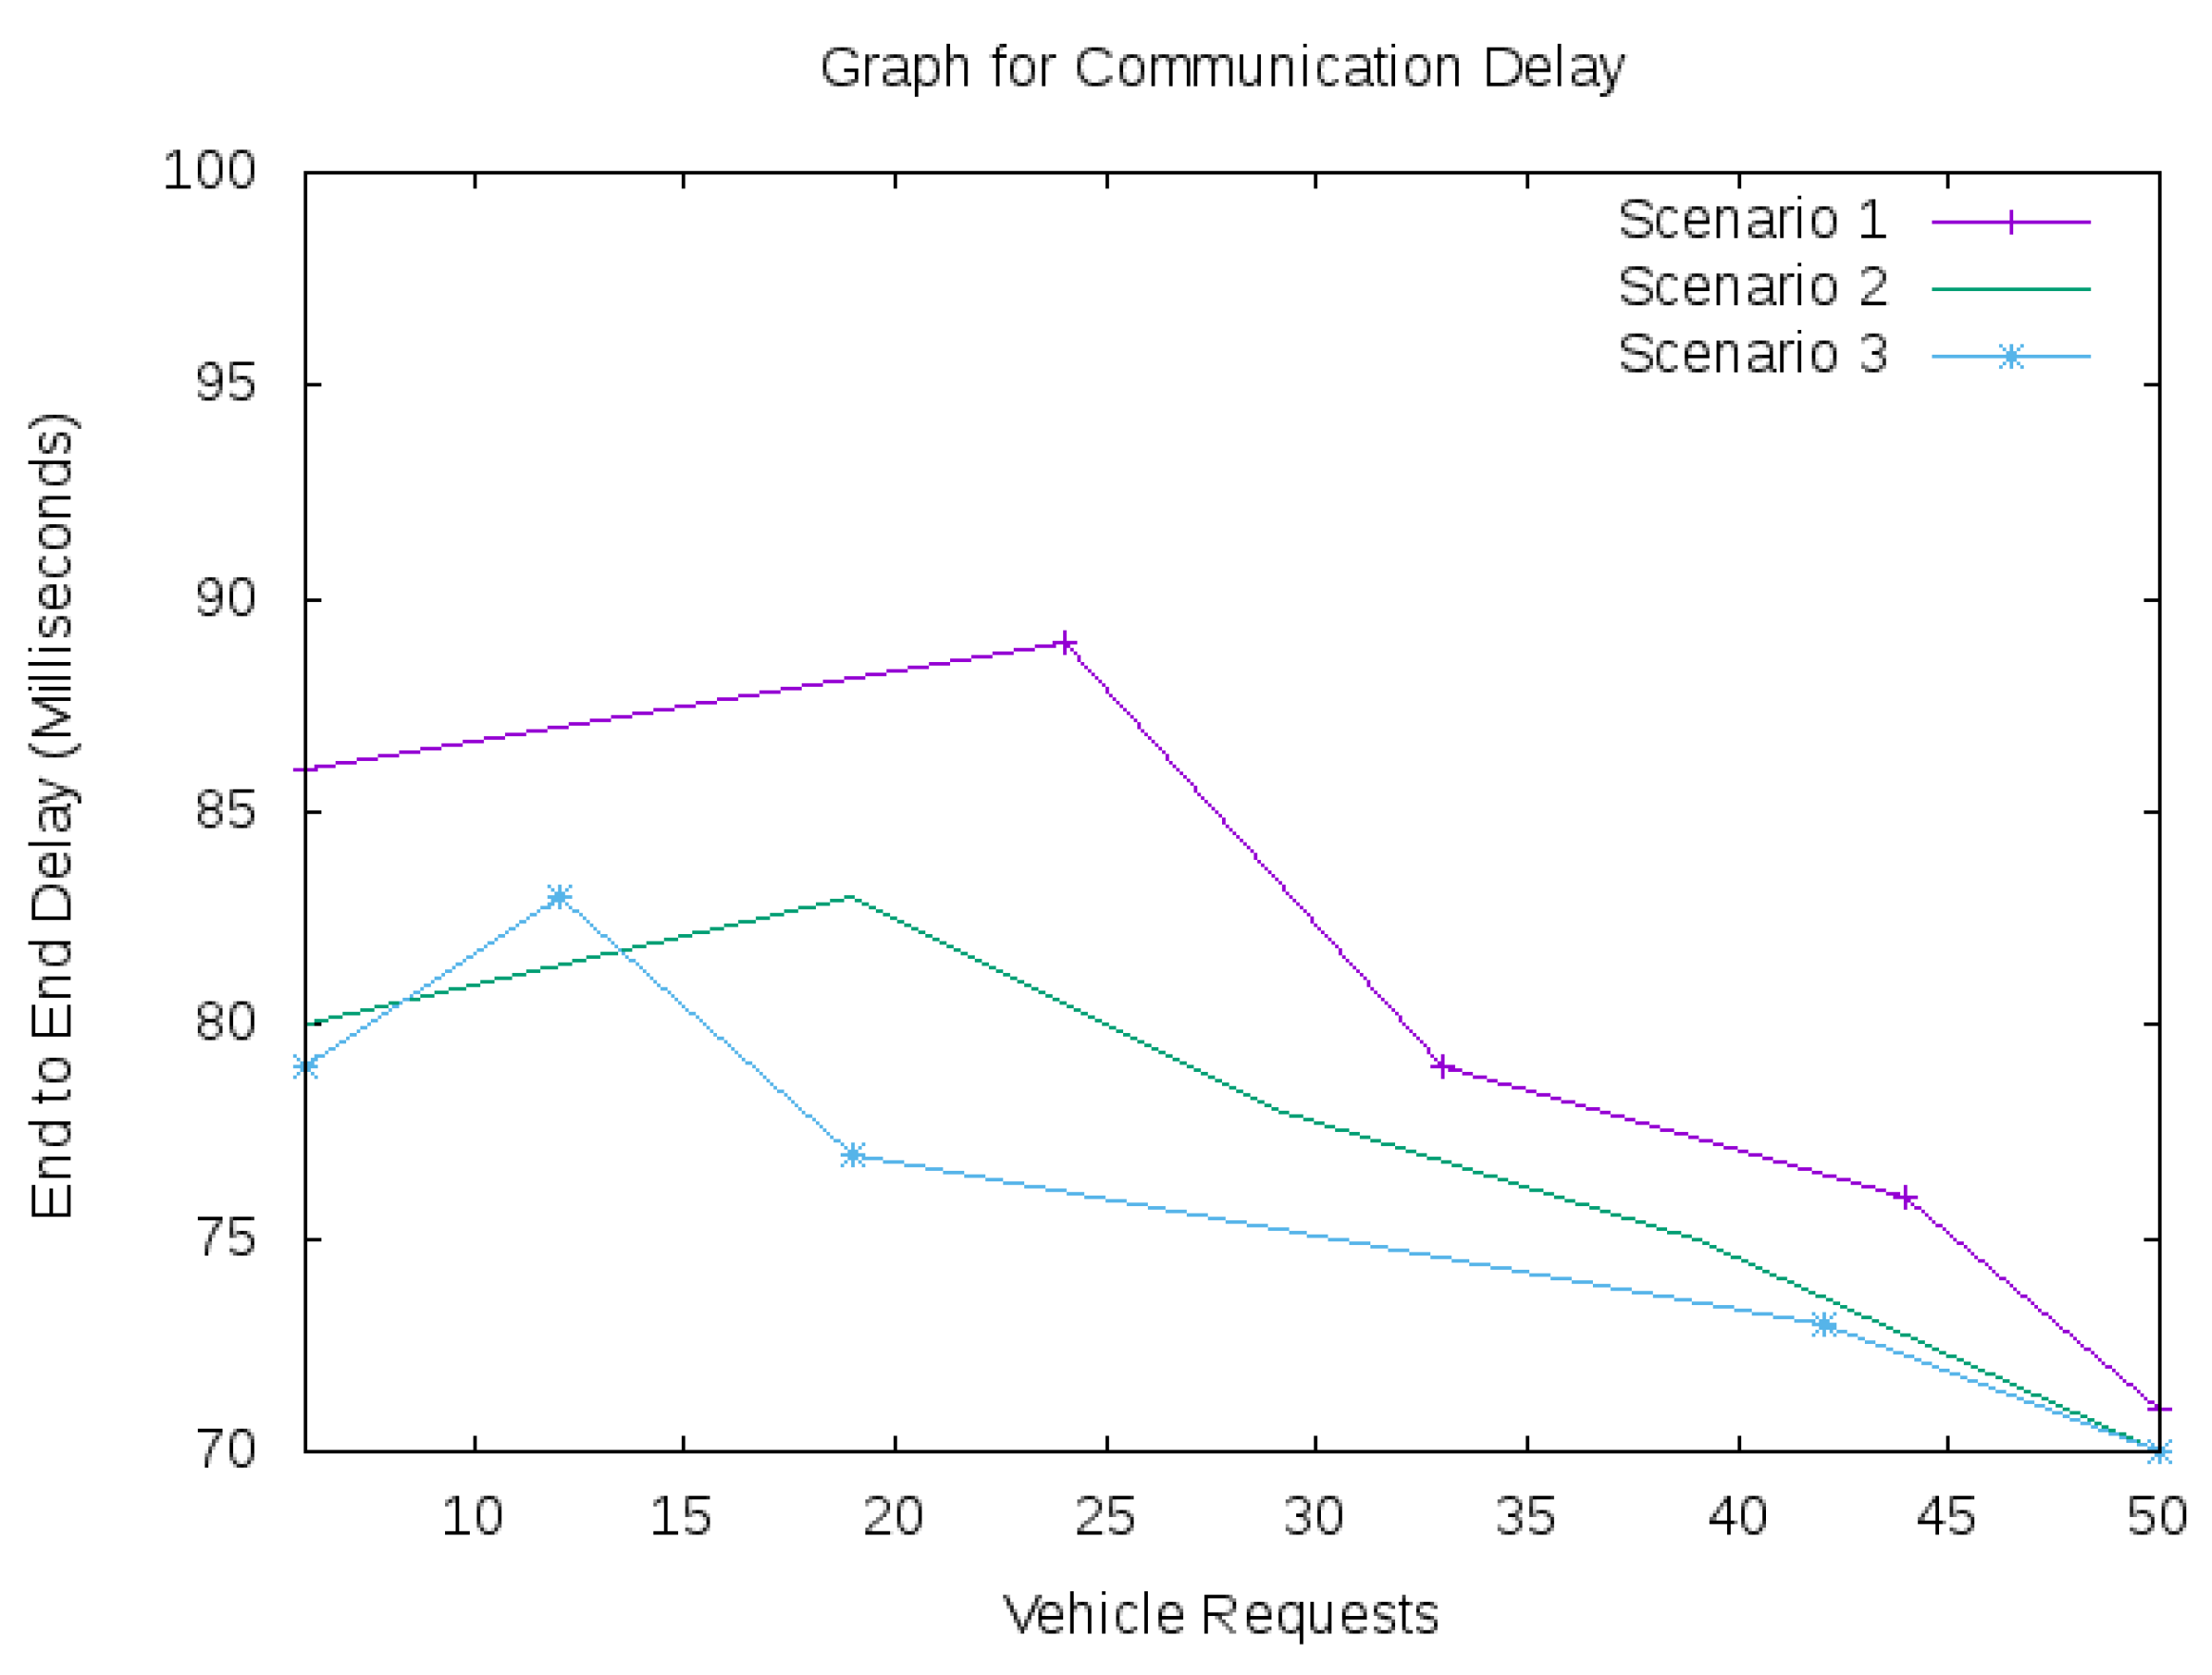
The graphical representation of Figure 5 displays the communication delays in all three scenarios. Scenario 1 represents high load, delayed by 86 milliseconds; scenario 2 was delayed by 80 milliseconds, and scenario 3, the minimum load, was delayed by 79 milliseconds.
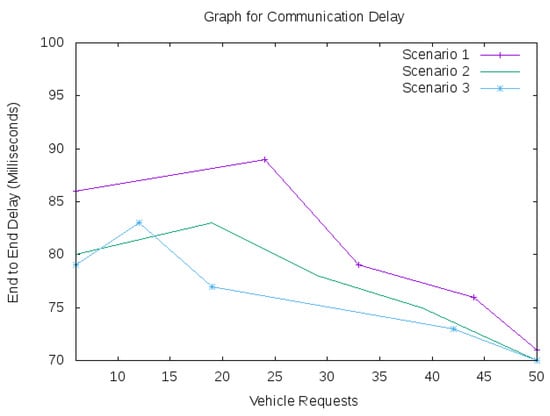
Figure 5.
Graph for communication delay.
To compare this result with the cloud, we created the same scenarios for the cloud, as described in Table 4, Table 5 and Table 6.
Table 4.
Cloud scenario 1.
Table 5.
Cloud scenario 2.
Table 6.
Cloud scenario 3.
In the first scenario for the cloud, we applied a minimum load on the cloud server. In this scenario, we sent 25 high priority requests and 25 low priority requests to the cloud and executed them.
In the second scenario for the cloud, we applied a medium load on the cloud server. In this scenario, we sent 35 high-priority requests and 15 low-priority requests to the cloud and executed them.
In the third scenario for the cloud, we applied a high load on the cloud server. In this scenario, we sent 50 high-priority requests to the cloud and executed them.
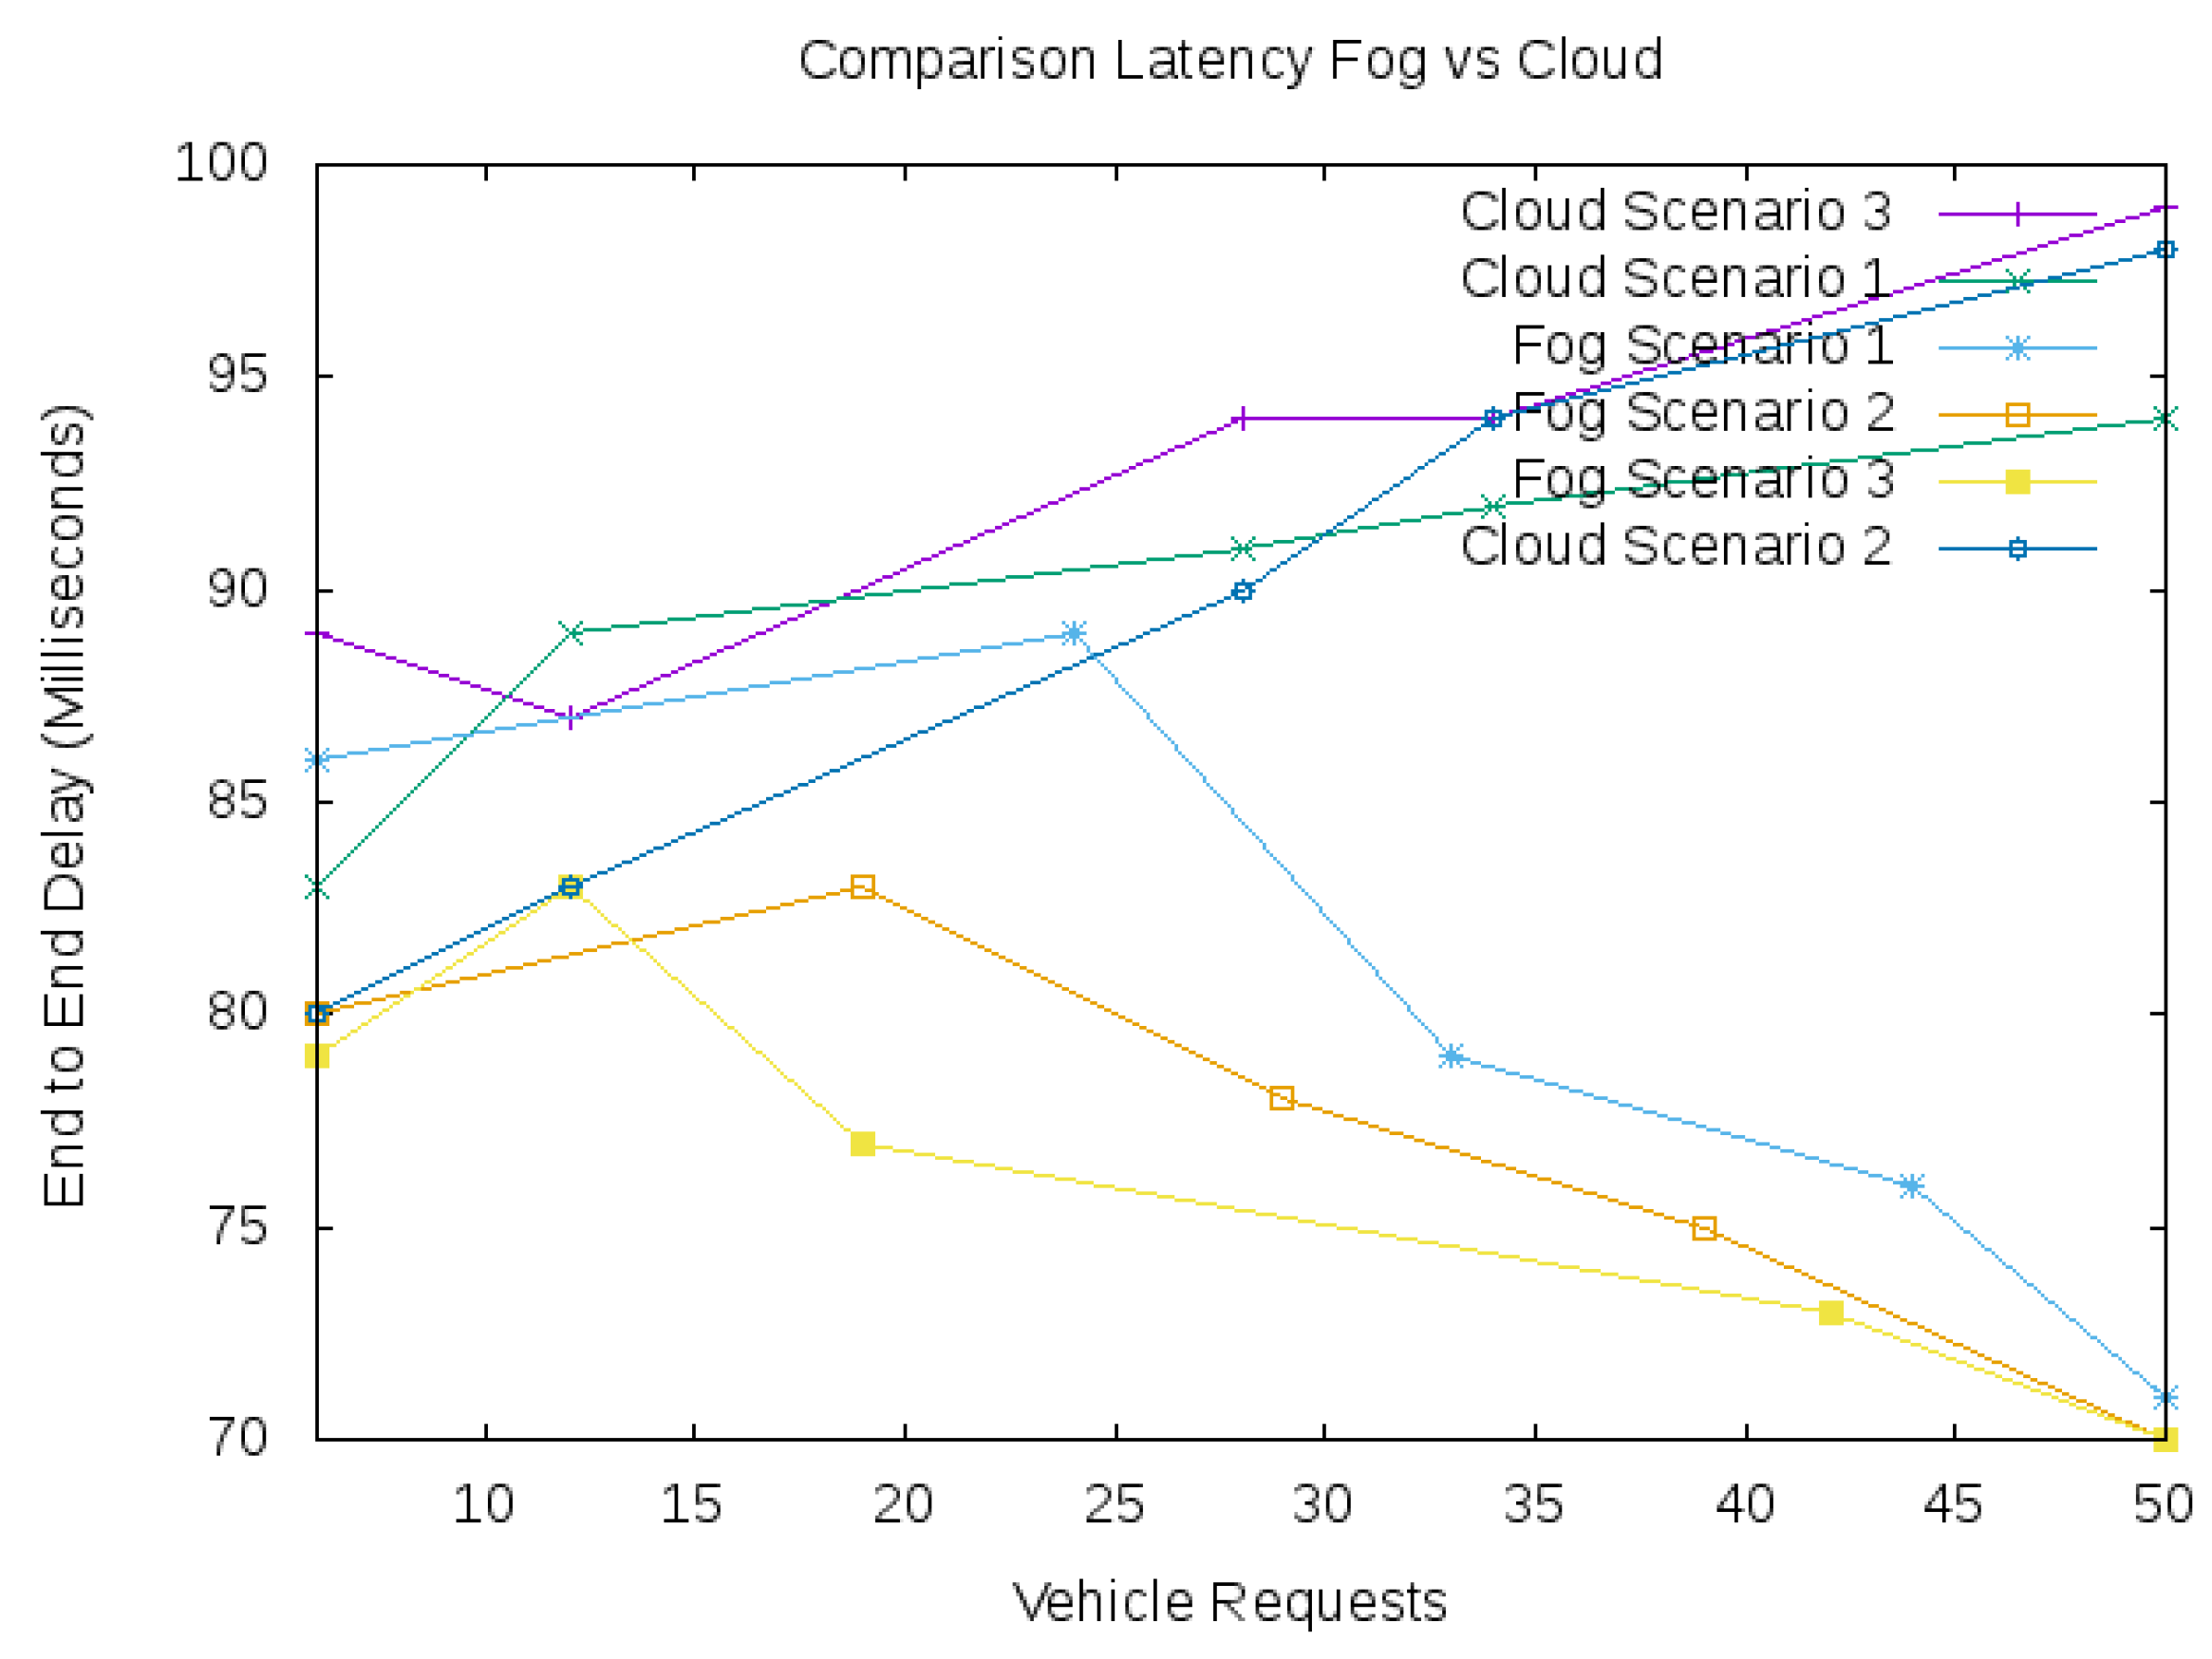
The graphical representation of Figure 6 symbolizes the vast difference in latency between the fog and the cloud. Here, scenario 1 for the cloud represents the minimum load, which was delayed by 83 milliseconds, and goes higher in the second, third, and fourth attempt; scenario 2 was delayed by 80 milliseconds and scenario 3, which represents the maximum load, was delayed by 89 milliseconds. Thus, finally, we identified that the cloud’s delay and latency were higher than the latency observed in fog computing. Thus, it is better to employ fog nodes and servers for the vehicular computing process.
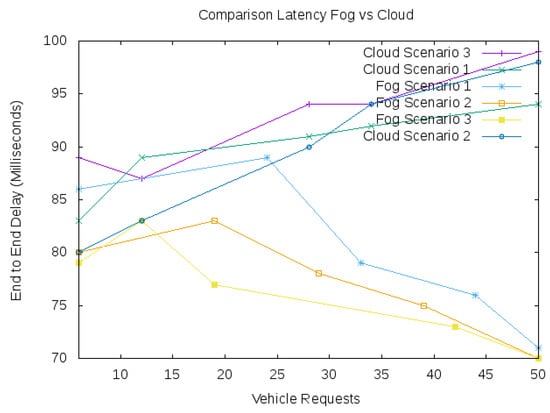
Figure 6.
Comparison of latency: fog vs. cloud.
6. Conclusions
Developing a smart city is our primary objective, and fog computing is a critical component of a smart city. We investigated several fog computing issues and found that latency and delay are difficult challenges. We picked VANETs to deploy fog computing because VANET applications are time-sensitive. Our proposed model decreased a significant amount of the latency and delay, and enhanced the communication efficiency between vehicles, as shown in the results.
This experimental work investigated several effective measures to reduce the delays and latency of the vehicular data transmission carried out with the fog computing model. Data transfer between vehicles with the same network-based connectivity was helpful for to perform data computation and transfer at faster rates by computing them at the nearest fog nodes. The inclusion of 5G-based MEC servers helped us to switch over the user’s network connectivity with closer servers, and it reduced the queuing process by transferring data and requests to the available servers.
We proposed a fog computing model that enhances communication efficiency and decreases data latency by 20% compared to the cloud computing architecture, and decreases the processing delay by 35% compared with the utilization of cloud computing architecture. Experimentally, we demonstrated the effectiveness of this model based on the delay and latency that occurred during vehicular data transmission, and it was performed even in a low networking environment. The effects of the high processing time were also evaluated analytically and agreed with several mathematical analyses.
In future research, we are planning to extend our work in terms of scalability by gradually increasing the number of requests sent by the VANET-enabled vehicles to evaluate the performance of the model under increased load. we will also be upgrading towards IoV, as IoV has emerged as the successor of VANETs and removes the VANETs’ limitations. Moreover, research work on IoV’s energy consumption, communication costs, and the installation of fiber optics between fog premises is included in our plan.
Author Contributions
Conceptualization, A.M.F., M.A.A. and S.I.H.; methodology, A.M.F.; software, A.M.F.; validation, A.M.F.; formal analysis, A.M.F.; investigation, A.M.F.; writing—original draft preparation, A.M.F.; writing—review and editing, A.M.F. and S.M.I.; supervision, M.A.A. and S.I.H. All authors have read and agreed to the published version of the manuscript.
Funding
This research received no external funding.
Institutional Review Board Statement
Not applicable.
Informed Consent Statement
Not applicable.
Data Availability Statement
Not applicable.
Conflicts of Interest
The authors declare no conflict of interest.
References
- Arroub, A.; Zahi, B.; Sabir, E.; Sadik, M. A literature review on Smart Cities: Paradigms, opportunities and open problems. In Proceedings of the 2016 International Conference on Wireless Networks and Mobile Communications (WINCOM), Fez, Morocco, 26–29 October 2016; pp. 180–186. [Google Scholar] [CrossRef]
- United Nations Department of Economic and Social Affairs Population Division (UNDESA). World Urbanization Prospects: The 2018 Revision. World Urban Prospect 2018, 2. Available online: https://www.un.org/development/desa/publications/2018-revision-of-world-urbanization-prospects.html (accessed on 30 October 2021).
- Hollands, R.G. Will the real smart city please stand up? City 2008, 12, 303–320. [Google Scholar] [CrossRef]
- Mohanty, S.P.; Choppali, U.; Kougianos, E. Everything you wanted to know about smart cities: The Internet of things is the backbone. IEEE Consum. Electron. Mag. 2016, 5, 60–70. [Google Scholar] [CrossRef]
- Idrees, S.M.; Agarwal, P.; Alam, M.A. (Eds.) Blockchain for Healthcare Systems: Challenges, Privacy, and Securing of Data; CRC Press: Boca Raton, FL, USA, 2021. [Google Scholar]
- European Commission Europe. A European Strategy for Smart, Sustainable and Inclusive Growth; European Commission: Brussels, Belgium, 2020. [Google Scholar]
- State of the IoT 2018: Number of IoT Devices Now at 7B—Market Accelerating. Available online: https://iot-analytics.com/state-of-the-iot-update-q1-q2-2018-number-of-iot-devices-now-7b/ (accessed on 30 October 2021).
- Vermesan, O.; Friess, P.; Guillemin, P.; Giaffreda, R.; Grindvoll, H.; Eisenhauer, M.; Serrano, M.; Moessner, K.; Spirito, M.; Blystad, L.C.; et al. Internet of Things beyond the Hype: Research, innovation and deployment. Build. Hyperconnected Soc. Internet Things Res. Innov. Value Chain. Ecosyst. Mark. 2015, 22, 15–118. [Google Scholar]
- Xia, Z.; Wu, J.; Wu, L.; Chen, Y.; Yang, J.; Yu, P.S. A Comprehensive Survey of the Key Technologies and Challenges Surrounding Vehicular Ad Hoc Networks. ACM Trans. Intell. Syst. Technol. 2021, 12, 37. [Google Scholar] [CrossRef]
- Contreras-Castillo, J.; Zeadally, S.; Guerrero-Ibanez, J.A. Internet of Vehicles: Architecture, Protocols, and Security. IEEE Internet Things J. 2018, 5, 3701–3709. [Google Scholar] [CrossRef]
- Giang, N.K.; Leung, V.C.M.; Lea, R. On Developing Smart Transportation Applications in Fog Computing Paradigm. In Proceedings of the 6th ACM Symposium on Development and Analysis of Intelligent Vehicular Networks and Applications, Valletta, Malta, 13–17 November 2016; Association for Computing Machinery: New York, NY, USA, 2016; pp. 91–98. [Google Scholar] [CrossRef]
- Road Traffic Injuries, Key Facts. Available online: https://www.who.int/news-room/fact-sheets/detail/road-traffic-injuries (accessed on 12 February 2022).
- Afrin, T.; Yodo, N. A survey of road traffic congestion measures towards a sustainable and resilient transportation system. Sustainability 2020, 12, 4660. [Google Scholar] [CrossRef]
- Jan, S.A.; Amin, N.U.; Othman, M.; Ali, M.; Umar, A.I.; Basir, A. A Survey on Privacy-Preserving Authentication Schemes in VANETs: Attacks, Challenges and Open Issues. IEEE Access 2021, 9, 153701–153726. [Google Scholar] [CrossRef]
- Shrestha, R.; Bajracharya, R.; Nam, S.Y. Challenges of Future VANET and Cloud-Based Approaches. Wirel. Commun. Mob. Comput. 2018, 2018, 5603518. [Google Scholar] [CrossRef]
- Sánchez-Corcuera, R.; Nuñez-Marcos, A.; Sesma-Solance, J.; Bilbao-Jayo, A.; Mulero, R.; Zulaika, U.; Azkune, G.; Almeida, A. Smart cities survey: Technologies, application domains and challenges for the cities of the future. Int. J. Distrib. Sens. Netw. 2019, 15, 1550147719853984. [Google Scholar] [CrossRef] [Green Version]
- Goudarzi, M.; Zamani, M.; Haghighat, A.T. A fast hybrid multi-site computation offloading for mobile cloud computing. J. Netw. Comput. Appl. 2017, 80, 219–231. [Google Scholar] [CrossRef]
- Xiao, Y.; Zhu, C. Vehicular fog computing: Vision and challenges. In Proceedings of the 2017 IEEE International Conference on Pervasive Computing and Communications Workshops (PerCom Workshops), Kona, HI, USA, 13–17 March 2017; pp. 6–9. [Google Scholar] [CrossRef]
- Chiang, M.-L.; Lin, Y.; Hsieh, H.-C.; Tsai, W.-C. Improving Latency and Reliability for Vehicle System Under Fog Computing Networks. In Proceedings of the Recent Advances in Intelligent Information Hiding and Multimedia Signal Processing; Pan, J.-S., Ito, A., Tsai, P.-W., Jain, L.C., Eds.; Springer International Publishing: Cham, Switzerland, 2019; pp. 225–232. [Google Scholar]
- Palattella, M.R.; Soua, R.; Khelil, A.; Engel, T. Fog Computing as the Key for Seamless Connectivity Handover in Future Vehicular Networks. In Proceedings of the 34th ACM/SIGAPP Symposium on Applied Computing, Limassol, Cyprus, 8–12 April 2019; Association for Computing Machinery: New York, NY, USA, 2019; pp. 1996–2000. [Google Scholar] [CrossRef]
- Lourenço, M.; Gomides, T.S.; de Souza, F.S.H.; Meneguette, R.I.; Guidoni, D.L. A Traffic Management Service Based on V2I Communication for Vehicular Ad-Hoc Networks. In Proceedings of the 10th Latin America Networking Conference, São Paulo, Brazil, 3–4 October 2018; Association for Computing Machinery: New York, NY, USA, 2018; pp. 25–31. [Google Scholar] [CrossRef]
- Hameed, A.R.; Ul Islam, S.; Ahmad, I.; Munir, K. Energy- and performance-aware load-balancing in vehicular fog computing. Sustain. Comput. Inform. Syst. 2021, 30, 100454. [Google Scholar] [CrossRef]
- Kai, K.; Cong, W.; Tao, L. Fog computing for vehicular Ad-hoc networks: Paradigms, scenarios, and issues. J. China Univ. Posts Telecommun. 2016, 23, 56–96. [Google Scholar] [CrossRef]
- Xu, X.; Li, H.; Xu, W.; Liu, Z.; Yao, L.; Dai, F. Artificial intelligence for edge service optimization in Internet of Vehicles: A survey. Tsinghua Sci. Technol. 2022, 27, 270–287. [Google Scholar] [CrossRef]
- Hu, C.; Fan, W.; Zeng, E.; Hang, Z.; Wang, F.; Qi, L.; Bhuiyan, M.Z.A. Digital Twin-Assisted Real-Time Traffic Data Prediction Method for 5G-Enabled Internet of Vehicles. IEEE Trans. Ind. Inform. 2022, 18, 2811–2819. [Google Scholar] [CrossRef]
- Xu, X.; Shen, B.; Ding, S.; Srivastava, G.; Bilal, M.; Khosravi, M.R.; Menon, V.G.; Jan, M.A.; Maoli, W. Service Offloading with Deep Q-Network for Digital Twinning Empowered Internet of Vehicles in Edge Computing. IEEE Trans. Ind. Inform. 2020, 18, 1414–1423. [Google Scholar] [CrossRef]
- Huang, J.; Qian, Y.; Hu, R.Q. A Privacy-Preserving Scheme for Location-Based Services in the Internet of Vehicles. J. Commun. Inf. Netw. 2021, 6, 385–395. [Google Scholar] [CrossRef]
- Sharma, S.; Kaushik, B. A survey on internet of vehicles: Applications, security issues & solutions. Veh. Commun. 2019, 20, 100182. [Google Scholar] [CrossRef]
- Siddiqui, S.A.; Mahmood, A.; Sheng, Q.Z.; Suzuki, H.; Ni, W. A survey of trust management in the internet of vehicles. Electronics 2021, 10, 2223. [Google Scholar] [CrossRef]
- Pokhrel, S.R. Software Defined Internet of Vehicles for Automation and Orchestration. IEEE Trans. Intell. Transp. Syst. 2021, 22, 3890–3899. [Google Scholar] [CrossRef]
- Sadio, O.; Ngom, I.; Lishou, C. Design and Prototyping of a Software Defined Vehicular Networking. IEEE Trans. Veh. Technol. 2020, 69, 842–850. [Google Scholar] [CrossRef]
- Mahmood, A.; Zhang, W.E.; Sheng, Q.Z. Software-defined heterogeneous vehicular networking: The architectural design and open challenges. Future Internet 2019, 11, 70. [Google Scholar] [CrossRef] [Green Version]
- Forestiero, A. Metaheuristic algorithm for anomaly detection in Internet of Things leveraging on a neural-driven multiagent system. Knowl. Based Syst. 2021, 228, 107241. [Google Scholar] [CrossRef]
- Farooqi, A.M.; Hassan, S.I.; Alam, M.A. Sustainability and Fog Computing: Applications, Advantages and Challenges. In Proceedings of the 2019 3rd International Conference on Computing and Communications Technologies (ICCCT), Chennai, India, 21–22 February 2019; pp. 18–23. [Google Scholar] [CrossRef]
- Aazam, M.; Huh, E. Fog Computing: The Cloud-IoT\/IoE Middleware Paradigm. IEEE Potentials 2016, 35, 40–44. [Google Scholar] [CrossRef]

Publisher’s Note: MDPI stays neutral with regard to jurisdictional claims in published maps and institutional affiliations. |
© 2022 by the authors. Licensee MDPI, Basel, Switzerland. This article is an open access article distributed under the terms and conditions of the Creative Commons Attribution (CC BY) license (https://creativecommons.org/licenses/by/4.0/).