Article

Development of a System Dynamics Simulation for Assessing Manufacturing Systems Based on the Digital Twin Concept

by
Javier Gejo-García
1,
Jan Reschke
2,
Sergio Gallego-García
1,* and
Manuel García-García
3
1
Industrial Engineering Technologies of the International School of Doctorate, National Distance Education University (UNED), 28040 Madrid, Spain
2
Process & Quality Management, SMS Group GmbH, 41069 Monchengladbach, Germany
3
Department of Construction and Fabrication Engineering, National Distance Education University (UNED), 28040 Madrid, Spain
*
Author to whom correspondence should be addressed.
Appl. Sci. 2022, 12(4), 2095; https://doi.org/10.3390/app12042095
Submission received: 7 December 2021 / Revised: 2 February 2022 / Accepted: 8 February 2022 / Published: 17 February 2022

Abstract

:

Featured Application

Modeling and simulation of manufacturing systems for their management and control, considering all the related areas, flows, and factors, in digital twin models for optimized regulation of process stability and quality with maintenance strategies for future industrial service-related business models.

Abstract

Historically, manufacturing system researchers and managers have often failed to consider all the areas, factors, and implications of a process within an integrated manufacturing model. Thus, the aim of this research was to develop an integral modeling approach for manufacturing processes in order to assess their status and performance. For this purpose, a novel conceptual model consisting of an integral definition of areas and flows is applied. As a result, manufacturing systems can be modeled, considering all related flows and decision-making options in the respective areas of production, maintenance, and quality. As a result, these models serve as the basis for the integral management and control of manufacturing systems in digital twin models for the regulation of process stability and quality with maintenance strategies. Thus, a system dynamics simulation model is developed for a metallurgical process. The goal of the simulation model is to provide a digital manufacturing system regulated with different maintenance, quality, and production strategies in order to secure quality and delivery service. The results show how the monitoring of all flows together with the optimal strategies in the quality and maintenance areas as a result of a regulated system can enable companies to increase their profitability and customer service level. In conclusion, the applied simulation case study allows better decision making, ensuring continuous optimization along the manufacturing asset lifecycle and providing a unique selling proposition for equipment producers and service engineering suppliers, as well as for production and assembly companies.

1. Introduction

Although a considerable amount of research has already been conducted in the field of production management, manufacturing companies are still facing major challenges as a result of unexpected failures. Due to the increase in technical maturity, today’s manufacturing industry is also confronted with a large amount of data. In this context, production systems need to introduce sustainable alternatives based on new technologies to identify disturbances within the production system at an early stage and even prevent them before they occur [1]. Data mining technology brings new breakthroughs to failure prediction toward reducing machine downtime, optimizing resource utilization, and increasing production volume with a potential reduction in maintenance costs [2]. Most of the machine processes that we know today are very specialized, depending on their parts and interrelationships. In this context, a type of system that deserves much more attention is the large systems built of parts that have many states of equilibrium [3]. The demand for adaptable manufacturing systems has increased in the past years due to the constant market changes [4]. Moreover, the joint impacts of decisions belonging to different production areas that are traditionally considered in isolation, such as logistics, maintenance, and quality, are difficult to predict [5]. In this regard, digital twins (DT) are a proven tool to support the evaluation and control of manufacturing systems [5], helping to increase the flexibility and robustness of unexpected conditions [6] of the manufacturing system. At the same time, if it is combined with computing capabilities, networking, and physical processes, it can provide new functionalities to the management processes and support systems that will help organizations to have better and more automated architectures [7]. Moreover, a DT model allows one to represent the current status of the manufacturing system and to perform real-time optimizations, decision making, and predictive maintenance according to the actual condition of the system. Research on digital twins is still at the initial stage, and there is a need for future research [6] that requires real-time synchronized simulations of the production system operations to be fully proven [8]. Whereas an independent simulation of certain aspects of product and manufacturing planning is possible, the integral simulation of complex manufacturing processes involves high costs as well as a high time expenditure, as, in general, an interoperability between heterogeneous IT (information technology) tools is not given [9]. Moreover, current manufacturing has not achieved the level of Industry 4.0, although many researchers and companies are working on this topic. Every current manufacturing system is able to cover some of the concepts of Industry 4.0 [10]. There are several models pursuing Industry 4.0′s integration into a company using different maturity models such as web-based, self-assessment tools, etc. A well-known architectural model is The Reference Architectural Model Industry 4.0 (RAMI 4.0) [11]. The RAMI 4.0 was developed in 2015 consisting of several layers, hierarchical levels, and the product lifecycle representing the value stream [12]. RAMI 4.0 provides a holistic view for all the important aspects of Industry 4.0 that are needed by different stakeholders and gives general guidelines for the whole organization but does not prescribe a specific modeling approach [13]. Therefore, this research pursues to apply a novel methodology for modeling and assessing manufacturing systems and processes suitable to consider all relevant elements of any system and process under Industry 4.0 environments [14]. Therefore, while the RAMI 4.0 developed a holistic consideration for the implementation of Industry 4.0, the methodology and specific application developed in this paper provides general guidelines, areas, factors, and parameters to be considered and modeled to assess any process and, by aggregation, any manufacturing system applicable to specific use cases, such as those related to Industry 4.0 manufacturing environments.
However, there is still a long way to go to improve manufacturing to the required level [15]. Thus, there is a need for the research on how to model self-organized manufacturing systems, deduce their dynamic behavior, and develop appropriate control methods. However, the theories on self-organized systems are not mature, and the complex system research remains a hot topic [16].
Consequently, the control of manufacturing processes is a challenge for researchers and practitioners. In this regard, the fourth industrial revolution pursues to transform manufacturing processes and their management. Thus, the aim of this research is to provide an integrated manufacturing model aligned with the fourth industrial revolution by considering all relevant areas and factors influencing the manufacturing process and its output indicators, including product quality and the manufacturing system. In this context, a novel methodological approach is applied in a system dynamics simulation model with a digital twin concept approach. As a result, the simulation of a manufacturing process model serves as a guide model for the fourth industrial revolution, as it applies the combined methodology of cybernetics and system dynamics modeling. Furthermore, knowledge of the impacts of flows and their factors on target indicators and stability is helpful, as this fundamental information allows one to develop maintenance and quality plans, which enable the prediction of critical factors in the process. This makes it possible to reduce operational risks by generating preventive maintenance plans for the different flows related to the manufacturing process. The model and its systematic application allow one to predict the outcomes of the process based on input variables, and it is used to increase the planning capability and, therefore, process stability, as well as continuous optimization of the expected variables based on real data. Key indicators and their target values can therefore be managed and controlled in effective and efficient ways—effective because the model allows one to regulate the process in order to converge the target values, and efficient because it can do so by optimizing resources and time, thereby allowing them to converge, while considering a certain level of risks of the action. This ensures continuous optimization along the machine lifecycle, providing a USP (unique selling proposition) for equipment producers, service engineering suppliers, and production and assembly companies. As a result, the proposed approach, together with the potentials of the fourth industrial revolution, enables companies to increase their profitability and customer service level as the study provides a simulation tool that can support the activities of equipment producers, service engineering suppliers, as well as for production and assembly companies.

2. Methodology, Fundamentals, and Materials

2.1. Methodology

In this paper, the methodological approach is as follows:
  • Literature research on the manufacturing process, manufacturing system, elements, flows, parameters, system dynamics, simulation, and the integrated manufacturing model.
  • Design of a case study for the metallurgical industry to test a novel conceptual model for modeling and assessing manufacturing systems. After developing the conceptual model, it is applied to a simulation case study using system dynamics. The case study consists of a metallurgical process from steelmaking to finishing steps. In addition, the simulation model is developed using system dynamics. Based on the simulation study, the interrelationships and impacts of manufacturing areas and factors are analyzed and described.
  • Execution of simulation experiments for a comparison of the conceptual model with other manufacturing models in different demand and variability element scenarios. The objective is to determine what the effects of the integrated manufacturing model are and how it can improve the relevant key performance indicators based on a complete consideration of factors, thereby allowing the prediction of variability elements and their probability, and enabling an effective definition of preventive maintenance plans for all related flows.
  • Interpretation of results and derivation of implications and use cases for managers and technicians.
  • Critical reflection of the research performed, and outlook of potential future research based on the findings of paper.

2.2. Manufacturing Model

Reschke and Gallego-García (2021) developed a model for manufacturing systems that aims to break down the elements, areas, and flows of a manufacturing process [14]. This approach is applied in this research, and it is based on the following elements:
  • Input: information, material, money, and energy flows.
  • Process: the capital equipment status and the impacts of human resource functions, information flows, and related maintenance activities.
  • Regulation mechanisms: maintenance management and control, quality management and control, process design and optimization, and the order flows that are the decisions that influence the system from both the current and future states.
  • Finally, the output areas are the information, material, money, and energy flows obtained because of the manufacturing process and the related transformation from the input to the output item. Furthermore, an important output is the quality control of output according to quality requirements. Moreover, the main goal of logistics is to be able to provide the right products in the right quantity and quality with full information at the right time and at the right place [17].

2.3. Manufacturing Process Simulation and Digital Twins

In order to face demands for higher complexity, a more detailed planning of the design and manufacturing of the products by using simulations and other IT tools is key to fulfill the demand requirements. Thus, a holistic manufacturing simulation represents an abstraction of the essential characteristics in a digital model that enable to derive statements concerning practices and properties of systems. The use of digital models in production processes is described by the term of virtual production, which specifies a “mainstreaming, experimental planning, evaluation and controlling of production processes and plant by means of digital models” [9]. Virtualization means that organizations are able to monitor their physical processes by collecting sensor data linked to virtual plant models and simulation models. Thus, a virtual copy of the physical world is created [18]. However, nowadays, a continuous flow of information is available only with the application of customized architectures to overcome the problem of heterogeneity involving high costs, and this is the main reason why small and medium-sized enterprises (SMEs) usually have no integration of all available data into a system [9]. In this regard, there are several software applications throughout the product lifecycle, including design, analysis, simulation, process planning, etc. In addition, with a cloud structure, software is easily maintained and utilized on a cloud server, enabling version updating, maintaining, and integrating remotely [19].
These are digital representations based on semantic data models that allow running simulations in different disciplines. Research on digital twins is still at the beginning, and there is a need for future research works on relevant industrial applications to investigate and demonstrate the wide range of applications and benefits where the DT could express their potential [8]. At operational level, digital twins (DT) have been proven to be useful in supporting the evaluation and control of manufacturing entities. DT can be used to digitally represent products, single-stage machines or processes, or, less often, multi-stage manufacturing systems, being particularly relevant when DT is integrated into in-process control loops, as presented in for process quality improvement. Using DT for decision support, together with predictive engineering, leads to the capability of proactively addressing changes by exploring possible future scenarios and choosing the best available option that optimizes target objectives [5].

2.4. Materials

The following sources, methods, and tools were used to perform the research:
  • Books, conferences, and articles from the literature research.
  • System theory and cybernetics: Cybernetics can be considered part of systems theory. Both sciences deal with essentially the same subject; however, system theory focuses on the development of systems, while cybernetics explores the control and operation of systems [20]. The general object of consideration in cybernetics is systems. These systems are defined by a number of objects that are mutually connected through dynamic relationships and common properties. The boundary of a system is subjective in nature and must be defined by the observer [21]. Cybernetics deals with all forms of behavior, insofar as they are regular, determinate, or reproducible. As a result, it cares about what a system can perform [22]. On the other hand, there are two different cybernetic approaches to how to study a system: first-order and second-order cybernetics. First-order cybernetics study a system as if it were a “thing” that can be observed, manipulated, and separated. Second-order cybernetics, on the other hand, treat that system as an agent with its own entity that interacts with another agent, the observer [23]. A fundamental component of cybernetic systems are control loops, in which constant parameters are kept within the system. Under a control loop, there is an evolution of the effects that originate through the feedback of output factors in input factors [24]. In this way, control loops allow systems to be able to regulate themselves by comparing target and actual values through feedback mechanisms. In this research paper, the model is a system in which the interrelationships among the flows and different models are developed based on a model without regulation, a model with first-order cybernetics regulation, and with a second-order cybernetics regulation.
  • Modeling is the representation of a real-world scenario by a mathematical expression and/or a simplification of the real-world system. Simulation uses a model to generate data, and these data can then be analyzed [25]. Simulation allows companies to assess how decisions should be made and the optimal time to make them. Therefore, these analyses can assist in determining whether certain decisions are wise or not, acting as a decision supporting tool [26]. The use of simulation for manufacturing system design and analysis is recognized by scientists and industrial managers [27]. Simulations will be used more extensively in manufacturing operations to make use of real-time data to copy the physical world in a virtual model, which can include machines, products, and humans, thereby optimizing machine availability, increasing quality, as well as reducing production failures and improving decision making quality [6].
  • System dynamics simulation: This type of continuous simulation is chosen over discrete simulations, such as discrete-event or agent-based modeling, due to its high abstraction level that represents global causal dependencies with aggregates and feedback dynamics supporting the integral assessment and selection of strategic alternatives of a manufacturing system.
  • Simulation software: There are different software packages on the market that enable system dynamics modeling [28]. Out of them, VENSIM (Ventana Systems) simulation software was selected for this research.
  • Data bases served as input data for simulation.

3. Simulation Model Development

The aim of this study is to apply a novel methodological modeling concept for the assessment of manufacturing operations. The purpose is to develop a simulation model based on the concept generating transparency regarding the areas, flows, and factors involved, as well as the predictive, preventive, and corrective measures to deal with potential failure modes of the system. The goal of the model is to satisfy product quality requirements with excellence in operational efficiency. Moreover, the simulation model seeks to serve as a basis for digital twin models and systems for assessing, managing, monitoring, and for improving decision making in manufacturing systems. Furthermore, in literature, there are integrated manufacturing models; however, the focus of different areas, flows, and parameters provides the novelty of the presented model.

3.1. Delimitation of the Model

Reschke and Gallego–García (2021) developed a holistic model that serves as the basis for the integral management and control of manufacturing systems in digital twin models [14]. It is advantageous to perform “total” simulations and assess performance against many different indicators [29]. The purpose of this paper is to apply the conceptual model with a specific approach for modeling and simulating a case study holistically. In this context, the application of the conceptual model pursues this goal to provide a “total” simulation with multiple options and parameters that provide a global evaluation and support tool for managers and planning employees addressing the challenges of managing and controlling manufacturing processes with all potential elements of the fourth industrial revolution. The model can be applied to any manufacturing process in operation for the monitoring of all factors affecting its operation, product output, and quality. As a result, this research provides a framework for managers explaining how to design manufacturing process models, simulations, or tools of different complexity levels for planning, controlling, and/or optimizing purposes, considering a set of integrated key indicators.

3.2. Model Development Steps

A system is an arrangement of given elements that interact with one another [30]. Models are abstractions and simplifications of reality [31]. In addition, the factory is to be understood as a complex sociotechnical system, the optimal performance of which only results from the interaction of the individual elements [32]. The steps performed to apply the novel concept in a simulation case study for a metallurgical manufacturing system based on the digital twin concept are as follows:
  • Manufacturing process modeling for Industry 4.0;
  • Analysis of interrelationships and generation of a casual loop diagram (CLD);
  • Methodology for the application of the conceptual model to assess specific manufacturing processes;
  • Definition of key performance indicators (KPIs);
  • Simulation logic definition for the assessment of manufacturing systems and processes;
  • Description of simulation models;
  • Definition of simulation scenarios;
  • Validation of the simulation model;
  • Extraction of simulation results and their interpretation.
The simulation pursues to provide an integrated manufacturing management system to improve decision-making processes, enabling sustainable operations with consideration of the related elements of the fourth industrial revolution. As a result, production and maintenance management for manufacturing and assembly systems are holistically monitored and improved, allowing the optimization of industrial services over their lifecycle. Therefore, product quality can be controlled by regulating the manufacturing operation modes and variability sources with the support of IT systems and communication technologies. For this purpose, a digital twin model of the manufacturing process, allowing iterative modeling and simulation with real or generated data, is required to utilize all of the conceptual model potentials.

3.3. Manufacturing Process Modeling for Industry 4.0

From the perspective of the control engineer, the smart factory can be viewed as a closed-loop system [16]. Figure 1 depicts the difference between the traditional production lines and the smart factory production system. The traditional production line aims to produce a single type of product [16] in an input–output process without a controller or self-regulation; that is, the process is not closed, but one end serves as the input and the other end serves as the output, and the machines are deployed along the line [16]. The first-order cybernetic principle adds an independent controller to the manufacturing process, but the communication between machines is seldom and there is no self-optimization. By contrast, the smart factory production system aims to process multiple types of products [16] with a self-optimizing production system.

3.4. Interrelationships and Casual Loop Diagrams (CLDs)

Between the areas and factors of any manufacturing process are mutual or directional impacts. Table 1 depicts the interrelationships among areas. In this table, the columns are influenced by the lines; that is, the lined areas influence the columns according to the legend below the table.
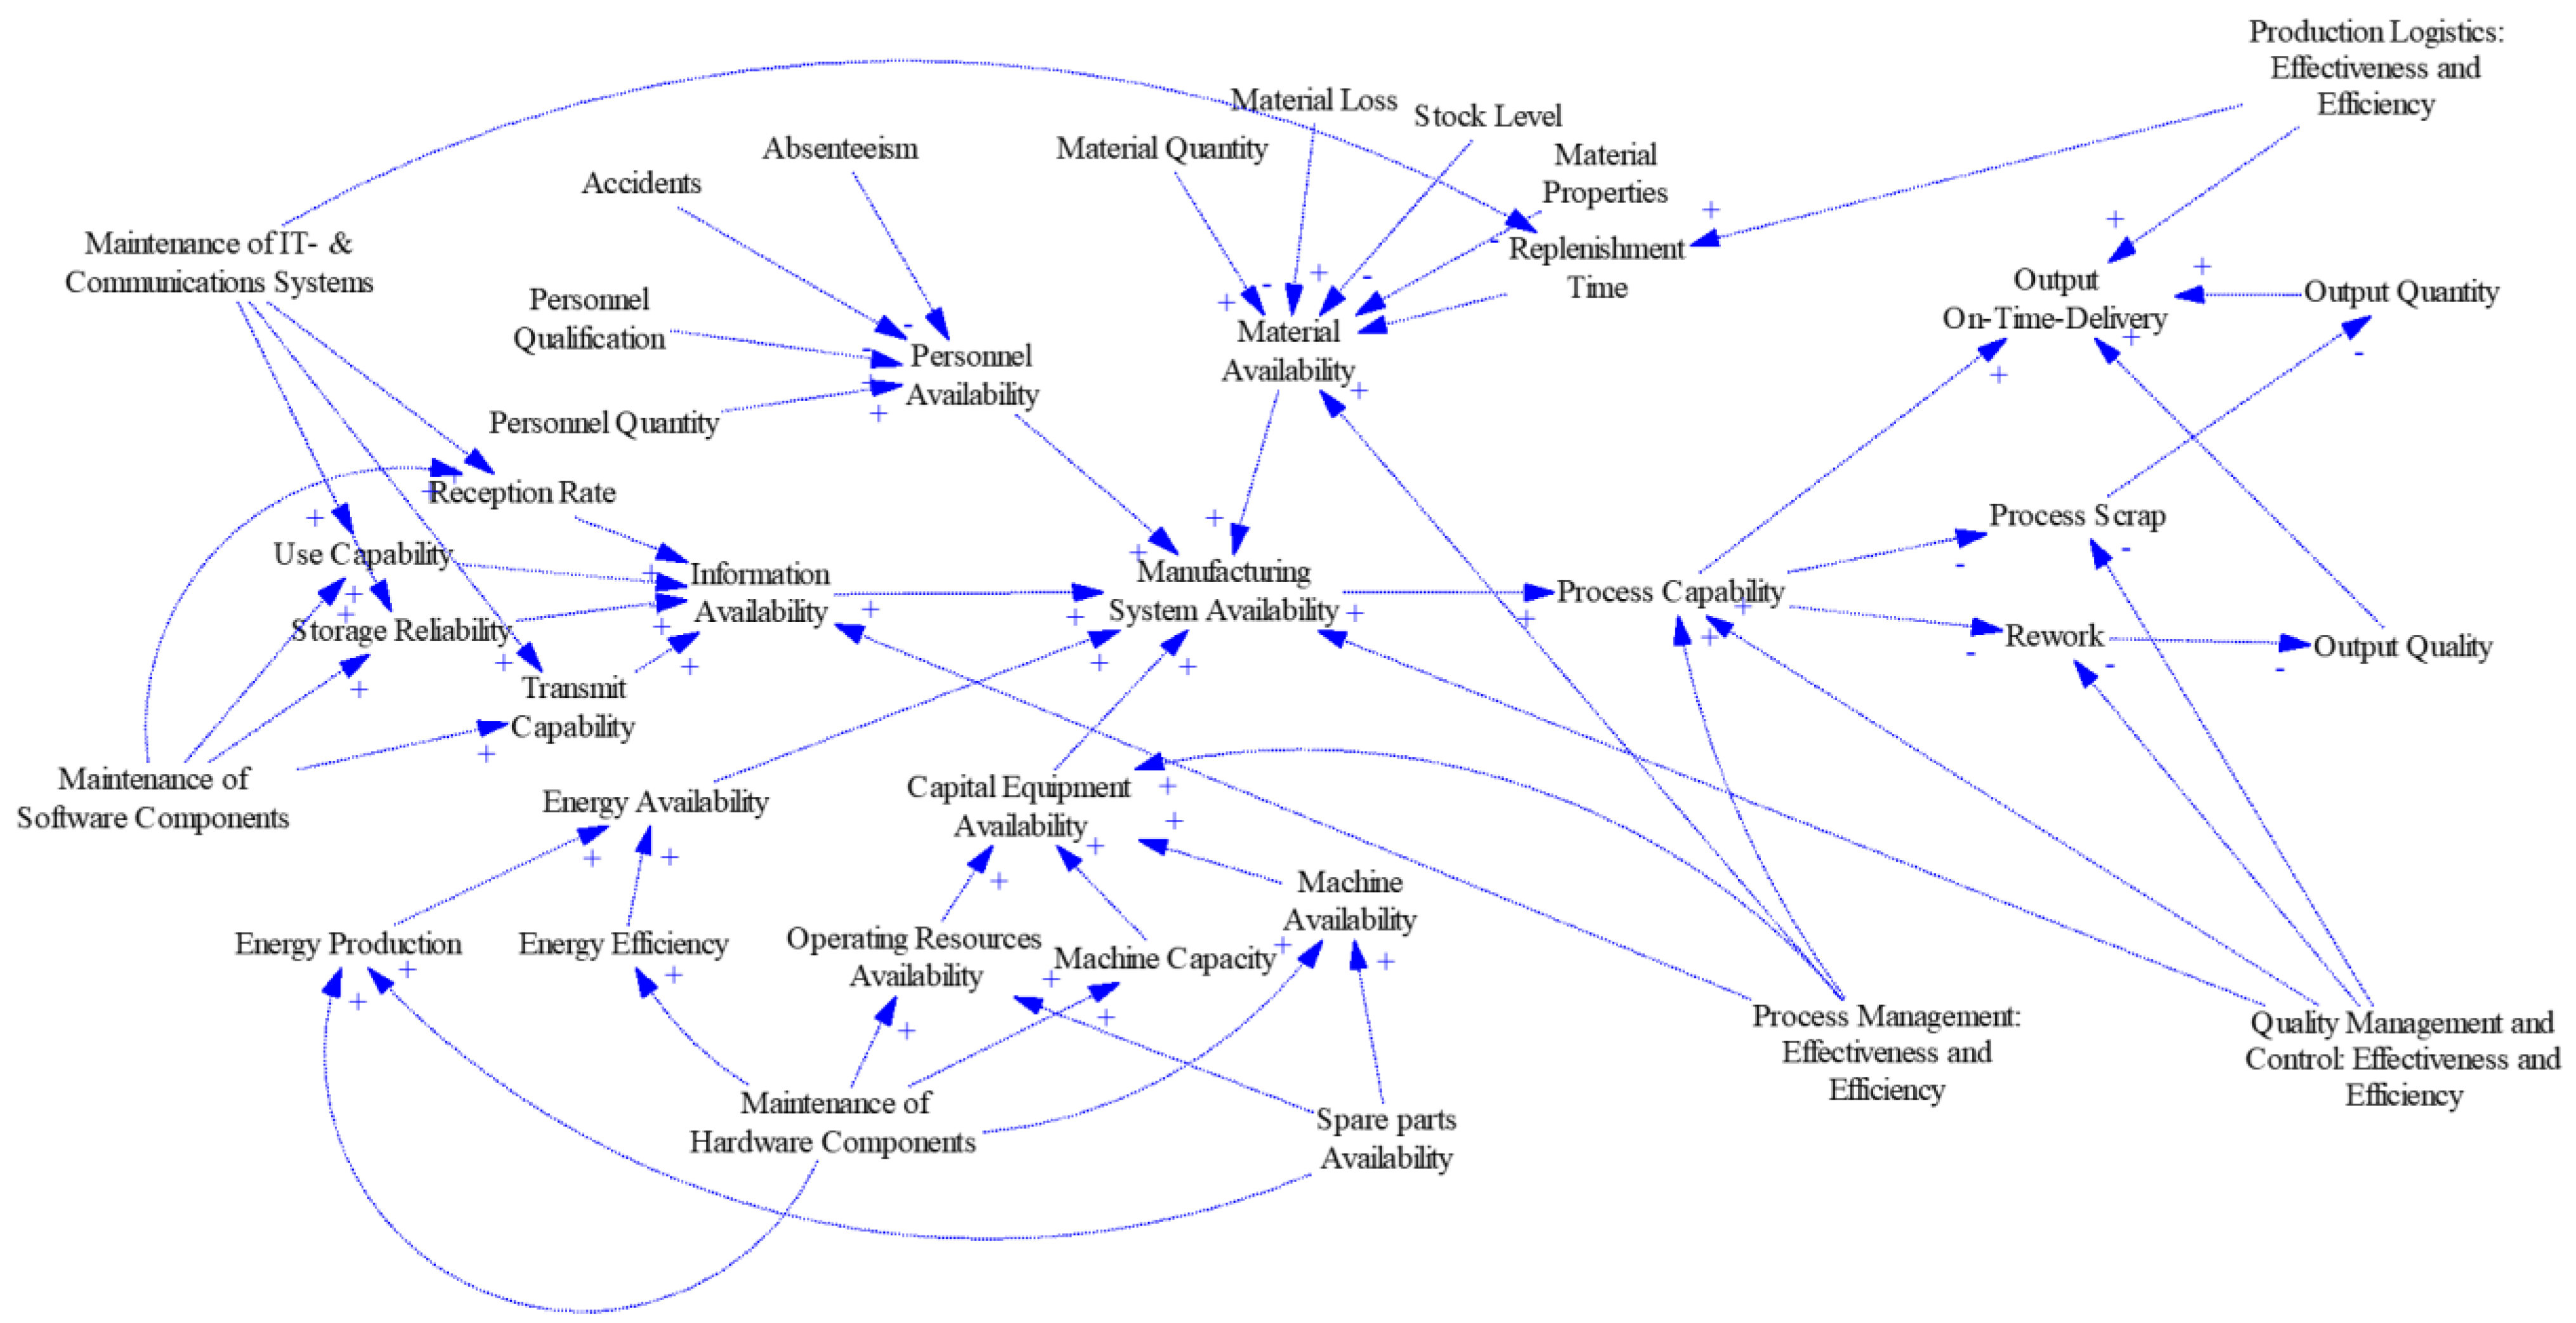
The interrelationships between factors are depicted in Figure 2.

4. Manufacturing Process Case Study

This section consists of the application of the different approaches for the modeling of the manufacturing process within Industry 4.0 environments, i.e., from input-output processes to second-order cybernetics and the self-regulation of systems. Moreover, this section provides a development of how the different flows affecting and in relation with a given manufacturing process can be modeled and simulated, attending to a predefined set of key performance indicators.

4.1. Design of the Case Study for a Metallurgical Process

Firstly, the modeler must define a time horizon and units of time. It is easy to carry out this step by asking to what extent the simulation should be considered. In the case of this study, it was decided to simulate one working year to evaluate influences in the short and medium term. The simulation was performed with 250 time periods, each representing one production day.
Secondly, the manufacturing system structure was set to apply the conceptual model and to be able to simulate it under certain conditions. The structure consists of a steel-making manufacturer producing shot-peened round bars. As shown in Figure 3, the process starts at the EAF (electric arc furnace), followed by the secondary metallurgy, rolling process, heat treatment process, as well as finishing and inspection processes. The system consists of warehouses of raw materials and finished products in addition to their production facilities. Finally, end-customers are at the end of the chain receiving the products shown in Figure 3.
Third, general assumptions were made to answer the research question, thereby allowing a reduction in model complexity. The following assumptions were applied to all scenarios and models of the case study:
  • The product is a finished/sale product after the final inspection process.
  • The orders have only one product type, shot-peened round bars.
  • Demand level is based on customer orders, and it is the same for the same scenario in the different simulation models.
  • The manufacturing system follows a make-to-order production system.
  • The manufacturing system initiates the simulation with work-in-progress (WIP) units along the production steps and warehouses.
  • There is no transport limitation or transport means limitation in the different stages.
  • Replenishment times between stages at the beginning of the case study have the same distribution over the period considered.
  • Order information along the manufacturing system is available.
  • Demand is not known, but historical data for all customers are available one day after orders are placed.
  • Customers do not leave the company or order more if the last orders are not met on time.
  • At the beginning, all employees have the same experience and have the same capacity to perform warehouse activities.
  • Production capacity is always between a minimum and a maximum, given a capacity per shift and the number of employees, if no decision has been taken during the simulation. The minimum and maximum production capacities per shift are the same for all models at the beginning of the simulation study.
  • Storage capacities have a maximum level, and it is the same for all models at the beginning of the simulation.
  • Products do not suffer any kind of problems/failure in their transportation from the production facility to the customers.
  • Packaging is performed in the production facility.
  • Safety stock levels change as required for the target service level. The target service level is calculated based on the reorder point method.
  • Monetary means to finance the manufacturing process are assumed as given.
As a fourth step, the exogenous variables as inputs to the model are described. The following are used in the case study:
  • Market demand is defined by values read from a database outside of the model. Demand defines the evolution of customer orders.
  • Production capacity has a maximum of 4000 units per day in three shifts at the beginning of the simulation. During the simulation, the capacity levels of the different production processes within the manufacturing system are affected by the information received, the material available, the energy supply, the quantity and qualification of personnel and capital equipment, and the monetary capability.
  • Storage capacity at the beginning of the simulation is 3000 units.
  • There are three working shifts at the beginning of the simulation.
  • Personnel capacity at the beginning of the simulation is 1200 employees.
  • The replenishment times are set at the beginning of the simulation and do not change over the simulation period.

4.2. Key Performance Indicators (KPIs) for the Case Study

The main reasons for organizations to undertake activities is to save money, increase profit, and influence other important factors, such as quality, delivery time, and delivery reliability, which are essential for competitiveness [17]. The results will be quantitative, allowing for the evaluation of the response according to the key performance indicators of defining parameters of a specific scenario, process efficiency indicators, product indicators, and economic parameters.
Parameters referring to a specific scenario are those that define the scenario itself, and they are exogenous variables:
  • Cumulated demand (tons): this represents the cumulated demand to be satisfied in a certain period:
C u m u l a t e d   D e m a n d   t o n s   = t = 1 n D e m a n d   a t   t i m e   p e r i o d ,
  • Information availability (% information needed): this represents the information received of the total information needed to manufacture the production orders in a certain period:
I n f o r m a t i o n   a v a i l a b i l i t y   %   information   needed   = I n f o r m a t i o n   a v a i l a b l e   t o n s I n f o r m a t i o n   n e e d e d   t o n s ,
  • Material procurement reliability (% material needed): this represents the available material input of the total of material input required to produce the orders planned in a certain period:
Material   availability   %   m a t e r i a l   n e e d e d   = M a t e r i a l   a v a i l a b l e   t o n s M a t e r i a l   r e q u i r e d   t o n s ,
  • Energy availability (% energy needed): this represents the available energy input of the total of energy input required to produce the orders planned in a certain period:
Energy   availability   %   e n e r g y   n e e d e d   = E n e r g y   a v a i l a b l e   t o n s E n e r g y   r e q u i r e d   t o n s ,
  • Capital equipment (% capital equipment needed): this represents the available capital equipment of the total of capital equipment required to produce the orders planned in a certain period:
Capital   Equipment   Availability   %   c a p i t a l   e q u i p m e n t   n e e d e d   = C a p i t a l   e q u i p m e n t   a v a i l a b l e   t o n s C a p i t a l   e q u i p m e n t   r e q u i r e d   t o n s ,
  • Personnel availability (products): this represents the available staff of the total of human resources required to produce the orders planned in a certain period:
Personnel   Availability   %   p e r s o n n e l   n e e d e d   = P e r s o n n e l   a v a i l a b l e   t o n s P e r s o n n e l   r e q u i r e d   t o n s ,
Process efficiency indicators refer to the efficiency parameters that are needed to reach the required satisfaction rate and service level:
  • OEE (overall equipment effectiveness): This is a well-known measurement method that combines availability, performance, and quality for the evaluation of equipment effectiveness in the manufacturing industry [34]. The OEE index machine stands in comparison with an ideal machine that always runs at full speed and capacity, while at the same time producing good quality products [25]. Although the data of overall effectiveness of equipment seem very simple, extracting useful information from a series of calculations is an important and difficult task [35,36].
O E E = A v a i l a b i l i t y × P e r f o r m a n c e   ×   Q u a l i t y ,
  • The next three rates are used for both the manufacturing system and process step:
    Availability factor: In detail, the availability factor measures the time loss due to breakdowns, set-up, adjustment, and other stoppages [19]. It is traditionally calculated using Nakajima’s [37] formula as shown below [34]. However, in this paper, it is calculated as a multiplication of the areas availabilities.
      Availability = N e t   A v a i l a b l e   T i m e D o w n t i m e   L o s s e s N e t   A v a i l a b l e   T i m e     × 100 % ,
    Performance rate: This takes into account “speed loss”. Reasons for this can be substandard materials, operator inefficiency, and job conditions. Then, performance is determined as follows [38]:
      Performance = O p e r a t i n g   T i m e S p e e d   L o s s e s O p e r a t i n g   T i m e   × 100 % ,
    Quality rate: Quality considers “product loss”, which is determined as follows [38]:
      Quality = N e t   O p e r a t i n g   T i m e D e f e c t   L o s s e s N e t   O p e r a t i n g   T i m e     × 100 % ,
  • Average WIP stock (products): This is the average stock after production until reaching end customers. Inventory is also one of the most important drivers in a distribution network [16]:
  Average   W I P   s t o c k   p r o d u c t s = t = 1 n S t o c k   a t   t h e   w a r e h o u s e s   a t   t i m e   t t = 1 n t
  • Labor productivity (tons/(employee*day)): This is the output with quality for each employee per day:
L a b o r   p r o d u c t i v i t y t o n s e m p l o y e e d a y = P r o d u c t i o n   t o n s E m p l o y e e s d a y s   ,
  • Process capability (Cpk): The Cpk is an index that measures how close a process is running to its specification limits compared to the natural variability of the process. The larger the index, the less likely it is that any item will be outside the specifications.
C p k = M i n   C p l ,   C p u ,
C p l = M e a n     L S L 3 S t d . d e v , ,
C p u = U S L     M e a n 3 S t d . d e v ,
Product indicators refer to the parameters that are needed to reach the required satisfaction rate and service level of the end customer:
  • On-time delivery (OTD) (%) [39]: This represents the percentage of quantity delivered on time for a certain period. It is a quantity-oriented KPI that describes the customers’ demand percentage that could be satisfied directly from stock in a certain period [40]:
O T D   % = t = 1 n T o n s   d e l i v e r e d   o n   t i m e t = 1 n T o n s   o r d e r e d   × 100 %

4.3. Simulation Logic for Assessing the Manufacturing System

To assess a manufacturing system, first, it is necessary to determine the state of the manufacturing process, i.e., its areas, factors, and parameters, based on real data if possible. For this purpose, it is required to map the manufacturing system and its process and to identify which of the areas and factors of the conceptual model, money, information, material, etc., are involved and in which interrelationships among them. Secondly, an organization should understand how the manufacturing system evolves over time. In this regard, Figure 4 provides how the system develops from a certain system state n to a system state n + 1. As shown in the figure, a manufacturing system state is defined by its levels, i.e., the amount of money, information, material, energy, personnel, and capital equipment that the system has in the moment, as well as the output indicators of the system in the latest periods. On this basis, the system generates an order flow, which consists of the decisions that initiate change from state n to state n + 1. As a result, the manufacturing system state and the output indicators of period n + 1 are determined by the system state at time n and the decisions or order flow related to the levels, self-optimization, or/and goal adjustments determining the output indicators. On the basis of this second step, the manufacturing organization can identify what the order flow is, i.e., which and how decisions are currently made and how the different manufacturing states and output indicators are determined.
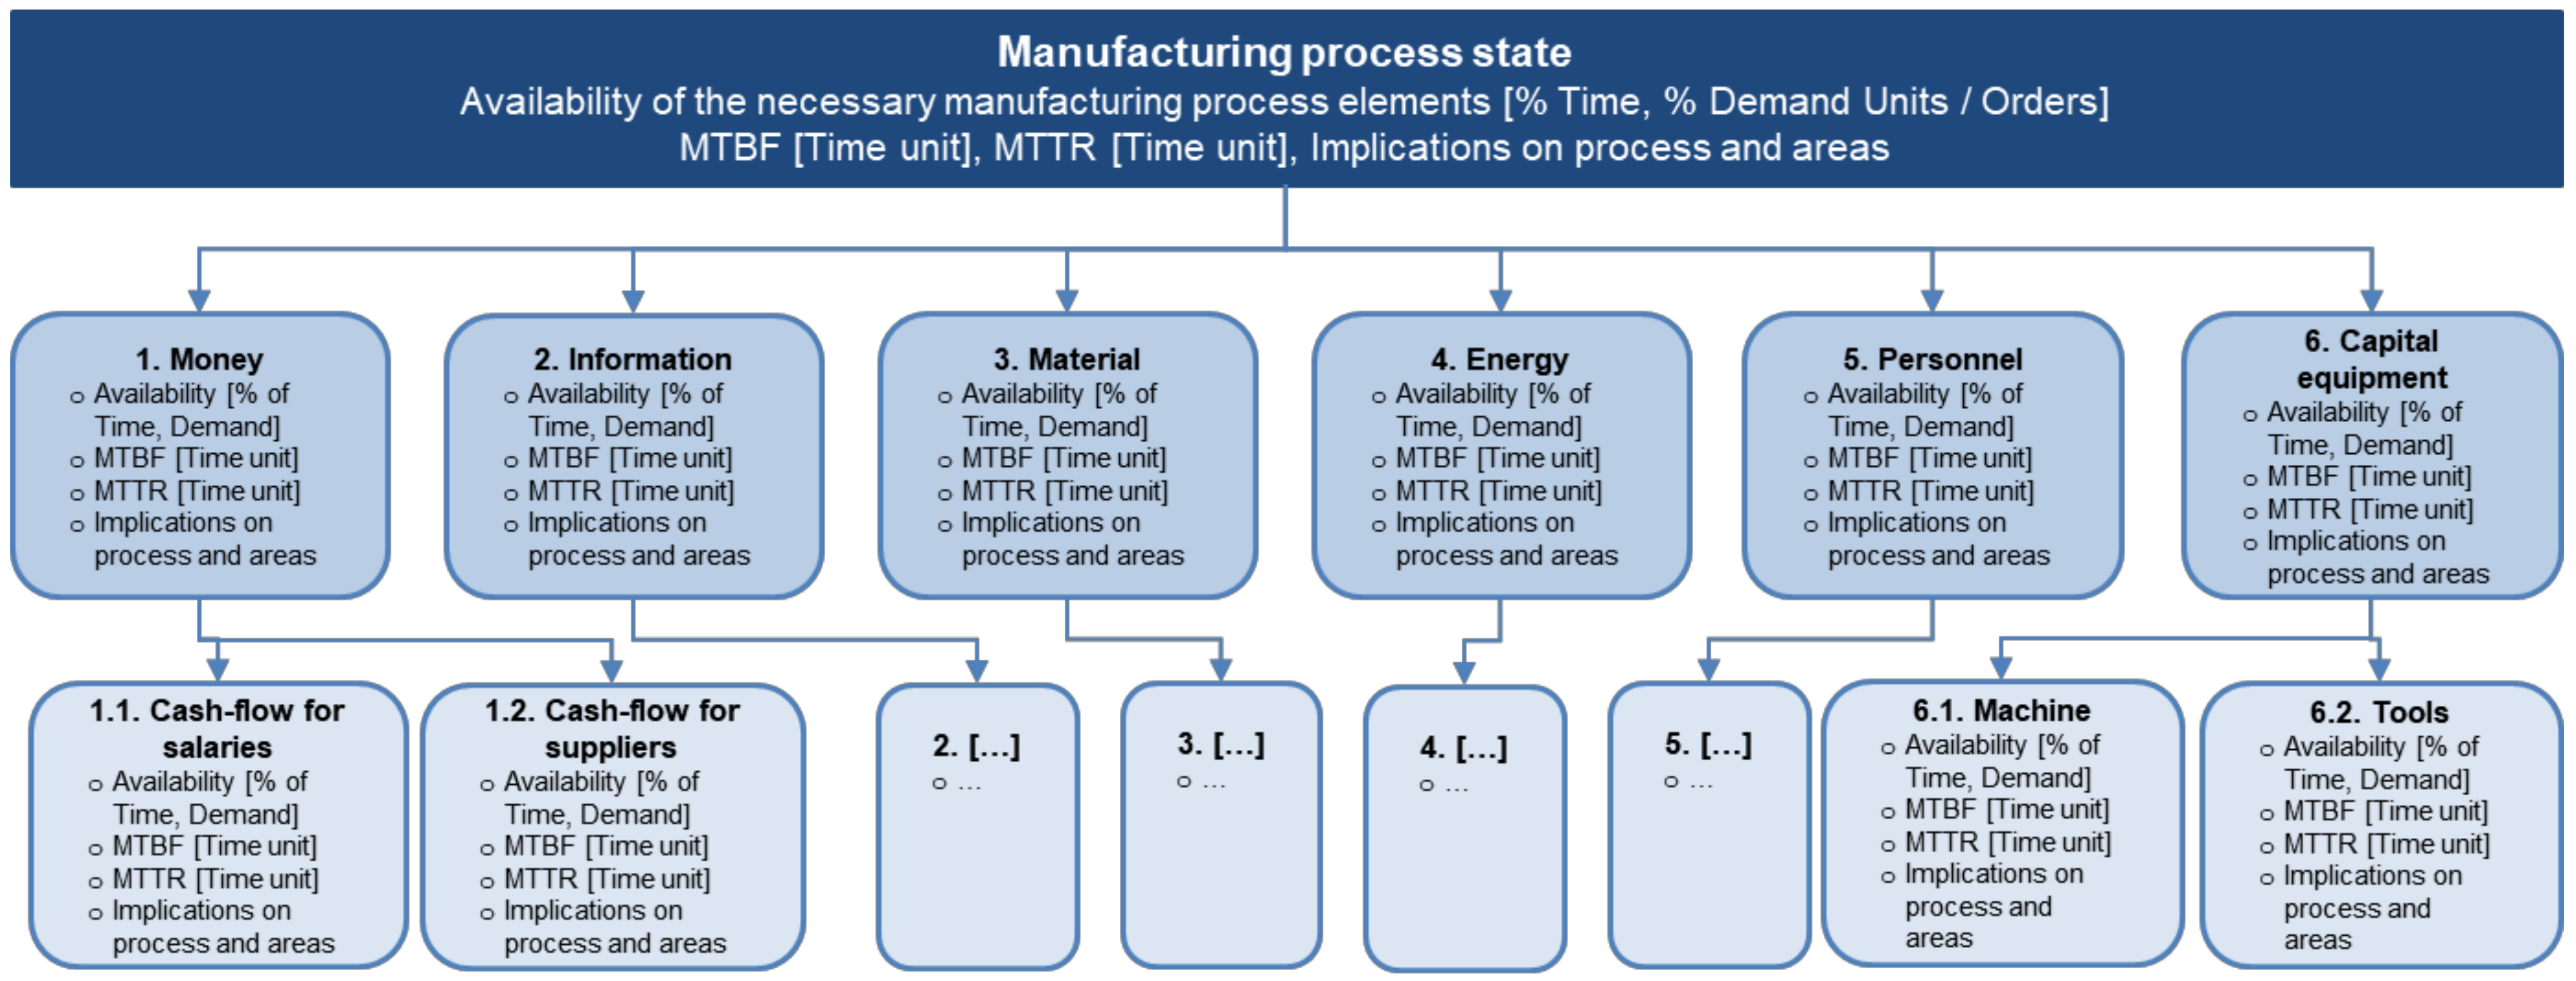
After determining how the system evolves over time, the third step is to identify the priorities of the system in which an improvement toward the goals can be achieved to focus on activities with higher impact on the overall manufacturing system. In this context, bottlenecks in manufacturing processes are a widely known and investigated phenomenon. The resource with the lowest threshold limits the performance of the overall system [41]. Moreover, the American Production and Inventory Control Society (APICS) defines a bottleneck as an asset, function, department, or resource whose capacity is smaller or equal to the faced demand [42]. These definitions can be applied to all company processes. Bottlenecks can appear in several dimensions, e.g., capacity, material, or information, and lead to the employment of various approaches that are able to identify and evaluate different types of bottlenecks [41]. Based on this definition, each of the areas and flows directly influencing the manufacturing process, money, information, material, energy, personnel, and capital equipment could be the system bottlenecks, as the lack of or reduced availability of them can make it impossible to initiate or perform the manufacturing process or can reduce the availability, performance, and quality of the process. From the resource perspective, each kind of manufacturing capability requires support from the related manufacturing resource [19]. Figure 5 shows how the state of a manufacturing process at any given time depends on six different flows and their specific states. As a result, the availability of a manufacturing process depends directly on the availability and capabilities of the associated flows for any given process. Therefore, by analyzing the flows and the process state in each time period and in the historic perspective, it can be determined which of the related flows and resources is affecting the availability and performance of the manufacturing process. Thus, applying the methodology and parameters depicted in Figure 5, it can be determined which area, factor, or parameter is reducing the overall manufacturing system availability or has an impact on the process or other areas. Parameters such as MTBF (mean time between failures) and MTTR (mean time to repair) for each of the areas in the sense of the disruptions that they can generate on the process can help to identify which areas or factors require measures to ensure their availability. By assessing these areas and factors over a certain period, the probability of each of them affecting the manufacturing system and, therefore, the area or factor of priority can be defined.
Because of the third step, the model provides the following statement:
“For a manufacturing process to take place, it is needed to secure the money flow; it is fundamental to prepare and provide the necessary information about the management and technical conditions of the process, including the technical parameters, the energy needed, and the material input required. Moreover, it is key to describe and coordinate the availability of the required human resources in quantity and qualification as well as to describe and provide the necessary capital equipment, such as machine and tools”.
The previous sentence can be described logically for a certain period as follows:
i f   m o n e y   i s   n e e d e d   t h e n   i f   a v a i l a b l e = 1 ; i f   i n f o r m a t i o n   i s   n e e d e d   t h e n   i f   a v a i l a b l e = 1 ; i f   m a t e r i a l   i s   n e e d e d   t h e n   i f   a v a i l a b l e = 1 ; i f   e n e r g y   i s   n e e d e d   t h e n   i f   a v a i l a b l e = 1 ; i f p e r s o n n e l   i s   n e e d e d   t h e n   i f   a v a i l a b l e = 1 ; i f   c a p i t a l   e q u i p m e n t   i s   n e e d e d   t h e n   i f   a v a i l a b l e = 1 ;
As a result, the following formula will lead to the manufacturing system availability:
S y s t e m   Availability   %         = M o n e y   A v a i l a b i l i t y × I n f o r m a t i o n   A v a i l a b i l i t y         × M a t e r i a l   A v a i l a b i l i t y       × E n e r g y   A v a i l a b i l i t y   ×                 × P e r s o n n e l   A v a i l a b i l i t y ×   C a p i t a l   E q u i p m e n t   a v a i l b i l i t y         × 100 % ,
The previous conditions first determine whether the resource area is needed; if yes, then it is determined if it is available as required, and if no, then the process regarding this resource is prepared. By conducting this for all resources, it can be determined whether the manufacturing process can initiate and perform its activity with all of the resources needed. If any of the resources are not available or are not available as required, then the consequences should be assessed for each specific manufacturing process. The impacts can differ from not being capable of executing the process to having an influence on performance, availability and/or quality.
Moreover, the impacts of the different flows and a lower availability of one should follow the logic described in the CLD of Figure 5 and depend on those relationships and on the specific application. In addition, the availability check will determine the activities in each period of the system. For each intended task of the system, the availability of the different flows required for the activity are analyzed, and based on their values and impacts, the output of the model is determined working as an iterative loop that repeats every period. Furthermore, to identify the availability over time, it can be assessed by the multiplication of the resource area availabilities in the case in which the availabilities are independent of those from the others.

4.4. Simulation Models

The aim of this study is to use simulation models, which, due to the application of the novel methodology, enable a reduction of complexity to the essential elements as a result are available to be developed in a systematic way, allowing a large number of different models to be calculated simultaneously in a short period of time. This creates a reliable prediction for the production controller, on which they can make reliable decisions. Thus, people are optimally supported in planning and controlling production, and, ultimately, the efficiency of production is increased [43]. The three scenarios can be differentiated by the following characteristics on the basis of the manufacturing process system modeling explained in Figure 1:
  • Manufacturing process system modeling as explained in Figure 1:
    • Input–output process without controller or regulation: This characteristic implies that the model will not change its behavior depending on the system status or target KPIs. The logical and mathematical formulations that govern the transformation of the inputs into outputs of this model are defined and do not change over the simulation period.
    • First-order cybernetics: The process of controlling the system with an integrated control that changes the model behavior with a determined pattern, i.e., within a given framework or policy for transforming inputs into outputs, it can modify parameters to meet target objectives; however, it cannot adapt the controlling policies of the system behavior.
    • Second-order cybernetics: regulate the system behavior with an integrated control that can change its patterns based on the system status, targets, and self-optimization options, i.e., the model can change its policies in different areas such as maintenance, quality, etc., to adapt itself to achieve the intended objectives.
  • Maintenance policy: Describes the maintenance strategy applied in all production steps of the metallurgical case study:
    • Corrective: defines a model in which maintenance activities are performed when there is a breakdown that implies a production stop in the process.
    • Preventive: describes a model that realizes maintenance activities in fixed intervals to prevent breakdowns from occurring and having an impact on the system.
    • Predictive: a policy in which intervals depend on a forecast of maintenance needs and, therefore, generating activities in variable maintenance intervals depending on the prediction.
  • Quality control: reflects the consideration of product quality output and how the adjustments to achieve the target product quality are performed:
    • Without adjustments: independently of the quality output, the system does not change.
    • With adjustments: depending on the quality output, model parameters change with a fixed pattern.
    • Predictive adjustments based on self-regulation: depending on the quality output and prediction of quality rate, model parameters change.
  • Areas in focus: pursues to compare a classical approach in which the material flow was mainly the only flow affecting the manufacturing system and process availability versus an approach in which all flow areas related to the manufacturing system are considered and monitored:
    • Only material flow area is in focus: implies that material is the only flow area with monitoring and action derived from its status.
    • All areas are in focus: this means that money, information, material, energy, personnel, and capital equipment will be monitored and treated with equal procedures.
Based on the previous four characteristics, the following simulation models can be described as shown in Figure 6:
  • Classical simulation model: consists of 1a, 2a, 3a, and 4a;
  • Integrated manufacturing simulation model: consists of 1b, 2b, 3b, and 4b;
  • Integrated manufacturing simulation model with regulation: consists of 1c, 2c, 3c, and 4b. Self-optimization aims to combine the advantages of cybernetic and deterministic models to design systems that are able to change their internal state or structure endogenously according to changes in the external conditions [33].

4.5. Scenarios

Scenarios for the simulation case study are based on different customer demands, as well as on different disruption patterns for the different manufacturing flows over one year with 250 periods of working days. Different scenarios with various demand patterns, as well as disruptions for the difference flows, were simulated. As a result, all of them show the same trend between the three models. Therefore, the results are shown exemplarily for one scenario for the three simulation models. However, to analyze different policies and effects as a result of the variation of relevant parameters, further simulations were performed for the IMR model as, for instance, different disruptions patterns in the different flow areas were simulated such as disruptions in the information flow related to the manufacturing system. Moreover, different process parameters affecting the quality of the final product were considered such as the shot density of the shot peening process. These specific scenarios are discussed in Section 5.

4.6. Simulation Model Validation

Before the results from the model were extracted and interpreted, formal validation was performed. According to Sterman [44], there are 12 possible methods for validating system dynamic models [45]. There are three that are relevant to our models; one of them is the extreme-value test, which was in this study. For the three models, the same input and output variables were chosen to analyze and validate the models. These input variables are the number of employees and the demand. From the variation in these variables, the following can be expected for the results to be logical and the model to be validated:
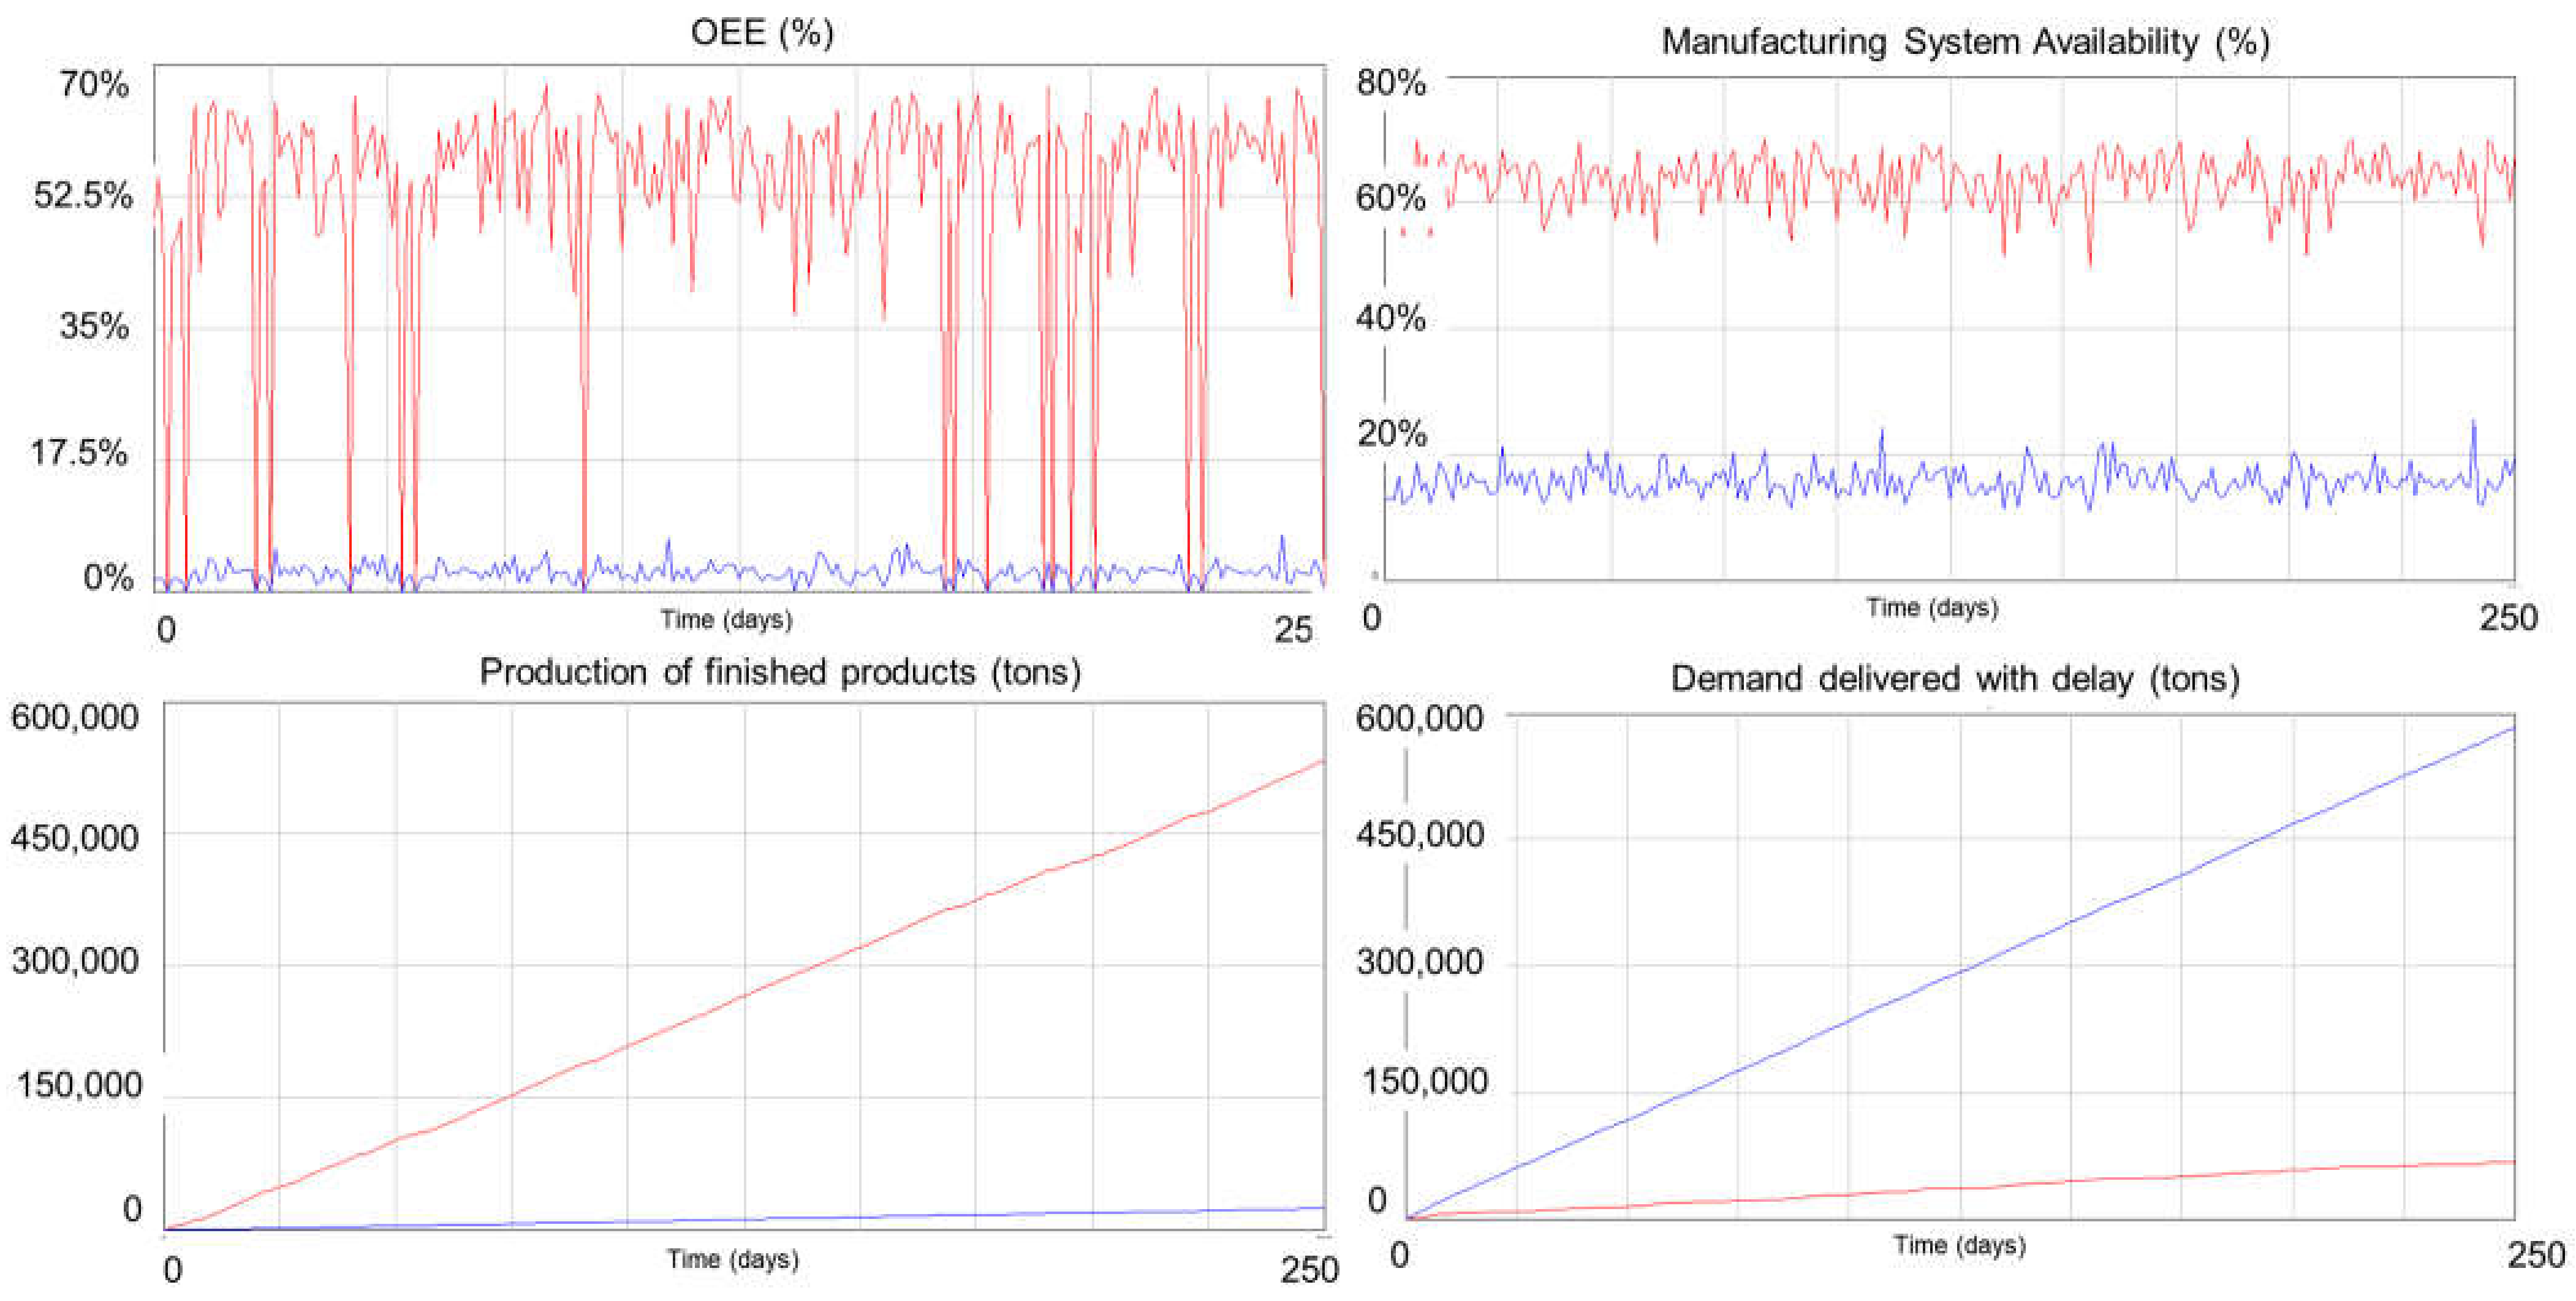
  • For a lower number of employees, the OEE, the manufacturing system availability, and the production of finished products must be lower, while more demand is delivered with delay. This is expected as employees are the ones performing maintenance activities among others, as well as assuring the availability of the flow areas needed to perform the manufacturing process, and therefore, a lower quantity of employees implies a capacity deficit to meet customer demands, i.e., less production and higher delivery delays while the availability and OEE are lower. Figure 7 shows this behavior; red and blue lines represent a higher and lower number of employees, respectively.
As the three simulation models, when performing the validation with extreme-value tests present the logical and expected results, the three models are validated to be analyzed.

4.7. Simulation Results

As shown in Table 2, the third model presents better results than those of the second model, and the second model presents better results for all relevant indicators than those of the classical simulation model. The simulation results for the three models are presented in Table 2. It shows how all three models have the same demand and, for all of them, money availability is set as given, i.e., 100%. Furthermore, it can be seen that for all the other flow areas, information, material, energy, personnel, and capital equipment, availabilities increase from the classical simulation model to the integrated manufacturing simulation model and to the model with regulation. This occurs due to the different policies applied in each of the models as better process control, maintenance policy, quality control, and areas in focus enhance the availability of systems contributing to a better OEE that reaches a 74.1% for the model with regulation, in comparison with the classical simulation model with 28.7%, showing how the policies can determine the manufacturing performance of a system. This fact has a significant influence on labor productivity and on-time delivery to customers that increases from 32.1% in the classical simulation model to 95.4% for the model with regulation. This increase results from the regulation of the whole system to meet customer demand.

5. Discussion

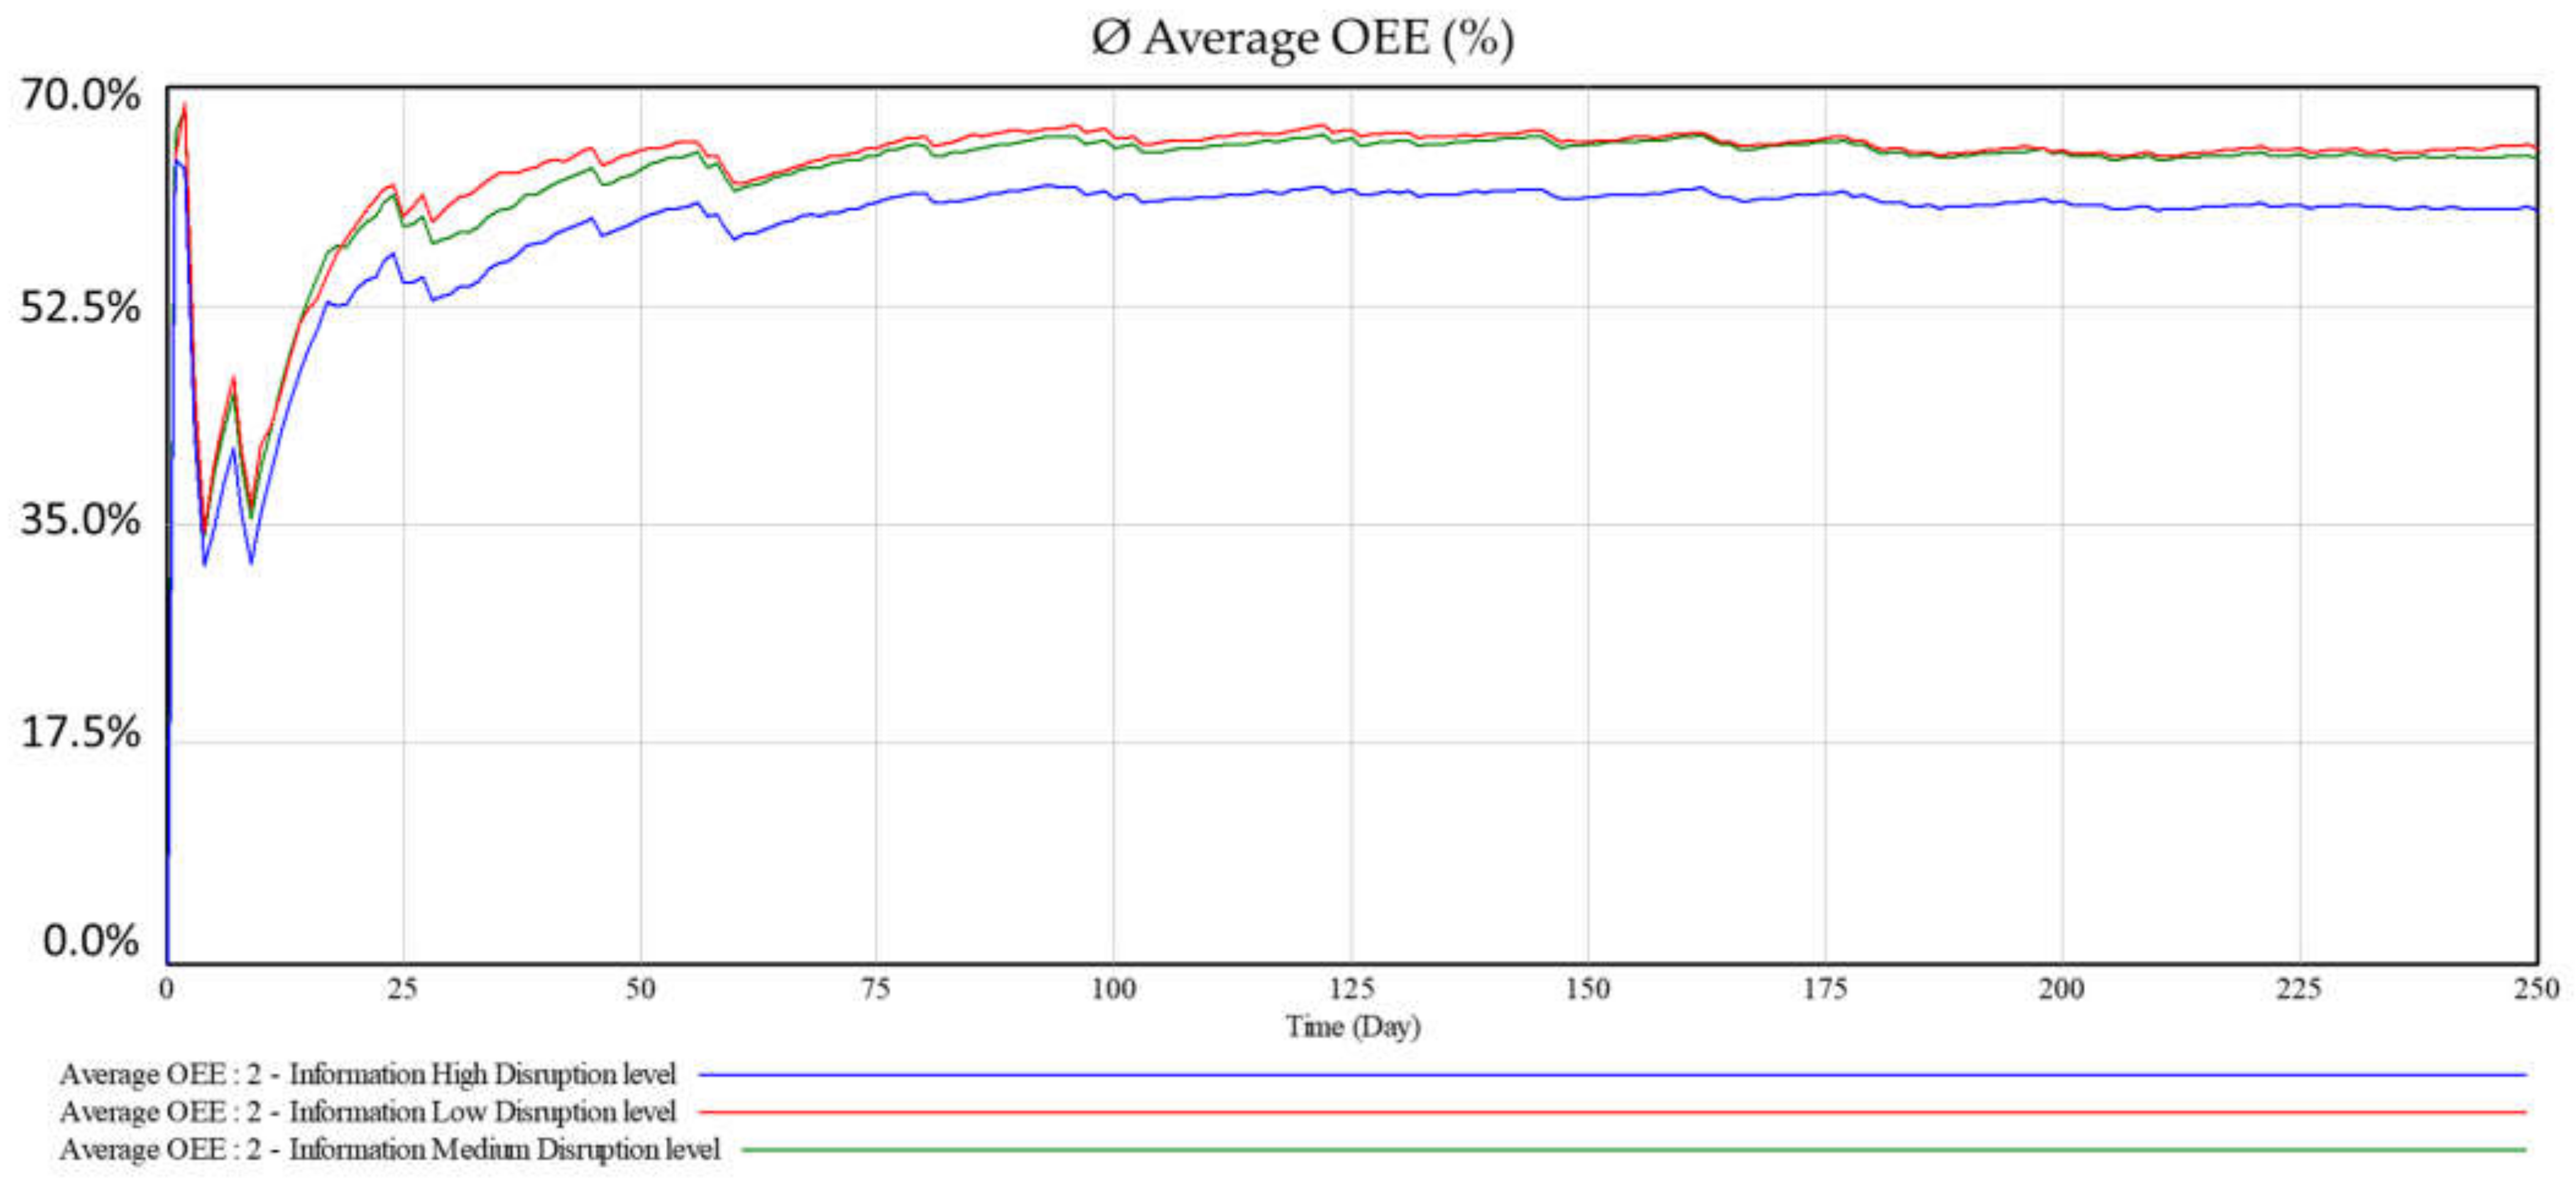
The results from the comparison of the three simulation models shows clearly how the evolution of the theoretical concepts from input–output process to a second-order cybernetics model provides a significant improvement in relevant key indicators, such as the OEE, the quality rate, the performance rate, and the availability rate, leading also to a higher on-time delivery. The simulation results also reflect how the correct definition of flows, parameters, and their interrelationships are key elements to improve the manufacturing system state by identifying the intervening flows and the bottleneck areas. To provide exemplary cases of different variants within the IMR model, Figure 8, Figure 9 and Figure 10 represent the OEE, the availability rate, and the quality rate for different scenarios.
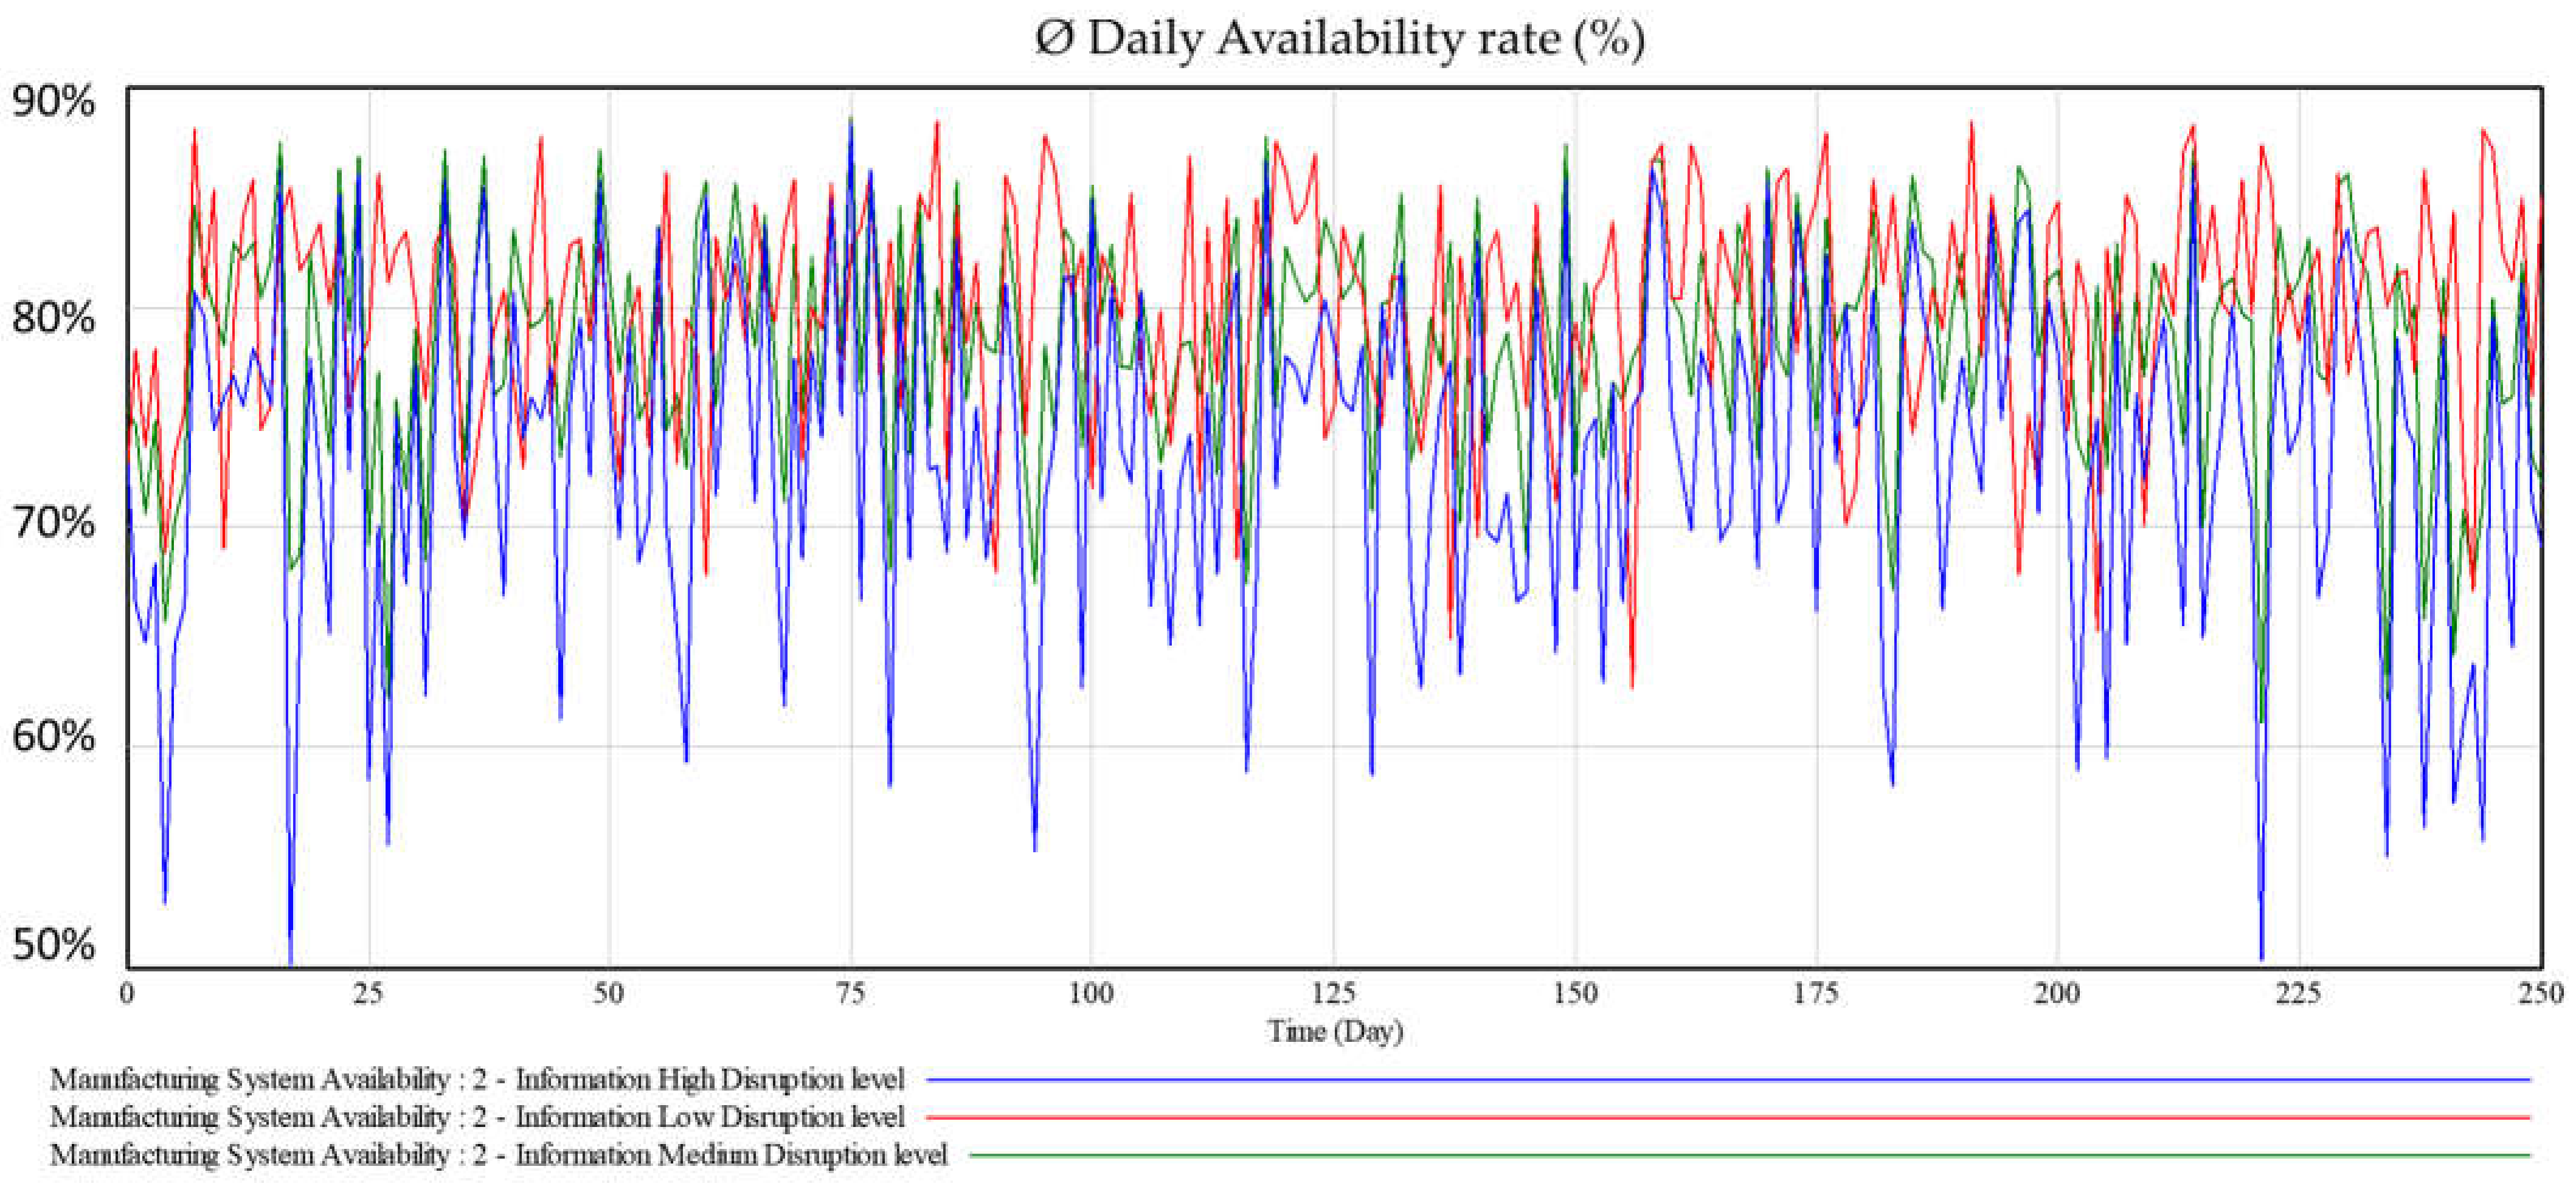
Figure 8 represents the average OEE for three different information disruption scenarios, low, medium, and high scenarios. It can be observed how, for a high information disruption level, the OEE is 5% lower than that of the low disruption scenario. As a result, the modeling and sensitivity analysis of these disruptions can provide a syndication of the risks related to each flow, process, and system, in this case related to the information flow. Moreover, the OEE in Figure 8 is derived from the aggregation of, between others, the daily availability rate of the manufacturing process.
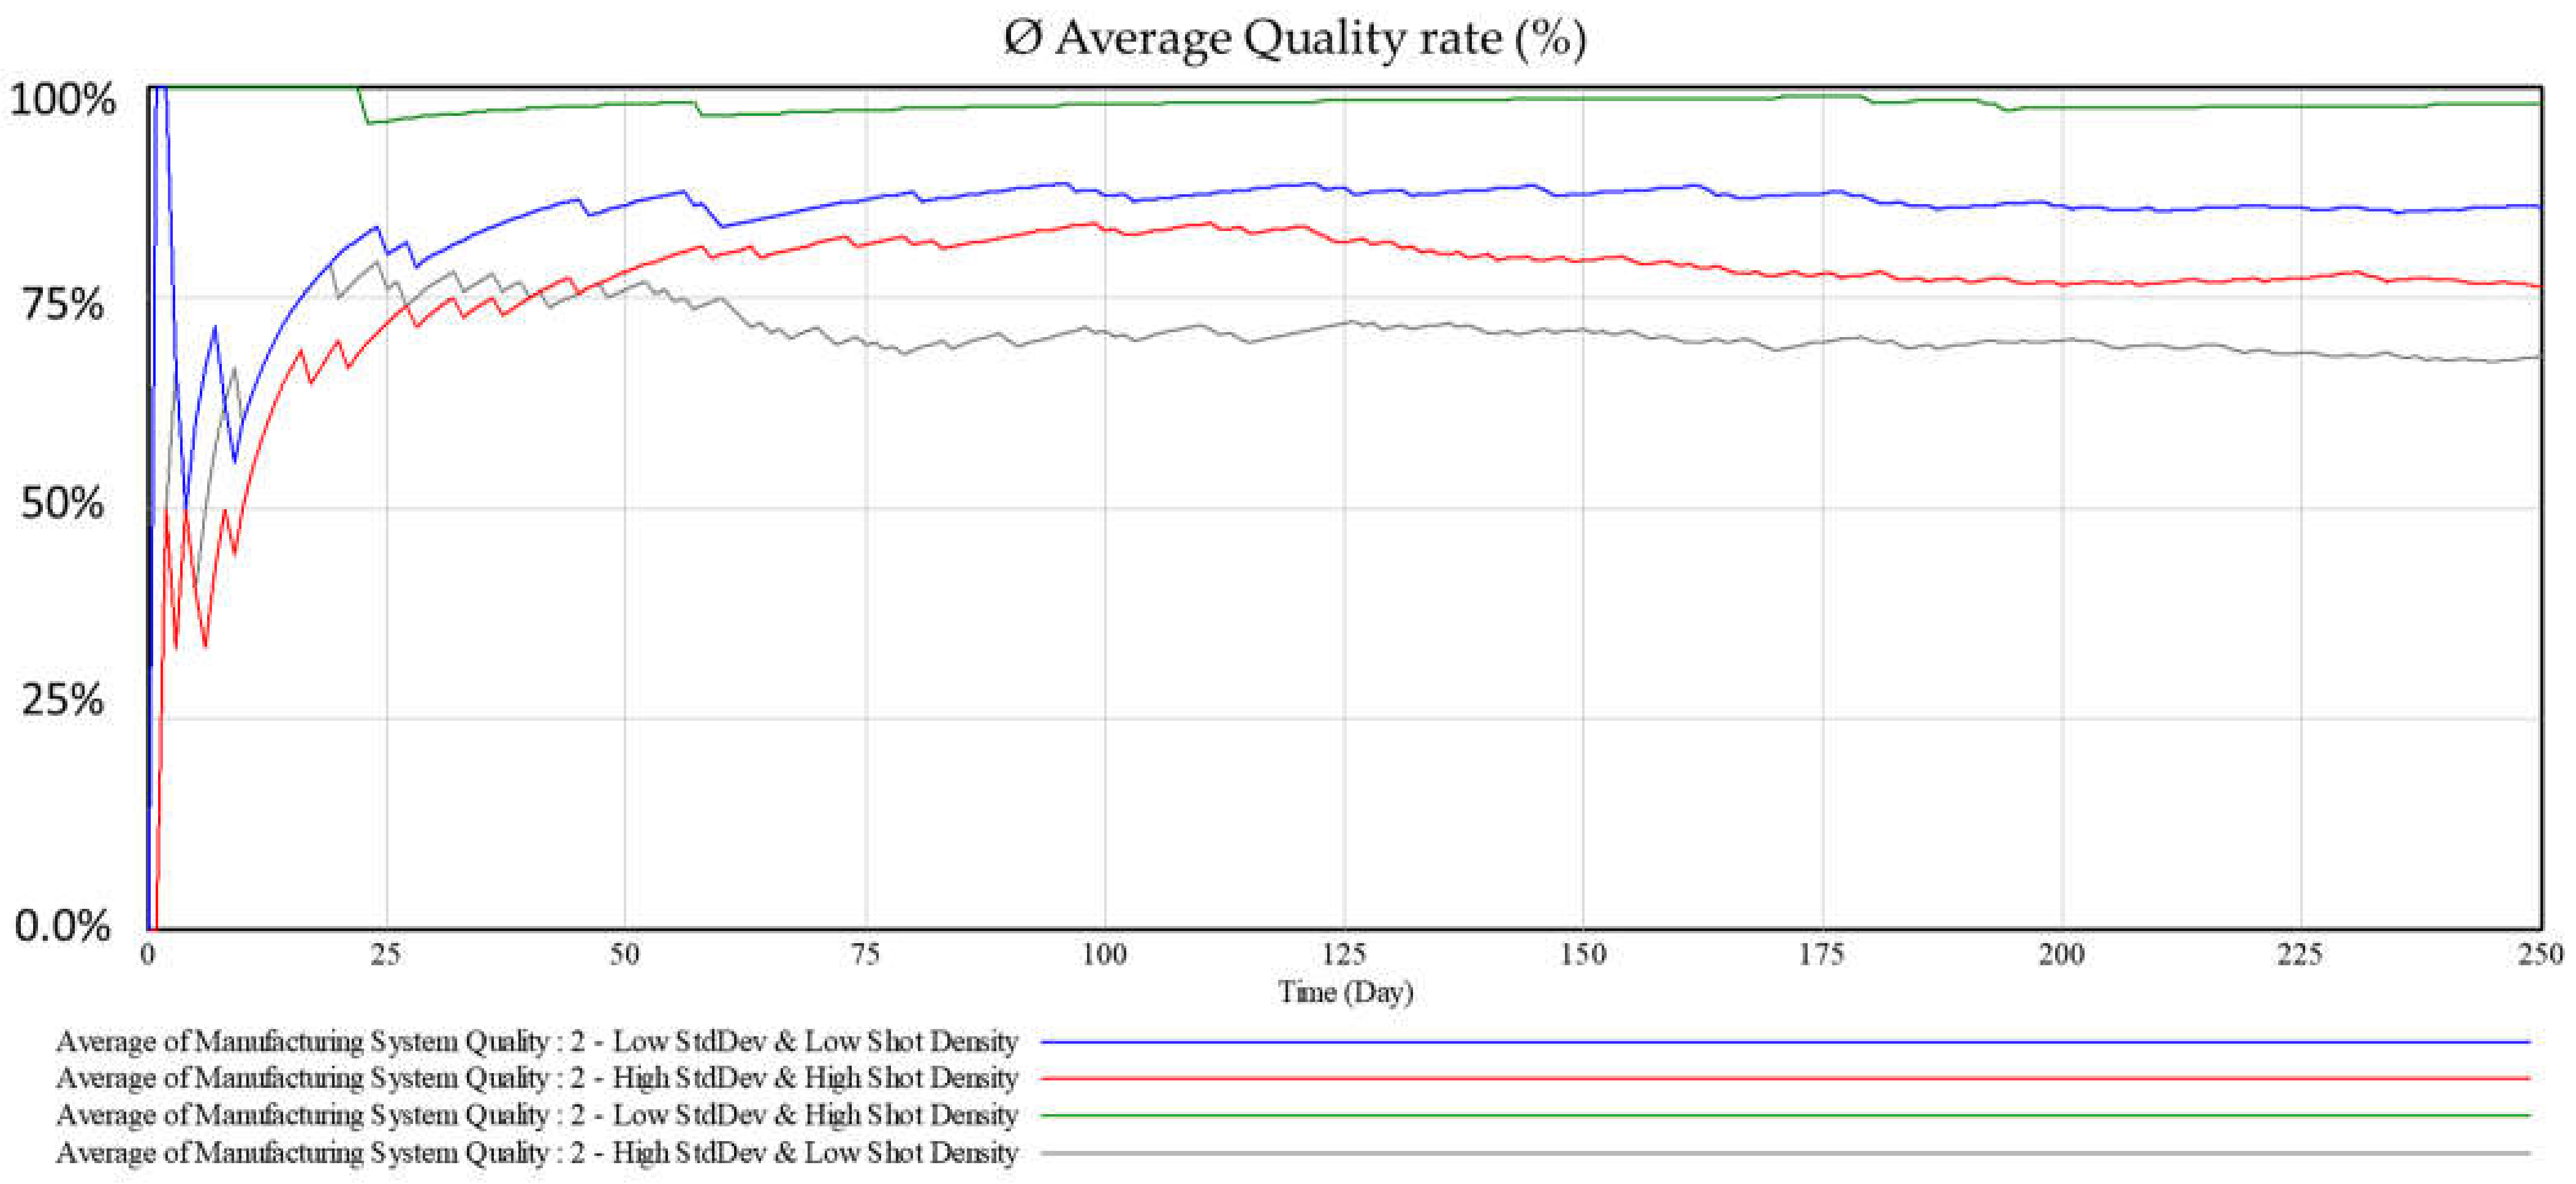
In another case, the model developed can also support the analysis of process parameters affecting product quality. For the case study, an example is the parameters of the shot peening process for the finishing of the shot-peened round bars. Thus, Figure 10 represents the average quality rate (%) results for a different set-up of shot peening parameters: low and high average and standard deviation of shot density applied to the round bars to secure its surface product quality requirements. As it can be observed, the correct regulation and control of the parameters can lead to significant improvements in final quality rate with an almost 30% increase, from less than 70% in the low shot density and high standard deviation to almost 98% in the high shot density and low standard deviation.
As a consequence of the Figure 8, Figure 9 and Figure 10, the benefits of the approach can be derived as a monitoring based on a digital twin model together with the assessment of different scenarios to support the analysis of the manufacturing current state, the identification of bottlenecks resources and flow areas, as well as the definition of appropriate measures and policies to improve the manufacturing system state.
The methodology applied is a natural evolution of the existing methodological approaches to a modeling framework toward the fourth industrial revolution. As a result, the proposed methodology considers more managerial aspects that can regulate the manufacturing process and, therefore, the complete system [14]. Liu et al. analyzed the status of digital twin research and determined that the concept should evolve towards more clarity and specificity and rely on industry practice to improve processing quality and produce in an efficient, dynamic, and intelligent manner, which is not available in the traditional method. In general, each paper focused on the development of a few digital twin components, and the implementations were fundamentally different from each other. All of them adapted to the needs of the respective application field using multiple tools. Some research adopted a modeling-oriented view that stems from technical engineering issues, aiming at simulating the precise physical behavior. Others adopted am information management-oriented view, focusing on semantic connections and seamless information flow. A variety of frameworks, reference models of digital twins, were proposed, but none of them become industry consensus. As a result, it is difficult to conduct systematic research [46]. Lu et al. (2020) performed an extensive literature review with the analysis of nearly 500 articles related to digital twins in the engineering domain published since 2016, and the number is proliferating, together with a huge interest from the industry. R and D (research and development) in this area needs to follow a common reference model. A digital twin needs a standardized information model, high performance data processing, and industrial communications to work together. The existing research on digital twins is conceptual work, and the development of practical digital twin applications is still at an early stage [47]. When comparing the proposed model with more recent approaches, these have a static assessment status, a level-oriented approach, a data- and AI-focused approach, or a dynamic approach; however, none of them provide a potential evaluation of all areas, flows, and elements interacting in all manufacturing systems, nor the potential regulation mechanisms to control and improve the system with an integrated, dynamic, and scalable approach [14]. Therefore, as applied in the metallurgical case study, the benefits are that the modeling approach enable to identify and monitor every flow related to every manufacturing process, thus enabling to gather all relevant data related to it, providing the base for scalability and its aggregation for the whole manufacturing system of manufacturing organization. The modeling methodology also supports an approach that helps to identify and focus on the constrains of the related areas, flows, and factors enabling to optimize resources and improve customer service. As a result, the model generates a platform for an optimized management for any manufacturing organization, as it is a more practical, simple, and scalable approach in comparison with other modeling methods.
Based on the above-mentioned results of the case study, managers can identify the relevance of the different areas and flows influencing a manufacturing process and, consequently, the overall manufacturing system. Thus, the monitoring, analysis, and interpretation of manufacturing-related data are key activities for an optimized decision-making that enables ulterior improvements on the manufacturing system performance, the product quality, and the customer service level. In this context, managers must define which are the relevant flows and parameters to be monitored, which are the methods for data treatment, as well as how to interpret the results of data analysis in order to provide an objective set of alternatives and their implications for successful decision-making. For this purpose, a digital twin model of the manufacturing system can provide the current status of the system, while, if the digital twin is enhanced with simulation capabilities, then the current status can foresee into its potential future states as well as with the related decisions that are to be made to reach this point.
On the other hand, managerial decisions should be oriented to a certain target. This target is defined as the organizational strategy and its disaggregation to the tactical and operative levels. To meet this target, the need for the different flows is determined, and based on this calculation, the expected potential bottlenecks for the different flows and related parameters and resources can be derived. As a result, the manufacturing system can prepare itself to avoid the predicted potential bottlenecks that would limit to reach the target values aligned with the organizational strategy.
Finally, based on the research paper and the related argumentation, the importance of such a tool, key for managers, is set. For that purpose, several steps need to be implemented as well as performed in a rolling basis, such as:
  • Record the current state of the manufacturing system.
  • Develop a digital twin model of the manufacturing system.
  • Use the digital twin model for simulation purposes.
  • Design a systematic methodology with the goal of identifying all potential bottlenecks that can occur for different future scenarios.
  • Derive a set of alternatives to solve the potential bottlenecks.
  • Decision-making on measures to be included on the existing action plan.
  • Follow-up of the action plan with pre-defined indicators and criteria in a rolling basis.
  • Use the comparison of real to virtual data to improve the adherence to reality of the digital twin model by improving the interrelationships established and the simulation capabilities.

6. Conclusions

This section is divided into theoretical, managerial, and empirical conclusions, in addition to an explanation of the limitations of the research performed and a description of the potential future research derived from the findings.
Theoretical conclusions: This study aimed to develop a holistic approach for the assessment of the status and performance of manufacturing systems and processes. In order to achieve these goals, a simulation model is successfully applied:
  • A simulation modeling framework for Industry 4.0 based on second-order cybernetics is developed.
  • The interrelationships among manufacturing system areas are described.
  • Managerial conclusions:
  • The current challenges and opportunities for manufacturing systems, digital twins, and manufacturing simulation were described.
  • The selected conceptual model applied to digital twin models can be a key tool in managerial decision making.
Empirical conclusions: To prove the utility of this new concept, a simulation example for a metallurgical manufacturing system was created by applying system dynamics. Three different models were successfully developed: first, an input–output manufacturing process; second, a manufacturing process with a controller; third, a second-order cybernetics manufacturing process with self-regulation. The benefits of the change from an input–output process to a self-optimizing production system are as follows:
  • Global optimization of the production system.
  • Higher manufacturing system availability.
  • Higher product quality.
  • Higher system performance.
  • Higher delivery reliability.
  • Limitations of the research work:
  • Individual interactions among staff, machines, robots, and other elements were not considered in the simulation model.
  • The simulation lacks feedback of the real system with real-time data from the manufacturing plant.
  • The complexity of the metallurgical manufacturer was partially built in the simulation model.
  • The complexity of processes such as steelmaking was not built in detail.
  • The organization structure and interfaces were not considered in the simulation model.
  • Certain quality requirements of the product were not considered.
  • Investment and costs were assumed.
  • Future research based on this study’s findings could focus on the following:
  • Transferring this research method to real production systems and applying it as a digital twin tool or an assistance tool for sales, production, quality, and maintenance leaders by centralizing all data related to the manufacturing system, thereby allowing the simulation of what-if-scenarios, as well as for the monitoring and assessment of the manufacturing system state.
  • Considering organization units and their communication within the simulation model.
  • Improving the model based on implementation feedbacks as well as applying it to production networks with several production plants.
In summary, this study shows the potential benefits of the conceptual approach and the applied simulation case study, allowing for better decision-making for both manufacturing and assembly managers and equipment and service suppliers. This ensures continuous optimization along the manufacturing asset lifecycle. The proposed model offers an example of how manufacturing processes can be assessed, managed, and controlled in an integral way. As a result, the proposed methodology represents a useful tool for organizations and managers in order to increase their efficiency, competitiveness, and, therefore, viability over time. Furthermore, cloud computing and cloud manufacturing offer a new opportunity for enterprises, as they allow them to transform their traditional business models.

Author Contributions

Conceptualization, M.G.-G. and S.G.-G.; methodology, J.R. and S.G.-G.; software and programming, S.G.-G.; validation, J.G.-G. and S.G.-G.; data analysis, S.G.-G.; writing (review and editing), S.G.-G. All authors have read and agreed to the published version of the manuscript.

Funding

This research received no external funding.

Institutional Review Board Statement

Not applicable.

Informed Consent Statement

Not applicable.

Conflicts of Interest

The authors declare no conflict of interest.

References

  1. Stich, V.; Oflazgil, K.; Schröter, M.; Reschke, J.; Jordan, F.; Fuhs, G. Big data implementation for the reaction management in manufacturing systems. In Proceedings of the 2015 XXV International Conference on Information, Communication and Auto-mation Technologies (ICAT), Sarajevo, Bosnia and Herzegovina, 29–31 October 2015; pp. 1–6. [Google Scholar]
  2. Chen, B.; Wan, J.; Shu, L.; Li, P.; Mukherjee, M.; Yin, B. Smart factory of Industry 4.0: Key technologies, application case, and challenges. IEEE Access 2017, 6, 6505–6519. [Google Scholar] [CrossRef]
  3. Ashby, W.R. Principles of the self-organizing system. In Facets of Systems Science; Springer: Boston, MA, USA, 1991; pp. 521–536. [Google Scholar]
  4. Wiendahl, H.P.; ElMaraghy, H.A.; Nyhuis, P.; Zäh, M.F.; Wiendahl, H.H.; Duffie, N.; Brieke, M. Changeable manufac-turing-classification, design and operation. CIRP Ann. 2007, 56, 783–809. [Google Scholar] [CrossRef]
  5. Magnanini, M.C.; Tolio, T.A. A model-based Digital Twin to support responsive manufacturing systems. CIRP Ann. 2021, 70, 353–356. [Google Scholar] [CrossRef]
  6. Vaidya, S.; Ambad, P.; Bhosle, S. Industry 4.0–a glimpse. Procedia Manuf. 2018, 20, 233–238. [Google Scholar] [CrossRef]
  7. Cortés, C.B.Y.; Landeta, J.M.I.; Chacón, J.G.B. El entorno de la industria 4.0: Implicaciones y perspectivas futuras. Concienc. Tecnológica 2017, 54, 33–45. [Google Scholar]
  8. Negri, E.; Fumagalli, L.; Macchi, M. A review of the roles of digital twin in CPS-based production systems. Procedia Manuf. 2017, 11, 939–948. [Google Scholar] [CrossRef]
  9. Schilberg, D.; Meisen, T.; Reinhard, R. Virtual Production-The connection of the modules through the Virtual Pro-duction Intelligence. In Proceedings of the World Congress on Engineering and Computer Science 2013, San Francisco, CA, USA, 23–25 October 2013; Volume 2, pp. 23–25. [Google Scholar]
  10. Thombansen, U.; Schuttler, J.; Auerbach, T.; Beckers, M.; Buchholz, G.; Eppelt, U.; Gloy, Y.-S.; Fritz, P.; Kratz, S.; Klocke, F.; et al. Model-based self-optimization for manufacturing systems. In Proceedings of the 2011 17th International Conference on Concurrent Enterprising, Aachen, Germany, 20–22 June 2011; pp. 1–9. [Google Scholar]
  11. Resman, M.; Pipan, M.; Šimic, M.; Herakovič, N. A new architecture model for smart manufacturing: A performance analysis and comparison with the RAMI 4.0 reference model. Adv. Prod. Eng. Manag. 2009, 14, 153–165. [Google Scholar] [CrossRef] [Green Version]
  12. Wang, Y.; Towara, T.; Anderl, R. Topological approach for mapping technologies in reference architectural model Industrie 4.0 (RAMI 4.0). In Proceedings of the World Congress on Engineering and Computer Science, San Francisco, CA, USA, 25–27 October 2017; Volume 2, pp. 25–27. [Google Scholar]
  13. Suri, K.; Cadavid, J.; Alferez, M.; Dhouib, S.; Tucci-Piergiovanni, S. Modeling business motivation and underlying processes for RAMI 4.0-aligned cyber-physical production systems. In Proceedings of the 2017 22nd IEEE International Conference on Emerging Technologies and Factory Automation (ETFA), Limassol, Cyprus, 12–15 September 2017; pp. 1–6. [Google Scholar]
  14. Reschke, J.; Gallego-García, S. A Novel Methodology for Assessing and Modeling Manufacturing Processes. Appl. Sci. 2021, 11, 10117. [Google Scholar] [CrossRef]
  15. Qin, J.; Liu, Y.; Grosvenor, R. A categorical framework of manufacturing for Industry 4.0 and beyond. Procedia Cirp 2016, 52, 173–178. [Google Scholar] [CrossRef] [Green Version]
  16. Wang, S.; Wan, J.; Li, D.; Zhang, C. Implementing smart factory of industrie 4.0: An outlook. Int. J. Distrib. Sens. Netw. 2016, 12, 3159805. [Google Scholar] [CrossRef] [Green Version]
  17. Schuh, G.; Stich, V.; Wienholdt, H. Logistikmanagement; Springer: Berlin/Heidelberg, Germany, 2013. [Google Scholar]
  18. Perales, D.P.; Valero, F.A.; García, A.B. Industry 4.0: A classification scheme. In Closing the Gap between Practice and Research in Industrial Engineering; Springer: Cham, Switzerland, 2018; pp. 343–350. [Google Scholar]
  19. Wang, X.V.; Xu, X.W. An interoperable solution for cloud manufacturing. Robot. Comput.-Integr. Manuf. 2013, 29, 232–247. [Google Scholar] [CrossRef]
  20. Schwaninger, M. Systemtheorie. In Erweiterte Fassung des Beitrags ‘Systemtheorie’ zum Handwörterbuch der Produktionswirtschaft, 3rd ed.; Schäffer-Poeschel Verlag: Stuttgart, Germany, 2004. [Google Scholar]
  21. Beer, S. Kybernetik und Management; S. Fischer Verlag: Frankfurt, Germany, 1962. [Google Scholar]
  22. Ashby, W.R. An Introduction to Cybernetics; Chapmand & Hall Ltd.: London, UK, 1957. [Google Scholar]
  23. Heylighen, F.; Joslyn, C. Cybernetics and second order cybernetics. Encycl. Phys. Sci. Technol. 2001, 4, 155–170. [Google Scholar]
  24. Groten, M. Integrierte Planung von Distributionsnetzwerken auf Basis des Viable-System Models; Apprimus Verlag Aachen: Aachen, Germany, 2017. [Google Scholar]
  25. Mittal, S.; Khan, M.A.; Romero, D.; Wuest, T. Smart manufacturing: Characteristics, technologies and enabling factors. Proc. Inst. Mech. Eng. Part B J. Eng. Manuf. 2019, 233, 1342–1361. [Google Scholar] [CrossRef]
  26. Keddis, N.; Kainz, G.; Buckl, C.; Knoll, A. Towards adaptable manufacturing systems. In Proceedings of the 2013 IEEE International Conference on Industrial Technology (ICIT), Cape Town, South Africa, 25–28 February 2013; pp. 1410–1415. [Google Scholar]
  27. Habchi, G.; Berchet, C. A model for manufacturing systems simulation with a control dimension. Simul. Modeling Pract. Theory 2003, 11, 21–44. [Google Scholar] [CrossRef]
  28. Campuzano, F.; Bru, J.M. Supply Chain Simulation: A System Dynamics Approach for Improving Performance; Springer Science & Business Media: Berlin/Heidelberg, Germany, 2011. [Google Scholar]
  29. Bonney, M.; Jaber, M.Y. Environmentally responsible inventory models: Non-classical models for a non-classical era. Int. J. Prod. Econ. 2011, 133, 43–53. [Google Scholar] [CrossRef]
  30. 19226, DIN: Leittechnik, Regelungstechnik und Steuerungstechnik. Allgemeine Grundbegriffe, Teil 1; Deutsches Institut für Normung: 1994. Available online: https://www.beuth.de/de/norm/din-19226-1/2229987 (accessed on 10 January 2022).
  31. Frank, U.; Giese, H.; Klein, F.; Oberschelp, O.; Schmidt, A.; Schulz, B.; Vocking, H.; Witting, K. Selbstoptimierende systeme des maschinenbaus. Definitionen und Konzepte. In Sonderforschungsbereich; Deutschen Forschungemeinschaft: Paderborn, Germany, 2004; p. 614. [Google Scholar]
  32. Zürn, M. Referenzmodell für die Fabrikplanung auf Basis von Quality Gates; Jost Jetter Verlag: Heimsheim, Germany, 2010. [Google Scholar]
  33. Auerbach, T.; Bauhoff, F.; Beckers, M.; Behnen, D.; Brecher, C.; Brosze, T.; Esser, M. Selbstoptimierende produktionssysteme. In Integrative Produktionstechnik Für Hochlohnländer; Springer: Berlin, Germany, 2011; pp. 747–1057. [Google Scholar]
  34. Ramsauer, C. Industrie 4.0–die produktion der Zukunft. WINGbusiness 2013, 3, 6–12. [Google Scholar]
  35. Oztemel, E.; Gursev, S. Literature review of Industry 4.0 and related technologies. J. Intell. Manuf. 2020, 31, 127–182. [Google Scholar] [CrossRef]
  36. Tao, F.; Qi, Q. New IT driven service-oriented smart manufacturing: Framework and characteristics. IEEE Trans. Syst. Man Cybern. Syst. 2017, 49, 81–91. [Google Scholar] [CrossRef]
  37. Mourtzis, D.; Angelopoulos, J.; Boli, N. Maintenance assistance application of Engineering to Order manufacturing equipment: A Product Service System (PSS) approach. IFAC-PapersOnLine 2018, 51, 217–222. [Google Scholar] [CrossRef]
  38. Elevli, S.; Elevli, B. Performance measurement of mining equipments by utilizing OEE. Acta Montan. Slovaca 2010, 15, 95. [Google Scholar]
  39. Dhilon, B.S. Maintainability, Maintenance and Reliability for Engineers; Taylor and Francis: Boca Raton, FL, USA, 2006. [Google Scholar]
  40. Jonsson, P.; Lesshammar, M. Evaluation and improvement of manufacturing performance measurement systems—The role of OEE. Int. J. Oper. Prod. Manag. 1999, 19, 55–78. [Google Scholar] [CrossRef] [Green Version]
  41. Hinckeldeyn, J.; Dekkers, R.; Altfeld, N.; Kreutzfeldt, J. Bottleneck-based synchronisation of engineering and manufacturing. In Proceedings of the 19th International Conference on Management of Technology., Cairo, Egypt, 8–11 March 2010. [Google Scholar]
  42. Blackstone, J. APICS Dictionary, 12th ed.; 12. Aufl.; APICS—The Association for Operations Management: Chicago, IL, USA, 2008. [Google Scholar]
  43. Schuh, G.; Potente, T.; Hauptvogel, A. Cyber-physische feinplanung. Hochauflösende Prod. Auf Basis Kybern. Unterstützungssysteme 2013, 4, 336–339. [Google Scholar]
  44. Sterman, J.D. Business Dynamics: Systems Thinking and Modeling for a Complex World; Irwin/McGraw-Hill: New York, NY, USA, 2000. [Google Scholar]
  45. Wensing, T. Periodic Review Inventory Systems; Springer: Berlin, Germany, 2011; Volume 651. [Google Scholar]
  46. Liu, M.; Fang, S.; Dong, H.; Xu, C. Review of digital twin about concepts, technologies, and industrial applications. J. Manuf. Syst. 2021, 58, 346–361. [Google Scholar] [CrossRef]
  47. Lu, Y.; Liu, C.; Kevin, I.; Wang, K.; Huang, H.; Xu, X. Digital Twin-driven smart manufacturing: Connotation, reference model, applications and research issues. Robot. Comput.-Integr. Manuf. 2020, 61, 101837. [Google Scholar] [CrossRef]
Figure 1. Manufacturing process for Industry 4.0: from input–output to second-order cybernetics (own elaboration based on [33]).
Applsci 12 02095 g001
Figure 2. Casual-loop diagram (CLD) for the manufacturing process factors.
Applsci 12 02095 g002
Figure 3. Manufacturing system of the metallurgical case study (own elaboration).
Applsci 12 02095 g003
Figure 4. Manufacturing system state in different periods: decisions from stock and flows.
Applsci 12 02095 g004
Figure 5. The manufacturing process element tree: state and indicators (own elaboration).
Applsci 12 02095 g005
Figure 6. Simulation models (own elaboration).
Applsci 12 02095 g006
Figure 7. Simulation model validation: number of employees (own elaboration).
Applsci 12 02095 g007
Figure 8. Average OEE (%) results for information flow disruptions: low, medium, and high disruptions.
Applsci 12 02095 g008
Figure 9. Average availability rate (%) results for information flow disruptions: low, medium, and high disruptions.
Applsci 12 02095 g009
Figure 10. Average quality rate (%) results for shot peening parameters: low and high average and standard deviation of shot density.
Applsci 12 02095 g010
Table 1. Interrelationships among areas.
No.AreasMoneyInformationMaterialEnergyPersonnelMaintenanceProcessEquipmentOutput
1Money X
2Information[X] XXXXXXX
3Material (X) X X
4Energy (X) X
5Personnel(X) XX
6Maintenance (X) X
7Process (X)(X)(X)(X) (X)X
8Capital
Equipment
(X)(X) (X)X
[X]: Before manufacturing activities related to the asset. X: Related to manufacturing activities before/during manufacturing operation. (X): Feedback of the system related to manufacturing activity.
Table 2. Simulation results.
No.Key Indicator1. Classical
Simulation Model
2. Integrated Manufacturing Simulation Model3. Integrated Manufacturing Simulation Model with Regulation
1∑ Demand (tons)608,660608,660608,660
2Ø Money availability (%)100100100
3Ø Information availability (%)91.093.895.8
3Ø Material availability (%)93.196.0100
4Ø Energy availability (%)91.093.895.8
6Ø Personnel availability (%)93.198.098.0
7Ø Capital equipment availability (%)65.084.089.0
8Ø OEE (%)28.753.174.1
9Ø Availability rate (%)46.663.480.0
10Ø Performance rate (%)74.692.394.3
11Ø Quality rate (%)82.192.998.0
12Labor productivity (tons/empl.*day)0.911.861.96
13Process capability (Cpk)0.831.332.00
14Ø WIP stock (Mio. tons)23.737.837.9
15On-time delivery (%)32.184.395.4
Publisher’s Note: MDPI stays neutral with regard to jurisdictional claims in published maps and institutional affiliations.