
New Ways to Measure Mechanical Losses by Motoring an ICE with Increased Cylinder Pressure


Abstract
:1. Introduction
2. New Ways to Measure Losses by Motoring an ICE with Increased Pressure
2.1. Option A
2.2. Option B
3. Results of Measuring Mechanical Losses by Motoring ICE with Increased Pressure in the Cylinder in New Ways
3.1. Option A—Measurement Results
3.2. Option B—Measurement Results
4. The Working Cycle of Motoring Engine with Permanently Closed Valves—Option A
Calculating Cylinder Load State—Option A
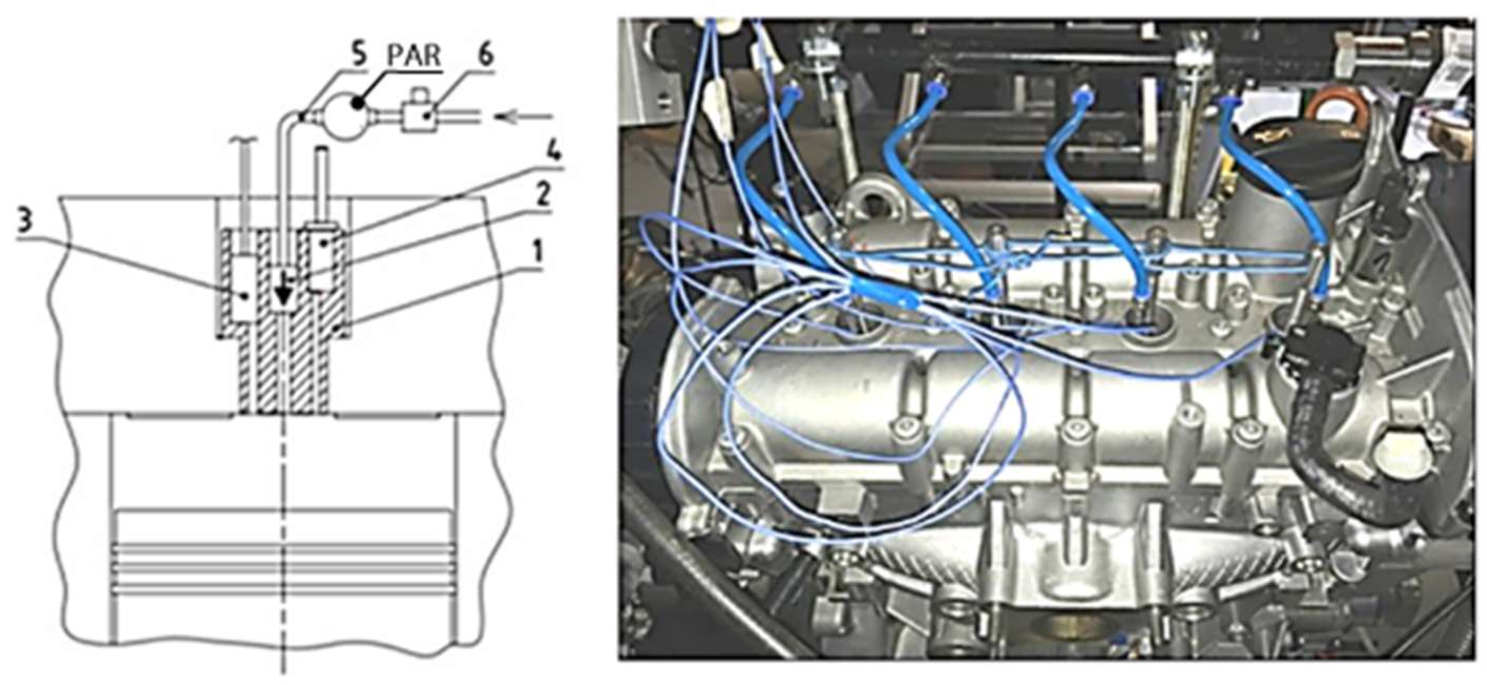
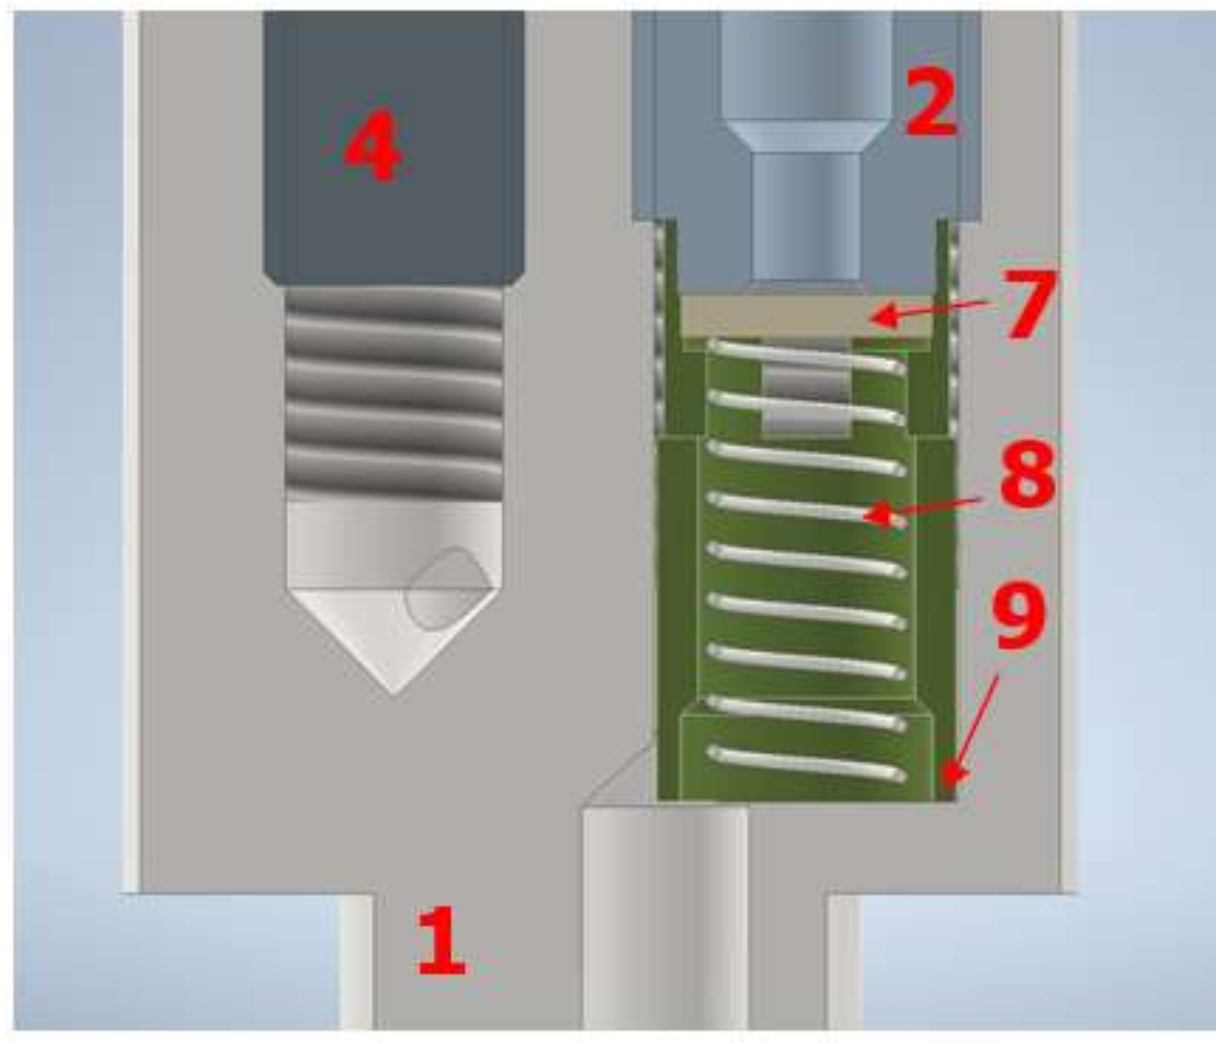
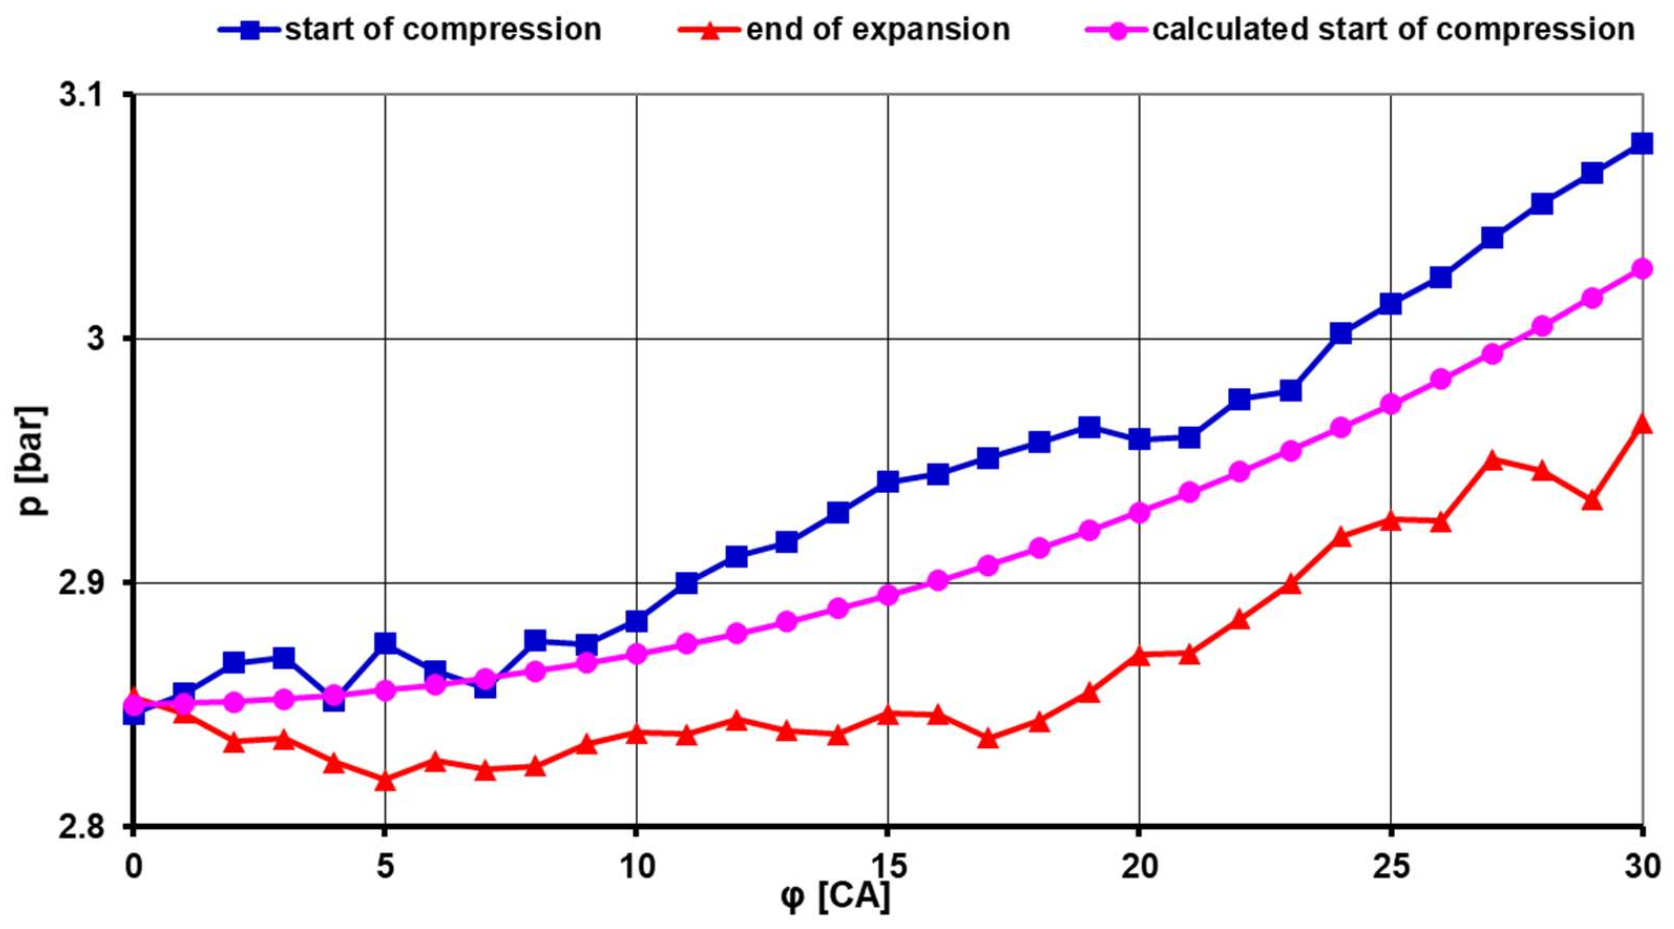
- The flow of the individual cross-sections in the system from the pressurised air reservoir to the cylinder was calculated as a subcritical polytropic discharge of the compressible fluid through the S3 cross-section. The possible critical discharge in the initial phase of the compressed airflow through the S3 section into the cylinder was neglected. In the V3 volume, at the beginning of the discharge, there is always a pPAR pressure which decreases significantly when opening the automatic valve plate as the inflow of compressed air through the SRED cross-section into the V3 volume is lower than the discharge through the S3 cross-section. In addition, the complexity of the flow path (see red line in Figure 21) from the valve to the cylinder virtually eliminates critical discharge. The pressure drop for the discharge through the S3 cross-section was determined in each addressed cycle by the difference of the mean pressure in the V3 volume at the discharge of the compressed air through the S3 cross-section (a simplistically constant mean pressure during the discharge, close to the pBDCmeasured value) and the instantaneous pressure in the p180 cylinder, as calculated;
- The temperature of the compressed air introduced into the cylinder by the self-adjusting valve was estimated to be Tair blow in = 350 K (polytropic discharge through cross-section S3 with internal losses and heating of the flowing air through the valve walls and through the cylinder air inlet ducts, which are in the hottest part of the cylinder head);
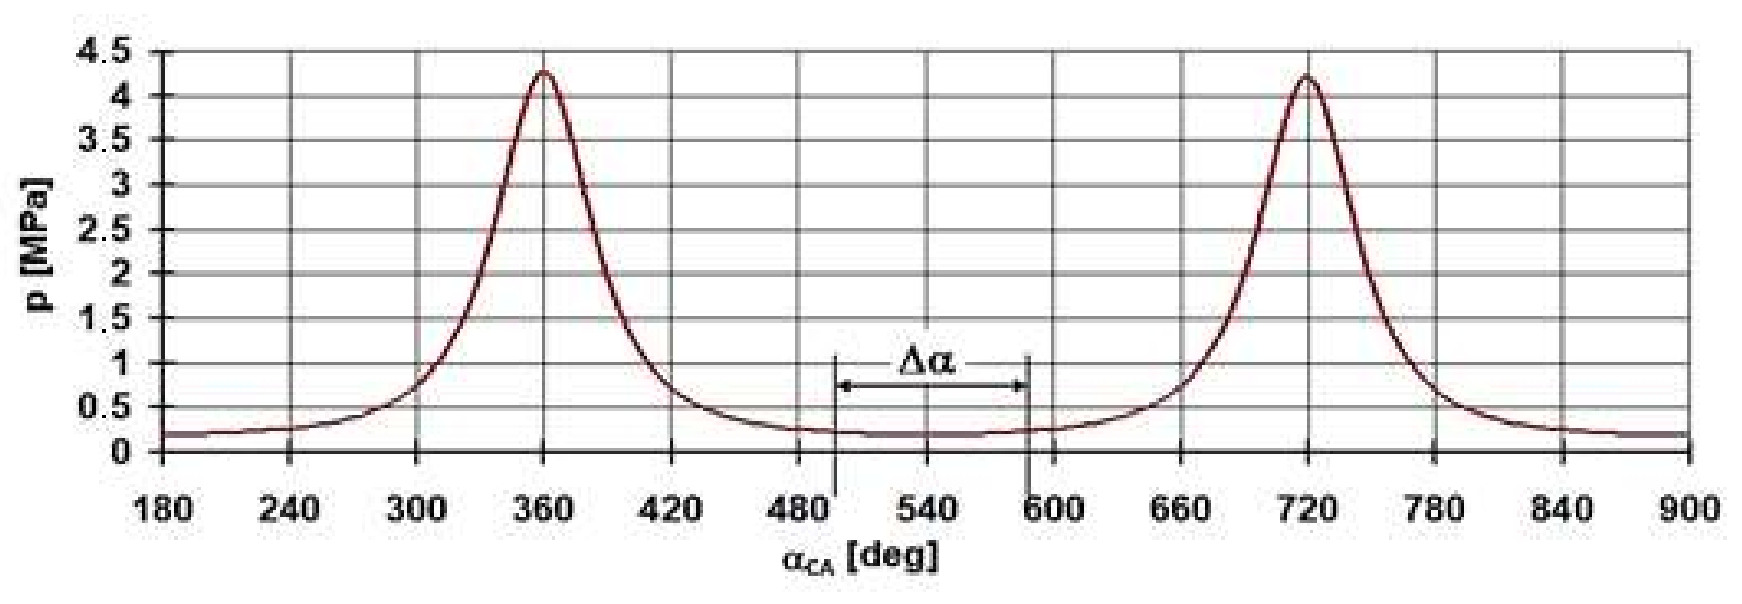
- Compressed air is infused into the cylinder in the area Δφ around the BDC. The values of Δφ were, according to p-φ diagrams on Figure 21, significantly higher than initially anticipated. In virtually all modes, they point to a vector area of approximately 200 °CA around the BDC, therefore, taking into account some plate motion dynamics in the self-closing valve; the range Δφ = 150 °CA was set for the calculations;
- Projects also influenced the state of the filling in the cylinder during the motoring: the props were simplified in each cycle by recalculating the measured props in a given motoring mode in the pressure ratio of BDC p180(calculated)/p180(measured) by the gradual loss of the mass of the cylinder filling so that when the steady state was reached (i.e., p180(calculated) = p180(measured)) the calculated mass of the cylinder load was reduced by the measured props in the cranking mode under investigation. Thus, at a steady state, the state of ΔMblow in ≅ ΔMblow out will be balanced (the calculation allows some correction in the calculation settings for ΔMblow in).
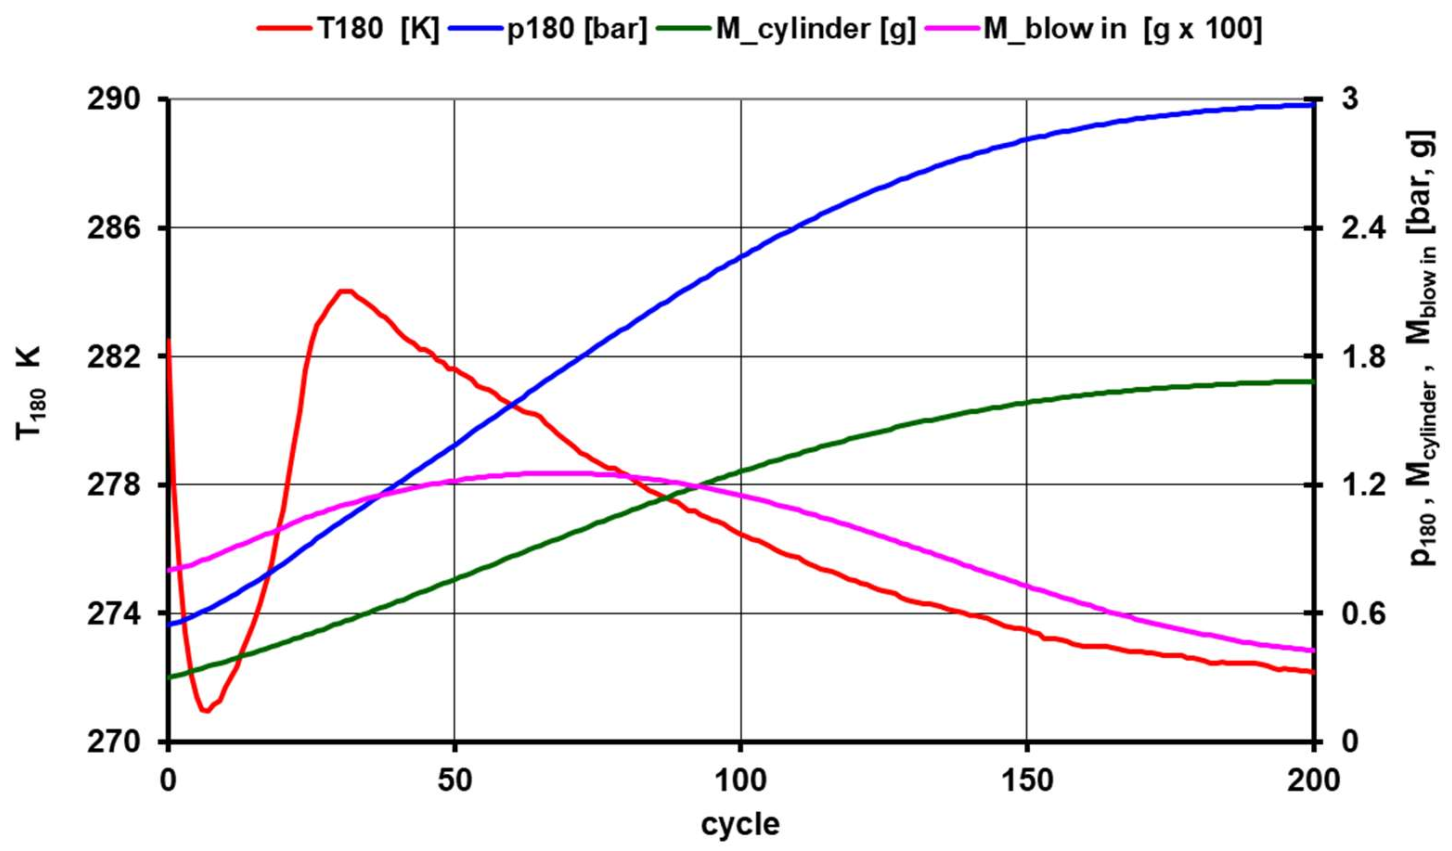
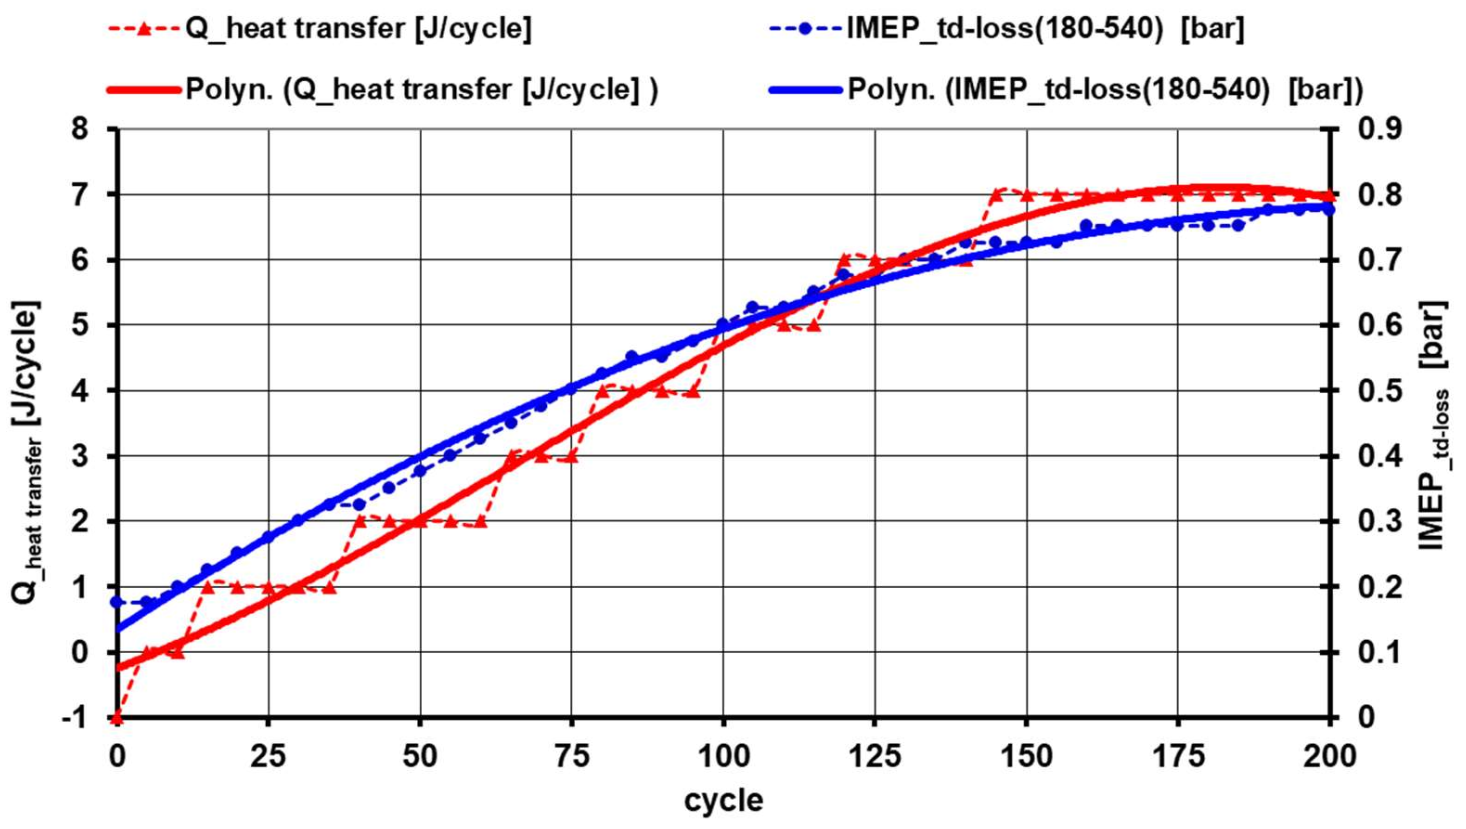
- Thermal-technical modelling of the working cycles took place sequentially from cycle No. 0 so that after determining the pressure, the weight and temperature of the filling in BDC (after including the calculated mass of heat and profuse for the cycle, which was counted as single doses in BDC), the mass and pressure in BDC(180) were inserted as input into the adjusted calculation program. The calculation of polytropic compression and expansion resulted in a temperature of TBDC(540), with which modelling of the next cycle began in the same process as in the previous cycle. An important quantity in working cycle modelling is determining the mean temperature of the walls in the cylinder. After a series of test calculations with different Tmean wall settings, Tmean wall = 390 K (cycle No.0) was selected for the 3000 min−1 and pPAR = 6 bar motoring mode, with a gradual increase up to Tmean wall = 420 K in cycle No. 30 as a result of the calculations of incremental changes (till the cycle No. 200) in the cylinder workload (mass, pressure and temperature in BDC(180)) the calculated masses of the heat, blow-in and blow-out, IMEP_td-loss) (bar/cycle), Q_heat transfer (J/cycle) and pmax(360) (bar) were evaluated in each cycle. The runs of these quantities were plotted graphically and compared with the measurements taken in the appropriate motoring mode (mean values from statistical evaluation of data from the high-pressure indication and its thermodynamic analysis). Selected results are shown in Table 4, complete results are shown in Figure 22.
5. Discussion
6. Conclusions
Author Contributions
Funding
Institutional Review Board Statement
Informed Consent Statement
Data Availability Statement
Conflicts of Interest
Abbreviations
| Abbreviation/Symbol | Description | Unit |
| (C-E) | Compression—expansion | |
| (Ex-In) | Exhaust—Intake | |
| 3D | Three-dimensional | |
| BDC(180) | Bottom dead centre | |
| CI Engine | Compressed ignition engine | |
| CO2 | Carbon dioxide | |
| EURO VII | European emission standard VII | |
| ICE | Internal combustion engine | |
| IMEP | Indicated mean effective pressure | [bar] |
| IMEP_loss(in-ex) | Indicated mean effective pressure loss of cylinder volume exchange | [bar] |
| IMEP_loss(sum) | Sum of loss indicated mean effective pressures | [bar] |
| IMEP_mech-loss | Indicated mean effective pressure of mechanical losses | [bar] |
| IMEP_mech-loss(C-E) | Indicated mean effective pressure of mechanical losses for compression and expansion | [bar] |
| IMEP_td-loss | Indicated mean effective pressure of thermodynamic losses | [bar] |
| IMEP_td-loss(calculated) | Indicated mean effective pressure of thermodynamic losses—calculated | [bar] |
| IMEP_td-loss(measured) | Indicated mean effective pressure of thermodynamic losses—measured | [bar] |
| IMEPH | High-pressure part indicated mean effective pressure | [bar] |
| IMEPL | Low-pressure part indicated mean effective pressure | [bar] |
| Mair | Mass of air charge in the cylinder | [g] |
| Mcylinder | The weight of the cylinder charge | [g] |
| MPI | Multipoint injection | |
| p180 | Pressure for the initial cycle | [bar] |
| p180(calculated) | Pressure for the initial cycle—calculated | [bar] |
| p180(measured) | Pressure for the initial cycle—measured | [bar] |
| PAR | Pressured air reservoir | |
| pBDC | Bottom dead centre pressure | [bar] |
| pBDC(measured) | Maximum bottom dead centre pressure—measured | [bar] |
| pBDCmax | Maximum bottom dead centre pressure | [bar] |
| pBDCmin | Minimum bottom dead centre pressure | [bar] |
| PC | Personal computer | |
| pmax | Maximum in-cylinder pressure | [bar] |
| pmax(360) | Maximum pressure for the entire operating cycle | [bar] |
| Polyn.(IMEP_td-loss(180-540) [bar]) | Polynomic curve for indicated mean effective pressure of thermodynamic losses | [J/cycle] |
| Polyn.(Qheat_transfer [J/cycle]) | Polynomic curve for heat transfer | [J/cycle] |
| ppar | Pressure inside pressured air reservoir | [bar] |
| pTDC | Top dead centre pressure | [bar] |
| pTDC(measured) | Minimum top dead centre pressure—measured | [bar] |
| pTDCmax | Maximum top dead centre pressure | [bar] |
| pTDCmin | Minimum top dead centre pressure | [bar] |
| Qheat_transfer | Heat transfer | [J/cycle] |
| S1 | Output cross-section (with full plate stroke) | [mm2] |
| S2 | Cross-section | [mm2] |
| S3 | Cross-section | [mm2] |
| SI Engine | Spark-ignition engine | |
| SRED_cross-section | Reduced cross-section | [mm2] |
| T180 | Temperature for the initial cycle | [bar] |
| Tair_blow_in | Estimated temperature of the compressed air supplied by the automatic valve to the cylinder | [K] |
| TBDC(180) | Bottom dead centre for the initial cycle | [K] |
| TBDC(540) | Bottom dead centre temperature | [K] |
| Tmean_wall | Wall mean temperature | [K] |
| Tq_loss | Torque loss | [Nm] |
| V1 | Pressure hose volume | [mm3] |
| V2 | Volume of tube terminated by a self-closing plate valve | [mm3] |
| V3 | Sum of volumes V1 and V2 | [mm3] |
| ΔMblow_in | Mass of blow-in | [g/cycle] |
| ΔMblow_out | Mass of blow-out | [g/cycle] |
| Δφ | Crankshaft rotation range | [°CA] |
References
- Beroun, S.; Páv, K. Selected Topics of Vehicle Combustion Engines, 1st ed.; TU Liberec: Liberec, Czech Republic, 2017; p. 149. ISBN 978-80-7372-957-8. [Google Scholar]
- Beroun, S.; Voženílek, R. Measurement of Passive Engine Resistances (Complete Engine and Its Selected Groups) by Cranking. Research Report DVE 617/2009; TU Liberec: Liberec, Czech Republic, 2009; p. 13. [Google Scholar]
- Procházka, R.; Dittrich, A. TN01000026-1-WP02-007 Measuring mechanical losses of piston combustion engine by spinning at various working pressures in engine cylinders. In Proceedings of the M2D2019 8th International Conference Mechanics and Materials in Design, Bologna, Italy, 4–6 September 2019; Società Editrice Esculapio: Bologna, Italy, 2019; pp. 65–66. [Google Scholar]
- Voženílek, R.; Beroun, S.; Dittrich, A. Measuring the passive resistance of the piston combustion engine by cranking with increase pressure in cylinder. In Proceedings of the XLVIII International Scientific Conference of Czech and Slovak University Departments and Institutions Dealing with the Research of Combustion Engines, Liberec, Czech Republic, 11–12 September 2017; pp. 191–198, ISBN 978-80-7494-354-6. [Google Scholar]
- Novotný, P.; Píštěk, V.; Drapál, L. Modelling of Piston Ring Pack Dynamics; Journal MECCA IX/02; Czech Technical University in Prague: Prague, Czech Republic, 2011; pp. 8–12. ISSN 1214-0821. [Google Scholar]
- Hopfner, W.; Lösch, S.; Satschen, S.; Winklhofer, E. Friction test procedures in engine development. In Proceedings of the Conference: 5. Tribologie und Effizienztagung, Györ, Hungary, 19–20 June 2018; Available online: https://www.researchgate.net/publication/328723117_Friction_test_procedures_in_engine_development/stats (accessed on 8 December 2021).
- Knauder, C.; Allmaier, H.; Sander, D.E.; Sams, T. Investigations of the Friction Losses of Different Engine Concepts. Part 1: A Combined Approach for Applying Subassembly-Resolved Friction Loss Analysis on a Modern Passenger-Car Diesel Engine. Lubricants 2019, 7, 39. [Google Scholar] [CrossRef] [Green Version]
- Knauder, C.; Allmaier, H.; Sander, D.E.; Sams, T. Investigations of the Friction Losses of Different Engine Concepts. Part 2: Sub-Assembly Resolved Friction Loss Comparison of Three Engines. Lubricants 2019, 7, 105. [Google Scholar] [CrossRef] [Green Version]
- Allmaier, H.; Knauder, C.; Salhofer, S.; Reich, F.; Schalk, E.; Ofner, H.; Wagner, A. An experimental study of the load and heat influence from combustion on engine friction. Int. J. Engine Res. 2015, 17, 347–353. [Google Scholar] [CrossRef]
- Voženílek, R.; Beroun, S.; Procházka, R. New Method of Measuring Mechanical Losses by Motoring of Internal Combustion Engine. In Proceedings of the 51th International Scientific Conference of Czech and Slovak University Departments and Institutions Dealing with the Research of Internal Combustion Engines, CTU Prague, Czech Republic, 9–10 September 2020; pp. 60–69, ISBN 978-80-01-06744-4. [Google Scholar]
- Mikulanin, L.; Dittrich, A.; Dráb, O. Measurement of the Passive Resistance of the 1.6 MPI Engine at the Spinning Station; TU Liberec: Liberec, Czech Republic, 2015; Unpublished DVE Working Document. [Google Scholar]
- Beroun, S. The State of the Cylinder Filling when Motoring the ICE without Replacing the Filling and Controlled Air Supply for Increasing Pressure; TU Liberec: Liberec, Czech Republic, 2020; Research Report DVE. [Google Scholar]


| GROUP (Indicative Values of Mechanical Losses in % of Indicated ICE Power at 100% Load) | SI Engine [%] | CI Engine [%] |
|---|---|---|
| Cylinder cartridge replacement | 3.5 | 3.5 |
| Water, oil and injection pump | 1.0 | 1.5 |
| Valve distribution and actuator accessories | 1.5 | 1.5 |
| Losses in main and connecting rod bearings | 4.0 | 6.0 |
| Friction of the piston and piston rings in the cylinder | 8.0 | 12.5 |
| Total | 18 | 25 |
| LOSSES (Indicative Values of the Share of the Main Groups of Losses in the Total Loss of Mechanical Energy in ICE at 100% Load) | SI Engine [%] | CI Engine [%] |
|---|---|---|
| The friction between piston–cylinder (rings–cylinder) | 45 | 50 |
| The friction of crankshaft and camshaft bearings | 23 | 24 |
| Engine cylinder replacement losses | 20 | 14 |
| Timing mechanism drive | 6 | 6 |
| Drive of auxiliary units | 6 | 6 |
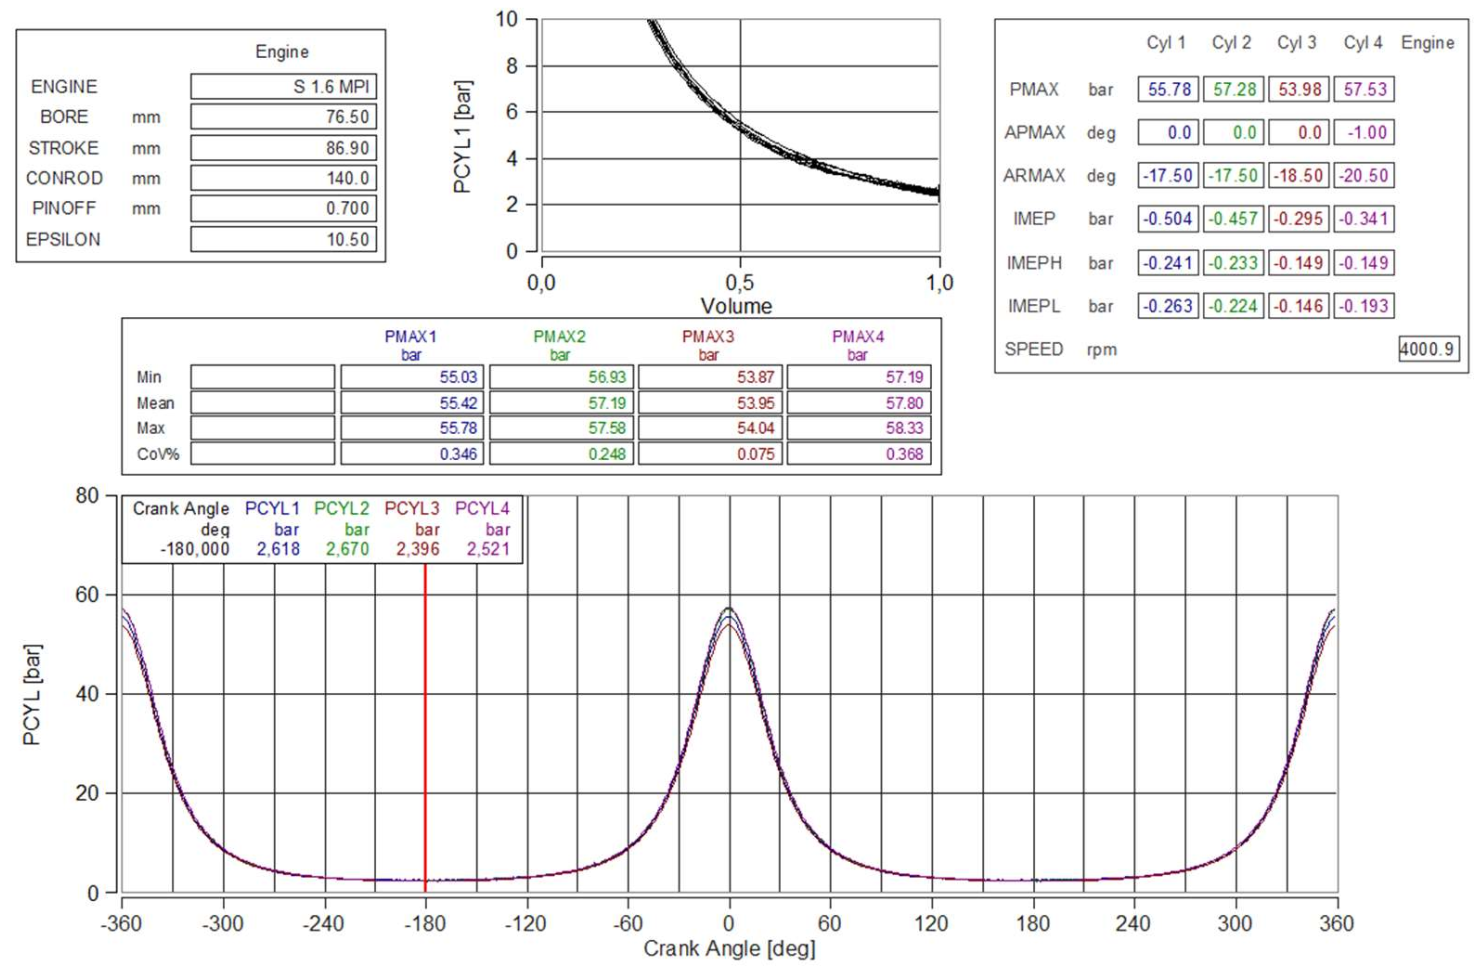
| Type | SI, 4 Cylinder Inline, Naturally Aspirated |
|---|---|
| Bore × Stroke | 76.5 × 86.9 mm |
| Displacement | 1597.7 cm3 |
| Compression ratio | 10.5:1 |
| Maximum power | 80 kW |
| Maximum torque | 150 Nm |
| Cooling system | water |
| Initial State in the Cylinder (Estimated) | p180 | 0.55 bar |
| Mair | 0.3 g | |
| Air Pressure Setting in the Rail | pPAR | 6 bar |
| Steady State in the Cylinder After | 200 cycles | 4 s |
| Monitored Quantities in Cycle no. 200 | p180 | 2.98 bar |
| p180(measured) | 3.0 bar | |
| pmax | 66 bar | |
| pmax average | 67.6 bar | |
| TBDC (180) | 272 K | |
| Mair | 1.69 g | |
| ∆Mblow in | 0.004 g/cycle | |
| ∆Mblow out | 0.0036 g/cycle |
Publisher’s Note: MDPI stays neutral with regard to jurisdictional claims in published maps and institutional affiliations. |
© 2022 by the authors. Licensee MDPI, Basel, Switzerland. This article is an open access article distributed under the terms and conditions of the Creative Commons Attribution (CC BY) license (https://creativecommons.org/licenses/by/4.0/).
Share and Cite
Procházka, R.; Dittrich, A.; Voženílek, R.; Beroun, S. New Ways to Measure Mechanical Losses by Motoring an ICE with Increased Cylinder Pressure. Appl. Sci. 2022, 12, 2155. https://doi.org/10.3390/app12042155
Procházka R, Dittrich A, Voženílek R, Beroun S. New Ways to Measure Mechanical Losses by Motoring an ICE with Increased Cylinder Pressure. Applied Sciences. 2022; 12(4):2155. https://doi.org/10.3390/app12042155
Chicago/Turabian StyleProcházka, Radek, Aleš Dittrich, Robert Voženílek, and Stanislav Beroun. 2022. "New Ways to Measure Mechanical Losses by Motoring an ICE with Increased Cylinder Pressure" Applied Sciences 12, no. 4: 2155. https://doi.org/10.3390/app12042155