
Laser Vibration Characteristics of Marble Specimens and Failure Criterion


Abstract
:1. Introduction
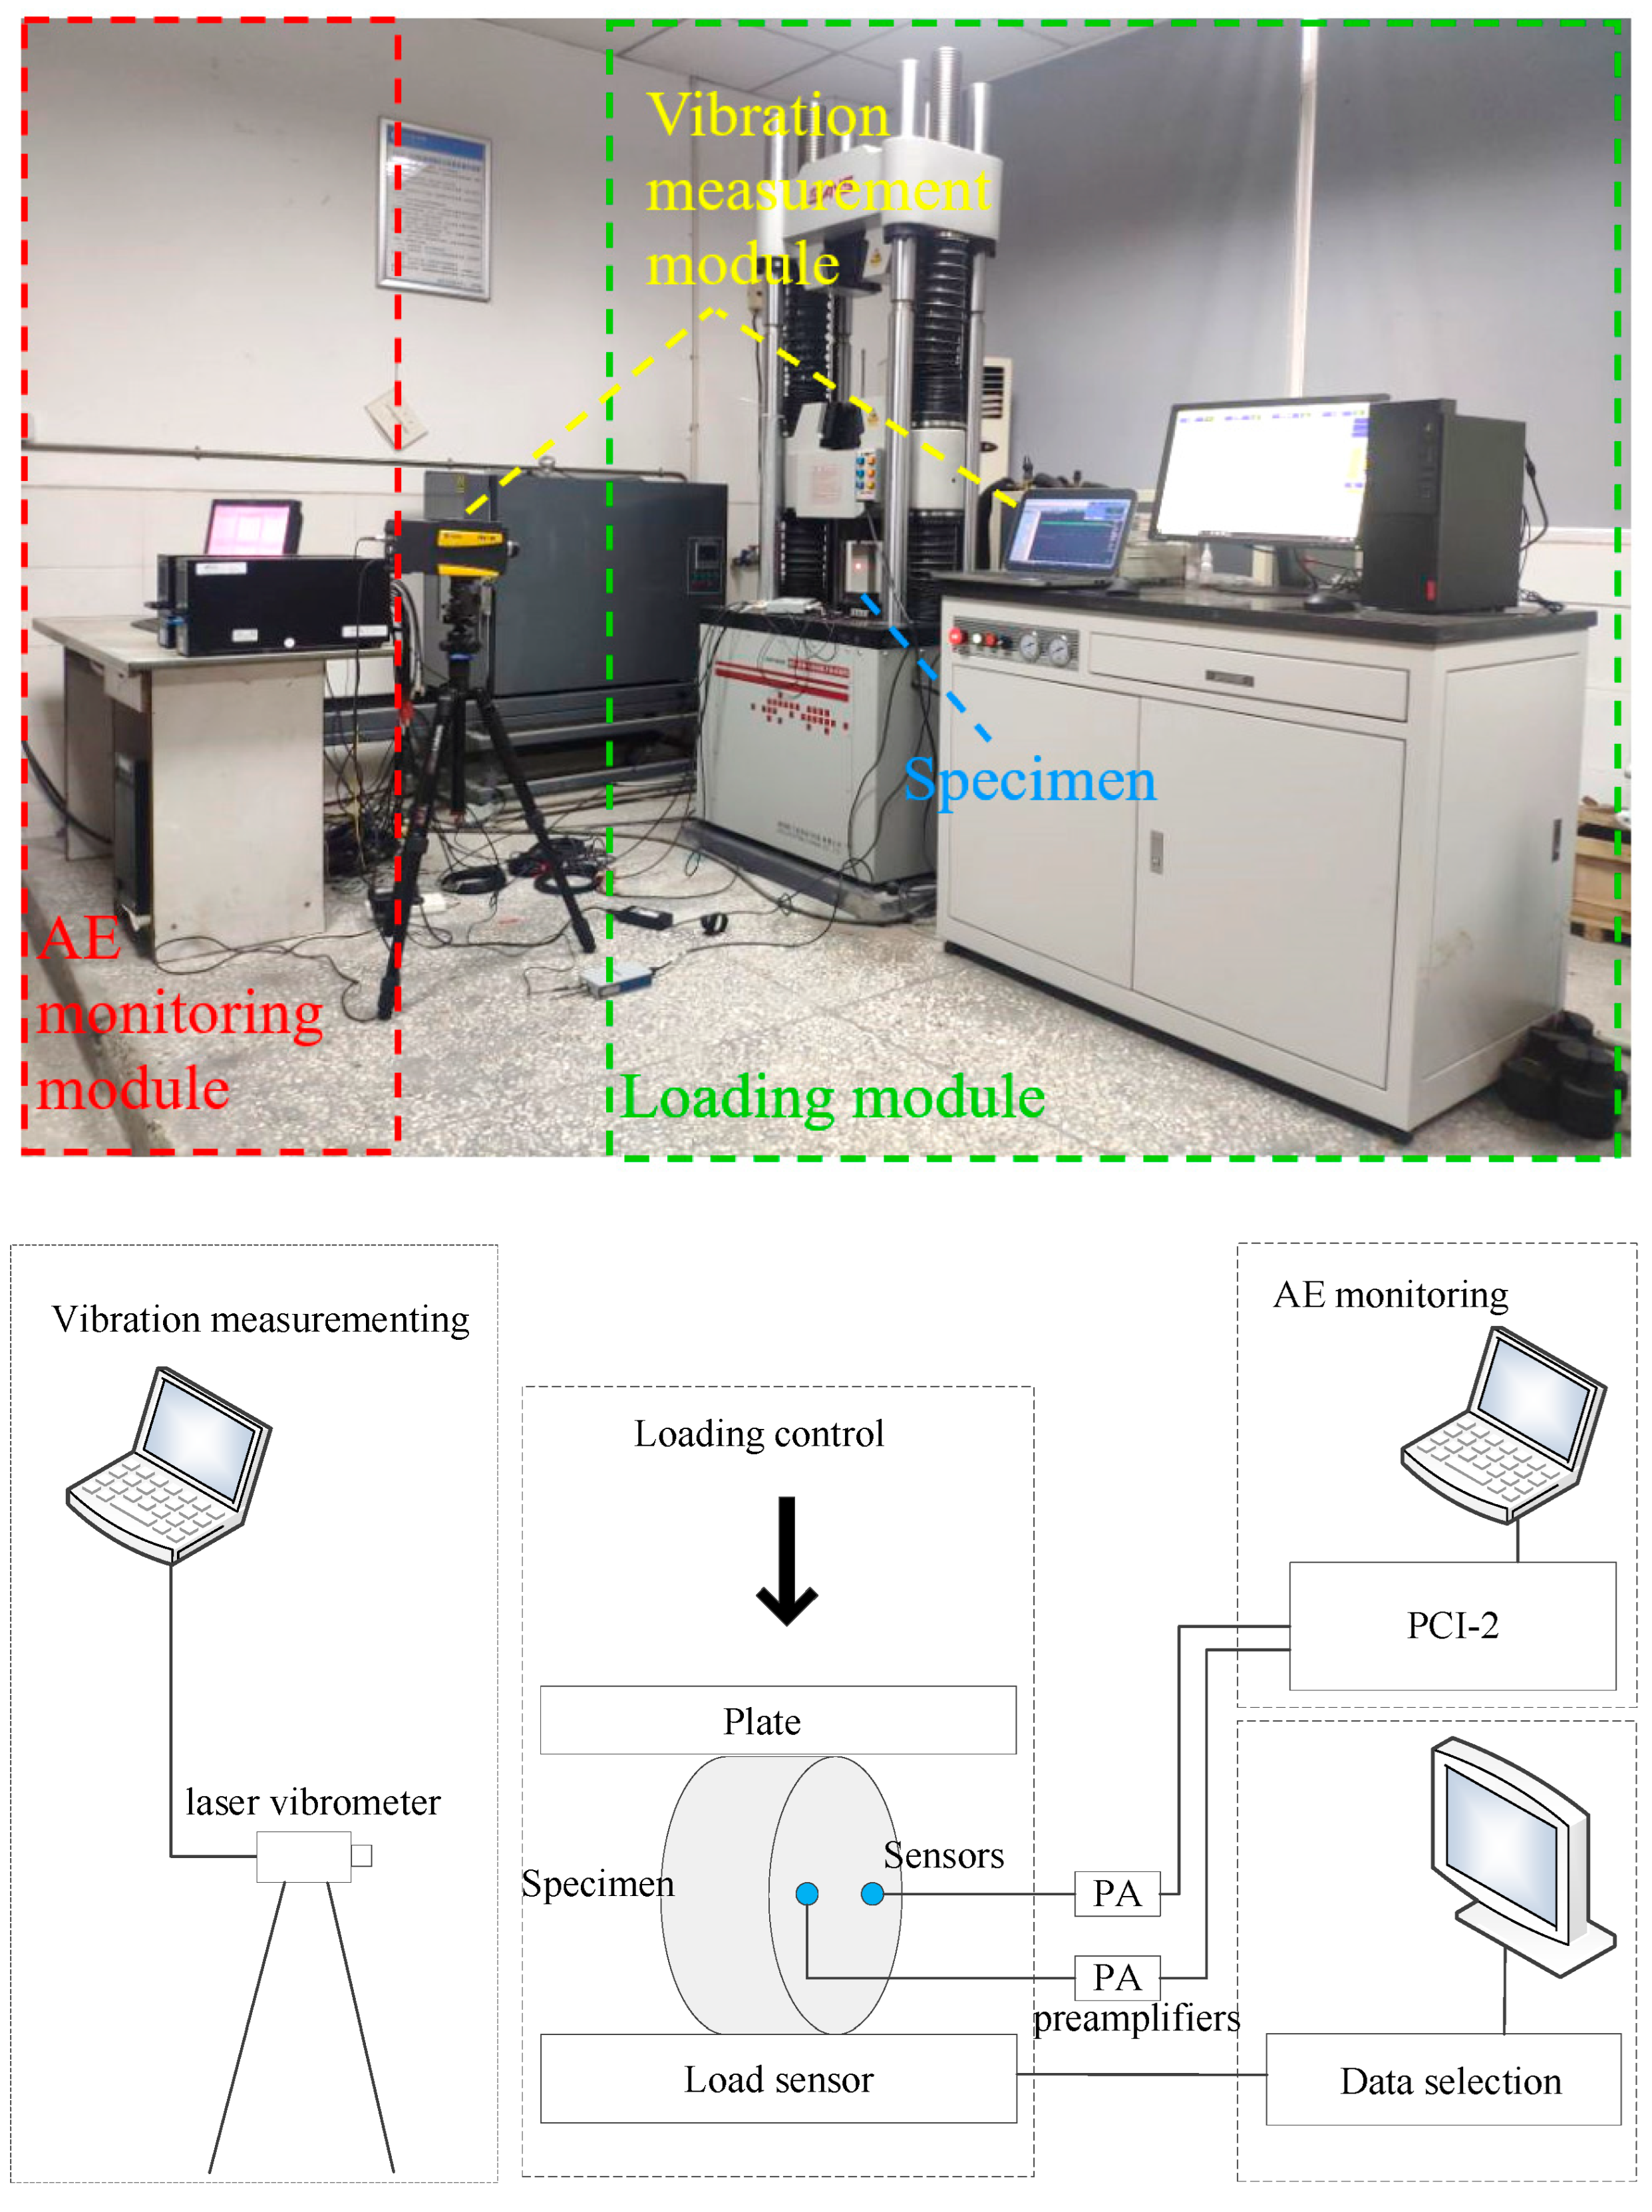
2. Experiment Setup
2.1. Testing System
2.2. Specimen Preparation
3. Results
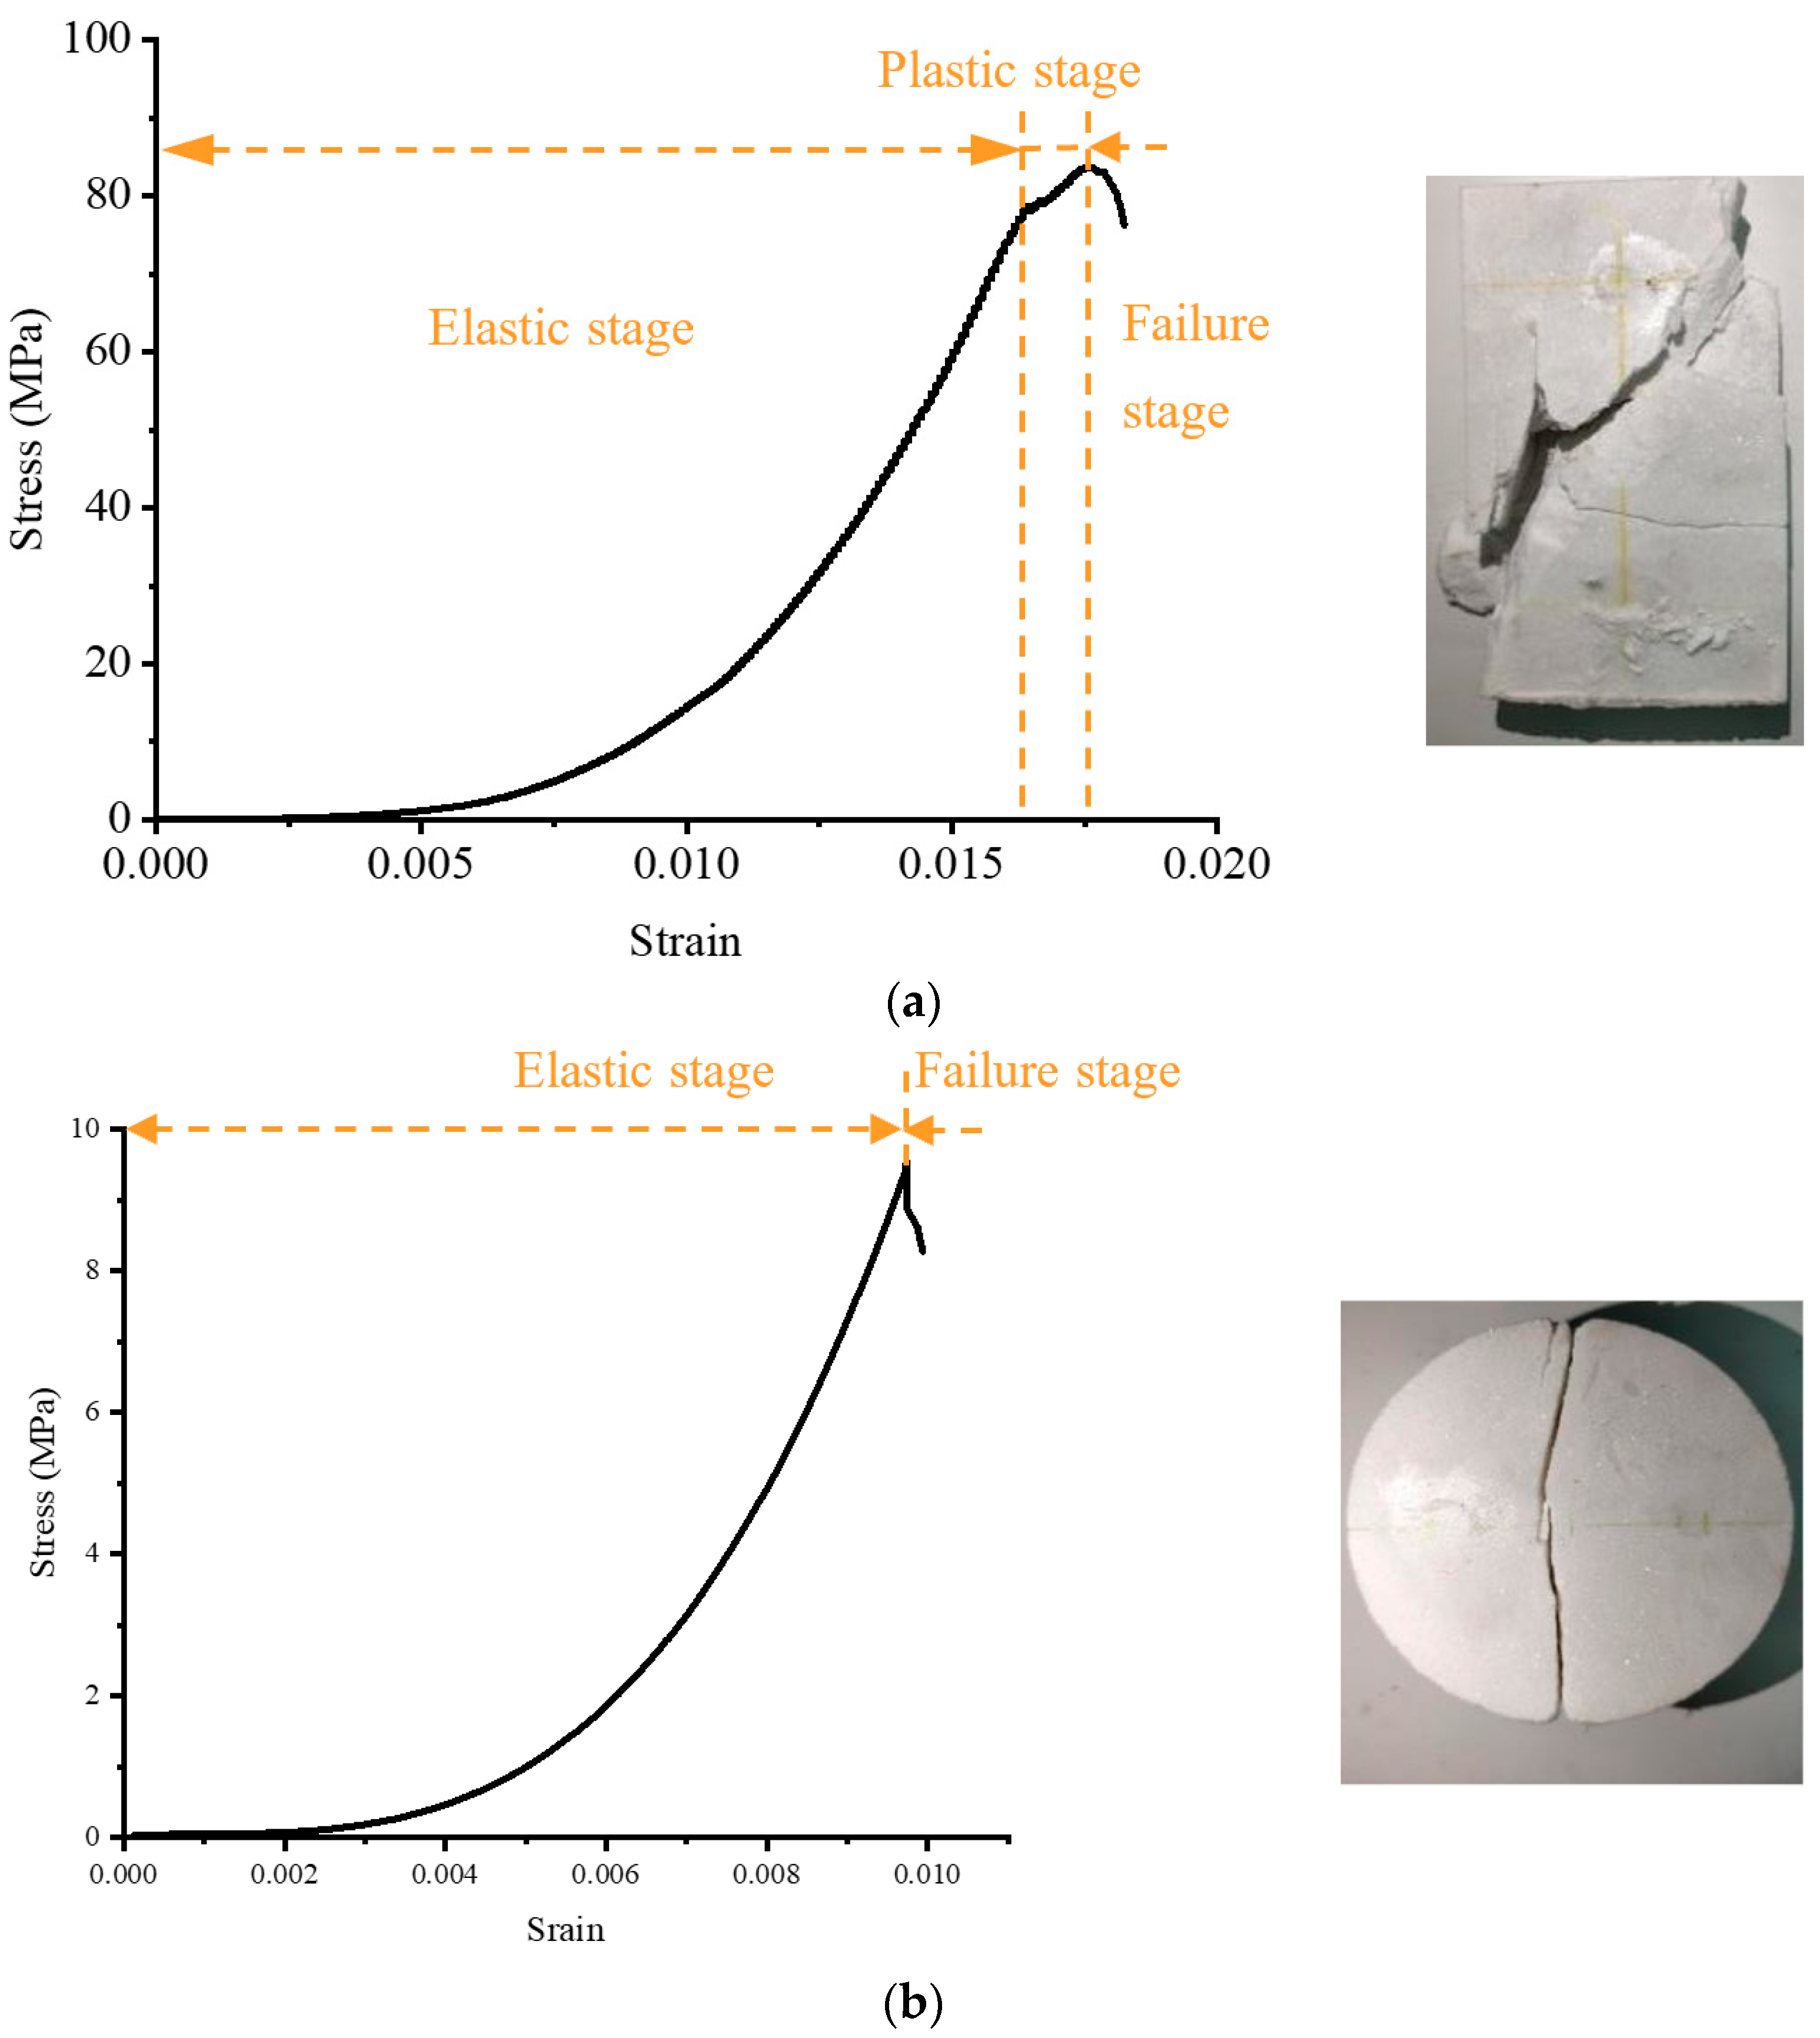
3.1. Failure of Marble Specimens
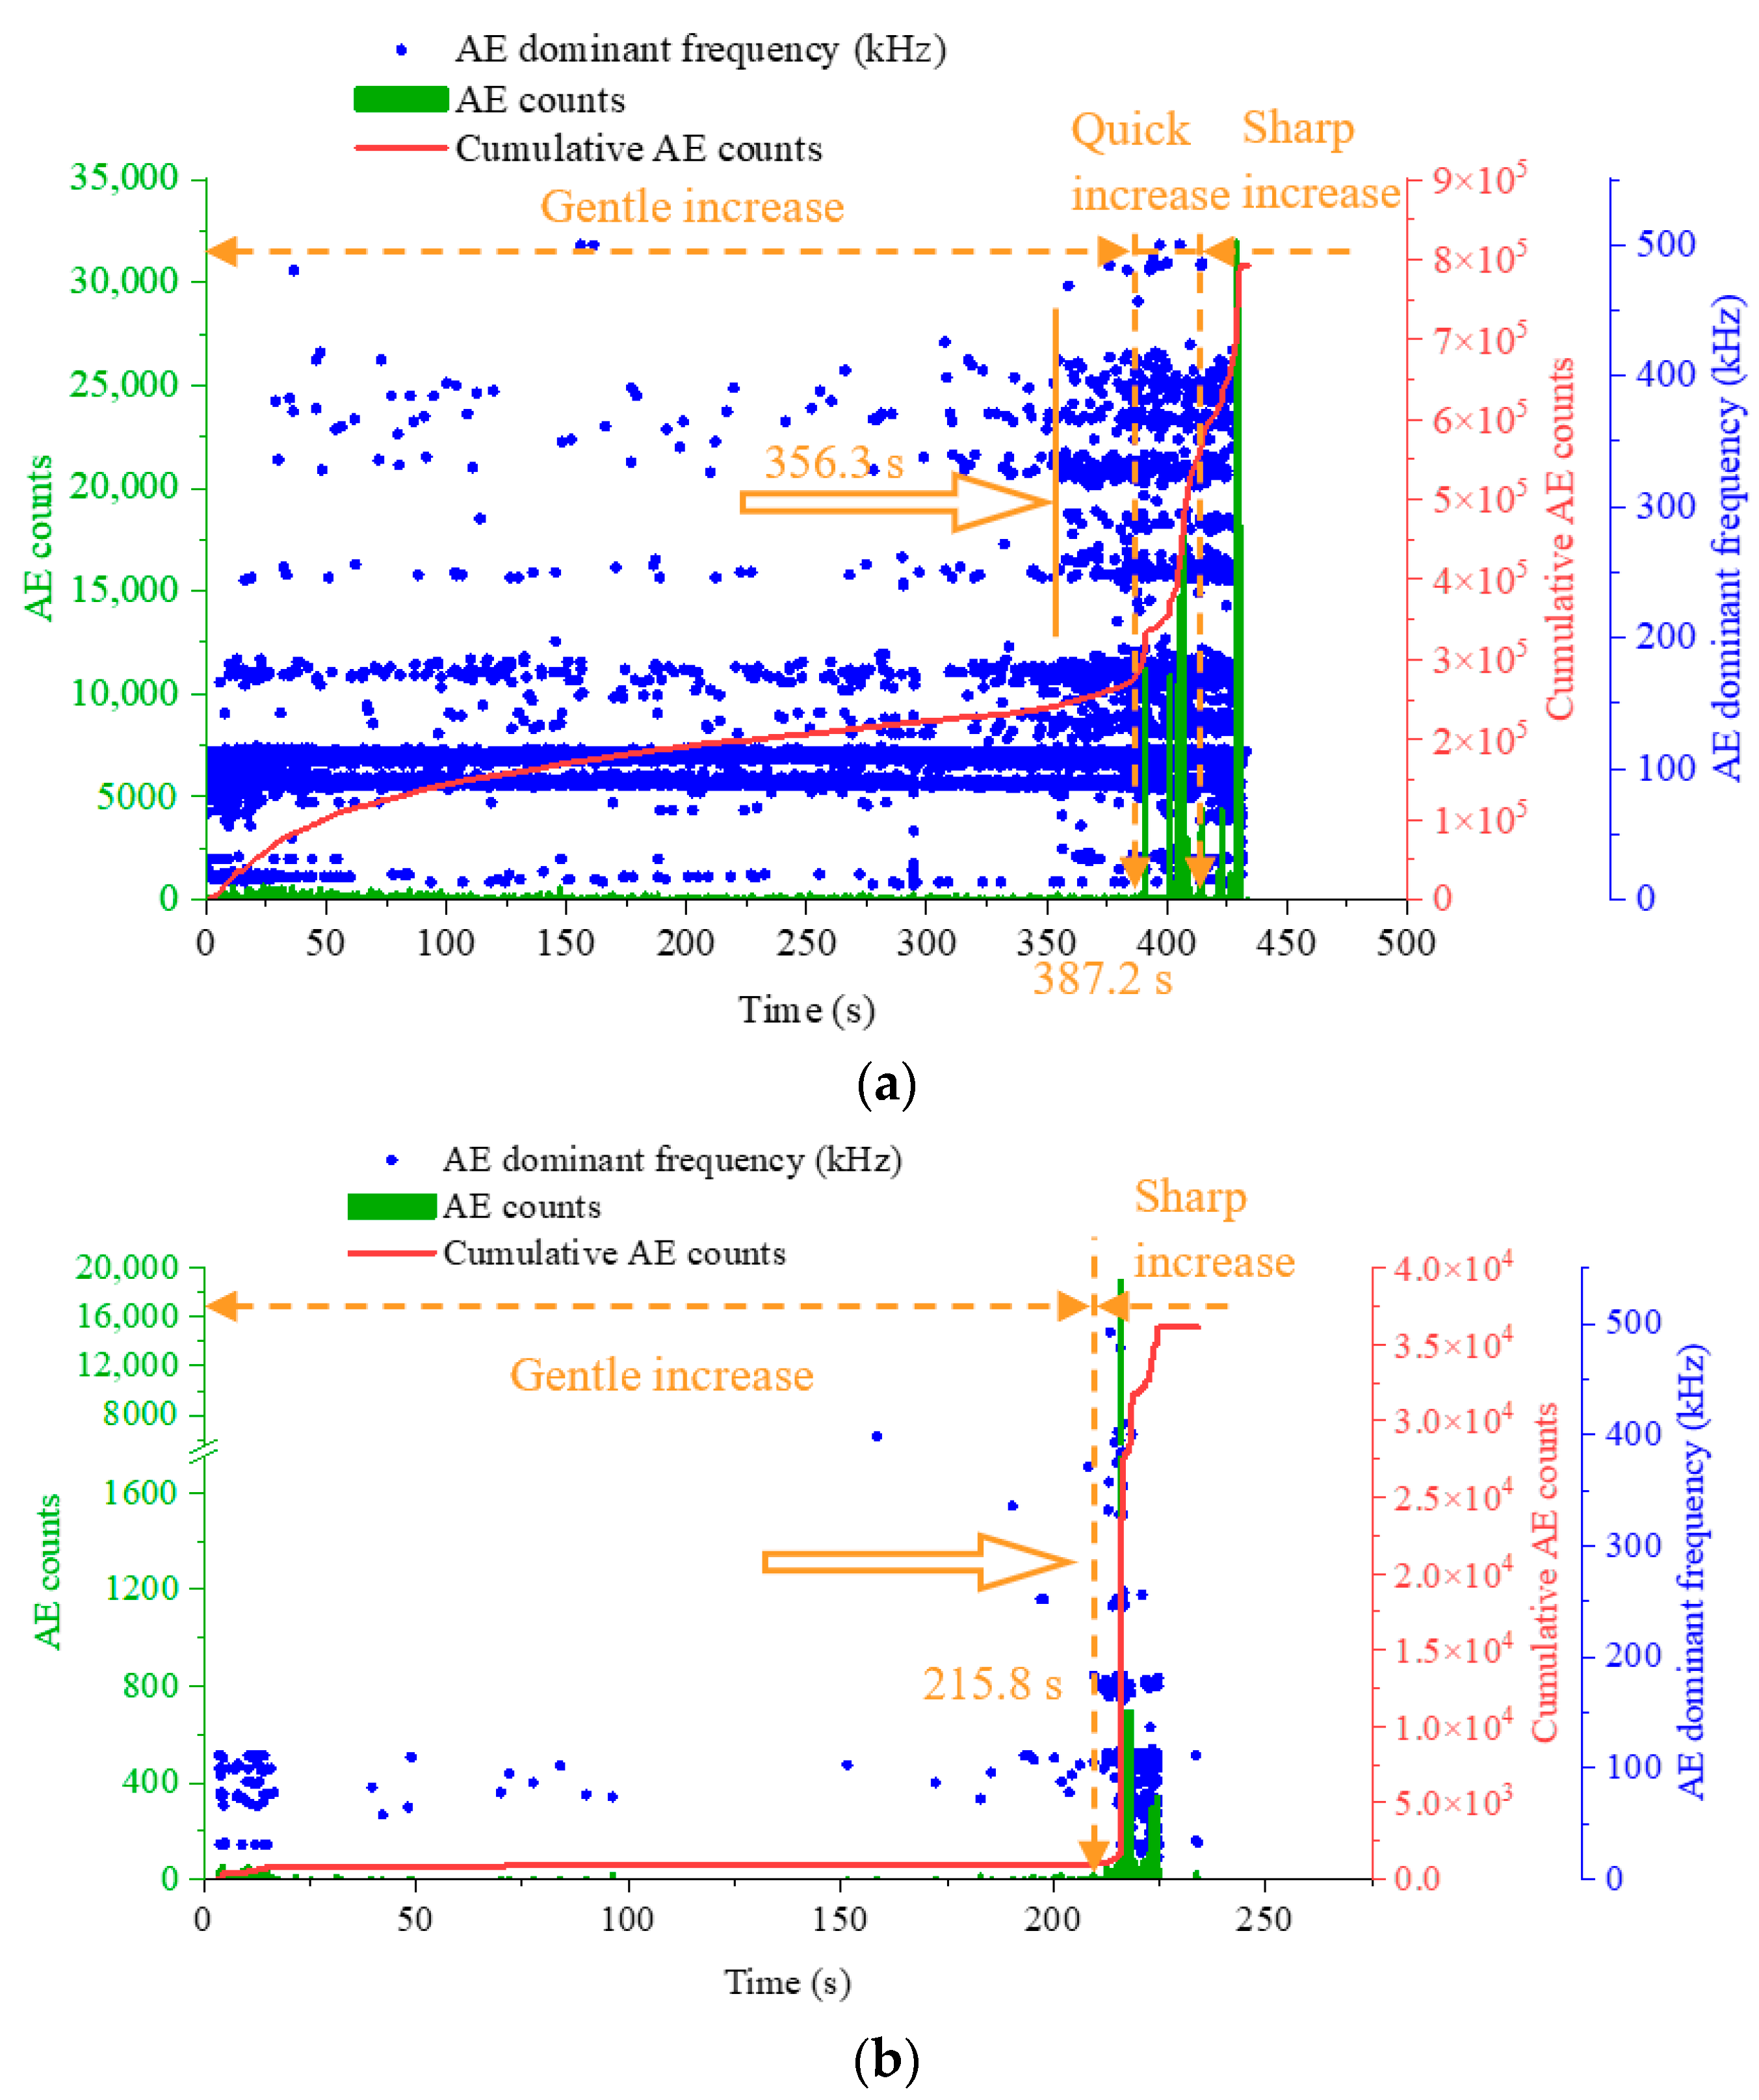
3.2. Characteristics of AE Signals
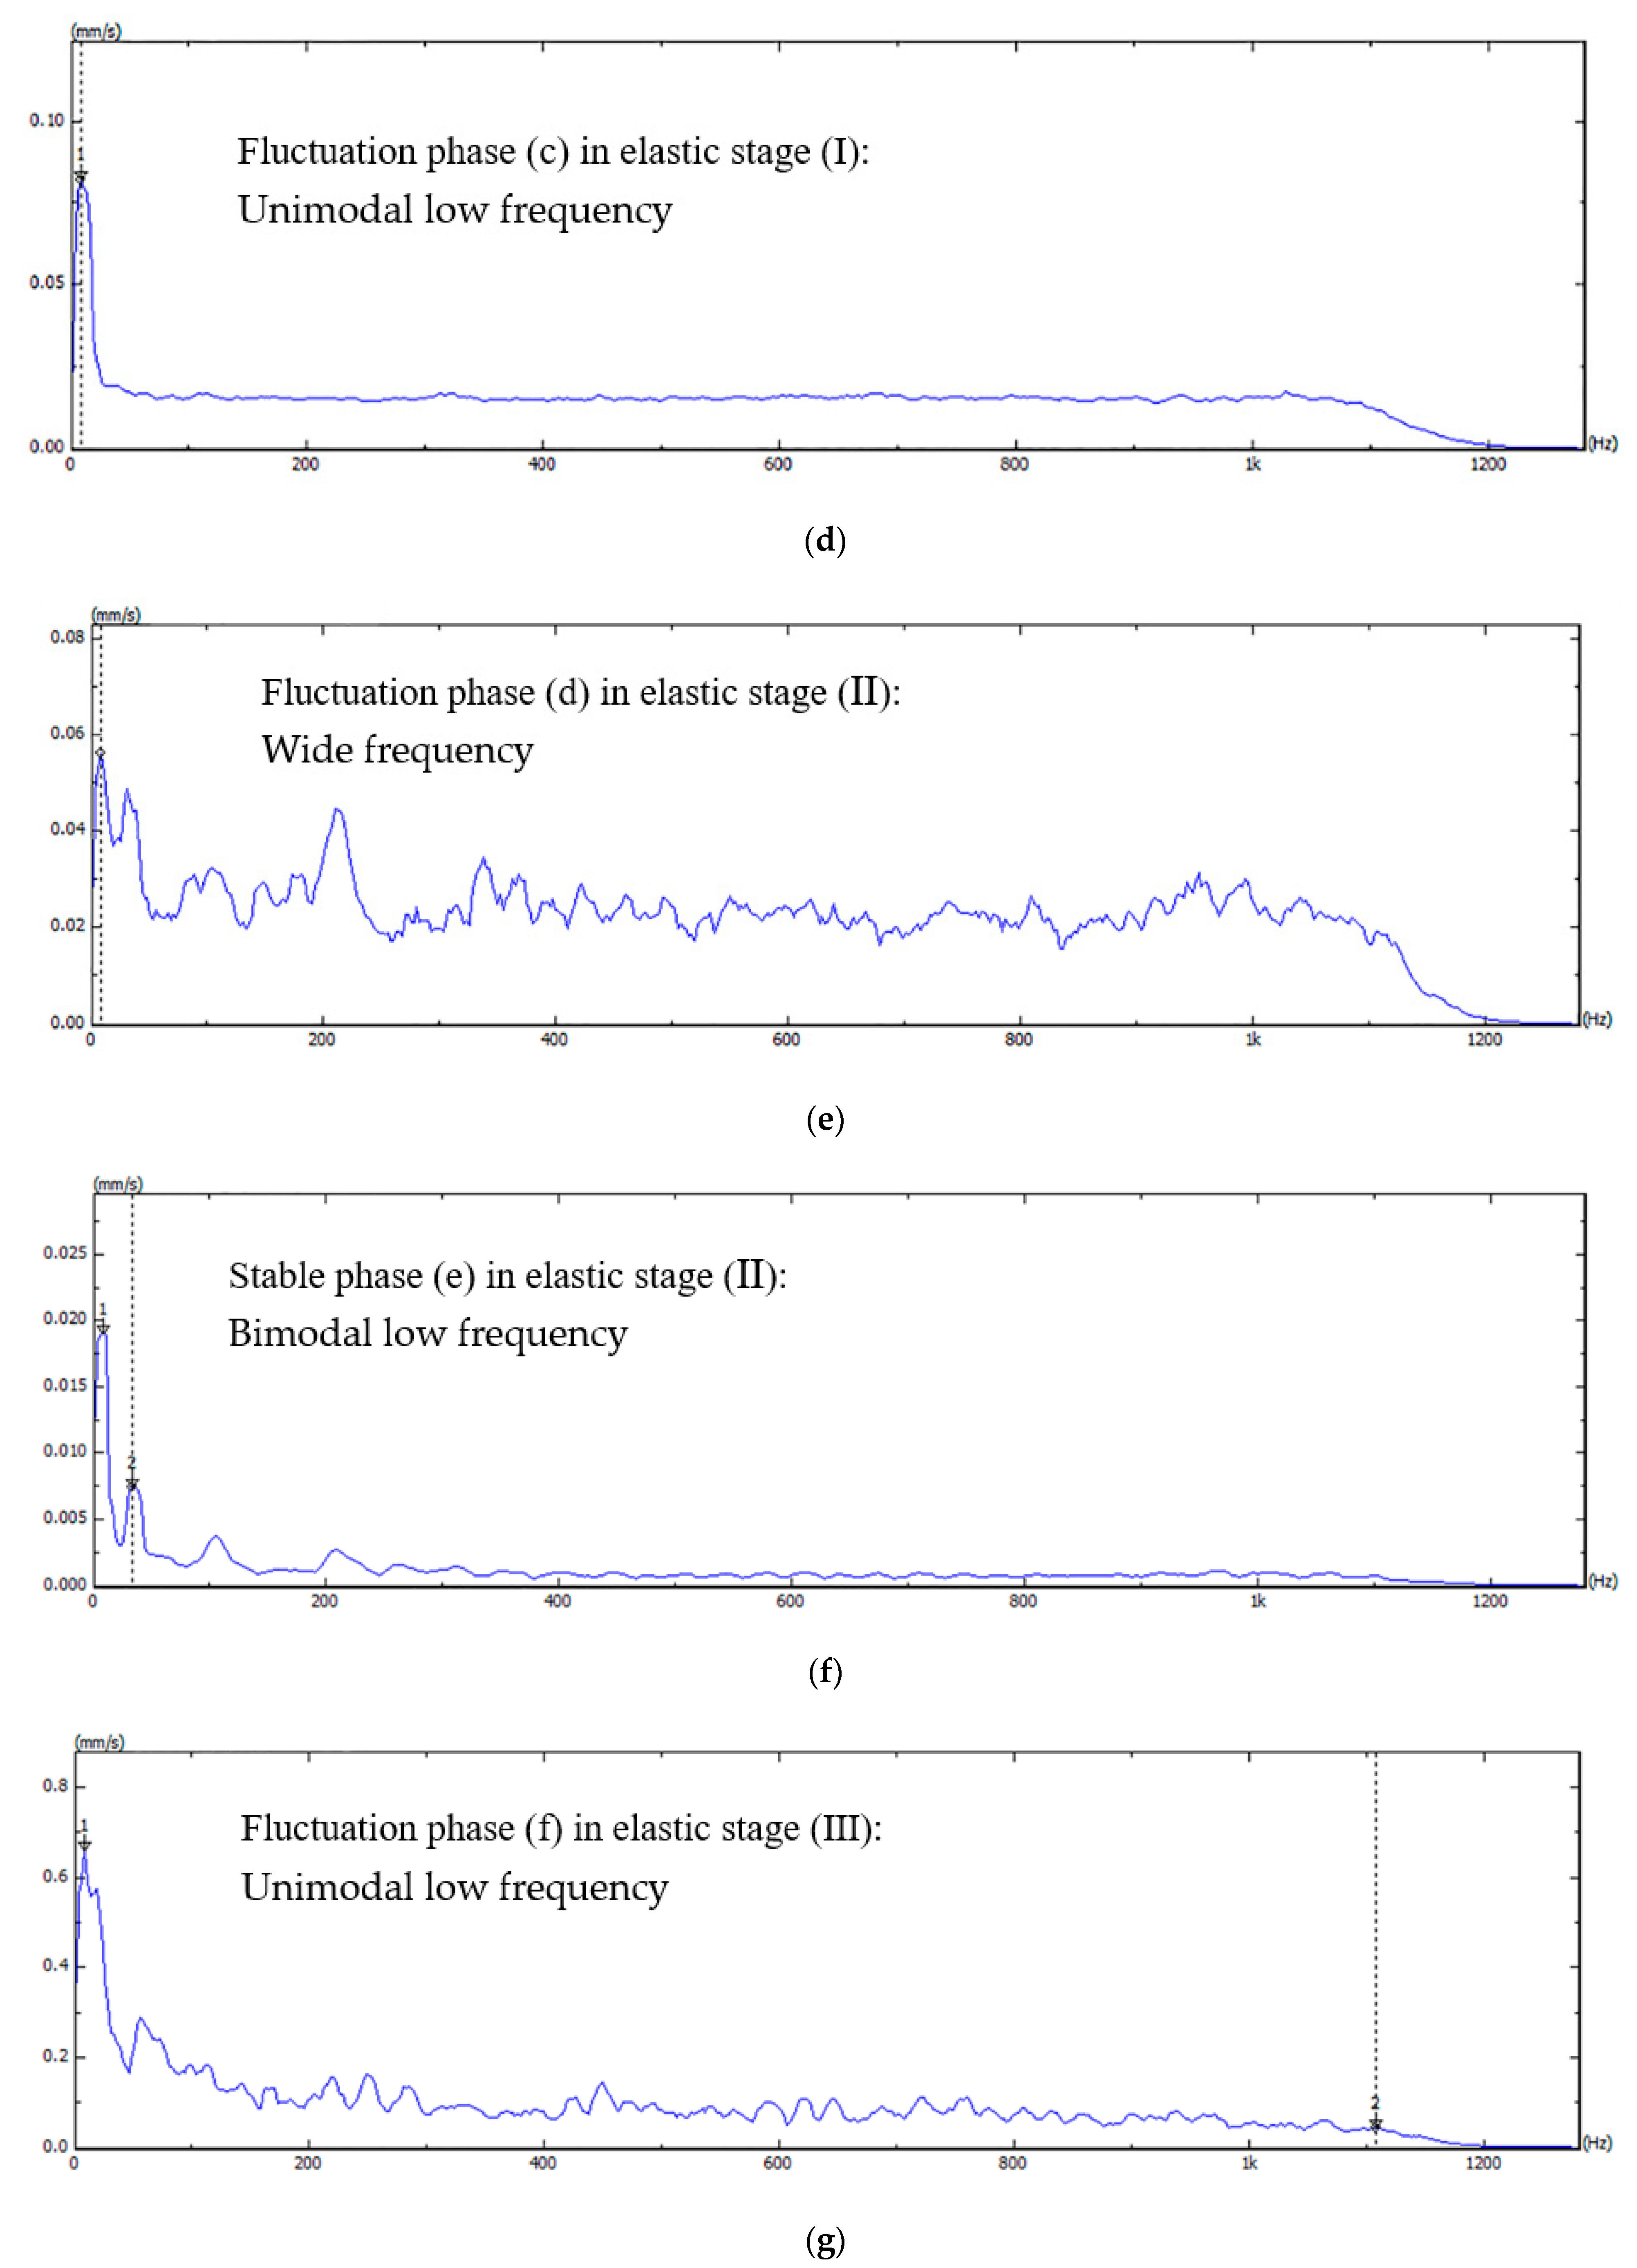
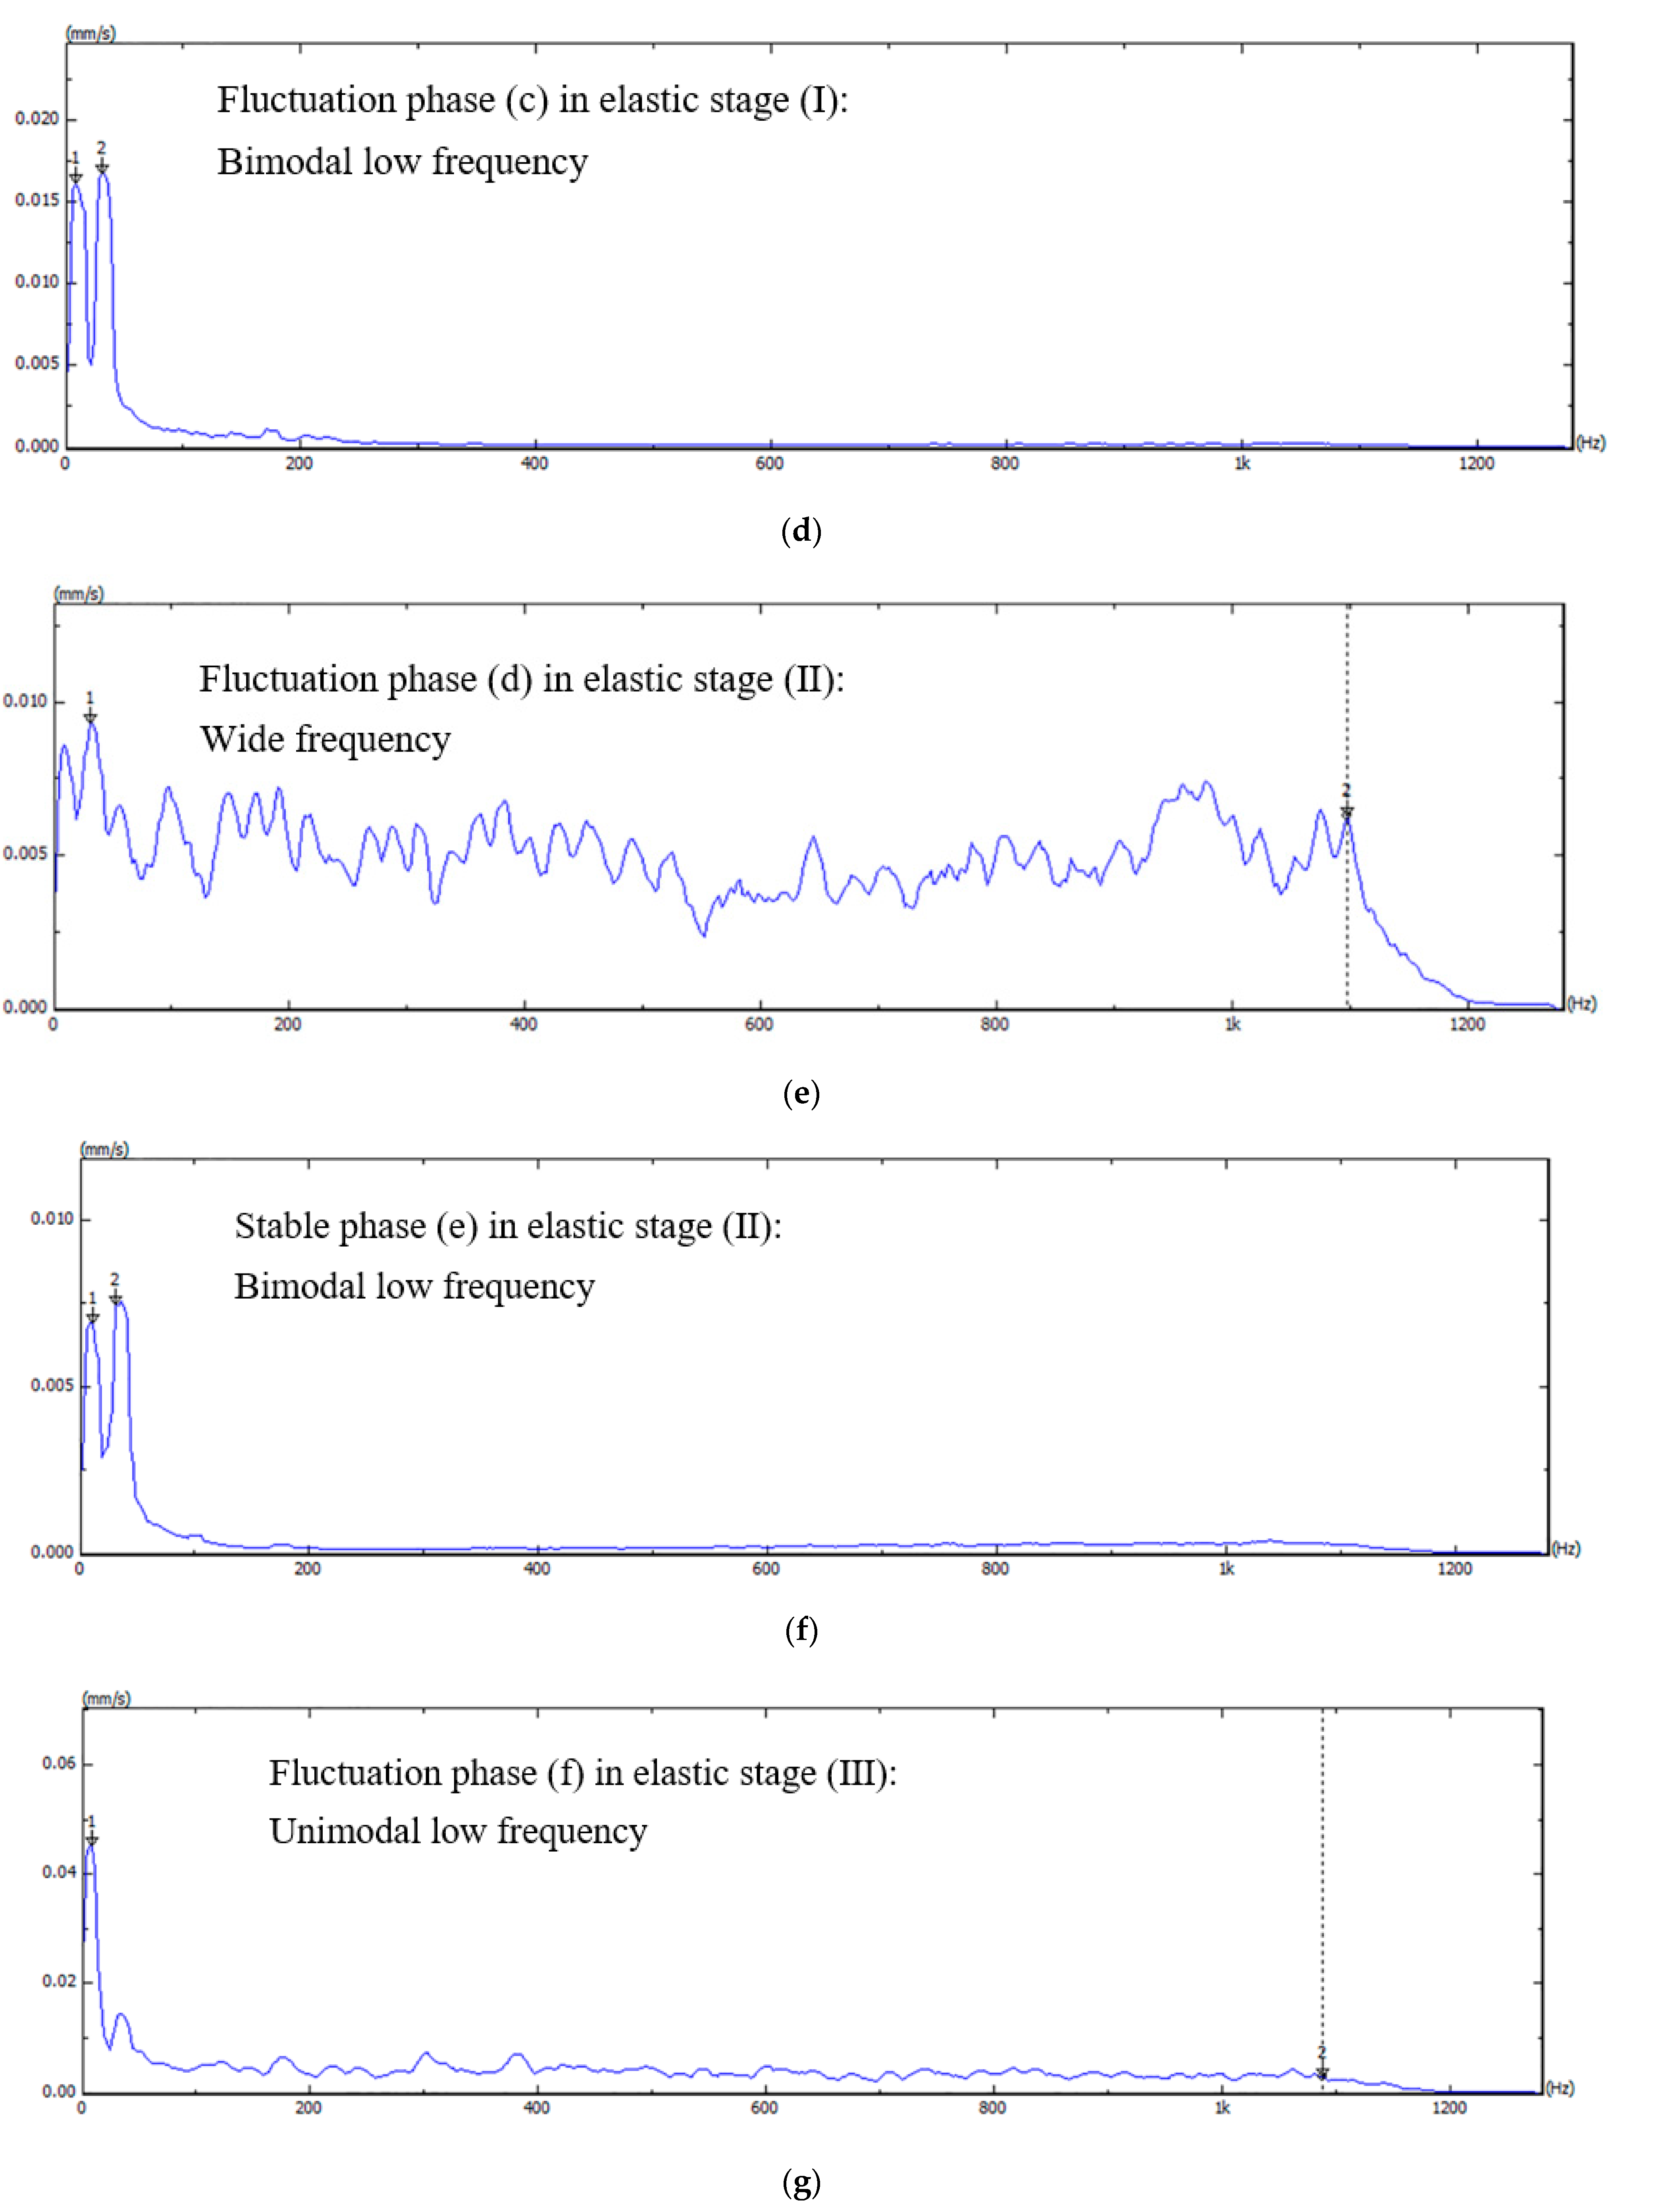
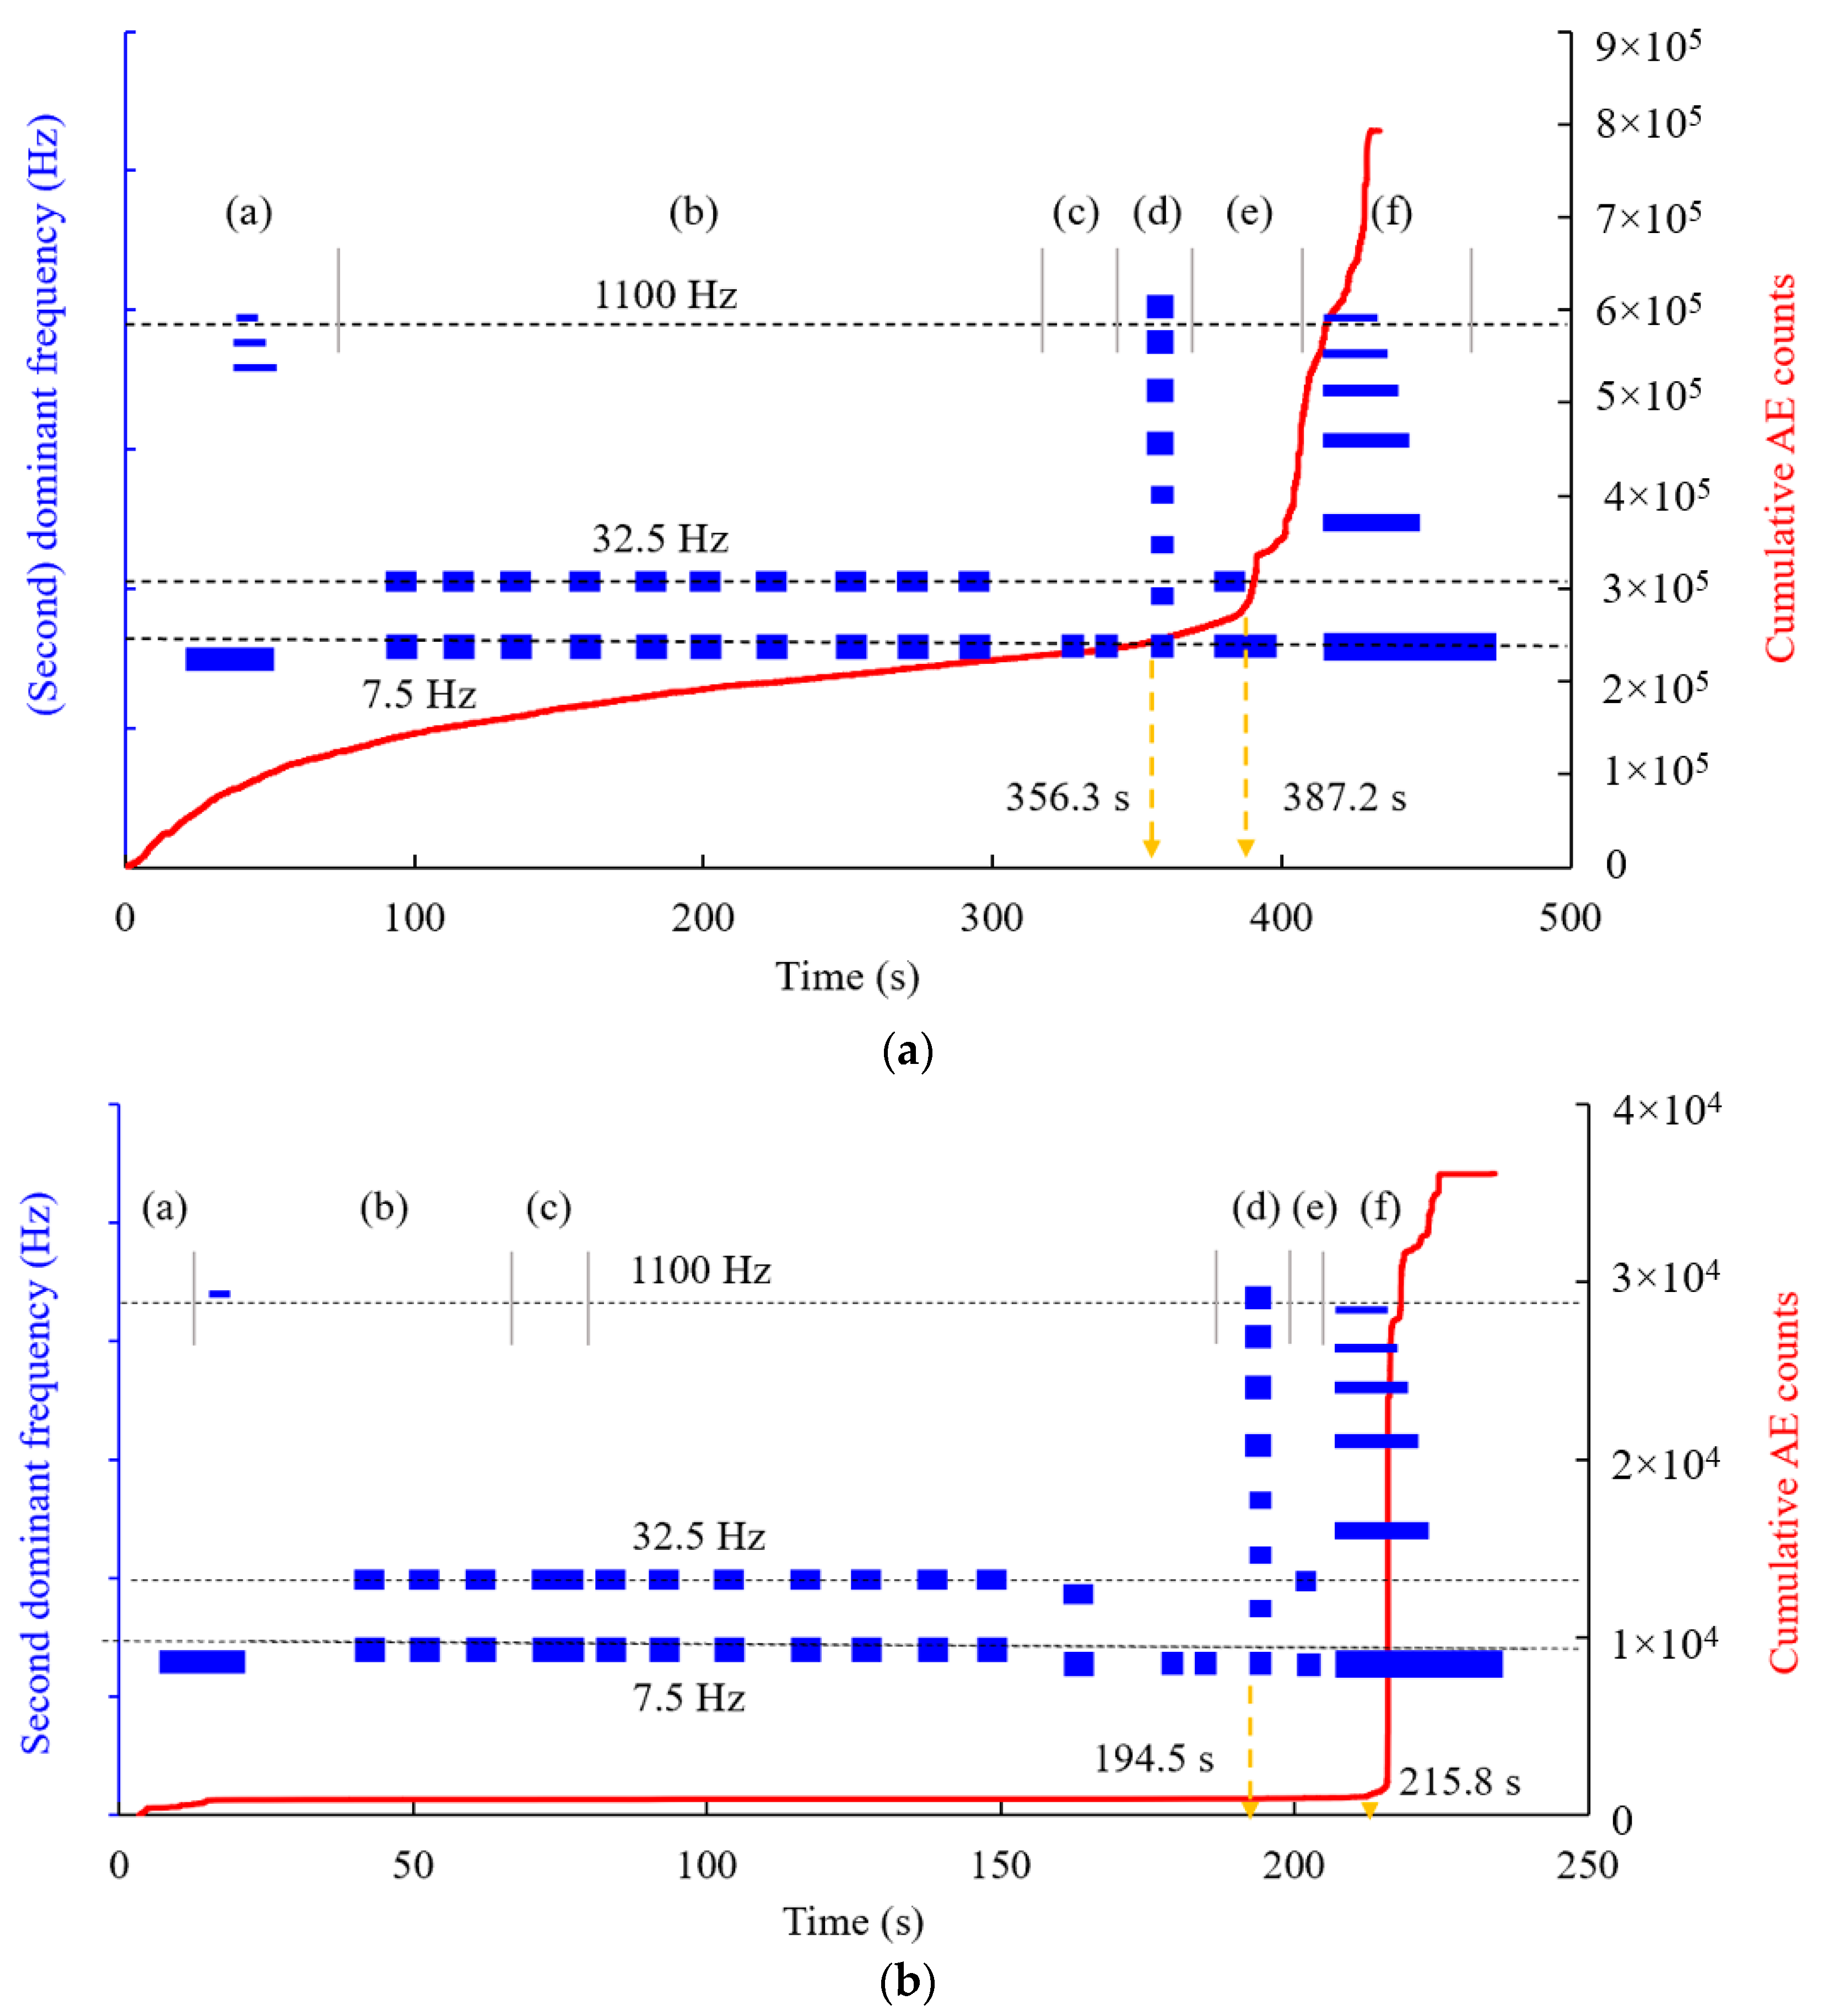
3.3. Characteristics of Vibration Signals
3.3.1. Uniaxial Compression Tests
3.3.2. Brazilian Tests
4. Discussion
5. Conclusions
Author Contributions
Funding
Conflicts of Interest
References
- Castellini, P.; Martarelli, M.; Tomasini, E.P. Laser Doppler Vibrometry: Development of advanced solutions answering to technology’s needs. Mech. Syst. Signal Process. 2006, 20, 1265–1285. [Google Scholar] [CrossRef]
- Sugimoto, T.; Uechi, I.; Sugimoto, K.; Utagawa, N.; Katakura, K. Study on the non-contact acoustic inspection method for concrete structures by using strong ultrasonic sound source. Phys. Procedia 2006, 70, 398–401. [Google Scholar] [CrossRef]
- Fujino, Y.; Kaito, K.; Abe, M. Detection of structural damage by ambient vibration measurement using laser Doppler vibrometer. In Proceedings of the Health Monitoring & Management of Civil Infrastructure Systems, Newport Beach, CA, USA, 6–8 March 2001. [Google Scholar]
- Chen, S.E.; Petro, S. Nondestructive bridge cable tension assessment using laser vibrometry. Exp. Tech. 2005, 29, 29–32. [Google Scholar] [CrossRef]
- Matsuoka, K.; Uehan, F.; Kusaka, H.; Tomonaga, H. Experimental validation of Non-Marker simple image displacement measurements for railway bridges. Appl. Sci. 2021, 11, 7032. [Google Scholar] [CrossRef]
- De Grassi, M.; Copparoni, S.; Tomasini, E.P.; Esposito, E. Quality control and programmed maintenance of ventilated wall facings: Pathologies surveying with laser vibrometry. In Proceedings of the International Workshop on Management of Durability in the Building Process, Milano, Italy, 25–26 June 2003. [Google Scholar]
- Sättele, M.; Krautblatter, M.; Bründl, M.; Straub, D. Forecasting rock slope failure: How reliable and effective are warning systems? Landslides 2016, 13, 737–750. [Google Scholar] [CrossRef] [Green Version]
- Pappalardo, G.; Mineo, S.; Imposa, S.; Grassi, S.; Leotta, A.; La Rosa, F.; Salerno, D. A quick combined approach for the characterization of a cliff during a post-rockfall emergency. Landslides 2020, 17, 1063–1081. [Google Scholar] [CrossRef]
- He, Z.; Xie, M.; Huang, Z.; Li, Y.; Sui, Z.L.; Lu, Y.D.; Golosov, A.M. Experimental hazardous rock block stability assessment based on vibration feature parameters. Adv. Civ. Eng. 2020, 2020, 8837459. [Google Scholar] [CrossRef]
- Ma, G.; Sawada, K.; Yashima, A.; Saito, H. Experimental study of the applicability of the remotely positioned laser doppler vibrometer to rock-block stability assessment. Rock Mech. Rock Eng. 2015, 48, 787–802. [Google Scholar] [CrossRef]
- Du, Y.; Xie, M.; Jiang, Y.; Li, B.; Chicas, S. Experimental rock stability assessment using the frozen–thawing test. Rock Mech. Rock Eng. 2017, 50, 1049–1053. [Google Scholar] [CrossRef]
- Jia, B.; Wu, Z.; Du, Y. Real-time stability assessment of unstable rocks based on fundamental natural frequency. Int. J. Rock Mech. Min. Sci. 2019, 124, 104134. [Google Scholar] [CrossRef]
- Ban, Y.; Fu, X.; Xie, Q. Revealing the laminar shale microdamage mechanism considering the relationship between fracture geometrical morphology and acoustic emission power spectrum characteristics. Bull. Eng. Geol. Environ. 2020, 79, 1083–1096. [Google Scholar] [CrossRef]
- Zhu, X.; Chen, X.; Dai, F. Mechanical properties and acoustic emission characteristics of the bedrock of a hydropower station under cyclic triaxial loading. Rock Mech. Rock Eng. 2020, 53, 5203–5221. [Google Scholar] [CrossRef]
- Verstrynge, E.; Lacidogna, G.; Accornero, F.; Tomor, A. A review on acoustic emission monitoring for damage detection in masonry structures. Constr. Build. Mater. 2021, 268, 121089. [Google Scholar] [CrossRef]
- Ono, K. Review on structural health evaluation with acoustic emission. Appl. Sci. 2018, 8, 958. [Google Scholar] [CrossRef] [Green Version]
- Zhang, R.; Liu, J.; Sa, Z.; Wang, Z.; Lu, S.; Lv, Z. Fractal characteristics of acoustic emission of gas-bearing coal subjected to true triaxial loading. Measurement 2021, 169, 108349. [Google Scholar] [CrossRef]
- Chen, L.; Zhao, J.; Zheng, Z. Acoustic emission characteristics of compressive deformation and failure of siltstone under different water contents. Adv. Mater. Sci. Eng. 2017, 2017, 4035487. [Google Scholar] [CrossRef] [Green Version]
- Sendrowicz, A.; Myhre, A.O.; Wierdak, S.W.; Vinogradov, A. Challenges and accomplishments in mechanical testing instrumented by in situ techniques: Infrared thermography, digital image correlation, and acoustic emission. Appl. Sci. 2021, 11, 6718. [Google Scholar] [CrossRef]
- Meng, Q.; Zhang, M.; Han, L.; Pu, H.; Chen, Y. Acoustic emission characteristics of red sandstone specimens under uniaxial cyclic loading and unloading compression. Rock Mech. Rock Eng. 2018, 51, 969–988. [Google Scholar] [CrossRef]
- Jin, P.J.; Wang, E.Y.; Song, D.Z. Study on correlation of acoustic emission and plastic strain based on coal-rock damage theory. Geomech. Eng. 2017, 12, 627–637. [Google Scholar] [CrossRef]
- Xu, G.; He, C.; Chen, Z.; Su, A. Transverse isotropy of phyllite under Brazilian tests: Laboratory testing and numerical simulations. Rock Mech. Rock Eng. 2018, 51, 1111–1135. [Google Scholar] [CrossRef]
- Li, J.; Hu, Q.; Yu, M.; Li, X.; Hu, J.; Yang, H. Acoustic emission monitoring technology for coal and gas outburst. Energy Sci. Eng. 2019, 7, 443–456. [Google Scholar] [CrossRef] [Green Version]
- Manthei, G.; Eisenblatter, J.; Dahmb, T. Moment tensor evaluation of acoustic emission sources in salt rock. Constr. Build. Mater. 2001, 15, 297–309. [Google Scholar] [CrossRef]
- Manthei, G.; Plenkers, K. Review on in situ acoustic emission monitoring in the context of structural health monitoring in mines. Appl. Sci. 2018, 8, 1595. [Google Scholar] [CrossRef] [Green Version]
- Ban, Y.; Fu, X.; Xie, Q.; Dyskin, A.; He, C.B.; Duan, J.; Pasternak, E. Fracturing of shales with slots under uniaxial compression parallel to bedding layers. J. Pet. Sci. Eng. 2022, 211, 110163. [Google Scholar] [CrossRef]
- Li, L.R.; Deng, J.H.; Zheng, L.; Liu, J.F. Dominant frequency characteristics of acoustic emissions in white marble during direct tensile tests. Rock Mech. Rock Eng. 2017, 50, 1337–1346. [Google Scholar] [CrossRef]
- Aggelis, D.G.; Soulioti, D.V.; Sapouridis, N.; Barkoula, N.M.; Paipetis, A.S.; Matikas, T.E. Acoustic emission characterization of the fracture process in fibre reinforced concrete. Constr. Build. Mater. 2011, 25, 4126–4131. [Google Scholar] [CrossRef]
- Sharafisafa, M.; Aliabadian, Z.; Shen, L. Crack initiation and failure of block-in-matrix rocks under Brazilian test using digital image correlation. Theor. Appl. Fract. Mech. 2020, 109, 102743. [Google Scholar] [CrossRef]
- Li, D.; Wong, L.N.Y. The Brazilian disc test for rock mechanics applications: Review and new insights. Rock Mech. Rock Eng. 2020, 46, 269–287. [Google Scholar] [CrossRef]


| Phase-Stage | Profile | Dominant Frequency (Hz) | Maximum Amplitude (mm/s) | Second Dominant Frequency (Hz) | Second Maximum Amplitude (mm/s) | Wide Frequency (Hz) | Maximum Amplitude (mm/s) |
|---|---|---|---|---|---|---|---|
| (a)-(I) | Unimodal low frequency | 7.5 | 0.13197 | / | / | ||
| (b)-(I) | Bimodal low frequency | 10 | 0.00661 | 32.5 | 0.00446 | ||
| (c)-(I) | Unimodal low frequency | 7.5 | 0.0824 | ||||
| (d)-(II) | Wide frequency | / | / | / | / | 7.5–1100 | 0.056 |
| (e)-(II) | Unimodal low frequency | 10 | 0.019 | 32.5 | 0.007 | ||
| (f)-(III) | Unimodal low frequency | 7.5 | 0.66 |
| Phase-Stage | Profile | Dominant Frequency (Hz) | Maximum Amplitude (mm/s) | Second Dominant Frequency (Hz) | Second Maximum Amplitude (mm/s) | Wide Frequency (Hz) | Maximum Amplitude (mm/s) |
|---|---|---|---|---|---|---|---|
| (a)-(I) | Unimodal low frequency | 27.5 | 0.01325 | / | / | ||
| (b)-(I) | Bimodal low frequency | 10 | 0.00801 | 27.5 | 0.00656 | ||
| (c)-(I) | Bimodal low frequency | 7.5 | 0.01616 | 30 | 0.01679 | ||
| (d)-(II) | Wide frequency | / | / | / | / | 30–1070 | 0.00932 |
| (e)-(II) | Bimodal low frequency | 10 | 0.0075 | 30 | 0.00695 | ||
| (f)-(III) | Unimodal low frequency | 7.5 | 0.04553 |
Publisher’s Note: MDPI stays neutral with regard to jurisdictional claims in published maps and institutional affiliations. |
© 2022 by the authors. Licensee MDPI, Basel, Switzerland. This article is an open access article distributed under the terms and conditions of the Creative Commons Attribution (CC BY) license (https://creativecommons.org/licenses/by/4.0/).
Share and Cite
Xie, Q.; Duan, J.; Ban, Y.; Fu, X.; Liu, S. Laser Vibration Characteristics of Marble Specimens and Failure Criterion. Appl. Sci. 2022, 12, 2223. https://doi.org/10.3390/app12042223
Xie Q, Duan J, Ban Y, Fu X, Liu S. Laser Vibration Characteristics of Marble Specimens and Failure Criterion. Applied Sciences. 2022; 12(4):2223. https://doi.org/10.3390/app12042223
Chicago/Turabian StyleXie, Qiang, Jun Duan, Yuxin Ban, Xiang Fu, and Shilin Liu. 2022. "Laser Vibration Characteristics of Marble Specimens and Failure Criterion" Applied Sciences 12, no. 4: 2223. https://doi.org/10.3390/app12042223
APA StyleXie, Q., Duan, J., Ban, Y., Fu, X., & Liu, S. (2022). Laser Vibration Characteristics of Marble Specimens and Failure Criterion. Applied Sciences, 12(4), 2223. https://doi.org/10.3390/app12042223