1. Introduction
Arsenic is one of the most frequent metalloids found in contaminated soils [
1]. According to Covarrubias and Cabriales [
2], the heavy metals and metalloids that contaminate the soils in Mexico are arsenic, mercury, lead, and chromium. Such heavy metals and metalloids are classified as toxic and carcinogenic elements associated with different types of chronic disorders [
2]. The distribution and contamination of these metalloids are due to natural and anthropogenic processes [
3]. They cause environmental and health problems due to their easy mobilization in the environment [
3].
Arsenic has organic and inorganic species, being the last of the metalloids most frequently found in water and soil [
4]. The inorganic arsenic species are arsenite (As
+3) and arsenate (As
+5). The arsenate is predominantly found in both aerobic environments and contaminated soils [
5] and is strongly absorbed in clays [
6]. Clayey soils have higher arsenic retention potential due to the arsenic absorption and desorption processes [
7].
Soils are natural bodies composed of inorganic and organic materials, gases, and organisms; soils are characterized by presenting strata with variable thicknesses due to the addition, loss, transfer, and/or transformation of matter over time [
8]. Moreover, the soil is a skeletal structure of solid particles in contact, forming an interstitial system of interconnections between voids or pores [
9].
Frequently, the first zone of the soil that gets contaminated is the unsaturated zone [
10]. The unsaturated condition of the soil involves the treatment of stress variables that depend on capillary (attributed to interactions generated from surface tension phenomenon) [
11] and adsorption forces that generate negative pressures on the soil. Surface tension results from an imbalance of attractive intermolecular forces developed in the air–water interface. Such surface tension causes the interface to behave like an elastic curved membrane subjected to excess pressure. These stress forces are known as suction and depend on the water content that is affected by soil structure due to the random interconnections of the pores [
11,
12] and can considerably affect soil behavior [
13].
Most of the problems that involve unsaturated soils are commonly the result of environmental changes, which can cause the expansion or reduction of the soil volume. Those changes affect the matric (
ψm) component of the soil suction and cause the osmotic suction (
ψo) to become essential in the shear strength of the soil when chemical contamination arises [
10]. The soil’s total suction (
ψt) corresponds to the sum of the
ψm and the
ψo. Nevertheless, it is common only to consider the contribution of the
ψm to the unsaturated soil behavior because the contribution of the
ψo is negligible.
In contrast, it has been proposed that under contaminated conditions, the
ψo becomes relevant due to the reactions between the soil and the contaminant, which modifies its geotechnical properties and, consequently, the shear strength resistance of the contaminated soil [
10]. Moreover, the water flow is affected by the void spaces between solid particles because changes in water content result in changes in the soil’s suction [
14].
Diverse indirect techniques have been used to measure soil suction, for example, the relative humidity sensor, psychrometer technique, and filter paper method [
15]. Total suction can be obtained from Kelvin’s law, where the free state water energy can be measured in terms of the partial pressure of water vapor present in the gaseous phase existing in the soil (Equation (1)):
where
is the total suction,
is water density,
is the universal gas constant,
is the absolute temperature,
is the molecular mass of water,
is the vapor pressure of water, and
is the saturated water vapor.
However, the filter paper method is a reliable, less expensive, and frequently used laboratory technique covering a wide range of suction measurements that use a calibration curve for natural soil [
15]. The soil suction measurements by the filter paper method evolved in Europe in the 1920s [
16]. Since then, several researchers have studied and applied this method due to is relatively low cost and the suction range covered by it, from 0 to 1 × 10
6 kPa and 1000–500,000 kPa for the total and matric soil suctions, respectively [
17]. Due to this, the filter paper method is currently used to evaluate the total and matric soil suction [
18,
19]. This laboratory test method, described by the standard ASTM D5298 [
20], allows measuring the
ψt by a non-contact procedure, and the
ψm by a contact procedure. In this technique, the water content of an initially dry filter paper comes into equilibrium with the soil either through vapor or liquid flow [
16].
The importance of the soil–contaminant interaction lies in the contaminant movement control through the soil and the changes in its geotechnical properties [
21,
22,
23]. Different theories have supported those changes (e.g., the diffuse double layer) and provided a guide to study the change in the soil–water retention curve (SWRC) since particle size and permeability changes are related to soil suction [
17]. It is known that soil suction describes the potential water retention into the soil’s pores. In contrast, SWRC describes the relationship between the degree of saturation of the soil and the soil’s suction. When unsaturated soils are subjected to drying and wetting cycles, the SWRC shows hysteretic behavior. This causes the soil to retain more water on the drying path than on the wetting path at the same suction value.
Soil’s water retention is affected by the void ratio and the pore structure, represented by the pore-size distribution. The SWRC depends on many factors such as soil type and structure, temperature, salts content, and stress state. The SWRC is an essential relationship that provides information about unsaturated soils’ mechanical and hydraulic behaviors. The SWRC has a similar role as the consolidation curve for saturated soils mechanics. The SWRC is used to predict the volume change, shear strength, and permeability coefficient for unsaturated soils [
9,
14]. Thus, the knowledge of the SWRC of the unsaturated and contaminated soils is a crucial parameter for its analysis [
9].
The literature review showed that many efforts have been made to study the contaminated soils’ geotechnical behaviors. However, to the best of the authors’ knowledge, there is no available information about the SWRC for heavy metal contaminated soils. Hence, the objective of this paper was to evaluate the SWRC of arsenic-contaminated soil. Further, the permeability coefficient of the arsenic-contaminated soil was evaluated through its laboratory measurement and compared with a correlation equation using the consolidation parameters of the soil.
3. Results and Discussion
3.1. Porosimetry
One of the aspects that affect the
ψm is the capillary forces (i.e., the pore size distribution) [
11]. Thus, porosimetry tests were performed to evaluate the suction changes for the natural soil (0 mg/kg) and the arsenic-contaminated soils (25 mg/kg and 50 mg/kg). The results of porosimetry are shown in
Figure 3a, which relates the relative pressure and adsorbed volume. According to the International Union of Pure and Applied Chemistry (IUPAC, Research Triangle Park, NC, USA), these results indicate a type IV isotherm with a hysteresis type H3 characteristic of mesoporous solids, such as clays and solid aggregates, related to parallel plates, respectively.
The BET method was used to evaluate the specific surface area of the soils, while the BJH method was applied to evaluate the pore size distribution in the soil samples. The pores diameter can be classified as macropores (φ > 0.05 µm), mesopores (0.05 µm < φ > 0.002 µm), and micropores (φ < 0.002 µm). According to the specific surface area, the natural soil corresponded to a montmorillonite clay mineral. The BET area decreased (16% and 9% for 25 mg/kg and 50 mg/kg, respectively) as well as the mesoporous volume after contamination (as seen in
Figure 3a), suggesting that the arsenic modified the soil structure.
Figure 3b indicates the contribution of the pore size to the total volume of pores. The peaks observed in
Figure 3b correspond to the most predominant pore sizes for each soil sample analyzed with the nitrogen adsorption isotherm method. The pore size distribution of the natural soil shows a peak at a pore size of about 5.6282 nm. As arsenic concentration increases to 50 mg/kg, the mesopores reduce their adsorbed volume (as shown in
Table 3), and the peak displaces to a larger pore size of about 7.8141 nm. This indicates that the porous solid behaves as a coarse material as the arsenic concentration increases.
This is explained because the specific soil area combines all surface areas of all particles in the soil mass, which generates an inverse relationship between the particle size and specific surface area. So, the bigger the particle size, the smaller the specific surface [
29]. Moreover, adsorption is defined as the accumulation of material above the surface [
30], and the results indicate that the decrease in the adsorption potential lowers the specific surface because the adsorbate (N
2) volume required to fill the soil pores is smaller than the natural condition, which results in a change of position of the isotherms.
According to these results, it can be inferred that the matric suction reduces after arsenic contamination due to structural changes generated in the soil mass. This is explained to be due to the inverse relationship of suction and the radius of curvature of the contractile skin in the Laplace equation (i.e., when suction decreases, the radius of curvature increases).
3.2. Calibration of the Whatman Grade 42 Filter Paper
Table 4 presents the water content of the filter paper obtained to create the calibration curves for the natural and contaminated soils. Those results are pretty revealing in terms of the shape of the calibration curve because they indicate that the gravimetric water content (ω) decreases in comparison with the standard calibration for both arsenic concentrations.
The Whatman Grade 42 filter paper calibration curves are shown in
Figure 4. The suction values for the contaminated soils obtained from the calibration curve clearly show that the slope change due to the soil–water–contaminant interaction. The data obtained in the arsenic calibration curves validated the assumption that the suction values change due to the exchange of vapors resulting from the chemical contamination. Moreover, those results provided the data to support the evaluation of total suction in the arsenic-contaminated soils where the
ψo has a significant change compared with its value in the natural soil.
These results suggest that the slope of the calibration curve is affected by the contaminant concentration. This also impacts the suction values since for filter paper with water content higher than 17.5%, the suction values of the 50 mg/kg arsenic concentration condition are higher than those of the 25 mg/kg arsenic concentration condition. In contrast, for filter paper with water content lower than 17.5%, the suction values of the 25 mg/kg arsenic condition are higher.
3.3. Evaluation of the SWRC of the Arsenic-Contaminated Soils
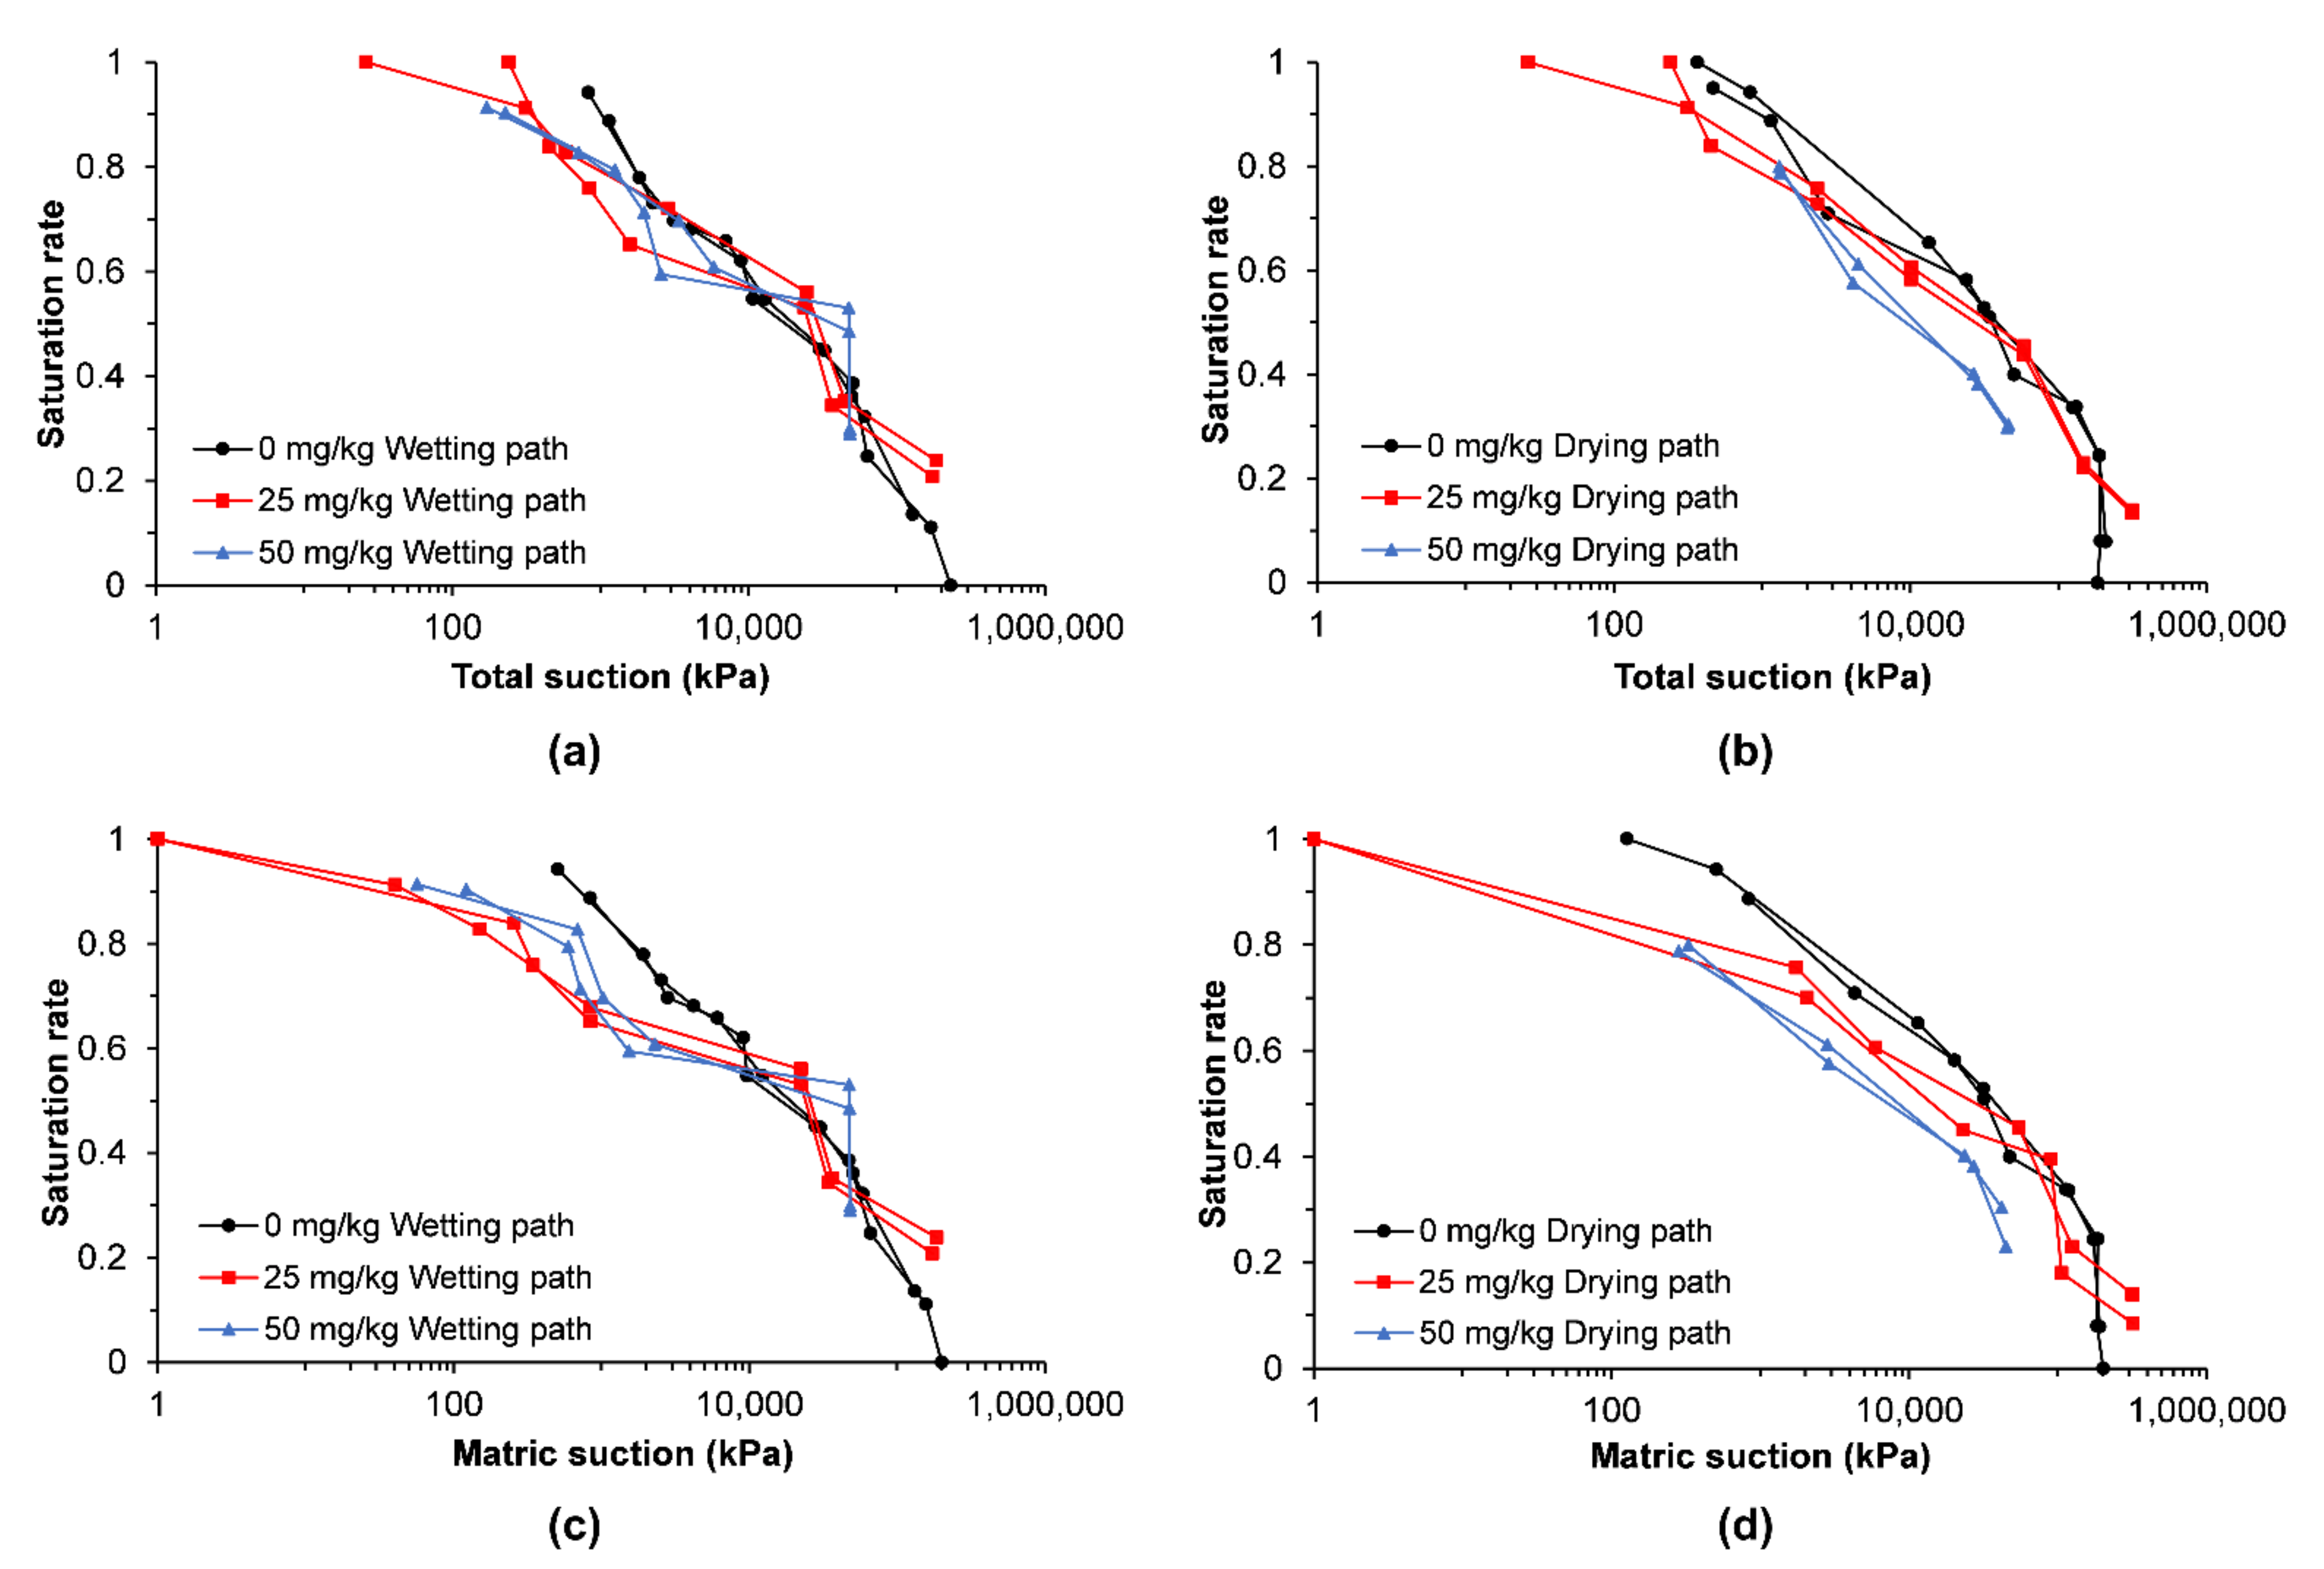
The results of soil suction are presented in
Figure 5. Soil suction values from 1 kPa to 1 × 10
6 kPa were obtained through the filter paper method. Water content is expressed as the normalized degree of saturation (Sr), which varies from 0 to 1.
In the arsenic-contaminated cases, the total and matric suction values decreased at a high saturation rate and the slope appears to be smoother than the one observed for the natural soil condition, which is evident after comparing the wetting paths because the soil behaves as a coarse-grain one when contaminated.
From the wetting path of the SWRC, at a Sr = 0.90, it was observed that the soil’s total suction decreased 67% (from ψt = 1055 kPa ± 50 kPa to ψt = 348 kPa ± 6 kPa) as the arsenic concentration in the soil increased from 0 mg/kg to 25 mg/kg. Furthermore, when the contaminant concentration increased to 50 mg/kg, the ψt decreased to 226 kPa ± 23 kPa, which represented a 78% decrease compared with the total suction of the natural soil (ψt = 1055 kPa ± 50 kPa) at the same saturation rate.
The total and matric suction were evaluated at the saturation rate of the natural soil sample (Sr = 0.8) to compare its behavior with the arsenic-contaminated soils cases. The natural soil has a ψt = 1704 kPa ± 41 kPa, ψm = 1681 kPa ± 50 kPa, and ψo = 23 kPa ± 9 kPa. According to these results, the osmotic suction contributed 1.4% to the total suction of the natural soil. This demonstrates why the ψo is frequently neglected for unsaturated soil mechanics when studying natural or non-contaminated soils.
The 25 mg/kg and 50 mg/kg arsenic-contaminated soils had matric suctions of 260 kPa ± 58 kPa and 670 kPa ± 107 kPa, respectively. In contrast, their osmotic suction was 530 kPa ± 168 kPa and 467 kPa ± 30 kPa, respectively. This ψo corresponded to the 67% and 41%, respectively, of the total suction of the 25 mg/kg and 50 mg/kg arsenic-contaminated soils. Thus, the contribution of the ψo should be considered when analyzing the mechanical behavior of the contaminated unsaturated soils.
Moreover, the SWRC for both the wetting and drying paths of the 25 mg/kg arsenic-contaminated soil was evaluated to verify whether the ASTM D5298 [
20] calibration curve gives similar results to those obtained with the calibration curve of
Section 3.2 for the filter paper Whatman Grade 42. From
Figure 6, it can be seen that the ASTM D5298 calibration curve provides higher total and matric suction values for the contaminated soil.
The soil suction was evaluated with the ASTM D5298 and
Section 3.2 calibration curves for the 25 mg/kg arsenic-contaminated soil at Sr = 0.8. Considering the ASTM D5298 calibration curve, the total suction of the 25 mg/kg arsenic-contaminated soil in the wetting path was 7455 kPa ± 2180 kPa, while in the drying path, the total suction was 3750 kPa ± 2610 kPa. These values were 9.5-fold and 3.4-fold times higher than those obtained using the
Section 3.2 calibration curves for the wetting and drying paths of the arsenic-contaminated condition.
These results indicate that the soil suction would correspond to a soil with a higher fine-grain size content (explained through the Laplace equation) than the soil used in this experiment, which does not correlate with the total suction value and the soil properties reported in
Table 1. Thus, it is recommended that before evaluating the suction of contaminated soil, the corresponding calibration curve should be obtained to avoid misinterpretation of the mechanical and hydraulics properties.
3.4. Permeability
3.4.1. Falling Head Permeability Test
The permeability results of the falling head test are present in
Table 5. Soil’s arsenic contamination had a substantial effect on the hydraulic behavior of the soil mass. The saturated permeability increases two orders of magnitude as the arsenic concentration increases. The changes in the saturated permeability are due to chemical reactions between the soil elements and the contaminant added, which increases the pore spaces in the soil mass and causes a structural change in the soil after contamination [
21].
3.4.2. Prediction of the Permeability Coefficient from the Consolidation Test
Table 6 presents the mixture density of the 25 mg/kg and 50 mg/kg arsenic solutions used and the predicted coefficient of permeability using Equation (3). Although the consolidation tests were performed, the results were only considered here to predict the
value of the soils.
In the case of the natural soil (0 mg/kg), even when the predicted value is 40% lower than the measured one, its value remained in the same order of magnitude. Nevertheless, for the case of the arsenic-contaminated soils, there is a difference of at least two orders of magnitude when comparing the predicted versus the measured k values.
According to the variation, arsenic-contaminated soils behave like coarse-grained soils. Such behavior is supported by the porosimetry test results that indicated that the pore sizes increased and resulted in higher values. However, the predicted of the contaminated soils do not reflect such modification, and, consequently, the values obtained from the consolidation test do not correspond with the soil behavior.
Thus, if these results are used in geotechnical design to represent how the liquids are carried out through the soil, it would result in inadequate solutions. So, Equation (3) should be avoided when analyzing contaminated soil samples. Furthermore, additional studies should be performed to fully evaluate the hydraulic conductivity function of the unsaturated soils since it is related to the matric suction of the soil.
4. Conclusions
A change in the pore size distribution of the soil was observed after soil contamination. Due to the soil–water–contaminant interaction, the matric suction of the contaminated samples decreased while its osmotic suction increased compared with the correspondent natural soil suctions. This indicates that the role of the osmotic suction should be considered when studying unsaturated soils that are contaminated.
The SWRC of the arsenic-contaminated soil was influenced by the calibration curve used for the filter paper Whatman Grade 42. It was found that when using the calibration curve provided by the ASTM D5298, the suction values tended to be higher than the ones obtained using the calibration curve developed for the case of the arsenic-contaminated soils. Thus, to avoid misinterpretation of the unsaturated soil’s behavior when contaminated, it should be recommended to obtain the calibration curve according to the type and the concentration of the contaminant present in the soil.
Limitations of this research are mainly due to the filter paper method applied. Such limitations are because the matric suction measurements depend on the adequate contact between the soil and the filter paper. In contrast, such contact must be avoided for the total suction measurement. The equilibration time needed for soil suction measurements is a minimum of seven days and depends on the type of soil and the expected soil suction magnitude to be measured. Moreover, this method does not evaluate the soil suction at different overload pressures.
After comparing the permeability coefficient of the contaminated soils through the falling head with the oedometric test, it is concluded that the equation used to predict the permeability coefficient of unsaturated soil under contaminated conditions does not represent the soil behavior. Hence, it is recommended to avoid its use for geotechnical analysis and design when working with contaminated soils.


