Article

Hydrogen vs. Batteries: Comparative Safety Assessments for a High-Speed Passenger Ferry

Maritime Safety Research Centre, Department of Naval Architecture, Ocean and Marine Engineering, University of Strathclyde, Glasgow G4 0LZ, UK
*
Author to whom correspondence should be addressed.
Appl. Sci. 2022, 12(6), 2919; https://doi.org/10.3390/app12062919
Submission received: 9 February 2022 / Revised: 4 March 2022 / Accepted: 10 March 2022 / Published: 12 March 2022

Abstract

:
Batteries and hydrogen constitute two of the most promising solutions for decarbonising international shipping. This paper presents the comparison between a battery and a proton-exchange membrane hydrogen fuel cell version of a high-speed catamaran ferry with a main focus on safety. The systems required for each version are properly sized and fitted according to the applicable rules, and their impact on the overall design is discussed. Hazards for both designs were identified; frequency and consequence indexes for them were input qualitatively, following Novel Technology Qualification and SOLAS Alternative Designs and Arrangements, while certain risk control options were proposed in order to reduce the risks of the most concerned accidental events. The highest ranked risks were analysed by quantitative risk assessments in PyroSim software. The gas dispersion analysis performed for the hydrogen version indicated that it is crucial for the leakage in the fuel cell room to be stopped within 1 s after being detected to prevent the formation of explosive masses under full pipe rupture of 33 mm diameter, even with 120 air changes per hour. For the battery version, the smoke/fire simulation in the battery room indicated that the firefighting system could achieve a 30% reduction in fire duration, with firedoors closed and ventilation shut, compared to the scenario without a firefighting system.

1. Introduction

The International Maritime Organisation (IMO) requires a 50% reduction in greenhouse gas (GHG) emissions by 2050 compared to 2008 levels, which renders the need for utilising alternative fuels in the maritime industry mandatory. Hydrogen and proton exchange membrane (PEM) fuel cells constitute a zero-emission alternative under the prerequisite that hydrogen is produced by renewable sources. Several boats sail at rivers or lakes utilising hydrogen fuel cells, with hydrogen stored in compressed gas form [1,2,3]. PEM fuel cells receive hydrogen and air, and through electrochemical reactions, electricity and hot water are produced without any carbon emissions. They are light, producing insignificant noise and low vibrations, as well as having a high efficiency (50–60%), especially if combined with a waste heat recovery system, where efficiency can reach even higher levels.
The battery-powered vessel is also a solution to fulfil the demand of GHG reduction from IMO. This type of vessel can store and use electricity supplied from the power grid on shore in battery racks and eliminate all the exhaust gas emissions from the burning of fossil fuels in internal combustion engines (ICE). The European Union H2020 Project-TrAM has investigated and developed battery-powered vessels using such a concept to implement the emission control strategy in short-sea shipping.
Both emerging zero-emission technologies could be a potential solution for high-speed passenger ferries; however, the use of these novel propulsion methods and green technologies introduces new safety concerns and challenges in the design of ships, including weight limitations and internal arrangement restrictions. Regarding the safety issues, hydrogen gas leakage can lead to explosions under certain concentrations, while batteries are associated with fire risk. As far as the design of zero-emission high-speed vessels is concerned, substantial work has been carried out by the authors, within the TrAM project [4] and on alternative fuels [5], which is being extended through the work presented in this paper. Design optimisation has been beneficial for the performance improvement of various kinds of vessels [6,7], including high-speed catamarans [8]. Recent studies on the hydrodynamic performance of high-speed catamarans in various operational conditions [9,10] aim at reducing the energy requirements, resulting in more economical designs while mitigating the aforementioned challenges related to this kind of vessel.
A brief overview of the existing literature, involving batteries and hydrogen applications on ships, is presented in Section 2. In Section 3, the proposed designs are discussed, including the considered systems for both versions. In Section 4, the most severe hazards and the most effective risk control options (RCOs) are presented after a hazard identification (HAZID) analysis was performed for the hydrogen and the battery versions of the ferry, following the formal safety assessment (FSA). In Section 5, materials and methods are presented, including quantitative risk assessments for both designs, using the PyroSim software. For the hydrogen version, a gas dispersion analysis in the fuel cell room is presented, while for the battery version, a smoke/fire simulation is performed in the battery room. In Section 6, the results are presented and discussed for various scenarios for both designs. The concluding remarks are presented in Section 7.

2. Background

Hydrogen is an abundant, non-toxic, zero-emission fuel from well to wake if it is produced by electrolysis, but with a highly flammable and explosive nature. It is more gravimetrically and volumetrically efficient to be stored in liquefied form (LH2) at −253 degrees Celsius, compared to high-pressure compressed gas. The fuel parameters of liquefied hydrogen are presented in Table 1. Current experience with liquefied hydrogen is limited in the marine industry, and regulations are still under development.
Regarding the hydrogen systems’ applications on ships, Ervin and Dincer [11] presented a thermodynamic analysis for an integrated solid oxide fuel cell system onboard a liquefied hydrogen-fuelled ship to assess the overall energy and exergy efficiencies. Cavo et al. [12] presented a model-based dynamic analysis onboard a zero-emission ship focusing on the coupling of PEM fuel cells and metal hybrids (MH). MHs provided promising results in terms of fuel storage and supply of hydrogen to the fuel cells. Sari et al. [13] investigated the environmental impact for auxiliary powered systems of a hydrogen fuel cell-powered chemical tanker until 2050, using the reference energy system concept. Diesel generators were replaced with fuel cells in 2030, and this resulted in a reduction of around 7000 tonnes of CO2 compared to 2029.
Another alternative option to reduce gaseous emissions is by utilising batteries. They are energy storage systems but with high fire risk, which can negatively affect their applicability. Regarding the battery systems’ applications on ships, Wang et al. [14] presented a life cycle analysis, with a focus on environmental footprint, and cost assessment of a battery ferry, and compared the results with a conventional ferry. It was demonstrated that when grid mix electricity was supplied in 2019, a 30% reduction of GHG emissions could be achieved, along with a 15% reduction of lifecycle costs when battery-powered systems are used. Lindstad et al. [15] studied the conversion of conventional offshore support vessels to hybrid by retrofitting of batteries, with the main focus on environmental and economic aspects. The results demonstrated a 40–45% reduction of annual global warming potential in Arctic regions when batteries and ICEs are combined. However, a significant payback period of 12.5 years was obtained, indicating that for existing old vessels, hybridisation with batteries will not be beneficial. Vanem et al. [16] discussed the various data-driven states of health modelling approaches that can be used to estimate the available energy stored in marine battery systems on the basis of sensor data during the operational phase. This is a crucial parameter to avoid loss of propulsion, which can lead to collision or grounding.
Currently, in the literature, there are a few safety assessments performed for hydrogen-powered ships. Mao et al. [17] used ANSYS Fluent software to analyse the overpressure and high-temperature damages induced by an explosion due to hydrogen leakage and ignition in the fuel cell room, control room, and passenger area. An explosion in the fuel cell room exhibited the greater brisance, imposing the most severe damages in ship structure. Yuan et al. [18] assessed the effect of fine water mist on suppressing jet fires around the hydrogen storage tank at the upper deck of a passenger ship. It was demonstrated that jet fires caused by hydrogen leakage could not be extinguished but fire field temperature could be reduced by setting the appropriate spray velocity and droplet size values, preventing fire spread and damage to adjacent equipment/structures. Aarskog et al. [19] presented a consequence assessment using the FLACS CFD model to estimate the fatality risks during operation and at night, related to various hydrogen systems, including high-pressure piping, vent mast, and high-pressure storage tanks, onboard a hydrogen-fuelled high-speed ferry. It was demonstrated that the design was equivalent in terms of safety with conventionally fuelled ferries. Pratt and Klebanoff [20] presented a preliminary HAZID risk assessment for another concept design, the SF-Breeze high-speed catamaran, with hydrogen stored in liquefied form. In this assessment, bunkering was also considered, and it was demonstrated that collision during operation and fuel spill during bunkering were the most severe hazards (highest risk indexes). Another safety analysis was conducted to assess the hydrogen diffusion using ANSYS Fluent software in the SF-Breeze by Li et al. [21], but it was assumed that hydrogen is stored in compressed gas form at 200 bar. It was assessed how hydrogen was concentrated in space depending on the leakage position for different ventilation and hydrogen detection systems’ arrangements. The highest hydrogen concentrations were observed in the corners of the fuel cell rooms.
Similarly, there are very few research studies related to the risk assessments on marine battery power plants. One study carried out by Jeong et al. [22] developed a multi-criteria decision-making approach for a hybrid battery-engine system focusing on cost–environment–risk issues. In their study, the qualitative risk assessment conducted could be further expanded to a quantitative risk assessment. There are also classification societies’ guidelines providing risk assessment and safety design for the maritime batteries’ application [23,24]. In the TrAM project, a safety level evaluation was carried out including HAZID, fault tree analysis (FTA), event tree analysis (ETA), and cost–benefit assessment on RCOs [25].
Currently, most studies are focused on the design/efficiency, as well as the cost or emission analysis, of hybrid arrangements including both batteries and fuel cells for the propulsion [26,27,28,29]. In this work, two zero carbon emission designs are proposed. For the design of the hydrogen ferry, hydrogen is stored as a cryogenic liquid (LH2), since it is more gravimetrically and volumetrically effective, enabling larger amounts of fuel to be stored onboard and used for propulsion, without requiring frequent refuelling [20]. LH2 is used as the only fuel source for the catamaran ferry. Batteries are used only for emergency situations in case of severe failure of hydrogen systems. In the battery version, the ferry is fully electric, powered solely by electricity. The novelty of this paper is twofold. First, two novel zero-emission solutions are proposed and compared for a catamaran ferry, showcasing the possibility of a pure hydrogen solution, with hydrogen stored in liquefied form, and a pure electric alternative. Secondly, a detailed safety comparison is performed for these zero-emission solutions for the high-speed passenger vessel including HAZID analysis but also gas and smoke dispersions in the fuel cell and battery rooms, respectively. As was derived from the literature review, this is the first work to perform such an in-depth safety assessment for these decarbonising solutions for passenger ferries.

3. Proposed Designs

3.1. Case Study

The case ship selected for the comparative assessment between the battery and the hydrogen version was the Stavanger demonstrator, for which the main particulars and ferry details are presented in Table 2.
The battery-powered catamaran ferry, which is expected to be operational in 2022–2023, will operate in a multi-stop route in the Stavanger area in Norway up to 20 h per day with each round trip including up to 12 stops upon passenger’s request. This ferry is part of the TrAM project, which is funded by the European Union [30]. Two more studies were carried out in London and Belgium for the same type of vessel.
In this study, for the design of hydrogen systems and their arrangement onboard, the IGF code is mainly used [31], along with the guidelines provided by the recently published handbook for hydrogen-fuelled vessels by DNV [32]. Even though IGF rules are mostly applicable for LNG, they can also be used as a basis for LH2 systems as well, considering their similar properties [20]. However, for novel projects, an equivalent level of safety with a referenced design should be demonstrated for the vessel through an alternative design approach [33,34].
For a maritime application, the design of a battery-powered system has different criteria, mainly focusing on the performance and safety levels. Regarding the performance of the battery-powered system, the biggest challenges are energy density, power density, charging duration, life span, cost, and sustainability [35]. DNV has also published technical guidelines to support the design of such vessels and the evaluation of safety and risk levels [36].

3.2. Systems and Equipment Onboard

3.2.1. Hydrogen Version

The connections from the hydrogen tank at the upper deck to the fuel cells at the aft of the main deck are shown in Figure 1. The catamaran’s design provides sufficient stability, enabling the placement of the hydrogen tank, piping, and vaporisers at the top deck. The type C double-walled LH2 tank has a pressure transmitter that will measure the pressure levels in the system. If there is a rapid pressure increase in the tank, there are two pressure relief valves mounted on top of it, as required by regulations, which will open immediately. The gas vents from these valves are led to the vent mast, which is located above tank connection space (TCS) adjacent to the tank, through gas vent piping. In this ventilated enclosure of TCS in which there are hydrogen sensors, fire detectors, vents, pipes, safety valves, vaporisers, etc., at least a 30 air changes per hour (ACH) ventilation rate is required. There is also a pressure building unit (PBU) that passively warms the liquid derived from the bottom of the tank and delivers it at its top in the cold gas space. Then, hydrogen is delivered to the vaporisers which convert cold hydrogen gas to room temperature hydrogen required for the fuel cells. After the vaporisers, there are pressure regulators to measure the pressure levels in the pipes, and if the pressure exceeds 10 bar, the pressure relief valves will open and gas will be vented to the vent mast. Then, there are three-way valves so that hydrogen is directed to the required fuel cell room even in case of damage/leakage in one of the pipes. The numerous master-gas valves, also called emergency shut-down (ESD) valves, throughout the whole gas distribution system should quickly shut off the flow of hydrogen once leakage is detected to avoid hazardous conditions by large accumulations of gas in the air. This arrangement with the cross-connected pipes and dual vaporisers was also utilised in the SF-Breeze high-speed ferry concept design and it provides redundancy of equipment in terms of safety [20]. The fuel pipes should either be gas-tight ventilated ducts or double-walled pipes, and they should not be led directly through control or accommodation spaces as required by regulations.
Once hydrogen enters the fuel cell room through the gas supply piping, there are double block-and-bleed valves for each of the fuel cells, before hydrogen enters the stack (Figure 2). Double block and bleed valves are used to stop (block) the flow of hydrogen immediately after the hydrogen leakage is detected. Delay time for leakage to stop once detected should in general be around 0.5–2 s. The bleed valve will open to release (‘’bleed’’) any pressure that remains in the pipes and hydrogen gas will flow through the vent pipe to the vent mast. According to regulations inside each stack (gas consumer), there should also be double block and bleed valves.
Fuel cell stacks used are Powercell MS-100, which are low-temperature PEM fuel cells [37]. They are placed at the aft of the main deck, behind the passengers’ area as far away from the crew cabin as possible, in two separated spaces at the port and starboard within gastight enclosures as required by regulations. The technical data of the fuel cell stacks are presented in Table 3. Hybridisation with batteries is not required since MS-100 stacks have a very fast response time with a minimum operational lifetime of 20,000 h (high durability). Hence, in this study, batteries are installed onboard only for emergency purposes in case of severe damage in hydrogen systems to provide a safe return to port. Battery packs are placed at the bottom deck in demihulls.
The control room with all the DC/DC converters and DC/AC inverters is adjacent to the fuel cell room in the main deck. Each DC/DC converter controls two fuel cell stacks in series and delivers DC power to the DC/AC inverter which converts it to AC, so that electricity is delivered to e-motors that drive the propellers. The e-motors are located at the bottom deck, one in each demihull.

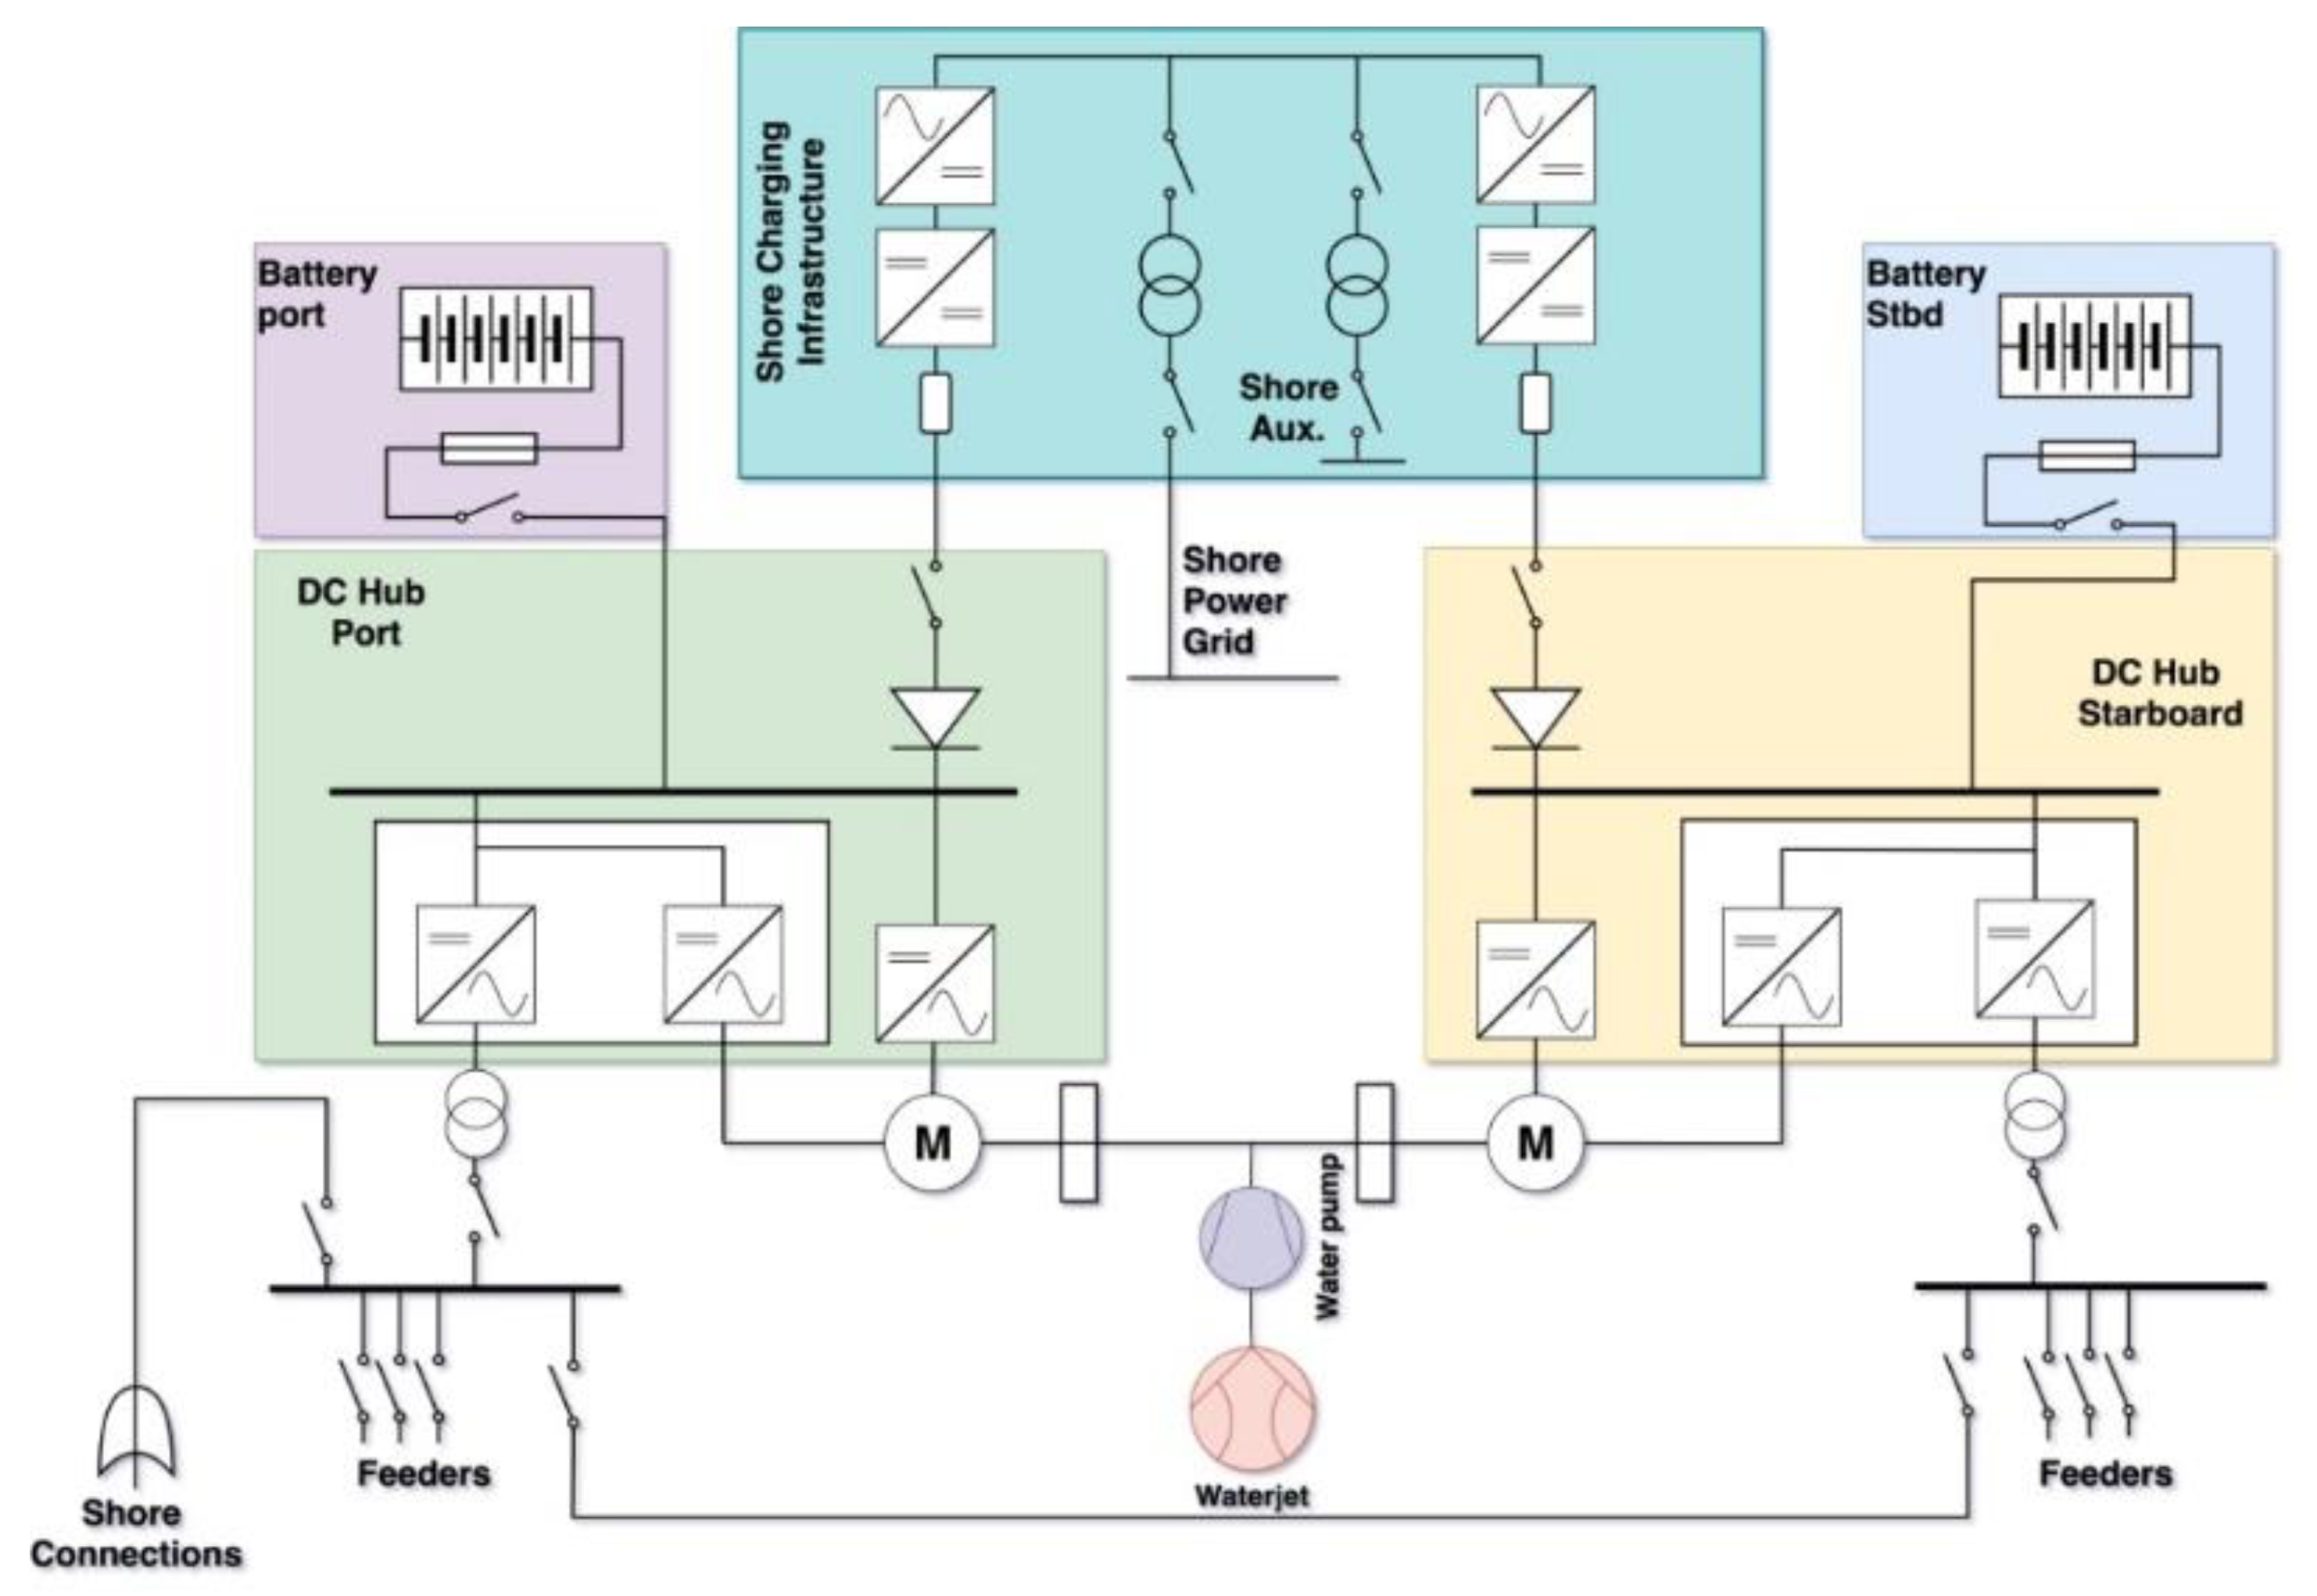
3.2.2. Battery Version
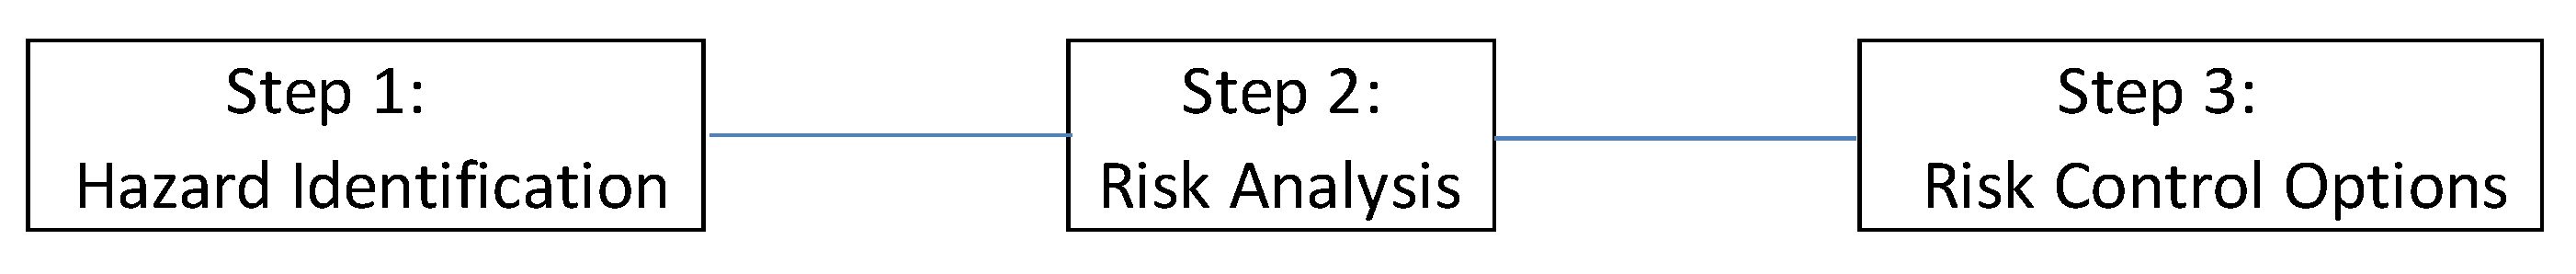
Figure 3 presents the battery power system on the battery version of the ferry. The two battery racks are connected to two DC hubs separately. In each DC hub, DC/AC converters were applied to enable the availability of power to motors and other energy feeders. There is also a shore connection within the hub which not only provides energy to the switchboard while docking but also charges the batteries. After the motors, the electricity will be converted into mechanical energy which drives water pumps of a waterjet. The waterjet will eventually drive the ferry. Both hydrogen and battery versions of the ferry satisfy the stability requirements for high-speed crafts (HSC). More details about the arrangement of the battery systems onboard the battery version of the high-speed ferry are presented by Boulougouris et al. [4].

4. HAZID

A HAZID analysis was performed for both designs to identify the most concerning hazards. Then, for each of them, the causes that can lead to the critical (accidental) event and the subsequent consequences were analysed. The determination of frequency index and consequence index that follows is based on the IMO’s FSA guideline [38]. The frequency index indicates the probability of an event to occur, and the consequence index is related to the severity of the event and the subsequent repercussions on human safety and ship structure. Since there are no past accident statistics from similar ships considering the novelty of the designs, the hazards’ rankings were discussed with experts for verification of results. The risk matrix is obtained by utilising the logarithmic scales of frequency and consequence as presented in Equation (1) on the basis of [25]:
Risk = Frequency × Consequence
log (Risk) = log (Frequency) + log (Consequence)
Risk Index (RI) = Frequency Index (FI) + Consequence Index (SI)
Hence, the risk index is obtained by adding the frequency index, which is also called probability index (PI), and the consequence (severity) index (SI). Certain RCOs need to be proposed to mitigate the risks of the most concerning hazards. A simplified flowchart of the FSA procedure followed is shown in Figure 4.

4.1. Hydrogen Version

There are four categories that were included in the HAZID analysis for the hydrogen version. All hazards should be either low or medium risk after the proper risk reduction measures are applied. Hazards are caused by improper installation, malfunction of equipment, or systems belonging to the design/construction/installation category, while accidental events can potentially occur during operations belonging to the operation category. The rest of the hazards can potentially occur during bunkering (refuelling) or emergency situations. The total number of hazards considered in this study is 35. The most severe hazards for the hydrogen version are presented in Table 4.
The most effective RCOs identified after the HAZID analysis for the hydrogen version of the ferry were the following:
  • Placement of LH2 tank and tank connection space at the upper deck.
  • Proper alarm/firefighting equipment.
  • Redundancy and proper arrangement of ventilation, hydrogen gas detection equipment, and safety valves.
  • Use equipment of proven usage and test it prior to use.

4.2. Battery Version

Following a similar approach, a HAZID was conducted for the battery version of the ferry [25]. A total of 55 hazards with frequencies and consequences were evaluated. The following number of hazards was identified for three categories:
  • Design, construction, installation (21 hazards);
  • Operation (25 hazards);
  • Emergency (9 hazards).
In Table 5, the most severe hazards associated with the battery-powered systems are presented; thus, in Section 5.2, the quantitative risk assessment is conducted to evaluate the safety of the vessel in detail.
The most effective RCOs identified after the HAZID analysis for the battery version of the ferry were the following:
  • Movement of batteries in the main deck to reduce the fire risk;
  • Proper alarm/firefighting system;
  • Testing of equipment prior to use;
  • Regular inspection and maintenance of battery-related equipment.

5. Gas and Smoke Dispersion Analyses

A gas dispersion analysis was conducted for the hydrogen version and a smoke/fire simulation for the battery version. Gas and smoke paths are presented in this section.
Hydrogen has a highly flammable and explosive nature. Maximum hydrogen concentrations and durations that flammable masses remain in the fuel cell room were measured. The effect of different ventilation conditions (30–120 ACH) was assessed. The leakage from different piping diameters (3–33 mm) at the inlet of the fuel cell stacks was stopped within 1 s after being detected by any of the sensors at the ceiling.
Batteries are associated with high fire risk. The smoke dispersion phenomenon was analysed in the battery room. The effects of firedoors (open or shut), FFS (on or off), and wind towards the bow of the ferry (no wind, wind velocities of 38mph and 6.9 mph) on the smoke paths was assessed.

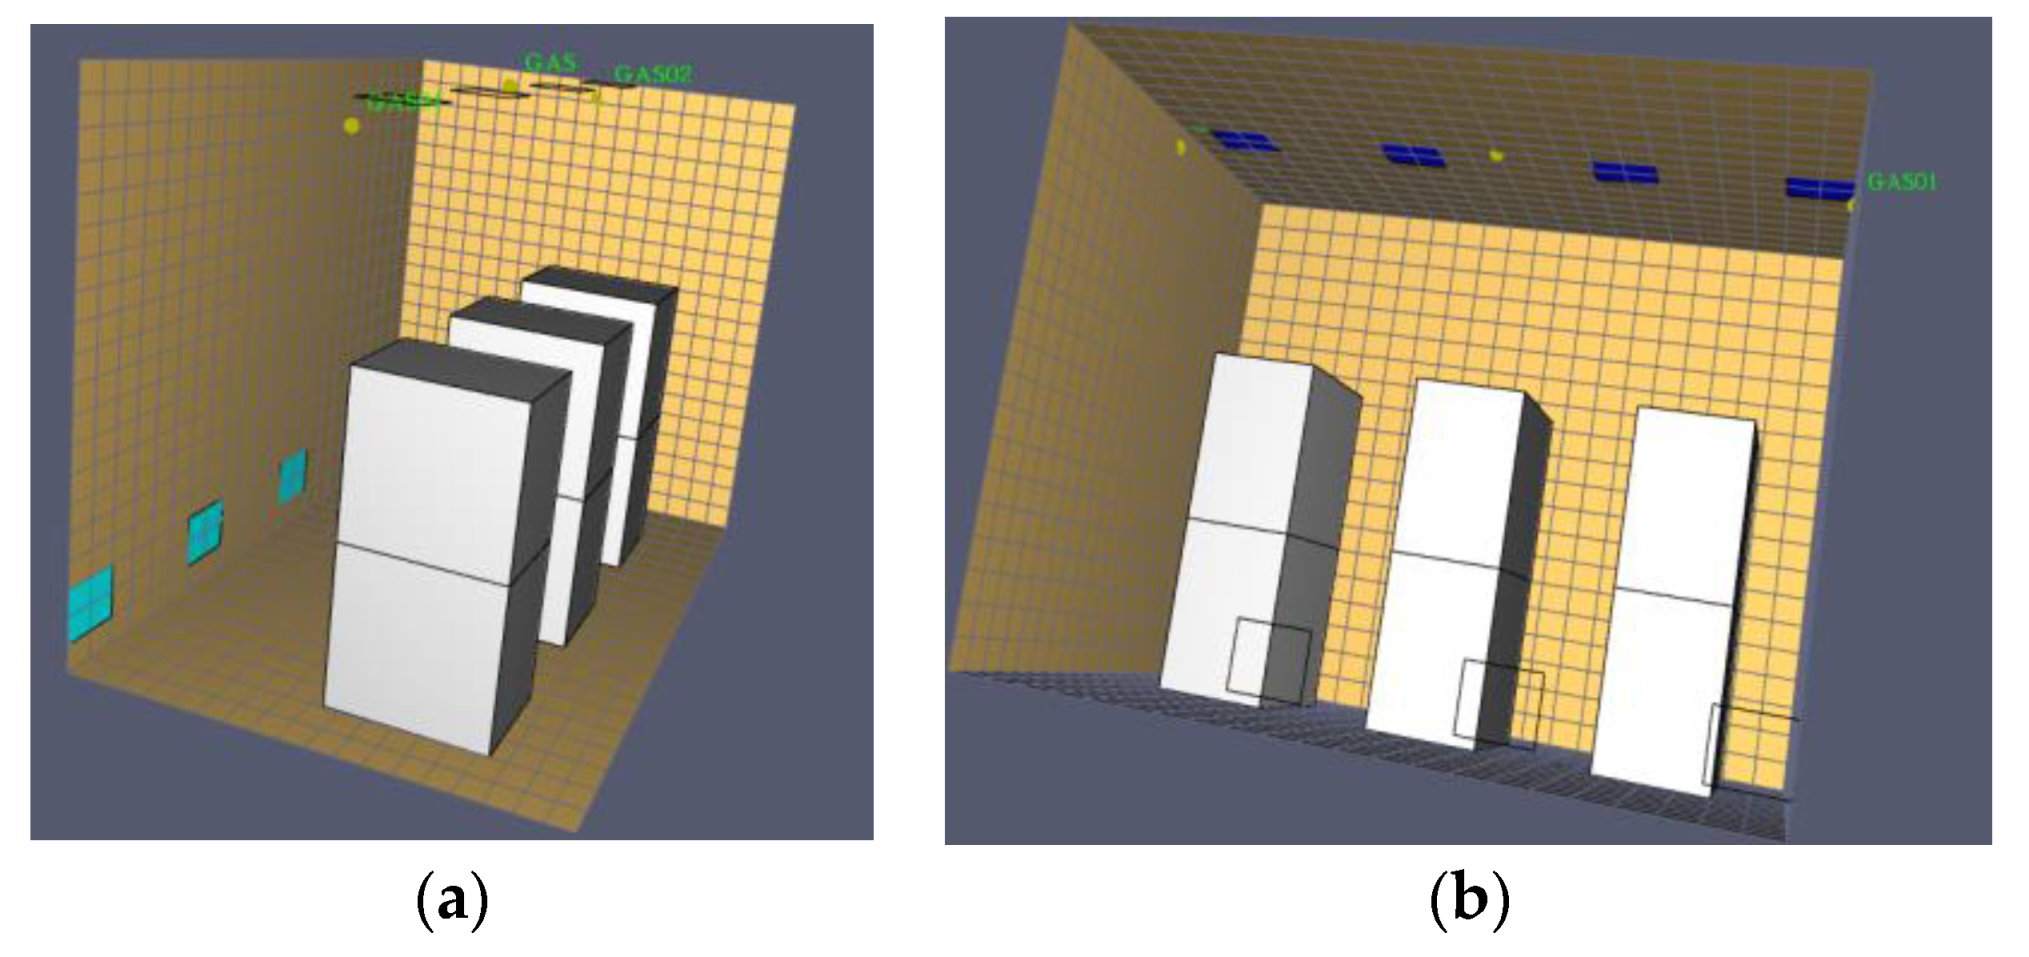
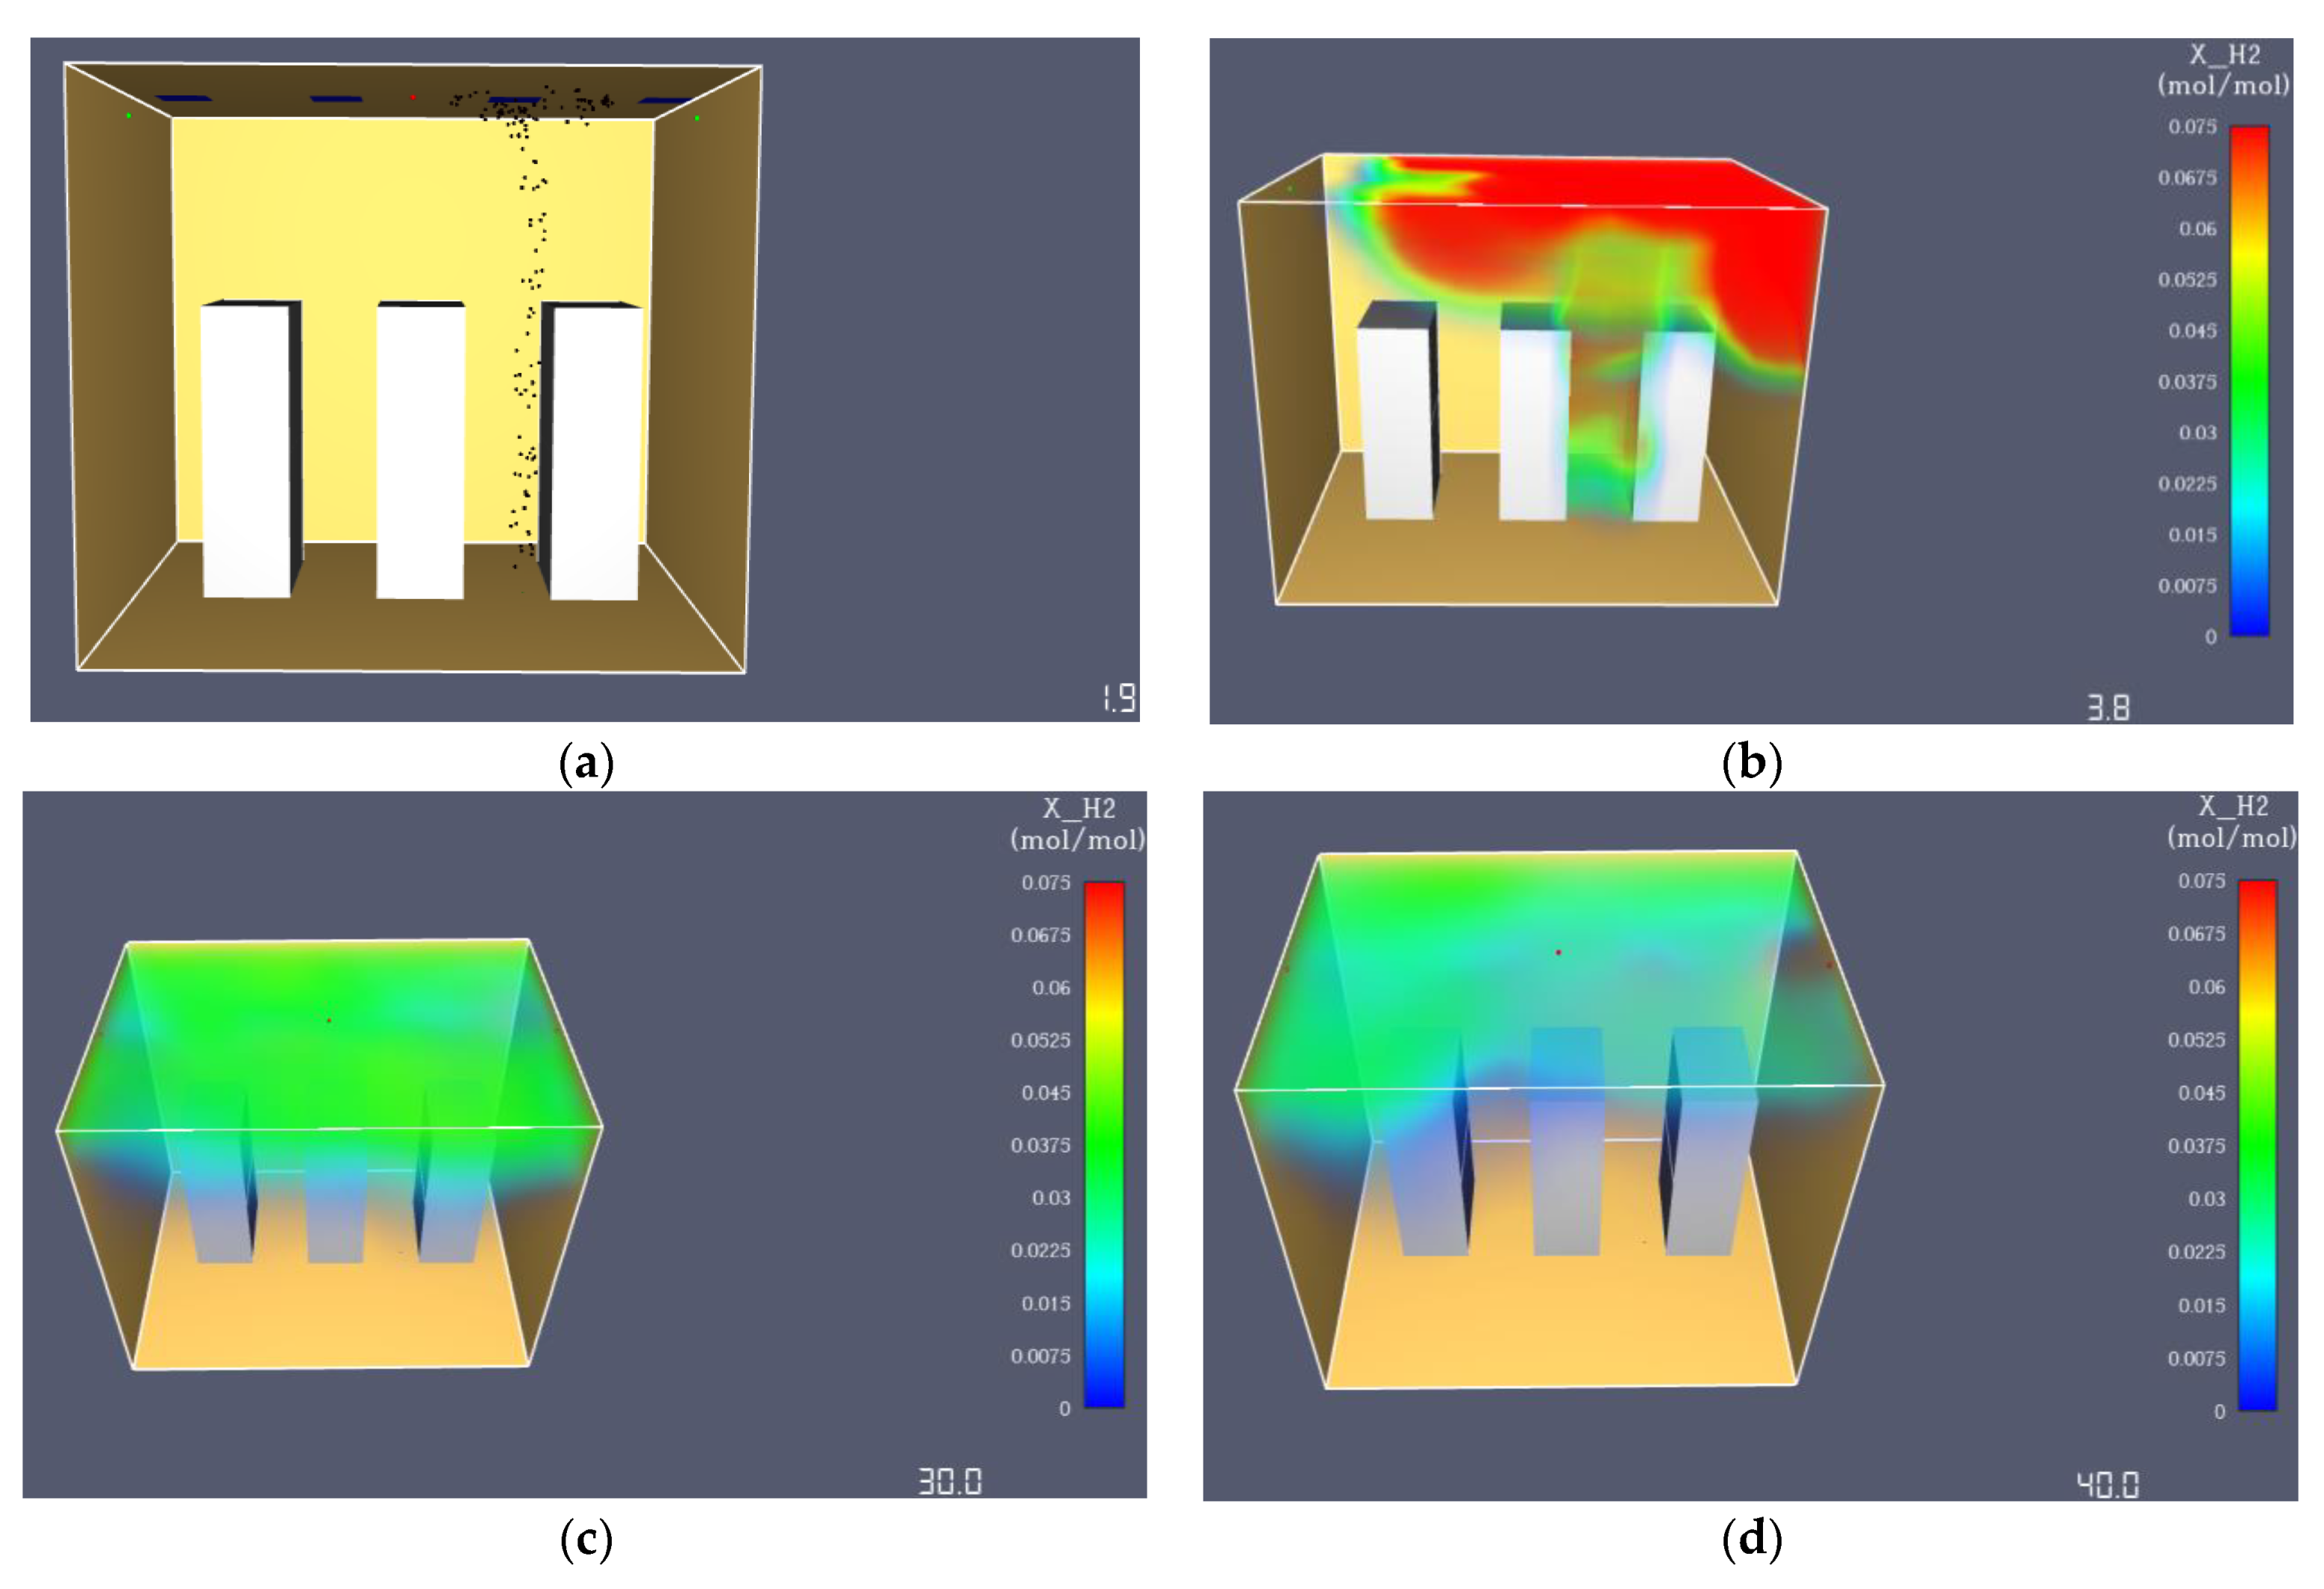
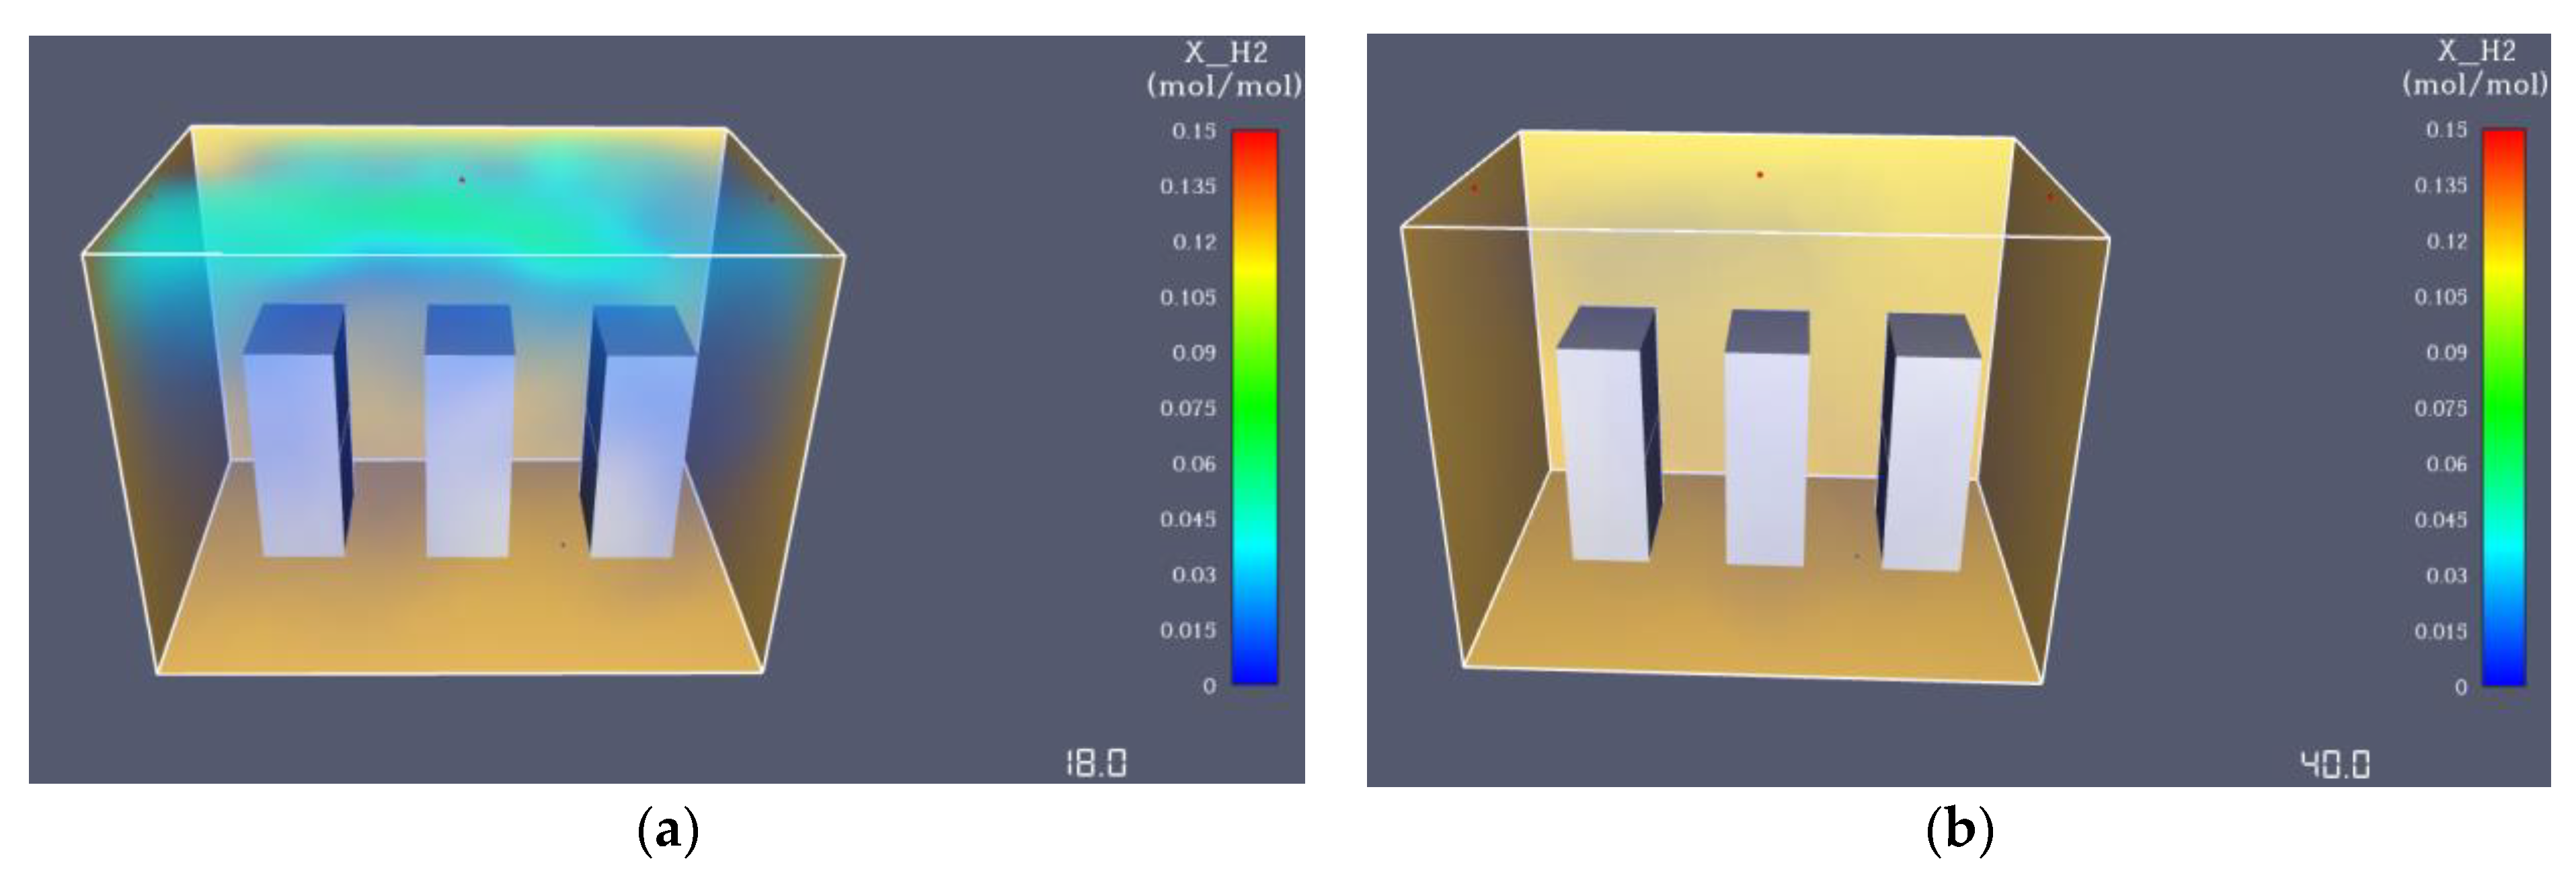
5.1. Hydrogen Version—Gas Dispersion Analysis

The most severe hazard according to HAZID results is the leakage in the fuel cell room due to piping damage, which was analysed with a quantitative approach in this section using CFD software called PyroSim, provided by Thunderhead Engineering. These simulations aimed to gain insight and understanding of the hydrogen dispersion in cases of potential leakage due to pipe damage under certain vent and sensor arrangements in the room. Leakage probability was not assessed in this study.
A mesh size of 7920 cells was used to perform the simulation in the fuel cell room. It was assumed for the analysis that the leakage due to the piping damage was at the inlet of the bottom stacks, which was 0.2 m above ground, but for simplicity of the simulations, the leakage position was assumed at a ground level. Fuel cell stacks are depicted with grey colour in Figure 5. Each of the six stacks provided a net power of 100 kW. This modular arrangement provides easy access and sufficient space for repairs and maintenance.
There were three natural (inlet) vents, depicted with light blue colour in Figure 5a, for the supply of air in the room from the lower part as it is required by regulations for gases lighter than air. These are ducts that were routed upwards to the upper deck, and not just holes (openings), to reduce the possibility of flooding under excessive trim by stern since the fuel cell room was at the aft of the main deck. There were also four mechanically driven exhaust air fans at the ceiling of the room (Figure 5b), considering the highly buoyant nature of hydrogen gas. Backflow of gas from the vent outlet to the vent inlet should be prevented by providing sufficient distance between them. For an ESD, protected machinery space at least 30 ACH ventilation rate is required [31]. There were also three sensors at the ceiling to detect hydrogen concentrations above 0.4% and trigger the automatic valves to stop the flow of hydrogen in the room within 1–2 s.
The double block and bleed valves in the fuel cell room stop the supply of hydrogen in the fuel cells and bleed any remaining hydrogen in the fuel pipes to the vent mast at the upper deck through vent pipes. Hydrogen supply in the room where leakage or ventilation failure has been detected should be stopped by the master-gas valves outside the fuel space enclosure.
The hydrogen release rate (m3/s) was calculated on the basis of [39] and [40], as shown in Equation (2).
Q gas =   C d × A × ρ × P × γ × ( 2 γ + 1 ) ( γ + 1 γ 1 ) ρ   m 3 / s
where Cd is the discharge coefficient for circular bore which is equal to 1 [17]. A is the hole area, which is πd2/4, where d is the leakage diameter (meters). In these simulations, leakage diameters considered were 3, 16, and 33 mm. The ratio of specific heats (γ) was assumed to be constant and equal to 1.4
The density (ρ) of hydrogen can be calculated as shown in Equation (3):
ρ = P/RT kg/m3
where P is the pressure at the inlet of the stack and was 8 × 10⁵ N/m2 and temperature (T) at the same position was 10 degrees Celsius so 283.15 K, according to the Powercell MS-100 data sheet [37]. The gas constant of hydrogen (R) was 4124 J/kgK, considering universal gas constant and hydrogen’s molecular weight. On the basis of these data and Equation (3), the density was obtained: ρ = 0.68 kg/m3.
Only the area of leakage varied for the different simulations since the pressure and temperature were the same at the inlets of fuel cell stacks, regardless of position. The hydrogen release rate (Qgas) could then be calculated on the basis of Equation (2) as follows:
Q gas =   1 × A × 0.68 × 8 × 100 , 000 × 1.4 × ( 2 1.4 + 1 ) ( 1.4 + 1 1.4 1 ) 0.68 = 742.69   ×   A = 742.69   ×   ( π   ×   d 2 / 4 )

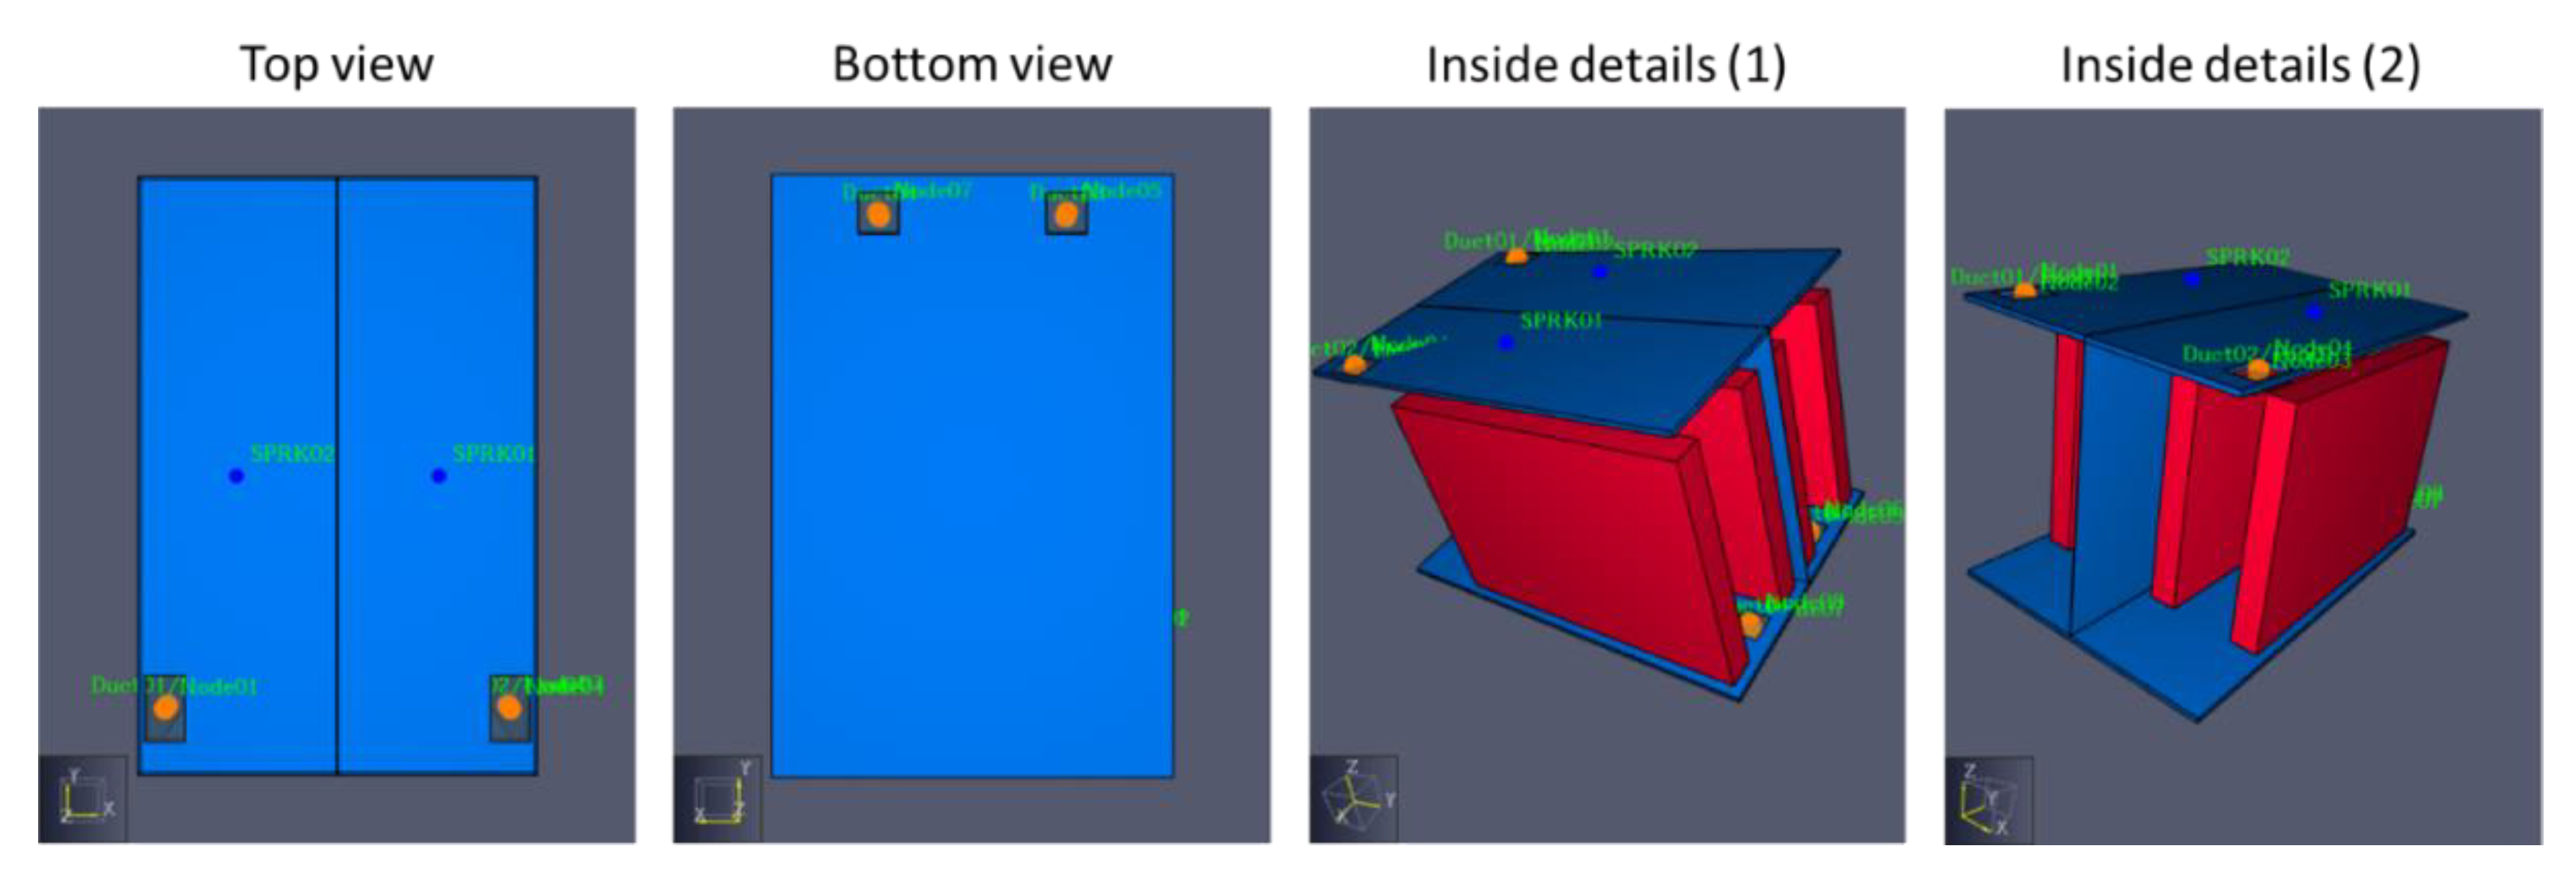
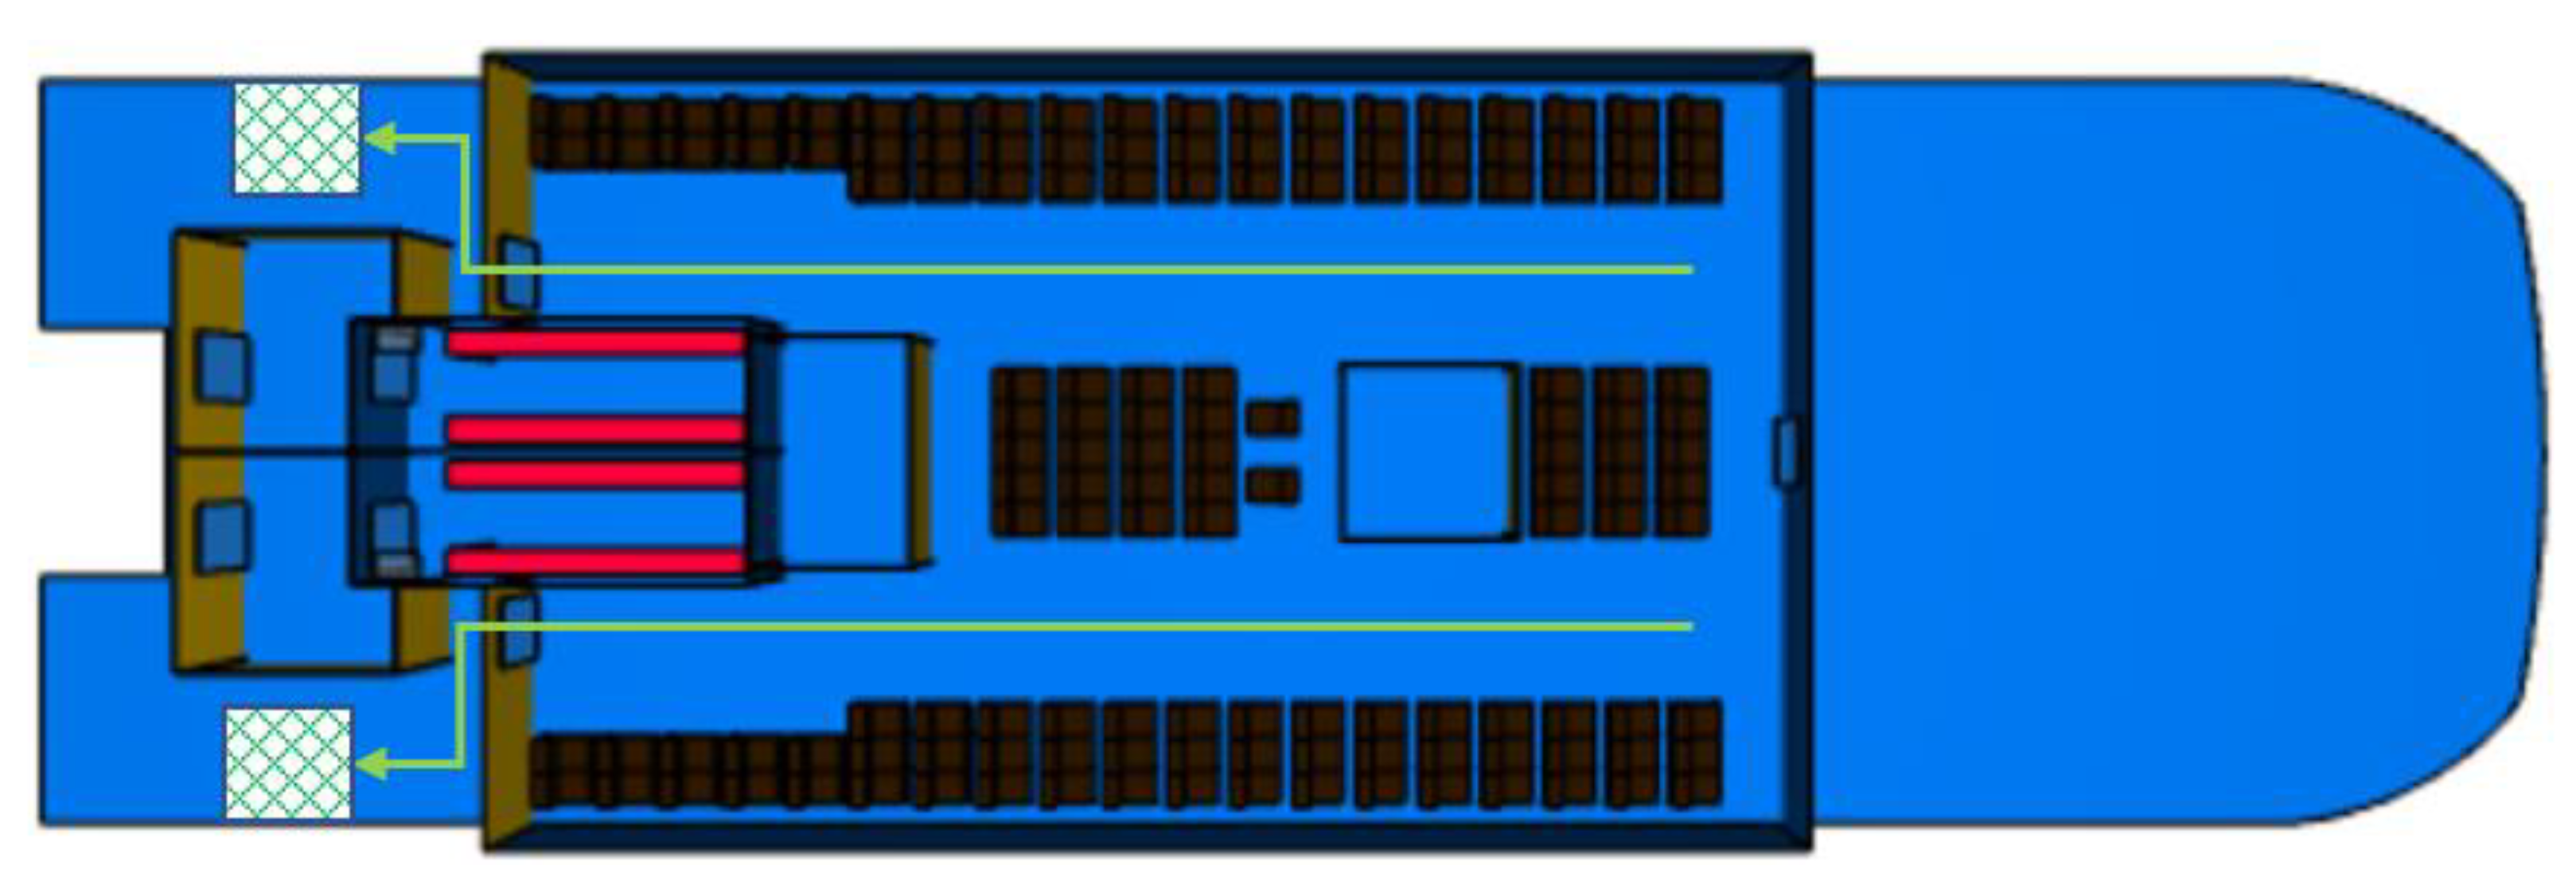
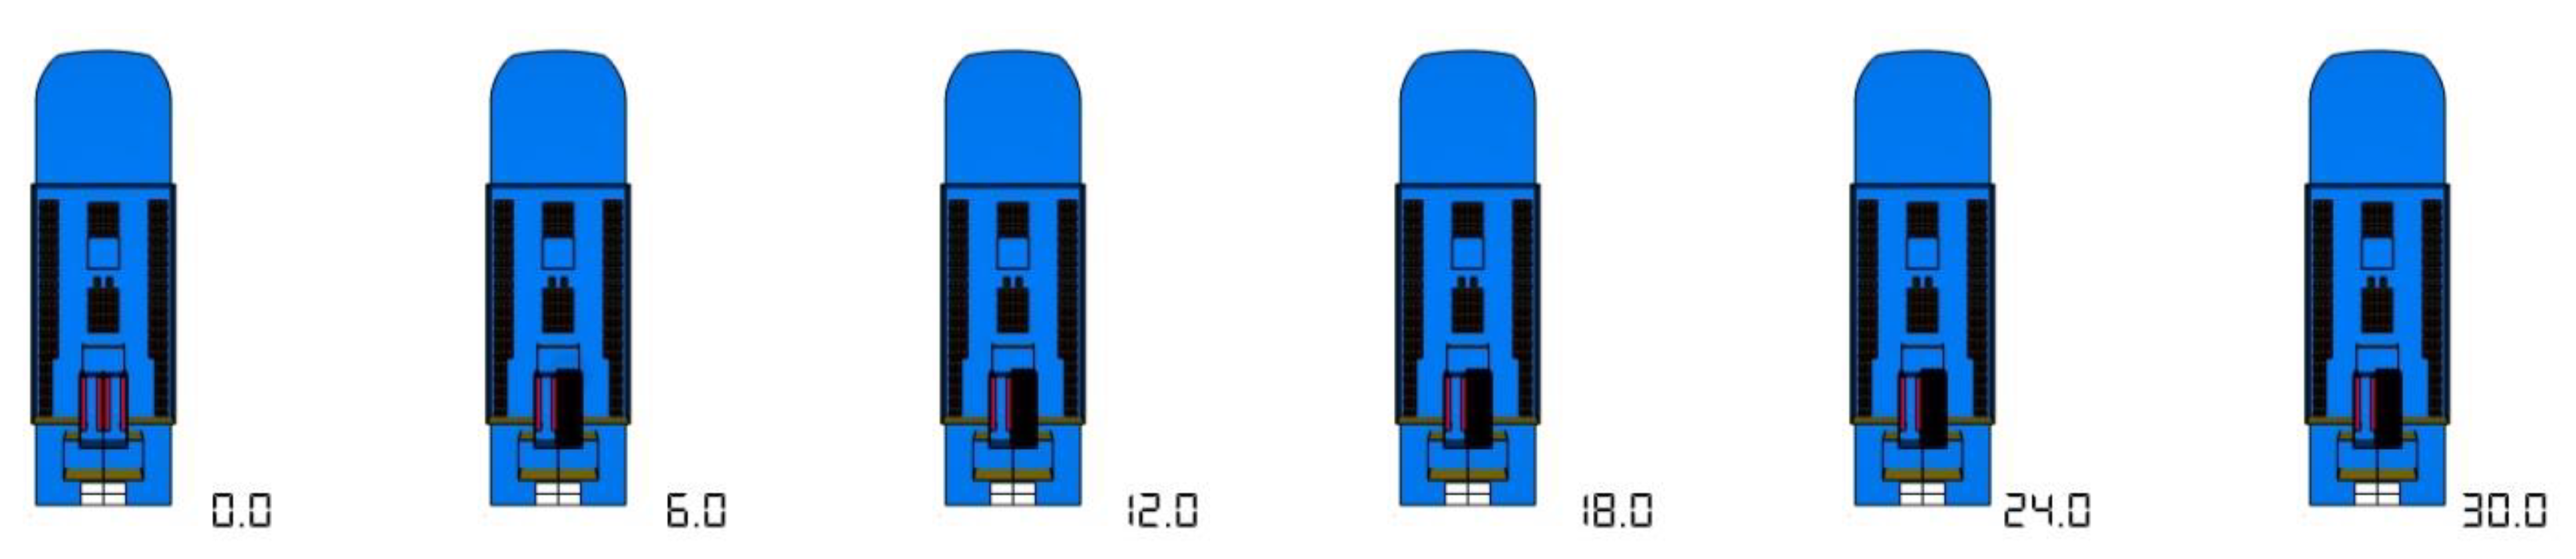
5.2. Battery Version-Smoke/Fire Simulation

In this section, a quantitative risk assessment is presented using a fire dynamic simulator (FDS) on the battery-powered version of the high-speed ferry to indicate the smoke and fire paths under various scenarios. In the fire simulation, the key is to model the heat release rate per area (HRRPA), which is related to the heat release rate and surface area of the burner as shown in Equation (4).
HRRPA = HRR/S
where HRRPA is the heat release rate per area (kW/m2), HRR is the heat release rate from the burning (kW), and S is the surface area of the burner (m2).
For the firefighting system (FFS), there are two key factors, flow rate and control strategy. The flow rate of the system is calculated as shown in Equation (5).
v ˙ = m / ρ · t
where v ˙ is the volume flow rate of the FFS chemical agent (m3/s), m is the total mass release of the agent (kg); ρ is the agent density (kg/m3), and t is the total release time duration (s). For the control strategy, the FFS is triggered when the temperature reaches 68 °C.
The main deck of the ferry includes both the battery room and the passenger area. Following the provided geometry from the shipyard, the 3D geometry model was developed, as shown in Figure 6. The blue plate is the main deck with passengers and the red blocks are the battery packs. The dark yellow panels are the walls on the main deck; the brown objects in the passenger area are chairs.
The battery room onboard the ferry includes the battery room walls, the battery packs, the sprayers of the FFS, and the inlet and outlet of the air ventilation system. The battery room was modelled and developed in PyroSim, and Figure 7 presents the developed model from the views from the top, bottom, and transparent inside:
  • Two air outlets were designed on the ceiling and are shown in the top view.
  • Another two air inlets are shown on the floor of the battery room, which can be seen in the bottom view.
  • Four battery packs (red blocks in inside details) are equipped onboard the ferry.
  • Two sprayers are installed on the ceiling, and they are marked as SPRK01 and SPRK02.
The battery fire heat released was provided by the manufacturer with a value of around 15,833 kJ/kWh obtained from a 14 min battery fire laboratory experiment; hence, the determined HRR was about 24,503 kW/kWh [41]. The dimension of the battery was also provided by the manufacturer: the width is 4 m, the depth is 0.5 m, and the height is 2.37 m [42]; hence, the surface area of the battery pack was determined as 25.33 m2. With the heat release rate and surface area, the HRRPA can be derived on the basis of Equation (4): HRPA = 242 kW/m2. The technical data for the batteries are shown in Table 6.
The FFS system onboard the ferry was Novec 1230 [43]. The data of the FFS were provided [44]; hence, the volume flow rate was able to be obtained on the basis of Equation (5): v ˙ = 192 litre/min.
The evacuation plan is summarised in Figure 8. The green arrows are the path of evacuation, and the green fishnet square is the evacuation exit.
The wind profile targets the worst scenario on the River Thames according to the historical data from Met Office in the United Kingdom [45]. The strongest wind along the river was 38 mph (west) on 4 January 2018, and the average wind speed since 2011 is about 6.9 mph. These two data points were used for the analysis in the PyroSim simulation.

6. Results and Discussion

6.1. Hydrogen Version

In this section, scenarios of hydrogen leakage from different piping diameters at the inlet of the bottom right stack are presented. The results for leakages at the inlets of the bottom middle and left fuel cell stacks were similar in terms of maximum hydrogen concentrations and the time it takes for the release of flammable masses. This indicates the minor impact that the change of position of leakage has in the simulation results for the same hydrogen release rate and exhaust vent flow rate, with the designed vent and sensor arrangement in the room (Figure 5).
Different vent and sensor arrangements (numbers, positions) were considered, but the one depicted in Figure 5 was considered the most beneficial in terms of risk minimisation in the fuel cell room. Redundancy of sensors inside the room is crucial so that in cases of potential malfunction of one of the components, leakage can be detected shortly after by any of the other two sensors. Fuel pipes are double-walled, with inert gas between the two concentric pipes and an outer diameter of 33 mm [46].

6.1.1. Scenario 1: Leakage Diameter 3 mm at the Inlet of Bottom Right Stack

The hydrogen release rate (Qgas) for a leakage of 3 mm was calculated on the basis of Equation (2): Qgas = 5.25 × 10⁻³ m3/s. Leakages of small piping diameters (3 mm or less) were considered to be the most likely failure scenarios for the hydrogen pipes.
The total volume flow rate of air is 0.16 m3/s to achieve 30ACH, considering that the volume of the room was 19.19 cubic meters. Hence, for each vent, the exhaust flow rate was 0.04 m3/s.
Hydrogen leakage was detected first by the middle sensor, 5.6 s after the release, as can be observed in Figure 9a, and 1 s later, hydrogen flow was stopped in the room. With 30 ACH, flammable mass concentrations can be avoided since the maximum percentage is 1% = 0.01 mol/mol, and the flammability range for hydrogen is 4–75%. Hence, there was no ignition risk (Figure 9b,c), even in the presence of ignition sources, as long as the leakage was stopped 1 s after detection. Leakage and potential malfunction of multiple systems (two or three sensors) can delay the detection of gas and potentially create a hazardous atmosphere with 30 ACH ventilation rate. However, it is considered a highly unlikely scenario.

6.1.2. Scenario 2: Leakage Diameter 16 mm at the Inlet of the Bottom Right Stack

The hydrogen release rate (Qgas) for a leakage of 16 mm was calculated on the basis of Equation (2): Qgas = 0.1493 m3/s.
To achieve 30 ACH, the total exhaust flow rate needs to be 0.16 m3/s. Leakage was detected at 1.9 s by the middle sensor and stopped 1 s later (Figure 10a). Maximum hydrogen concentration levels reached 7.5%, which was within the flammability range (Figure 10b). Flammable masses were mostly concentrated near the ceiling, due to hydrogen’s highly buoyant nature, and released after 30 s with 30 ACH (Figure 10c,d). Since flammable masses were near the top for a few seconds, the fire risk was lower, considering that there were fewer ignition sources near the ceiling and higher ignition probability near the stacks. However, the minimum ignition energy of hydrogen is very low, and therefore in case of ignition, ventilation systems need to be shut off and a gaseous fire suppressant (Novec1230) should be used. The deflagration to detonation transition (DDT) phenomenon was considered unlikely since there was a limited run-up distance in the confined fuel cell room, which had a volume of 19.19 m3 [20].
By increasing the ventilation rate from 30 to 60ACH, flammable masses were released much faster at 18 s, resulting in lower ignition risk (Figure 11). Maximum hydrogen concentration was also reduced from 7.5 to 7%.

6.1.3. Scenario 3. Full Pipe Rupture (33 mm) at the Inlet of Bottom Right Stack

The hydrogen release rate (Qgas) for a leakage of 33 mm was calculated on the basis of Equation (2): Qgas = 0.635 m3/s.
Full pipe rupture is the worst scenario, but it is also considered to be highly unlikely since pipes are double-walled, well-protected, away from the sides and of proven usage. Initially, a ventilation rate of 30ACH was assumed. Leakage was detected at 1.3 s by the middle sensor (Figure 12a). Hydrogen concentration levels reached 15%, which was below the lower explosion limit (LEL) of 18% (Figure 12b–d). With 30ACH, flammable masses (4–9%) were mostly concentrated near the ceiling, but they were not completely released outside, even after 40 s (Figure 12e). Hence, higher ventilation rates than 30ACH are suggested for safety under the worst-case scenario of full pipe rupture.
If 120ACH ventilation rate is used (Figure 13), the total volume flow rate of air needs to be 0.64 m3/s. Hence, flow rate of each exhaust vent was set at 0.16 m3/s. With 120ACH, flammable masses were released after 18 s, and at the end of the simulation (40 s), the room was completely emptied of hydrogen (100% air). Maximum concentrations remained at around 15% for the different ventilation rates considered, under full pipe rupture at the inlet of the bottom right stack. Unrealistically high ventilation rates (>200 ACH) would be required to avoid the flammability range completely during the entire simulation time for large leakages.
If the flow of hydrogen was stopped 2 s after leakage was detected instead of 1 s as in all the previous scenarios, maximum concentrations reached 20%, which was within the explosion range (Figure 14). Flammable masses were released after 25 s, and thus 7 s later compared to the corresponding scenario where the leakage was stopped 1 s after being detected (Figure 13a). This indicates that the leakage must be stopped within 1 s after being detected.
A denser mesh with more cells included in the domain of the analysis resulted in higher accuracy. Hence, we attempted to increase the mesh from the original size of 7920 cells up to 16,000 cells to assess if the accuracy of simulations was enhanced. However, minor changes were observed in the maximum hydrogen concentrations and release time of flammable gases outside the fuel cell room. Hence, to save computational cost, without significant simulation time required to obtain the results, the mesh size remained unchanged (7920 cells). The cells of the computational domain are shown in Figure 5.

6.2. Battery Version

To quantitatively evaluate the safety level of the battery ferry, six scenarios were developed on the basis of the situation and condition of doors and wind levels:
  • Scenario 1 (S1): this is the default condition with the fire doors shut, the FFS off, and no wind effect;
  • Scenario 2 (S2): the FFS is on while keeping the fire doors shut and no wind effect;
  • Scenario 3 (S3): the fire doors are open while keeping the FFS off and no wind effect;
  • Scenario 4 (S4): the fire doors keep open and no wind effect while the FFS is on;
  • Scenario 5 (S5): the fire doors are open and the FFS is on while adding a wind at 38 mph (61 km/h) towards the ferry’s bow;
  • Scenario 6 (S6): keep doors opened, FFS on, and add a wind at 6.9 mph (11 km/h) towards the ferry’s bow.
All these scenarios were simulated and discussed from the perspectives of fire and smoke paths. The smoke paths under different scenarios can indicate the time to reach the evacuation area.
Figure 15, Figure 16, Figure 17, Figure 18, Figure 19 and Figure 20 show the smoke in S1–6 with different conditions of fire doors, FFS, and winds. Figure 15 and Figure 16 show the smoke trapped inside the battery room, with the only difference being the FFS working (green particles in Figure 16). Hence, the risk for passengers is low as long as the smoke/fire does not escalate in adjacent places, considering that fire doors are kept closed, preventing potential further damage.
In S3 and S4, the situation of the fire door open was simulated, and the smoke paths are presented in Figure 17 and Figure 18. Smoke was mostly concentrated at the aft of the main deck, but in S3, smoke was not blocking the evacuation exit, since it was rising and released into the atmosphere. It took around 6–8 s for the smoke to reach the aft extent of the main deck in S3, and until the end of the simulations, there was no significant difference in the accumulation of smoke at the back of the main deck.
In the last two scenarios, two wind speeds were integrated into the model to see the smoke movement under extreme and average wind conditions (Figure 19 and Figure 20). It is apparent in S4 and S6 that the smoke accumulated in the evacuation region. The smoke reached the evacuation region in about 13 s in S4 and it took about 4 s to blow the smoke to the evacuation region; following this, the smoke was blown away and dispersed until accumulated again in 12 s. In S5, due to the extremely strong wind, there was no similar accumulation phenomenon. It was observed with the mixture of the agent from FFS in S4, S5, and S6 that the mixed smoke had a higher density than air, and therefore the mixture moved downward and accumulated, different from S3, in which the smoke rose and was released into the atmosphere.
To identify the fire conditions under different scenarios, the heat release rates were monitored, as shown in Figure 21. The observation from S1 and S2 is that the FFS reduced the fire time by about 3 s. This means that the selected FFS system can delay the fire by 30%. In all other cases, all the fire doors were open, and the air was continuously circulated for the fire; hence, the HRRs fluctuated significantly. When there was a high wind effect with a velocity of 61 km/h towards the bow of the ferry, with FFS on and firedoors open (S5), the highest heat release rates were observed between 15 and 30 s, varying between 1600 and 2300 kW with a fluctuating nature (Figure 21).

7. Conclusions

In this study, a comparative safety assessment of the battery and hydrogen version of the Stavanger high-speed catamaran ferry was presented.
Placement of the LH2 tank at the upper deck and batteries at the aft of the main deck in the hydrogen and battery version, respectively, were considered the most suitable design solutions. In the hydrogen version, both fuel cell rooms were located within gastight enclosures in the main deck behind the passengers’ area. The DC/AC converters were required to supply AC to e-motors in both hydrogen and battery versions. Both designs satisfied the HSC stability requirements.
A qualitative HAZID approach was conducted for both versions to determine the most concerning hazards. For both designs, proper installation of alarm and firefighting equipment, as well as testing of the equipment prior to its use, were considered to be amongst the most effective RCOs in terms of safety. Leakage in the fuel cell room due to piping damage at the inlet of the fuel cell stacks, as well as fire in the battery room during construction/installation or operation were considered to be the most severe hazards for the hydrogen and battery version, respectively, and they were analysed in quantitative assessments using PyroSim software.
A battery has more energy stored at any instant wherein an accident might occur compared to fuel energy in the hydrogen fuel cell, which constitutes an increased fire risk for battery applications. In other words, when hydrogen leakage is detected by sensors in the fuel cell stacks or the room, the supply can be automatically shut off by valves, reducing the fire risk, despite hydrogen’s low ignition energy. In this study, in the case of hydrogen leakage, it was demonstrated that flow should be stopped within 1 s after gas concentrations higher than 0.4% are detected by any of the three sensors in the ceiling of the fuel cell room, in order to avoid explosive atmospheres under piping leakages from diameters of 16–33 mm. For the battery version, there is one sprayer of FFS in the ceiling of each battery room to reduce the smoke concentration and the probability of fire. The sprayer of FFS is activated when the temperature reaches 68 degrees Celsius, spraying with a volume flow rate of 192 litre/min. Minimising ignition sources in fuel cell and battery rooms is crucial for both designs so that potential gas or smoke released will not lead to fires. In the case of a fire, Novec1230 should be used as the firefighting system in fuel cell and battery rooms. Gastight bulkheads and firedoors are essential for hydrogen and battery versions, respectively, in order to mitigate the escalation risk to adjacent places and especially in the passenger area in the middle part of the main deck. Ventilation can be effective before any ignition takes place in both designs, but in the case of a fire, vents need to be shut off.
For the hydrogen version, leakages of 3 mm diameter did not constitute an ignition risk if leakage was stopped within 1 s after being detected. For 16 mm diameter of piping leakage, flammable masses, with 7.5% hydrogen concentration in air, were present in the room with 30ACH for around 30 s. However, they were mostly concentrated near the ceiling, away from the stacks, resulting in low ignition risk. In the case of full pipe rupture (33 mm diameter), increasing the ventilation rates from 30 to 120 ACH can result in a significant reduction of time duration that flammable masses remain in the room. In the case where leakage was stopped within 1 s after being detected, the flammable masses were completely released after 18 s with 120 ACH, whereas with 30ACH, flammable masses, with 4–9% hydrogen concentrations in air, remained near the ceiling, even after 40 s. In the case where leakage was stopped after 2 or more seconds, explosive atmospheres can be created with concentrations above 20% even with 120ACH.
For the battery version, it was demonstrated that the role of the FFS is crucial in cases of ignition. In ordinary conditions with fire door shut, FFS on, and air ventilation closed, the fire duration can be reduced by about 3 s, a 30% reduction compared to the condition without an FFS system. When the firedoors were open, without air ventilation, the use of FFS resulted in higher smoke concentrations near the ground, with the smoke accumulated in the evacuation region. The highest heat release rates over time were observed in the scenario in which there was a high wind velocity of 61 km/h towards the ferry’s bow, with FFS on and firedoors open, with heat release rates varying between 1600 and 2300 kW from 15 to 30 s.
Overall, it seems that both hydrogen and battery designs can be feasible in terms of safety as long as all the proper RCOs are considered and there are sufficient safeguards in place to mitigate potential accident impacts. Gastight bulkheads and firedoors are mandatory in hydrogen and battery versions, respectively, and ignition sources should be minimised in both designs. Hydrogen design can be considered of higher risk because of the wide explosive range of the fuel. Appropriate measures, in terms of gas detection and ventilation, were taken to avoid the range of hydrogen concentrations between 18 and 59%, even if the flammability range (4–75%) could not be avoided. The DDT phenomenon was considered unlikely in a room with a volume of 19.19 m3, which means that flame propagation speed could not be significantly increased to cause detonation. In the case of a fire in the fuel cell or battery rooms, the timely use of FFS (Novec 1230) can significantly reduce the fire duration and minimise the damage impact. Further research studies could include the cost–benefit analysis of the various components and arrangements, as well as the holistic optimisation of the designs including safety as an objective.

Author Contributions

Conceptualisation, F.M., E.B.; methodology, F.M., H.W.; formal analysis, F.M., H.W.; resources, E.B.; writing—original draft preparation, F.M.; writing—review and editing, F.M., E.B., N.L.T., A.P., M.C., H.W., G.S.; visualisation, F.M., H.W.; supervision, E.B., funding acquisition, E.B. All authors have read and agreed to the published version of the manuscript.

Funding

This research has been partially supported by the EC H2020 project TRAM with grant agreement 769303.

Institutional Review Board Statement

Not applicable.

Informed Consent Statement

Not applicable.

Acknowledgments

Boulougouris, Trivyza, Wang, Priftis, Guangyu, and Cheliotis greatly acknowledge the funding from DNV and the Royal Caribbean Group for the MSRC establishment and operation. The research herein has also been partially supported by EC H2020 project TRAM with grant agreement 769303. The opinions expressed herein are those of the authors and should not be construed to reflect the views of EC, DNV, or RCG.

Conflicts of Interest

The authors declare no conflict of interest.

References

  1. Choi, C.H.; Yu, S.; Han, I.S.; Kho, B.K.; Kang, D.G.; Lee, H.Y.; Seo, M.S.; Kong, J.W.; Kim, G.; Ahn, J.W.; et al. Development and demonstration of PEM fuel-cell-battery hybrid system for propulsion of tourist boat. Int. J. Hydrog. Energy 2016, 41, 3591–3599. [Google Scholar] [CrossRef]
  2. Hydrogen Fuel Cell Boat Unveiled in Turkey News|SDG Knowledge Hub IISD. Available online: http://sdg.iisd.org/news/hydrogen-fuel-cell-boat-unveiled-in-turkey/ (accessed on 10 May 2021).
  3. Chiche, A.; Andruetto, C.; Lagergren, C.; Lindbergh, G.; Stenius, I.; Peretti, L. Feasibility and impact of a Swedish fuel cell-powered rescue boat. Ocean Eng. 2021, 234, 109259. [Google Scholar] [CrossRef]
  4. Boulougouris, E.; Papanikolaou, A.; Dahle, M.; Tolo, E.; Yan, X.K.; Jürgenhake, C.; Seidenberg, T.; Sachs, C.; Brown, C.; Jenset, F. Implementation of Zero Emission Fast Shortsea Shipping. In Proceedings of the SNAME Maritime Convention, Providence, RI, USA, 28 October 2021. [Google Scholar] [CrossRef]
  5. Cheliotis, M.; Boulougouis, E.; Trivyza, N.L.; Theotokatos, G.; Livanos, G.; Mantalos, G.; Stubos, A.; Stamatakis, E.; Venetsanos, A. Review on the safe use of ammonia fuel cells in the maritime industry. Energies 2021, 14, 3023. [Google Scholar] [CrossRef]
  6. Nikolopoulos, L.; Boulougouris, E. A Methodology for the Holistic, Simulation Driven Ship Design Optimization under uncertainty. In Proceedings of the International Marine Design Conference 2018, Helsinki, Finland, 1 June 2018; Available online: https://www.researchgate.net/publication/325735524 (accessed on 10 May 2021).
  7. Priftis, A.; Boulougouris, E.; Turan, O.; Atzampos, G. Multi-objective robust early stage ship design optimisation under uncertainty utilising surrogate models. Ocean Eng. 2020, 197, 106850. [Google Scholar] [CrossRef]
  8. Papanikolaou, A.; Xing-Kaeding, Y.; Strobel, J.; Kanellopoulou, A.; Zaraphonitis, G.; Tolo, E. Numerical and experimental optimization study on a fast, zero emission catamaran. J. Mar. Sci. Eng. 2020, 8, 657. [Google Scholar] [CrossRef]
  9. Shi, G.; Priftis, A.; Xing-Kaeding, Y.; Boulougouris, E.; Papanikolaou, A.D.; Wang, H.; Symonds, G. Numerical investigation of the resistance of a zero-emission full-scale fast catamaran in shallow water. J. Mar. Sci. Eng. 2021, 9, 563. [Google Scholar] [CrossRef]
  10. Xing-Kaeding, Y.; Papanikolaou, A. Optimization of the propulsive efficiency of a fast catamaran. J. Mar. Sci. Eng. 2021, 9, 492. [Google Scholar] [CrossRef]
  11. Evrin, R.A.; Dincer, I. Thermodynamic analysis and assessment of an integrated hydrogen fuel cell system for ships. Int. J. Hydrog. Energy 2019, 44, 6919–6928. [Google Scholar] [CrossRef]
  12. Cavo, M.; Gadducci, E.; Rattazzi, D.; Rivarolo, M.; Magistri, L. Dynamic analysis of PEM fuel cells and metal hydrides on a zero-emission ship: A model-based approach. Int. J. Hydrog. Energy 2021, 46, 32630–32644. [Google Scholar] [CrossRef]
  13. Sarı, A.; Sulukan, E.; Özkan, D.; Sıdkı Uyar, T. Environmental impact assessment of hydrogen-based auxiliary power system onboard. Int. J. Hydrog. Energy 2021, 46, 29680–29693. [Google Scholar] [CrossRef]
  14. Wang, H.; Boulougouris, E.; Theotokatos, G.; Zhou, P.; Priftis, A.; Shi, G. Life cycle analysis and cost assessment of a battery powered ferry. Ocean Eng. 2021, 241, 110029. [Google Scholar] [CrossRef]
  15. Lindstad, H.E.; Eskeland, G.S.; Rialland, A. Batteries in offshore support vessels—Pollution, climate impact and economics. Transp. Res. Part D Transp. Environ. 2017, 50, 409–417. [Google Scholar] [CrossRef]
  16. Vanem, E.; Salucci, C.B.; Bakdi, A.; Sheim Alnes, Ø.Å. Data-driven state of health modelling—A review of state of the art and reflections on applications for maritime battery systems. J. Energy Storage 2021, 43, 103158. [Google Scholar] [CrossRef]
  17. Mao, X.; Ying, R.; Yuan, Y.; Li, F.; Shen, B. Simulation and analysis of hydrogen leakage and explosion behaviors in various compartments on a hydrogen fuel cell ship. Int. J. Hydrog. Energy 2021, 46, 6857–6872. [Google Scholar] [CrossRef]
  18. Yuan, Y.; Wu, S.; Shen, B. A numerical simulation of the suppression of hydrogen jet fires on hydrogen fuel cell ships using a fine water mist. Int. J. Hydrog. Energy 2021, 46, 13353–13364. [Google Scholar] [CrossRef]
  19. Aarskog, F.G.; Hansen, O.R.; Strømgren, T.; Ulleberg, Ø. Concept risk assessment of a hydrogen driven high speed passenger ferry. Int. J. Hydrog. Energy 2020, 45, 1359–1372. [Google Scholar] [CrossRef]
  20. Pratt, J.W.; Klebanoff, L.E. Feasibility of the SF-BREEZE: A Zero-Emission, Hydrogen Fuel Cell, High-Speed Passenger Ferry; Sandia National Laboratories: Livermore, CA, USA, 2016; Available online: https://www.ebdg.com/wp-ebdg-content/uploads/2016/10/SF-BREEZE-SAND2016-9719.pdf (accessed on 18 March 2021).
  21. Li, F.; Yuan, Y.; Yan, X.; Malekian, R.; Li, Z. A study on a numerical simulation of the leakage and diffusion of hydrogen in a fuel cell ship. Renew. Sustain. Energy Rev. 2018, 97, 177–185. [Google Scholar] [CrossRef] [Green Version]
  22. Jeong, B.; Oguz, E.; Wang, H.; Zhou, P. Multi-criteria decision-making for marine propulsion: Hybrid, diesel electric and diesel mechanical systems from cost-environment-risk perspectives. Appl. Energy 2018, 230, 1065–1081. [Google Scholar] [CrossRef] [Green Version]
  23. Andersson, P.; Wikman, J.; Arvidson, M.; Larsson, F.; Willstrand, O. Safe Introduction of Battery Propulsion at Sea; Safety and Transport Borås: Borås, Sweden, 2017; Available online: https://publications.lib.chalmers.se/records/fulltext/250628/250628.pdf (accessed on 15 June 2021).
  24. DNV GL. Rules for Classification Ships; DNV GL AS: Oslo, Norway, 2019. Available online: https://rules.dnvgl.com/ServiceDocuments/dnvgl/#!/industry/1/Maritime/1/DNV%20GL%20rules%20for%20classification:%20Ships%20(RU-SHIP) (accessed on 1 July 2020).
  25. Wang, H.; Boulougouris, E.; Theotokatos, G.; Priftis, A.; Shi, G.; Dahle, M.; Tolo, E. Risk assessment of a battery-powered high-speed ferry using formal safety assessment. Safety 2020, 6, 39. [Google Scholar] [CrossRef]
  26. Lanssen, C.; Sandblost, T.; Lanssen, E. Battery/Fuel Cell Fast Ferry. Trondheim/Sandtorg. 2017. Available online: https://www.nho.no/siteassets/nox-fondet/rapporter/2018/nox-report---rev-8.doc-002.pdf (accessed on 1 July 2021).
  27. Pivetta, D.; Dall’Armi, C.; Taccani, R. Multi-objective optimization of hybrid PEMFC/Li-ion battery propulsion systems for small and medium size ferries. Int. J. Hydrog. Energy 2021, 46, 35949–35960. [Google Scholar] [CrossRef]
  28. Wu, P.; Partridge, J.; Bucknall, R. Cost-effective reinforcement learning energy management for plug-in hybrid fuel cell and battery ships. Appl. Energy 2020, 275, 115258. [Google Scholar] [CrossRef]
  29. Klebanoff, L.E.; Caughlan, S.A.M.; Madsen, R.T.; Conard, C.J.; Leach, T.S.; Appelgate, T.B. Comparative study of a hybrid research vessel utilizing batteries or hydrogen fuel cells. Int. J. Hydrog. Energy 2021, 46, 38051–38072. [Google Scholar] [CrossRef]
  30. Boulougouris, E.; Priftis, A.; Dahle, M.; Tolo, E.; Papanikolaou, A.; Xing-Kaeding, Y.; Jürgenhake, C.; Svendsen, T.; Bjelland, M.; Kanellopoulou, A.; et al. TrAM-Transport: Advanced and Modular. In Proceedings of the 8th Transport Research Arena TRA 2020, Helsinki, Finland, 27–30 April 2020; Available online: https://tramproject.eu/ (accessed on 11 September 2021).
  31. IMO. Adoption of the International Code of Safety for Ships Using Gases or Other Low-Flashpoint Fuels (IGF CODE); MSC 95/22/Add.1; IMO: London, UK, 2015. [Google Scholar]
  32. DNV. Handbook for Hydrogen Fueled Vessels, MarHySafe JDP Phase 1, 1st ed.; DNV: Hovik, Norway, 2021. [Google Scholar]
  33. IMO. Guidelines for the Approval of Alternatives and Equivalents as Provided for in Various IMO Instruments; MSC.1/Circ.1455; IMO: London, UK, 2013. [Google Scholar]
  34. IMO. Revised Guidelines on Alternative Design and Arrangements for SOLAS Chapters II-1 and III.; MSC.1/Circ.1212/Rev.1; IMO: London, UK, 2019. [Google Scholar]
  35. Comsol. Meeting the Challenges of Battery Design with Modeling and Simulation. IEEE Spectrum. Available online: https://spectrum.ieee.org/energy/renewables/meeting-the-challenges-of-battery-design-with-modeling-and-simulation (accessed on 15 September 2021).
  36. DNV. Rules for Classification: Ships—DNV-RU-SHIP Pt.6 Ch.2. Propulsion, Power Generation and Auxiliary Systems; DNV: Hovik, Norway, 2019. [Google Scholar]
  37. Powercell MS-100 Fuel Cells System Technical Description. Available online: https://solteknikk.no/wp-content/uploads/2020/12/PCS-MS-100-Technical-description-1.pdf (accessed on 15 March 2021).
  38. IMO. Revised Guidelines for Formal Safety Assessment (Fsa) for Use in the Imo Rule-Making Process; IMO: London, UK, 2018. [Google Scholar]
  39. Failure Frequency Guidance by DNV GL (Old Account)—Issuu. Available online: https://issuu.com/dnv.com/docs/failure_frequency_guidance_process_ (accessed on 25 May 2021).
  40. Howard, G.W.; Tchouvelev, A.V.; Cheng, Z.; Agranat, V.M. Defining hazardous zones—Electrical classification distances. In Proceedings of the International Conference on Hydrogen Safety, Ontario, Canada, 8 September 2005. [Google Scholar]
  41. Larsson, F.; Andersson, P.; Blomqvist, P.; Mellander, B.E. Toxic fluoride gas emissions from lithium-ion battery fires. Sci. Rep. 2017, 7, 10018. [Google Scholar] [CrossRef] [PubMed]
  42. Corvus Dolphin Energy Datasheet. Available online: https://corvusenergy.com/wp-content/uploads/2019/04/CE_Datasheets_Corvus_Dolphin_Energy_pages-1.pdf (accessed on 15 May 2021).
  43. 3M™ Novec™ 1230 Fire Protection Fluid. Available online: https://multimedia.3m.com/mws/media/124688O/3m-novec-1230-fire-protection-fluid.pdf (accessed on 20 May 2021).
  44. Wang, Q.; Li, K.; Wang, Y.; Chen, H.; Duan, Q.; Sun, J. The efficiency of dodecafluoro-2-methylpentan-3-one on suppressing the lithium-ion battery fire. J. Electrochem. Energy Convers. Storage 2018, 15, 041001. [Google Scholar] [CrossRef] [Green Version]
  45. Met Office River Thames—Blackfriars Railway Bridge Wind Forecast, Greater London—WillyWeather. Available online: https://wind.willyweather.co.uk/se/greater-london/river-thames----blackfriars-railway-bridge.html (accessed on 1 June 2021).
  46. Blaylock, M.; Pratt, J.; Bran-Anleau, G.; Proctor, C. Informing Hazardous Zones for On-Board Maritime Hydrogen Liquid and Gas Systems; Sandia National Laboratories: Livermore, CA, USA, 2018. Available online: https://energy.sandia.gov/wp-content/uploads/2018/01/SFBreeze_SAND2018-0585_Blaylock.pdf (accessed on 15 July 2021).
Figure 1. Onboard hydrogen systems.
Applsci 12 02919 g001
Figure 2. Gas and vent piping in the fuel cell room.
Applsci 12 02919 g002
Figure 3. Battery power system.
Applsci 12 02919 g003
Figure 4. FSA methodology.
Applsci 12 02919 g004
Figure 5. Vent and sensor arrangement in the fuel cell room: (a) inlet vents; (b) exhaust vents and hydrogen sensors in the ceiling.
Applsci 12 02919 g005
Figure 6. Three-dimensional geometry model of the ferry in PyroSim ((A) battery room deck; (B) with superstructure).
Applsci 12 02919 g006
Figure 7. Battery room design (top view, bottom view, and inside details).
Applsci 12 02919 g007
Figure 8. Ferry evacuation plan.
Applsci 12 02919 g008
Figure 9. Leakage diameter 3 mm at the inlet of the bottom right stack: (a) detection at 5.6 s; (b) concentrations at 10 s; (c) concentrations at 40 s.
Applsci 12 02919 g009
Figure 10. Leakage diameter 16 mm at the inlet of the bottom right stack: (a) detection at 1.9 s; (b) concentrations at 3.8 s; (c) concentrations at 30 s; (d) concentrations at 40 s.
Applsci 12 02919 g010
Figure 11. Leakage diameter 16 mm at the inlet of the bottom right stack (60 ACH).
Applsci 12 02919 g011
Figure 12. Full pipe rupture at the inlet of the bottom right stack with 30ACH: (a) detection at 1.3 s; (b) concentrations at 2.8 s; (c) concentrations at 6 s; (d) concentrations at 28.1 s; (e) concentrations at 40 s.
Applsci 12 02919 g012
Figure 13. Full pipe rupture at the inlet of the bottom right stack with 120 ACH: (a) concentrations at 18 s; (b) concentrations at 40 s.
Applsci 12 02919 g013
Figure 14. Full pipe rupture with 120ACH and 2 s delay.
Applsci 12 02919 g014
Figure 15. Simulation of scenario 1.
Applsci 12 02919 g015
Figure 16. Simulation of scenario 2.
Applsci 12 02919 g016
Figure 17. Simulation of scenario 3.
Applsci 12 02919 g017
Figure 18. Simulation of scenario 4.
Applsci 12 02919 g018
Figure 19. Simulation of scenario 5.
Applsci 12 02919 g019
Figure 20. Simulation of scenario 6.
Applsci 12 02919 g020
Figure 21. Heat release rate over time.
Applsci 12 02919 g021
Table 1. Liquefied hydrogen properties.
ParameterValue
Storage temperature (°C)−253
Storage pressure (bar)1
Gas constant (J/kgK)4124
Volumetric energy density (GJ/m3)8.5
Autoignition temperature (°C)585
Minimum ignition energy (mJ)0.019
Energy density LHV (MJ/kg)119.96
Flammability range in air (%)4–75
Explosive range in air (%)18–59
Table 2. Case ship specifications.
Main Particulars and Ferry Details
Length overall (m)30.6route length23 nm
Length waterline (m)29.32service hours/dayUp to 20
Draft (m)1.26round trips/dayUp to 15
Breadth (m)9electric motors2 × 550 kW
Demihull breadth waterline (m)2.44service speed23 knots
Demihull spacing (m)6.56crew3
Displacement (c.m.)80passengers147
Table 3. Technical data of MS-100 stacks.
ParameterValue
Rated power (kW) of each stack100
System efficiency @ rated power50%
Dimensions of each stack: H × D × W (m)0.75 × 0.75 × 0.25
Weight of each stack (kg)150
Fuel inlet pressure (bar)8
Fuel inlet temperature (°C)10
Response time (s): off-stanby10
Response time (s): standby-run10
Minimum operational lifetime (h)20,000
Table 4. The most severe hazards of the hydrogen-fuelled version from HAZID.
No.Initial Accidental Event
1Leakage at FC room
2Fire/explosion at FC room
3Fire/explosion in the control room
4Fire/explosion at the upper deck
5Collision during operation
6Fuel spill during bunkering
7Fire propagation indoors (emergency)
Table 5. The most severe hazards of the battery-powered vessel from HAZID.
No.Initial Accidental Event
1Battery breach/punctures during construction and installation
2Fire and explosion in battery room during construction and installation
3Battery breach while in operation
4Internal cell failure/thermal runaway while in operation
5Battery on fire while in operation
6Fire and explosion while in operation
7Fire propagation during an emergency
8Evacuation failed during an emergency
Table 6. Technical data of battery package (one set).
ParameterValue
Energy (kwh)650
Dimensions: H × W × D (m)2.38 × 7.86 × 0.5
Weight (ton)5.2
Volume (m3)9.35
C-rate—Continuous (discharge)2.2
C-rate—Continuous (charge)1.6
Single module size (kwh)7.8
Nominal voltage (V)805
Publisher’s Note: MDPI stays neutral with regard to jurisdictional claims in published maps and institutional affiliations.

