Article

Security Risk Analysis in IoT Systems through Factor Identification over IoT Devices

by
Roberto Omar Andrade
1,
Sang Guun Yoo
1,2,
Iván Ortiz-Garces
3,* and
Jhonattan Barriga
1,2
1
Escuela Politécnica Nacional, Facultad de Ingeniería de Sistemas, Quito 170525, Ecuador
2
Smart Lab, Escuela Politécnica Nacional, Quito 170525, Ecuador
3
Escuela de Ingeniería en Tecnologías de la Información, FICA (Facultad de Ingenierías y Ciencias Aplicadas), Universidad de Las Américas, Quito 170125, Ecuador
*
Author to whom correspondence should be addressed.
Appl. Sci. 2022, 12(6), 2976; https://doi.org/10.3390/app12062976
Submission received: 12 January 2022 / Revised: 21 February 2022 / Accepted: 23 February 2022 / Published: 15 March 2022
(This article belongs to the Special Issue IoT Security)

Abstract

:
IoT systems contribute to digital transformation through the development of smart concepts. However, the IoT has also generated new security challenges that require security tools to be adapted, such as risk analysis methodologies. With this in mind, the purpose of our study is based on the following question: Which factors of IoT devices should be considered within risk assessment methodologies? We have addressed our study with a 4-phase design-research methodology (DRM) that allows us, based on systematic literature review, to experiment and draw upon expert judgment; as a final product, we obtain a risk assessment methodology based on the characteristics of IoT devices. At the end of this study, we establish seven main constructs—Organization, Risk Behaviors, Dependency, Attack Surface, Susceptibility, Severity and Uncertainty—over which security risk in IoT systems can be evaluated.

1. Introduction

Digital transformation is used in organizations to improve their strategic and operational processes by incorporating “Smart” concepts [1]. Currently, this “Smart” concept can be implemented in agriculture, transportation, energy, homes and cities [2]. Implementing the smart concept from a technological perspective is based on the use of emerging technologies such as artificial intelligence (AI), big data, machine learning (ML), Internet of Things (IoT) and the cloud [3]. However, including these technologies has introduced additional aspects related to cybersecurity. The IoT has certain particularities in relation to security in contrast with AI, big data, ML and cloud; this is because of factors such as location in less protected environments such as streets, traffic lights and agricultural fields, among others [4]. IoT devices have inherent characteristics, such as heterogeneity of technologies and protocols, reduced computational capacity and limited security mechanisms [5]. This aspect of IoT systems has motivated the development of several works of research related to IoT security. Some contributions have focused on establishing security strategies, such as the zero trust model for IoT [6] and security verification on IoT systems [7]. These strategies have two aspects in common. The first one is related to the fact that they focus on establishing phases or procedures based on the security level of the IoT device. For instance, “Zero-trust” establishes a minimum-security level that an IoT device must meet to join the network, while “Security Verification” requires evaluating, as a first step, the compliance of IoT devices based on risk profiles. The second aspect is related to the requirements of these two strategies for their first step in developing “Risk analysis”, which is often based on the identification and evaluation of critical assets (IoT devices) [8]. In relation to this second aspect, applying a security risk analysis method in an IoT context has been discussed by some researchers in recent years, because of the argument that IoT systems have characteristics and behaviors of IT (Information Technology) systems. For instance, Kandasamy et al. [9] mentions that the complexity and heterogeneity of the technology and data of IoT systems create additional issues related to security risk that cannot easily fit in the existing risk frameworks. In the same vein, Nurse et al. [10] mentions that risk analysis methodologies must adapt to dynamic IoT scenarios, as well as consider the possibility of limited historical data related with attacks on IoT devices and the interconnection of IoT with other non-IoT systems.
In this context, some proposed security risk methodologies focused on IoT have been developed. These proposals include features of IoT systems, such as heterogeneity, a layered model, and several IoT devices. However, each proposed method uses different factors or characteristics of IoT systems in comparison with the others, and sometimes, there is not a rational justification about the selection of the specific factors used. The analysis, in conjunction with the factors used by the different methodologies, could contribute to a deeper calculation of IoT security risk. Thus, there is a gap in relation to having a formal IoT security risk analysis method, and in relation to the factors that could contribute to more accurate and effective construction of a security risk analysis method for the IoT. This context allows us to define our primary research question: How can we develop an effective security risk assessment in IoT systems?
Based on this primary research question, we propose the following objectives for this study:
  • Identify the most relevant factors that allow the definition of the security risk level of an Internet of Things system.
  • Evaluate the relationships between the factors of the Internet of Things.
  • Establish a method to calculate an approximate value of the security risk level of an IoT system.
Risk analysis methodologies have been considered as a starting point, since zero trust is based on defining a risk level for IoT devices, while security verification is based on defining a risk profile for IoT devices. Therefore, we define the start point on this study as the analysis of the common element of these two strategies, the “IoT device” and its relationship with security risk. For this reason, an epistemic approach to understanding the factor of the IoT device and its relationship with security risk is addressed, to accomplish objectives 1 and 2 of this study. For the analysis of the relationship between IoT devices and security risk, we define the following questions related to IoT devices:
  • Which factors of IoT devices should be considered to define an adequate security level for low cyber risk?
  • For which factors of IoT devices should risk assessment methodologies be considered?
  • Which factors of IoT devices could define a risk’s profile?
This identification allows us to address the development of risk analysis methodologies for IoT systems, leaving, for future work, the question of how these factors could be used in zero-trust strategies and security verification methodologies. Under this scope, the purpose of this work seeks to contribute to the following objectives:
  • Identify the most relevant factors that allow the definition of the security risk level of an IoT device.
  • Evaluate the relationships between the factors of IoT devices and security risk.
  • Establish a method to calculate an approximate value of the security risk level of an IoT system.
The rest of this paper is structured as follows. Section 2 presents an overview of works related to methodologies of risk analysis in IoT ecosystems. Section 3 presents the design research methodology to identify the factors of IoT devices that contribute to risk security. Section 4 presents an analysis of the results obtained from the design research, to determine the contribution of the factors of IoT devices to security risk. Finally, Section 5 concludes this study.

2. Background and Related Works

Risk analysis methodologies have been widely used in computer science to assess security risk in computer systems. Some of the most widely used risk methodologies are presented in Table 1 with their strengths and weaknesses.
However, some researchers have mentioned that these traditional methodologies have some limitations for IoT systems. For instance, Nurse mentions that current risk assessment methods fail in the following aspects [10]:
  • Short assessment periods: Risk methodologies are not usually designed to be performed in short periods of time; however, the IoT ecosystem is continuously changing because of the addition of new devices.
  • Limited knowledge of IoT systems: Most risk assessments are focused on traditional systems and do not include the IoT ecosystem.
  • Connections to other systems: IoT devices connect to other systems or technologies such as cloud computing, big data and traditional systems. This situation expands the attack surface of IoT ecosystems.
  • Not considering the asset as an attack platform: IoT devices can perform new attacks.
In this context, some research has been proposed for the development of risk analysis methodologies focused on IoT. Kandasamy proposes that the following parameters should be considered for assessing the security risk in IoT system network type (nwt), protocol type (prt), the heterogeneous system involved (het), device security (des) and CIA impact type (cia) [8]. From these criteria, the risk impact of a device would be given by Equation (1):
w ( d ) = 1 5 [ nwt ( d ) +   prt   ( d ) +   het   ( d ) +   des ( d ) + cia ( d ) ]
where
  • wd—level of risk impact;
  • nwt—network type;
  • prt—protocol type;
  • het—heterogeneous systems involved;
  • des—level of device security;
  • cia—level of impact on cia components.
The probability of risk would be given by the weight of past attacks (pat), the weight of the IoT layer with more attacks (lyr), the weight of the sector where the IoT solution is applied (scr) and the risk factor of the device according to its use (drf). Based on these criteria, the risk probability of a device would be given by Equation (2):
S ( d ) = 1 4   [ pat ( d ) +   lyr ( d ) +   scr   ( d ) +   drf ( d ) ]  
where
  • pat—weight of past attacks;
  • lyr—weight IoT layer;
  • scr—weight of sector of IoT;
  • drf—risk factor.
Finally, the proposal presented by Kandasamy evaluates risk (Rs) as a function of impact by probability, denoted as the product of w(d) by S(d). The exploitation of this proposal is interesting because it includes characteristic aspects of IoT solutions, such as the application sector and the layered architecture of IoT. The proposal covers the components without discussing more details about the threats, attacks or vulnerabilities of IoT systems, allowing for the establishment of the weights for risk calculation. In addition, a method could be included to reduce subjectivity when considering the weights of each component.
In the same vein, Toapanta defines the cybersecurity performance algorithm, where Ef is the Efficiency; Dev is the number of devices connected to the network; Sor is the number of sensors; Svs is the number of services and processes; Int is the number of interfaces; Met is the number of reports, indicators or metrics; Dat is the number of data structures; Scf is the number of smart contract functions; and Prot is the number of protocols or standards adopted [15].
Ef = 100 ( Dev × Sor Dat × Scf . ( Svs + Int + Met ) ( 5 π + P r o t )
where
  • Dev—number of devices connected to the network;
  • Sor—number of sensors;
  • Svs—number of services and processes;
  • Int—number of interfaces;
  • Met—number of reports;
  • Dat—number of data structures;
  • Scf—number of smart contract functions;
  • Prot—number of protocols or standards adopted.
Toapanta’s proposal considers the characteristics of IoT systems from the perspective of the large number of devices, sensors, and processes. The proposal addresses the security aspects of the IoT in a general approach, without going into detail on how aspects of the IoT are affected by distinct threats. The proposal considers all IoT devices equally, which could limit the selection of security controls to reduce risk, because it does not detail the type of information on the IoT device or the criticality of the IoT device for health- or energy-related applications.
In the same line, Aydos proposes that the risk assessment be based on a four-stage approach: (a) Measurement of threats to the layers; (b) processes/procedures for securing data in the layers; (c) third parties and human factors affecting layer security; and (d) criticality of the layers and the scale of the attack surface [16]. The model proposes a qualitative risk assessment based on three criticality scales: low, medium, and high. Aydos, again, mentions the importance of considering in the risk assessment the heterogeneous systems involved in the IoT system and attacks on different layers of IoT systems. The proposal does not address how to establish component values to have a more accurate or focused risk value.
From Popescu’s perspective, he proposes a risk management strategy reference model (IoTSRM2) based on six domains: Asset Management, Business Environment, Governance, Risk Assessment, Risk Management Strategy, and Supply Chain Risk Management. Within the domains are included aspects such as hardware inventory, software inventory, critical dependencies and functions, resilience of critical services, security-related policies, structures and responsibilities, regulatory requirements, governance and risk management plans, vulnerability discovery, threat identification, risk analysis and risk responses [17]. The framework establishes a set of security criteria that could improve the security level of IoT systems based on the analysis of 25 international security frameworks. A potential drawback of the proposal is that it does not present a detailed operational process for developing each of the security criteria proposed in the framework.
Finally, Levitsky proposes a risk assessment on IoT devices using scores between 0 and 1 for subcomponents of five different attack categories on an IoT device (Physical, Network, Mobile, Web, Unknown Risk) [18]. Levitsky defines the risk “ri” for each category based on normalizing the sum of each of the subcomponents ci and dividing by the value of S, which is the total score of all subcomponents of an attack category.
ri   = 1 S i = 1 n C i  
where
  • ri—level of risk;
  • S—total weight of score of all components;
  • Ci—subcomponents of IoT system.
Levisky’s proposal focuses on attacks on the three layers of the IoT model, although Levisky separates mobile and web, which are part of the application layer; this separation could allow more detail on risk analysis because they are components that have a different dynamic with the user; however, for establishing a risk weight for the layer, this value could be doubled. A limitation of the proposal is the consideration of a few IoT attacks. In addition, the weighting of the subcomponents depends directly on the experience and subjectivity of the evaluator. A relevant aspect to consider is the weight of unknown factors for the total risk value.
Based on the analysis of the proposals about risk methodologies for IoT systems, they focus on taking into consideration IoT aspects such as: the heterogeneity of devices and networks; vulnerabilities and attacks to the physical, communication and application layers of the IoT architecture; the application domain of the IoT system; and the number of IoT devices. However, is not clearly detailed in the proposals why these factors have been selected or how the weight of these factors was selected for the total risk value. Risk assessment methodologies such as MAGERIT, TARA and OCTAVE [19], among others, have the advantage of much documentation of their use; these documents present details of formulas, tools and methodologies to define the values of the components used in the risk assessment process. However, as we mention the criteria of some of the research cited in this section, traditional methodologies do not cover all aspects of IoT systems that are related to risk; therefore, there is a gap to be addressed by these risk analysis methodologies or by means of the new proposals focusing on IoT, to obtain a more practical and repeatable security risk analysis process in IoT systems.

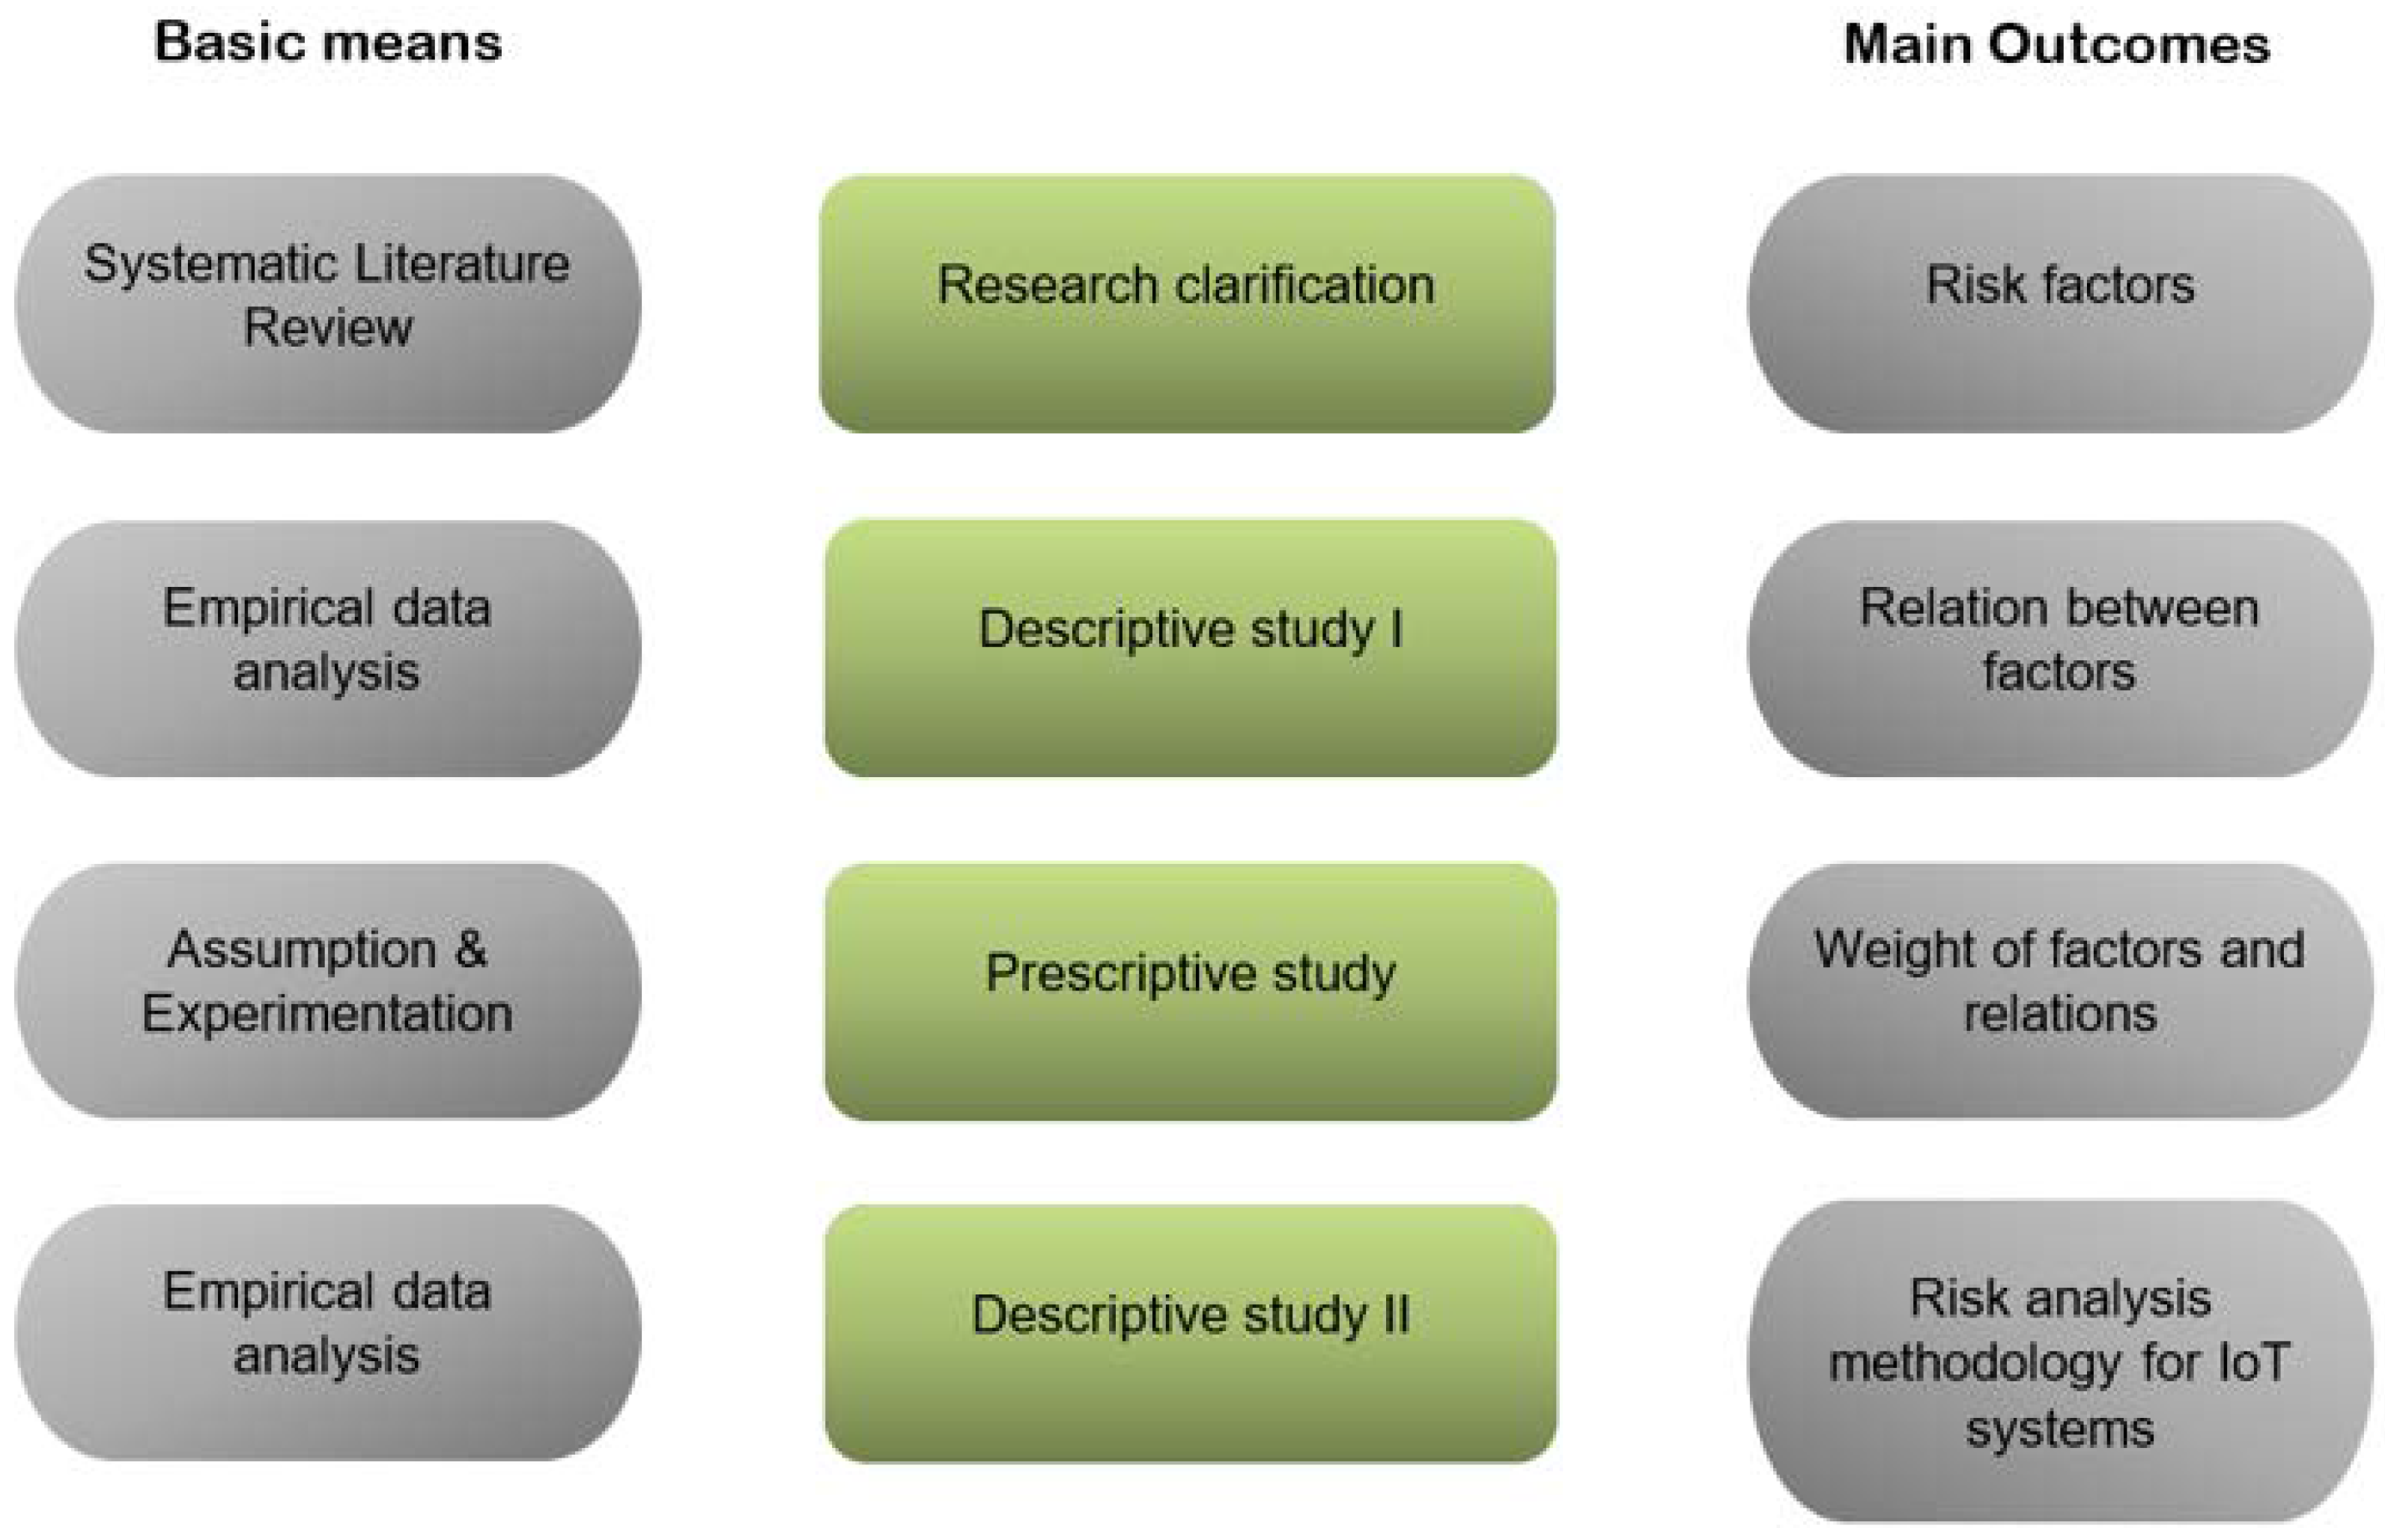
3. Materials and Methods

The Research Methodology (DRM) used in this study is based on the proposal by Blessing [20], which covers four stages: (i) Research Clarification, which uses as a basic Systematic Literature Review to create an overview of the main IoT device factors, which is the objective of this study; (ii) Descriptive Study I, based on an empirical analysis to define and understand the relationships between IoT device factors associated with security risk; (iii) Prescriptive study, based on experiments, tests and a focus group, to support the weight of the factors and the relationships between them; and (iv) Descriptive study II, based on empirical analysis to evaluate the methodology for calculating risk based on IoT device factors. A representation of the DRM methodology is presented in Figure 1.

3.1. Research Clarification

This first phase of the DRM supports the identification of the most relevant factors of IoT devices that could be considered in the security risk assessment process. For this purpose, we conducted a systematic literature review (SLR) based on articles that focus on analyzing the security of IoT devices. The SLR was established using the PRISMA methodology, which is based on four stages: identification, screening, eligibility analysis, and inclusion. Study selection, establishing inclusion and exclusion criteria, manual search, and elimination of duplicates are some of the steps included in the identification stage. The screening stage comprised reviewing titles and abstracts. The eligibility analysis stage was performed by reading the full texts of the selected articles. Finally, the inclusion stage comprised data extraction.

Systematic Literature Review

Phase 1. Selection of studies
The selection of studies was based on a systematic review following the PRISMA guidelines [21]. The following databases were used: Springer, Scopus, IEEE, Association for Computing Machinery (ACM), Web of Science, and Science Direct. These databases were chosen because they are the most relevant sources of information for Computer Science. The range of publications spans from 2016 to 2021.
Inclusion and exclusion criteria
The inclusion criteria were: (i) manuscripts published by peer-reviewed academic sources; and (ii) manuscripts that analyzed factors enabling security attacks on IoT systems. The exclusion criteria included: (i) manuscripts that, despite including technical aspects, did not detail the factors enabling the security attack; and (ii) manuscripts that addressed proposed risk analysis methodologies to avoid subjectivities. The following research strings used were:
“(IoT OR Internet of thing)” AND “(Security attacks OR cybersecurity attacks)”
“(IoT OR Internet of thing)” AND “(Security risk OR cybersecurity risk)”
“(IoT OR Internet of things)” AND “(Threats OR vulnerabilities)”
From the search string, we found 1607 articles. Table 2 shows the searched articles distributed in: conferences, journals, series, chapters and books.
Duplicate manuscripts were eliminated through a manual review of the collected articles. During this process, 23 duplicates were eliminated.
Phase 2. Screening
The screening process was based on a review of article titles and abstracts using the Rayyan web application (Rayyan), created for the systematic review process by MIT. The web application allows each reviewer to view the titles and abstracts of the articles collected while maintaining a blinded review process. Articles that did not meet the inclusion criteria in the title or abstract were excluded at this stage of the study. A screenshot of the process carried out in the Rayyan tool is shown in Figure 2.
Phase 3. Eligibility analysis
A full text review of each of the 370 articles was conducted to determine those with more detail related to the factors during IoT security attacks. After this process, 55 articles were selected for the data mining process. A flowchart of the PRISMA process is presented in Figure 3.
Phase 4. Inclusion
Data extraction
For this stage, we developed a qualitative analysis of the 55 documents from the eligibility analysis phase using ATLAS TI version 9. During the qualitative analysis, 11 codes were defined in the Atlas TI associated with factor: application domain, related to the verticals in which IoT systems have been implemented [22,23,24]; attack surface, related to the entry and exit points via which attacks can be performed [25]; interdependency, related to the relationship of the IoT system with other IT/OT/IoT systems that could increase the severity of the attack [26]; scalability, related to the coverage area that can be affected by the propagation of the attack [27]; severity, related to the value of the damage that can be caused by the attack [28]; susceptibility, related to the predisposition to pick up the effects of an attack [29]; type of attack, related to the attack vector, technique or methodology [30,31]; device type, related to the type of IoT device [32,33]; type of information, related to the type of information processed, stored, or transmitted by the device [34]; uncertainty, related to the unknown factors that could affect the security of IoT systems [35]; vulnerabilities, related to the weak points that IoT systems may have and that may increase the possibility of being affected by an attack [36,37,38,39,40,41]. The density values of the codes (factors) are shown in Figure 4.
From the quality analysis, we identified 11 factors of IoT devices that could affect that security risk value. For the security analysis processes we defined three groups: A first group of factors with values above 5, a second group of factors with values between 3 and 5, and finally, a third group of factors with values below 3. The first group of factors with the highest relevance included the types of vulnerabilities (density = 17), followed by the type of attack (density = 10), then the attack surface (density = 8), and finally, the interdependence (density = 7). The second group included the factors: severity (density = 5), followed by scalability (density = 4), then application domain (density = 4), and finally, device type (density = 3). The third group with the lowest relevance values corresponded to the factors: type of information (density = 1), followed by uncertainty or unknown factors (density = 0).
We order these factors by their density values in Table 3, to obtain a first view of the relationships of the IoT devices’ factors with security risk. For instance, security risk would be associated with the existence of vulnerabilities in IoT devices, followed by the attacks; depending on whether it is a ransomware, a denial of service (DoS) or a man-in-the-middle (MITM), the probability of risk could be higher. The third relevant factor that could affect risk is the large attack surface, because of an increase in the number of IoT devices, or the number of entry and exit points for connectivity with other IoT, IT and OT systems. We can observe that there are other factors, such as the application domain, wherein IoT devices operate that could increase the probability of security risk due to being in open areas; this is the case for smart traffic and smart agriculture. Other factors are the scalability that an attack may have because of the interdependence between devices and systems, or the type of information in the IoT device. Although these factors have a low-density value, this may be because the studies selected for the SLR do not analyze these factors, and not because their contribution to security risk is low. At this point of our study, we cannot confirm for certain that the contribution of these factors to security risk is low, medium or high; for this reason, we define these factors as hypothesis to test in the next part of our research methodology.
Based on this first phase of the DRM “research clarification”, an initial reference model for risk analysis in IoT systems is proposed in Figure 5. The model is considered as the key component of the application domain, e.g., in healthcare, education, transportation and energy, which all use IoT devices for their digital transformation processes. Multiple IoT devices can be used in the domain to increase the interdependency between IoT devices and IT and OT systems, to increase the functionalities of the IoT system; however, this also increases the attack surface and the scalability of attacks to other systems.
Attacks can use the vulnerabilities and susceptibilities of IoT devices to increase their effectiveness. Attacks can also use the large attack surface and scalability to create greater impact (severity) in their attack. The IoT device can be of different types and has different information depending on its functionality in the domain application. Although the uncertainty factor considered by Levistky was not found in the qualitative analysis, we consider that it may be relevant in this initial risk assessment model.
To continue our study, we are interested in analyzing whether the 11 factors of IoT devices, which are represented in the initial reference model of Figure 6, are covered by the proposals of the risk analysis methodologies for the IoT from Section 2 of this study, as shown in Table 4. We can observe that most of the factors of IoT devices are covered for the IoT risk methodologies. However, the following factors are not completely covered for these methodologies: application domain, scalability, type of information, susceptibility, severity and uncertainty. This opens the opportunity for the contribution of this study to the understanding of these factors for use in the security risk methodologies of IoT systems.

3.2. Descriptive Study I

This second phase identifies the relationships between the 11 factors, proposed by the research clarification, with the risk value. To accomplish this goal, we used the concurrence-table option of ATLAS TI and found a relationship between the “Severity” code and the “Type of attack” code. We can also observed a relationship between the code “Type of attack” and the code “Severity”, and with the code “Vulnerabilities”. In addition, it is possible to observe a relationship between the code “Vulnerabilities” and the code “Type of attack” (see Figure 6).
We can observe that the attack surface is associated with elements such as the size of the network (number of nodes or devices), the interfaces and links, and the security elements of the IoT system components (see, Figure 7).
Based on the SLR, we could not find more references to the relationships between factors. The DRM methodology proposes, in the descriptive study phase I, the use of empirical studies such as experimentation to fill this gap in the literature review. To address experimentation, we define a set of research items with their respective coding in Table 5. The research items were based on the 11 factors of IoT devices from the previous phase and defined as hypotheses to test. The coding of research item was proposed according to the relationships between the factors of IoT devices. For instance, the code “S-A” represents the relationship between severity and application domain. The code “S-A-P” is the relationship between severity, application domain, and pillars. We grouped the research items into three proposed theoretical constructors related to risk—severity, susceptibility and risk behaviors—to address the contribution of the factors of the IoT device and their relationships with other factors of IoT devices with the security risk value.
The experiments developed have the goal of generating an understanding of the behavior of IoT devices against security events, to analyze their contribution to the three proposed theoretical constructs of risk value: severity, susceptibility, and risk behaviors. For this reason, we propose two experiments to simulate security attacks on a small IoT system such as a smart home, and on a big IoT system such as a smart city, to analyze the behavior of IoT devices, the susceptibility to attacks, and the severity of the attacks. Then we propose a third experiment to evaluate the behavior, susceptibility, and severity of IoT device in response to diverse types of attacks. Next, we propose the evaluation of the effect of security attacks in a real scenario, to develop a prototype with low-cost hardware, such as Raspberry and Arduino. Finally, we propose the evaluation of the effect of security attacks in commercial hardware for IoT solutions such as Alexa, Google Home and WeMo. The experiments were built based on the IoT-23 dataset developed by [42]. It has 20 malware captures executed in three different IoT devices: a Philips HUE smart LED lamp, an Amazon Echo Home intelligent personal assistant, and a Somfy smart doorlock. The IoT-23 dataset was obtained from PCAP files and transformed into a connection log.by using Zeek, to obtain a high-level format with the following attributes: orig_p”, “id.resp_p”, “orig_bytes”, “resp_bytes”, “missed_bytes”, “orig_pkts”, “orig_ip_bytes”, “resp_pkts”, “resp_ip_bytes “ and “duration” [43].
The goal of these five experiments is to understand the behavior of IoT devices in different scenarios. An overview of the 5 proposed experiments is presented below.
Experiment Setup 1.
We simulated an IoT system focused on the most common elements of a smart home according to a literature review, using Phyton libraries in Google Collaborate, as shown in Figure 8. The lights were interconnected to the IT network through a hub, which allowed the connection with IT devices such as computers and smartphones, or by voice assistants using the router (gateway). The smart home solution had two voice assistants based on cloud services to control the lights. Then we defined the random probabilities of attack in each node to evaluate the impact of attacks on the smart home. We can observe in the IoT graph of Figure 8 that there are two paths for attacking smart lights. The attack could come from the IT network using the router, or from the voice assistant (Alexa). In the first path, the owner could have more control over security configurations; however, that is not the case with Alexa, because the security configurations depend on third parties. An extract of probabilities used in the simulation is shown in Figure 9.
Experiment Setup 2.
We simulated a smart city based on the most common IoT nodes, according to the literature review. The graph representing a smart home (SH), smart grid (SG), smart agriculture (SA) and smart traffic (ST) is shown in the Figure 10. We defined random probabilities in each node to evaluate the impact of attacks. The scenario was simulated using a Bayesian network in the software Bayesian Server. We can observe, in the IoT graph of Figure 10, the relationships between smart agriculture and smart grids through the IoT or cloud nodes. In addition, there is a relationship between the attacks on smart grids or smart homes and the impact on economic, social and environmental nodes.
Experiment Setup 3.
This experiment aimed to understand relationships among smart home attacks. It is based on the work proposed by Dr. Mariam Wajdi Ibrahim, who simulated smart home attacks based on JKind and Graphviz [44]. The work shows that if an attacker could execute a specific attack, such as phishing, then the attacker could execute DoS attacks. We replicated this scenario and added probabilities. Thus, we observed that one type of attack can also be related to further attacks. Figure 11 shows a graph of the relationships among attacks on a smart home, and Figure 12 shows an extract of probabilities in Google Collaborate.
Experiment Setup 4.
The goal of this experiment was to understand attacks in non-simulated scenarios and based on low-cost hardware for IoT. We propose a prototype to check possible vulnerabilities in embedded systems based on Arduino Mega 2560 and Raspberry Pi 3B+. Figure 13 shows the diagram and the elements used in the architecture. In the sensing layer, the following sensors were used: temperature, humidity, gas and ultrasound. In the communication layer, a Raspberry pi 3B+, an Arduino Mega 2560 and a modem were used. We used applications to see the data from the sensors. Then we developed attacks using Kali Linux. We could detect open ports such as Telnet and http, and they could trigger the execution of DoS attacks in IoT devices.
Experiment Setup 5.
The goal of this experiment was to understand attacks in non-simulated scenarios and based on medium-cost hardware for IoT, as shown in the Figure 14. A smart home prototype was developed by configuring the following devices: three Alexa devices, a Google Home device, a WEMO switch, a fire tv and three Phillips lights. The voice assistants allowed us to interact with the on and off lights and the Smart tv, as they were connected to the home’s wireless Wi-Fi network. The lights used ZigBee technology for communication with a hub that was connected to the home wireless router via a network cable. The WEMO switch allowed the switching (on and off) of electronic devices connected to it from the voice assistants or from the mobile device. The switch was connected to the home network using Wi-Fi. Finally, the fire tv device was connected to the home network using Wi-Fi. All devices were configured to be accessed by the virtual assistants from their management platform, allowing them to send commands to control the status. Then, we used Kali Linux to make attacks on the IoT devices; in this case, we could take the control of lights. We could not execute an MiTM (man-in-the-middle) attack, because the communication of voice help was encrypted.
By verifying the research items through experiments, we can observe that the factors defined as hypotheses contribute to the risk value. We can also establish certain relationships between factors. Aspects such as propagation time between attacks or attack frequency were able to be validated with the experiments. The verification of the relationships between the factors of IoT devices was based on the analysis of the research items using experiments, as shown in Table 6.
Based on the results of experimentation, we propose, in Figure 15, a new model that includes economic, social and environmental aspects, and the relationships between the application domains and pillars, and IT/OT systems. Finally, the relationship between surface attack and interdependence, and IoT device vulnerability and the number of existing IoT devices is shown in the graph.

4. Results

4.1. Prescriptive Study

Based on literature review and experiments from the previous phases of the DRM, we can understand the factors associated with IoT devices, which we represented in Figure 16, and make the following assumptions about their contribution to security risk:
Assumption 1: The risk value will depend on the probability that threats can capitalize on IoT systems, but also on related systems, such as IT and OT. The probability of threat impact will be a function of the contribution of the probability of its occurrence in each of the above systems.
Assumption 2: The risk, severity and probability values will depend on the level of dependency and interdependency between IT, OT, and IoT systems.
Assumption 3: Risk and severity values will depend on the relationship of IT, IoT and OT systems with the social, economic and environmental pillars supported by IoT solutions.
Assumption 4: The value of the risk will depend on the type of information in the IoT device, its physical location and the application supporting the IoT solution.
Assumption 5: The value of the risk will depend on the security controls in place.
Assumption 6: The value of the risk will depend on the types of attacks on the social, economic and environmental pillars supported by the IoT solution.
Assumption 7: The value of the risk will depend on the number of attacks on IoT systems and the relationship these attacks may have, to improve their effectiveness.
Assumption 8: The value of the risk will depend on the value of the surface attack and the vulnerability score of the IoT system.
However, we cannot quantitatively evaluate these assumptions, because we do not know the weight of the contribution of each of the factors proposed for the security risk. In this third phase of the DRM, the aim is to support this understanding and reduce the bias of the authors of this study in the assumptions about the contribution of these factors of IoT devices to security risk. For this reason, we validated our assumptions through the judgment of experts. Therefore, we conducted a survey to obtain the opinions of experts in security and, then, based on an exploratory analysis, observed the association of their opinions with the factors of IoT devices and their relationships with security risk. For the exploratory analysis, we propose Principal Component Analysis (PCA) in an exploratory approach, because the factors of IoT devices and survey are new proposals from this study and are not previously used. For future work, it is possible to take into consideration the development of a new survey and use PCA in a confirmatory approach; for that, it is necessary to increase the number of experts in the survey [43,44]. The survey was based on a 10-point Likert scale using Google Forms. The research items from Table 4 and the second reference model were used to build the 27 questions in the survey. According to [45], an acceptable exploratory analysis can be performed with a value of 10 variables per case. Therefore, our goal for the survey was the acquisition of the opinion of at least 10 experts in cybersecurity to validate the factors of IoT devices and their relations, which were identified in the previous phases 1 and 2 of DRM. An extract of survey questions is shown in Figure 16. We obtained thirteen responses from security experts: three from the academia sector, three from the enterprise sector, one from the government sector, one from the international security industry, one from the national security industry, one from international organizations related with security standards, one from national organizations focused on security standards, and two from a community organization focused on security. Regarding this, we expected to obtain more security experts for the survey; however, some of them mentioned that they did not have knowledge of IoT security, which would limit their participation in the survey. This is not a complete limitation for the study because our expectations were to obtain a minimum of 10 security experts to build a matrix of 10X 270 for the use of PCA (Principal Component Analysis) and MCDA (Multicriteria Decision Analysis) to continue our analysis; both types of analysis were used for the evaluation of factors for risk assessment in different fields, such as aeronautic or cloud computing [46]. From the data obtained, we developed Principal Component Analysis (PCA) using the statistical software SPSS (see Figure 17). The PCA was used for exploratory analysis. For this reason, the number of factors for extraction was 27, which is equal to the number of questions in the survey.
Analyzing the graph of sedimentation in Figure 18, which was created for SPSS from our data, the number of relevant factors is equal to seven. This means that there are seven theoretical constructs which accumulated the total variance of our questions, in our case research items and assumptions.
Table 7 was obtained from SPSS, and it shows the variance for the seven main components. From component numbers 8 to 27, the contribution of variance is poor; thus, they are not considered for the rest of the analysis. The first construct explains 54% of the variance, the second contributes to 12.39% of the variance, the third contributes to 11.92% of the variance, the fourth contributes to 7.18%, and so on, as show in Figure 19.
The results did not change the proposals’ risk factors related to IoT devices. All factors that were represented in the questions of the survey have relationships with one of the seven components.
Based on the analysis of the seven theoretical constructs through the matrix of components of SPSS with the factors, we obtained the following results:
Component 1 (54.90% of weight): Application
  • Effect on economic, social, environmental domains.
  • Number of IoT devices.
  • Effect of shock on the market.
  • Security configurations of IoT devices.
  • Vulnerabilities of IoT devices.
Component 2 (12.39% of weight): Scalability
  • Effect of the relation between IT/OT/IoT systems.
  • Number of IoT devices increase the probability of attack.
  • Previous attacks allow new attacks.
  • Short times to propagate attacks.
  • Attacks from one layer to other layers of IoT system.
Component 3 (11.92% of weight): Attack Surface
  • IoT devices number increase attack surface.
  • Attacks could be on different IoT layers.
  • Attacks could be on different domains.
Component 4 (7.18% of weight): Severity
  • Effect on CIA.
  • Impact depends on type of attack.
  • Vulnerabilities in IoT devices.
Component 5 (6.19% of weight): Susceptibility
  • IoT devices could be susceptible to attacks.
  • Attacks could be on different IoT layers.
  • Frequency of attacks.
  • Attacks could be on different domains.
  • Short time between attacks.
  • Interdependency with other IT/OT/IoT systems increases the severity of attacks.
Component 6 (4.52% of weight): Interdependency
  • Attacks could be on different domains.
  • Interdependency with other IT/OT/IoT systems increases the severity of attacks.
  • Attacks could be on different IoT layers.
  • Security configurations of IoT devices.
  • Frequency of attacks.
  • Attack surface.
Component 7 (2.9% of weight): Uncertainty
  • Security configurations of IoT devices.
  • Number of IoT devices.
  • Interdependency with other IT/OT/IoT systems increases the severity of attacks.
In relation to the eleven factors proposed in this study, for four of the factors (vulnerability, type of attack, type of information and type of device) it was not possible to establish indicators from the PCA. However, these factors are considered as inputs to other factors. For example, vulnerability is included in the factors: application, attack surface and severity.

4.2. Descriptive Study II

The aim of the four phases of the DRM was to establish the risk methodology based on the factors of IoT devices. For this phase, we proposed the use of MCDA using the results of the matrix of components and correlation from SPSS. The relationships between factors, and the weights of the factors and their relationships, allow us to build the MCDA to define the value of risk. The MCDA for this study was based on the following seven steps [47]:
  • Define the aim—in our case, the risk value.
  • Define the criteria—in our case, the seven constructs.
  • Weighting the criteria—the weight of constructs
  • Define the sub-criteria—in our case, factors of IoT devices associated with the constructs
  • Weighting the sub-criteria—the weight of factors of IoT devices.
  • List of options—in our case, the features of the factors associated with each of the sub-criteria.
  • Weighting of options—the weight of features of the factors of IoT devices.
Each of the criteria had a set of sub-criteria. For the first criteria (domain, pillars and systems) the following sub-criteria were domains: pillars, systems, security configurations and vulnerabilities. Security configurations were related to the controls, policies and solutions that IoT systems should have according to the domain or pillar where the IoT systems were working. Vulnerabilities were related with the weakness in controls, polices and solutions that generated a gap, to accomplish the level of security configurations.
The criterion Risk Behavior had the following sub-criteria: impact or degradation, probability of occurrence, propagation time, propagation coverage and previous attacks on IoT systems. The criterion Attack Surface had the following sub-criteria: number of IoT devices, number of IoT layers, and threats in IoT systems.
The criterion Interdependency had the following sub-criteria: upstream, downstream, functional, geographical and cybernetic. The criterion Severity had the following sub-criteria: confidentiality, integrity, availability, traceability and authenticity. Finally, the criteria Susceptibility and Uncertainty did not have sub-criteria.
The sub-criterion Domain had the following options: economic, social and environmental. The sub-criterion Pillar had the options: health, energy, waste, traffic, agriculture, home. These options were based on the systems that support the operations of organizations, cities, or countries. They could be related to the services supported by critical infrastructures.
The sub-criterion Systems had the following options: IT systems, OT systems, and IoT systems. The result of MCDA to evaluate security risk in IoT systems is shown in Table 8, and a screenshot of the application of methodology is shown in Table 9. We propose, in Figure 20, a risk analysis framework based on the seven domains. We renamed the factor application to an organization to improve the understanding of its scope within the risk assessment process.
1.
Organization domain. The domain covers the organizational aspects of the organization (city, campus, enterprise, home) where IoT systems are implemented. The domain includes the evaluation of the security configurations according to policies or regulations related with cybersecurity in the different sectors, such as energy, traffic, health and home. The domain includes the analysis of the vulnerabilities that could affect the compliance of the policies or regulations of cybersecurity. This domain comprises three components:
Pillars: Represents the social, environmental, and economic contexts that encompass IoT systems.
Application domains: Represents the application domains that are covered by the IoT system such as agriculture, health and traffic.
Systems: Includes the IT/OT/IoT systems that support the development of the IoT system, to support the pillars and domains.
2.
Dependency/interdependency domain: Include the upstream, downstream, functional, geographic or cyber dependencies that exist between IoT, OT and IT systems.
3.
Attack surface domain: Include the natural (earthquakes, floods) and human (cyberattacks) hazards, or failures (configuration errors, system malfunctions) that may affect the operation of IoT systems. It includes the analysis of attacks that may occur in the layers of the IoT system.
4.
Susceptibility domain: This domain includes the analysis of factors that could render IoT devices more vulnerable to attacks.
5.
Severity domain: This domain includes the analysis of impact on CIA, traceability and authenticity of IoT devices.
6.
Risk behaviors domain: This domain analyzes the factors that may affect the value at risk, including:
Impact: Represents the value of damage that an IoT system may suffer because of threats.
Probability: Represents the occurrence that a threat may occur.
Propagation time: Represents the time it takes for a threat to propagate and cause medium or high damage.
Propagation coverage: Represents the area of compromise (IT, IoT, OT systems) because of a threat.
7.
Uncertainty domain: This domain covers the address of unknown factors that could contribute to security risk in a spatial and temporal axis.
The framework considers the risk behaviors and the uncertainty factors that could affect the severity of the attack. There are conditions such as impact, probability of occurrence, propagation time and propagation coverage that can be variable, depending on the context of the IoT systems, and of the specific conditions at the time of occurrence of the threat. For example, an attack that is carried out at the exact moment when an upgrade process on IoT devices is performed, and allows the attack to have a greater impact and even reach other devices, is a fortuitous event and may not be repeatable. There is uncertainty regarding these events. Although it is not possible to establish an exact value of the uncertainty, there are several research proposals to estimate it.

Benchmark for IoT Security Risk Methodology

According to [48], the benchmark is considered a real or virtual set of measures that allows the evaluation or ranking of research approaches, algorithms, and methods, based on performance indices (input and outputs) prior to industrial application. From the literature review conducted in this study, it was not possible to identify a standard benchmark for risk analysis methodologies. However, we can identify that, under the ISO 31000, the risk management should cover the following aspects [49]:
  • Establishing the context
  • Risk identification
  • Risk analysis
  • Risk evaluation
  • Risk treatment
Additionally, regarding this study, which is a risk analysis, the method should cover following points: likelihood, consequence and calculation of risk level. Therefore, it is within our interest to observe how the IoT factors that have been considered in this study can be used in risk analysis, to evaluate the increase or reduction in the probability of negative consequences in a context wherein IoT devices are used. For this reason, we define our performance indices in Table 10 for the proposed security risk analysis, in an IoT context, based on the results from PCA on the IoT device factors found in our study.
There are different benchmarks, among which we can mention those based on criteria, data and simulation. The advantages of simulation-based benchmarks are that they can be used in environments where it is not possible to continuously affect the components to obtain data, such as industrial processes or cybersecurity, because they would affect the normal operations of the organizations [47]. For instance, Jeppsson [49] proposes a benchmark simulation for the evaluation of plant-wide control strategies. In the present study, we opted for a simulation benchmark because of the complexity of generating IoT attack scenarios in real environments. A simulation benchmark is based on the simulation of normal or attack states related to the behavior of the components of IoT system. Another relevant aspect to take into consideration with regard to benchmark simulation of IoT security risk, is that it might not always be workable to obtain numerical values, because of the complexity and dynamics of these systems. Therefore, an alternative could be adopted in the form of probabilistic modeling, to obtain a numerical evaluation of likelihood. Lueckmann proposes a benchmark that comprises a set of algorithms, performance metrics, and tasks. According to Lueckmann [50], given a prior p(θ) over parameters θ, a simulator to sample x~p(x|θ) and an observation xo, the algorithm returns an approximate posterior q(θ|xo). The approximate solution is tested, according to a performance metric, against a reference posterior p(θ|xo). Our simulation was based on the software Hugin Lite, and the probabilities of states in each node were based on Bayesian inference according to Lueckman [50]. We can observe, in Figure 21 and Figure 22, how output variables change based on the values of input variables. For instance, if there is evidence or a belief that vulnerabilities exist in IoT devices, we can change the probability of economic impact to 73.12%. However, if there is evidence or a belief that vulnerabilities and susceptibility exist, the attack surface is attackable, and interdependent systems are attacked, the economic impact increases to 86.5%.
To validate the behavior of the nodes that build the risk analysis, a set of values was established for the input variables defined in the performance indices and we observed the output variables as shown in Table 11. We executed a Shapiro–Wilk test with the null hypothesis that a sample is from a normal distribution. We chose a significance level of 0.05 and had an alternative hypothesis that the distribution is not normal. Vulnerability, susceptibility, attack surface and interdependency nodes did not follow a normal distribution, while economic, social, and environmental nodes followed a normal distribution. Having a normal distribution in the values of the output variables allowed us, from a theoretical point of view, to satisfactorily approximate the value of the random variables to a real situation. The values obtained in the output variables did not present significant dispersions and had a tendency, in this case, to that of a normal distribution. In addition, a correlational analysis of the values generated and obtained was carried out, as shown in Figure 23, showing that the interdependence node is the one that generates the greatest contribution to the values of the economic, social and environmental impact nodes. This gives us a guideline for future work, to analyze the security aspects in the interdependence between IT, OT and IoT systems.

5. Discussion

Including IoT is a relevant contribution to digital transformation processes, but its inherent characteristics, such as heterogeneity of technologies, limited computational resources, low levels of security and the dispersed location of IoT devices, generate new security issues. In this context, there arises the need to establish security strategies for IoT environments such as zero trust or security verification. One of the first steps to implementing security strategies is to develop a risk analysis, for which different established methodologies such as MAGERIT, TARA, ISO can be used. However, several researchers have pointed out that these risk methodologies were conceived considering the characteristics of traditional information system environments, and they do not consider the characteristics of IoT systems; thus, they need to be adapted. In this sense, several researchers have proposed risk analysis methodologies for IoT that consider these inherent characteristics of IoT systems. However, it can be observed that these proposed methodologies consider different elements so that the way of calculating risk varies from one methodology to another; it does not allow us to have a risk methodology that considers all factors.
The aim of this work is focused on analyzing, grouping and proposing factors that allow us to evaluate risk in IoT systems. We have proposed grouping of the factors into seven constructs: Organization, Risk Behaviors, Dependency, Attack Surface, Susceptibility, Severity and Uncertainty. The organization construct suggests that the focus of the risk methodology should not be on the assets, but on the aspects of the domains and pillars to which the IoT solution is contributing. The IoT risk methodology should consider the impact—economic, social or environmental—that may be caused by a threat to IoT systems. Security risks are currently considered among the 10 threats that could generate a shock to the world economy in the so-called systemic risk, and the high interoperability and dependence between IoT/IT/OT systems increases the likelihood of this risk. In this sense, the IoT risk methodology should allow us to understand the risk behavior (impact, propagation time, coverage area) against the different dependencies and attack surfaces generated by IoT systems. A comparison of the traditional risk analysis methodology versus the IoT proposal is presented in Table 12.

Author Contributions

Conceptualization, R.O.A. and S.G.Y.; methodology, R.O.A. and S.G.Y.; formal analysis, R.O.A. and S.G.Y.; investigation, R.O.A. and S.G.Y.; writing—review and editing, R.O.A., S.G.Y. and J.B.; project administration, I.O.-G. All authors have read and agreed to the published version of the manuscript.

Funding

This research received no external funding.

Institutional Review Board Statement

Not applicable.

Informed Consent Statement

Not applicable.

Acknowledgments

The authors acknowledge the Escuela Politécnica Nacional and the Laboratory of Cybersecurity of Universidad de las Americas.

Conflicts of Interest

The authors declare no conflict of interest.

References

  1. Lytras, M.D.; Visvizi, A.; Torres-Ruiz, M.; Damiani, E.; Jin, P. IEEE Access Special Section Editorial: Urban Computing and Well-Being in Smart Cities: Services, Applications, Policymaking Considerations. IEEE Access 2020, 8, 72340–72346. [Google Scholar] [CrossRef]
  2. Sivrikaya, F.; Ben-Sassi, N.; Dang, X.-T.; Gorur, O.C.; Kuster, C. Internet of Smart City Objects: A Distributed Framework for Service Discovery and Composition. IEEE Access 2019, 7, 14434–14454. [Google Scholar] [CrossRef]
  3. Andrade, R.O.; Yoo, S.G. A Comprehensive Study of the Use of LoRa in the Development of Smart Cities. Appl. Sci. 2019, 9, 4753. [Google Scholar] [CrossRef] [Green Version]
  4. Lopez-Vargas, A.; Fuentes, M.; Vivar, M. Challenges and Opportunities of the Internet of Things for Global Development to Achieve the United Nations Sustainable Development Goals. IEEE Access 2020, 8, 37202–37213. [Google Scholar] [CrossRef]
  5. Andrade, R.O.; Yoo, S.G.; Tello-Oquendo, L.; Ortiz-Garces, I. A Comprehensive Study of the IoT Cybersecurity in Smart Cities. IEEE Access 2020, 8, 228922–228941. [Google Scholar] [CrossRef]
  6. Xiaojian, Z.; Liandong, C.; Jie, F.; Xiangqun, W.; Qi, W. Power IoT security protection architecture based on zero trust framework. In Proceedings of the 2021 IEEE 5th International Conference on Cryptography, Security and Privacy (CSP), Zhuhai, China, 8–10 January 2021; pp. 166–170. [Google Scholar]
  7. Kulik, T.; Tran-Jørgensen, P.W.V.; Boudjadar, J.; Schultz, C. A Framework for Threat-Driven Cyber Security Verification of IoT Systems. In Proceedings of the 2018 IEEE International Conference on Software Testing, Verification and Validation Workshops (ICSTW), Västerås, Sweden, 9–13 April 2018; pp. 89–97. [Google Scholar]
  8. Khatun, M.; Glass, M.; Jung, R. An Approach of Scenario-Based Threat Analysis and Risk Assessment over-the-Air updates for an Autonomous Vehicle. In Proceedings of the 2021 7th International Conference on Automation, Robotics and Applications (ICARA), Prague, Czech Republic, 4–6 February 2021; pp. 122–127. [Google Scholar]
  9. Kandasamy, K.; Srinivas, S.; Achuthan, K.; Rangan, V.P. IoT cyber risk: A holistic analysis of cyber risk assessment frameworks, risk vectors, and risk ranking process. EURASIP J. Inf. Secur. 2020, 2020, 8. [Google Scholar] [CrossRef]
  10. Nurse, J.; Creese, S.; De Roure, D. Security Risk Assessment in Internet of Things Systems. IT Prof. 2017, 19, 20–26. [Google Scholar] [CrossRef]
  11. Moreira, F.R.; Filho, D.A.D.S.; Nze, G.D.A.; Junior, R.T.D.S.; Nunes, R.R. Evaluating the Performance of NIST’s Framework Cybersecurity Controls Through a Constructivist Multicriteria Methodology. IEEE Access 2021, 9, 129605–129618. [Google Scholar] [CrossRef]
  12. Proenca, D.; Estevens, J.; Vieira, R.; Borbinha, J. Risk Management: A Maturity Model Based on ISO 31000. In Proceedings of the 2017 IEEE 19th Conference on Business Informatics (CBI), Thessaloniki, Greece, 24–27 July 2017; Volume 1, pp. 99–108. [Google Scholar]
  13. Garcia, F.Y.H.; Moreta, L.M.L. Maturity Model for the Risk Analysis of Information Assets based on Methodologies MAGERIT, OCTAVE y MEHARI; focused on Shipping Companies. In Proceedings of the 2018 7th International Conference on Software Process Improvement (CIMPS), Guadalajara, Mexico, 17–19 October 2018; pp. 29–39. [Google Scholar]
  14. Kieras, T.; Farooq, M.J.; Zhu, Q. RIoTS: Risk Analysis of IoT Supply Chain Threats. In Proceedings of the 2020 IEEE 6th World Forum on Internet of Things (WF-IoT), New Orleans, LA, USA, 5–9 April 2020; pp. 1–6. [Google Scholar]
  15. Toapanta, S.M.T.; Pesantes, R.P.R.; Gallegos, L.E.M. Impact of Cybersecurity Applied to IoT in Public Organizations in Latin America. In Proceedings of the 2020 Fourth World Conference on Smart Trends in Systems, Security and Sustainability (WorldS4), London, UK, 27–28 July 2020; pp. 154–161. [Google Scholar]
  16. Aydos, M.; Vural, Y.; Tekerek, A. Assessing risks and threats with layered approach to Internet of Things security. Meas. Control 2019, 52, 338–353. [Google Scholar] [CrossRef]
  17. Popescu, T.; Popescu, A.; Prostean, G. IoT Security Risk Management Strategy Reference Model (IoTSRM2). Future Internet 2021, 13, 148. [Google Scholar] [CrossRef]
  18. Levitsky, D. Assessing Risk in IoT Systems. Ph.D. Thesis, California Polytechnic State University, San Luis Obispo, CA, USA, 2018. [Google Scholar]
  19. Sardjono, W.; Cholik, M.I. Information Systems Risk Analysis Using Octave Allegro Method Based at Deutsche Bank. In Proceedings of the 2018 International Conference on Information Management and Technology (ICIMTech), Jakarta, Indonesia, 3–5 September 2018; pp. 38–42. [Google Scholar]
  20. Blessing, L.; Chakrabarti, A. DRM: A Design Research Methodology; Springer: Berlin/Heidelberg, Germany, 2009; pp. 13–42. [Google Scholar]
  21. Moher, D.; Liberati, A.; Tetzlaff, J.; Altman, D.G. Preferred reporting items for systematic reviews and meta-analyses: The PRISMA statement. PLoS Med. 2009, 6, e1000097. [Google Scholar] [CrossRef] [PubMed] [Green Version]
  22. Agus, Y.M.; Falih, M.D.; Satrya, G.B. On the Possibilities of Cybercrime in IoT Devices. Test Eng. Manag. 2020, 83, 8231–8238. [Google Scholar]
  23. Tubaishat, A.; Al Jouhi, M. Building a Security Framework for Smart Cities: A Case Study from UAE. In Proceedings of the 2020 5th International Conference on Computer and Communication Systems (ICCCS), Shanghai, China, 22–24 February 2020; pp. 477–481. [Google Scholar]
  24. Barreto, L.; Amaral, A. Smart Farming: Cyber Security Challenges. In Proceedings of the 2018 International Conference on Intelligent Systems (IS), Phuket, Thailand, 17–19 November 2018; pp. 870–876. [Google Scholar]
  25. Ghirardello, K.; Maple, C.; Ng, D.; Kearney, P. Cyber security of smart homes: Development of a reference architecture for attack surface analysis. In Living in the Internet of Things: Cybersecurity of the IoT—2018; Institution of Engineering and Technology: London, UK, 2018; pp. 1–10. [Google Scholar]
  26. Figueroa-Lorenzo, S.; Añorga, J.; Arrizabalaga, S. A Survey of IIoT Protocols: A Measure of Vulnerability Risk Analysis Based on CVSS. ACM Comput. Surv. 2021, 53, 1–53. [Google Scholar] [CrossRef]
  27. Niu, W.; Zhang, X.; Du, X.; Zhao, L.; Cao, R.; Guizani, M. A deep learning based static taint analysis approach for IoT software vulnerability location. Measurement 2020, 152, 107139. [Google Scholar] [CrossRef]
  28. Rizvi, S.; Kurtz, A.; Pfeffer, J.; Rizvi, M. Securing the Internet of Things (IoT): A Security Taxonomy for IoT. In Proceedings of the 2018 17th IEEE International Conference on Trust, Security and Privacy in Computing and Communications, New York, NY, USA, 1–3 August 2018; pp. 163–168. [Google Scholar] [CrossRef]
  29. Khor, J.H.; Sidorov, M. Weakness of Ultra-Lightweight Mutual Authentication PRotocol for IoT Devices Using RFlD Tags. In Proceedings of the 2018 Eighth International Conference on Information Science and Technology (ICIST), Cordoba, Spain, 6–30 July 2018; pp. 91–97. [Google Scholar]
  30. Obaidat, M.A.; Obeidat, S.; Holst, J.; Al Hayajneh, A.; Brown, J. A Comprehensive and Systematic Survey on the Internet of Things: Security and Privacy Challenges, Security Frameworks, Enabling Technologies, Threats, Vulnerabilities and Countermeasures. Computers 2020, 9, 44. [Google Scholar] [CrossRef]
  31. Ali, S.; Khan, M.A.; Ahmad, J.; Malik, A.W.; Rehman, A.U. Detection and prevention of Black Hole Attacks in IOT & WSN. In Proceedings of the 2018 Third International Conference on Fog and Mobile Edge Computing (FMEC), Barcelona, Spain, 23–26 April 2018; pp. 217–226. [Google Scholar]
  32. Abdalla, P.A.; Varol, C. Testing IoT Security: The Case Study of an IP Camera. In Proceedings of the 2020 8th International Symposium on Digital Forensics and Security (ISDFS), Beirut, Lebanon, 1–2 June 2020; pp. 1–5. [Google Scholar]
  33. Abhijith, V.S.; Sowmiya, B.; Sudersan, S.; Thangavel, M.; Varalakshmi, P. A Review on Security Issues in Healthcare Cyber-Physical Systems. In Cyber Intelligence and Information Retrieval; Springer: Singapore, 2022. [Google Scholar]
  34. Martinez, J.B. Medical Device Security in the IoT Age. In Proceedings of the 2018 9th IEEE Annual Ubiquitous Computing, Electronics & Mobile Communication Conference (UEMCON), New York, NY, USA, 8–10 November 2018; pp. 128–134. [Google Scholar]
  35. Luo, J.-Z.; Shan, C.; Cai, J.; Liu, Y. IoT Application-Layer Protocol Vulnerability Detection using Reverse Engineering. Symmetry 2018, 10, 561. [Google Scholar] [CrossRef] [Green Version]
  36. Yu, M.; Zhuge, J.; Cao, M.; Shi, Z.; Jiang, L. A Survey of Security Vulnerability Analysis, Discovery, Detection, and Mitigation on IoT Devices. Futur. Internet 2020, 12, 27. [Google Scholar] [CrossRef] [Green Version]
  37. Patnaik, R.; Padhy, N.; Raju, K.S. A Systematic Survey on IoT Security Issues, Vulnerability and Open Challenges. In Intelligent System Design. Advances in Human Error, Reliability, Resilience, and Performance; Satapathy, S., Bhateja, V., Janakiramaiah, B., Chen, Y.W., Eds.; Springer: Singapore, 2021; Volume 1171, pp. 723–730. [Google Scholar]
  38. Jiang, X.; Lora, M.; Chattopadhyay, S. An Experimental Analysis of Security Vulnerabilities in Industrial IoT Devices. ACM Trans. Internet Technol. 2020, 20, 1–24. [Google Scholar] [CrossRef]
  39. Anand, P.; Singh, Y.; Selwal, A.; Singh, P.; Felseghi, R.; Raboaca, M. IoVT: Internet of Vulnerable Things? Threat Architecture, Attack Surfaces, and Vulnerabilities in Internet of Things and Its Applications towards Smart Grids. Energies 2020, 13, 4813. [Google Scholar] [CrossRef]
  40. Shakdher, A.; Agrawal, S.; Yang, B. Security Vulnerabilities in Consumer IoT Applications. In Proceedings of the 2019 IEEE 5th Intl Conference on Big Data Security on Cloud (BigDataSecurity), IEEE Intl Conference on High Performance and Smart Computing, (HPSC) and IEEE Intl Conference on Intelligent Data and Security (IDS), Washington, DC, USA, 27–29 May 2019; pp. 1–6. [Google Scholar]
  41. Santos, L.; Rabadao, C.; Goncalves, R. Intrusion detection systems in Internet of Things: A literature review. In Proceedings of the 13th Iberian Conference on Information Systems and Technologies (CISTI), Caceres, Spain, 13–16 June 2018. [Google Scholar] [CrossRef]
  42. Garcia, S.; Parmisano, A.; Erquiaga, M.J. Zenodo, IoT-23: A Labeled Dataset with Malicious and Benign IoT Network Traffic [Data set]; Stratosphere Laboratory: Praha, Czech Republic, 2020. [Google Scholar]
  43. Herrera, J.; Andrade, R.; Flores, M.; Cadena, S. Anomaly detection under cognitive security model. LAJC 2020, 7, 34–47. [Google Scholar]
  44. Ibrahim, M.; Al-Hindawi, Q.; Elhafiz, R.; Alsheikh, A.; Alquq, O. Attack Graph Implementation and Visualization for Cyber Physical Systems. Processes 2019, 8, 12. [Google Scholar] [CrossRef] [Green Version]
  45. Tarka, P. An overview of structural equation modeling: Its beginnings, historical development, usefulness and controversies in the social sciences. Qual. Quant. 2018, 52, 313–354. [Google Scholar] [CrossRef] [PubMed] [Green Version]
  46. Kline, R.B. Principles and Practice of Structural Equation Modeling; Guilford Press: New York, NY, USA, 2011. [Google Scholar]
  47. Rahman, H.U.; Raza, M.; Afsar, P.; Alharbi, A.; Ahmad, S.; Alyami, H. Multi-Criteria Decision Making Model for Application Maintenance Offshoring Using Analytic Hierarchy Process. Appl. Sci. 2021, 11, 8550. [Google Scholar] [CrossRef]
  48. Patton, R.J. A benchmark study approach to fault diagnosis of industrial process control systems. In Proceedings of the IEE Seminar on Control Loop Assessment and Diagnosis, London, UK, 16 August 2005. [Google Scholar]
  49. Jeppsson, U.; Pons, M.-N.; Nopens, I.; Alex, J.; Copp, J.; Gernaey, K.; Rosen, C.; Steyer, J.-P.; Vanrolleghem, P. Benchmark simulation model no 2: General protocol and exploratory case studies. Water Sci. Technol. 2007, 56, 67–78. [Google Scholar] [CrossRef] [PubMed]
  50. Lueckmann, J.; Boelts, J.; Greenberg, D.; Gonçalves, P.; Macke, J. Benchmarking simulation-based inference. In Proceedings of the International Conference on Artificial Intelligence and Statistics, Suzhou, China, 15–17 October 2021. [Google Scholar]
Figure 1. Phases of Design Research Methodology (DRM) to development risk analysis methodology for IoT systems.
Applsci 12 02976 g001
Figure 2. Screenshot of the tool Rayyan used during screening process to select the primary sources for the full text review process.
Applsci 12 02976 g002
Figure 3. PRISMA methodology used in SLR process to identify factors in IoT devices that could affect security risk.
Applsci 12 02976 g003
Figure 4. Density of the codes related with factors of IoT devices that could affect risk values.
Applsci 12 02976 g004
Figure 5. Initial reference model for risk analysis in IoT systems based on IoT device factors.
Applsci 12 02976 g005
Figure 6. Concurrence-Table option of Atlas TI to identify the relationships between codes.
Applsci 12 02976 g006
Figure 7. Components of attack surface in IoT systems according to quality analysis using Atlas TI.
Applsci 12 02976 g007
Figure 8. Simulated smart home scenario using Bayesian networks.
Applsci 12 02976 g008
Figure 9. Probabilities of simulated smart home scenario using Bayesian networks.
Applsci 12 02976 g009
Figure 10. Probabilities of attack to smart city domains.
Applsci 12 02976 g010
Figure 11. Simulated environment of smart home attacks.
Applsci 12 02976 g011
Figure 12. Probabilities of simulated environment of smart home attacks.
Applsci 12 02976 g012
Figure 13. IoT application based on Raspberry and Arduino.
Applsci 12 02976 g013
Figure 14. Smart home based on medium-cost devices.
Applsci 12 02976 g014
Figure 15. Second reference model for risk analysis in IoT systems based on IoT device factors.
Applsci 12 02976 g015
Figure 16. Extract of survey to obtain information from experts related to IoT security.
Applsci 12 02976 g016
Figure 17. Setup of factorial analysis in SPSS to extract principal components.
Applsci 12 02976 g017
Figure 18. Setup of factorial analysis in SPSS to extract principal components.
Applsci 12 02976 g018
Figure 19. Setup of factorial analysis in SPSS to extract principal components.
Applsci 12 02976 g019
Figure 20. Framework of security risk components of IoT systems.
Applsci 12 02976 g020
Figure 21. Calculation of the factors of IoT security risk based on the evidence of vulnerabilities.
Applsci 12 02976 g021
Figure 22. Calculation of the factors of IoT security risk based on the evidence of vulnerabilities, susceptibility, attack surface and interdependency.
Applsci 12 02976 g022
Figure 23. Correlation between input and output variables of IoT security risk. The symbols ** represents a high relationship (upper 80%) between variables. The symbols *** represents a very high relationship (100%) between variables.
Applsci 12 02976 g023
Table 1. Strengths and weaknesses of risk methodologies used in computer science.
MethodologiesFocus OnStrengthWeakness
NIST [11]Security controlsGuidelines to execute security controls according to risk assessment.Needs work with other standards to address compliance.
ISO [12]Compliance of security controlsAnalysis of information security risks according to specific criteria.Coordination and integration to remember to update the standard.
MAGERIT [13]Assets valuesAssessments of critical assets, and the mitigation of threats and risks that could degrade them.Requires time for identification of critical assets.
TARA [14]AttacksDefinition of a list of attacks.Does not quantify risk impact.
Table 2. Publication types of articles according to inclusion and exclusion criteria.
Label for HypothesisFactors
Conferences807
Journal article559
Series215
Chapter23
Book3
Table 3. Factors of IoT devices that could affect risk values and their values of density from the quality analysis.
Label for HypothesisFactorsDensity
H1Vulnerabilities17
H2Type of attack10
H3Attack surface8
H4Interdependency7
H5Severity5
H6Application domain4
H7Scalability4
H8Type of device3
H9Susceptibility2
H10Type of information1
H11Uncertainty0
Table 4. Analysis of the factors of IoT devices that are covered by the proposals of IoT risk methodologies.
Proposals\FactorsKandasamyToapantaAydosPopescusLevitsky
Application domainPartially Covered Not coveredNot coveredNot coveredNot covered
Attack surfaceCoveredCoveredCoveredCoveredCovered
InterdependencyCoveredCoveredNot coveredNot coveredNot covered
ScalabilityNot coveredNot coveredNot coveredNot coveredNot covered
SeverityCoveredNot coveredNot coveredNot coveredCovered
SusceptibilityNot coveredNot coveredNot coveredNot coveredNot covered
Type of attackNot coveredNot coveredCoveredCoveredCovered
Type of deviceCoveredNot coveredNot coveredNot coveredNot covered
Type of informationNot coveredNot coveredNot coveredNot coveredNot covered
UncertaintyNot coveredNot coveredNot coveredNot coveredCovered
VulnerabilitiesNot coveredNot coveredNot coveredCoveredNot covered
Table 5. Research items validated in experimentation to identify the relationships between factors of IoT devices.
Hypothesis (Risk Factors)CodeResearch Items
H6. Application domainS-ACyberattacks on IoT systems could affect economic, social or environmental domains.
S-A-PCyberattacks on IoT systems could be targeted at IoT solutions to health, energy, traffic and agriculture.
H4. InterdependencyS-I-SysCyberattacks on IoT systems could be affected by other IoT, IT and OT systems.
S-I-ndThe growth of the number of IoT devices could increase the probability of cyberattacks.
H7. Level of scalability S-SclCyberattacks on IoT systems could generate shock on markets or risk systemic events.
H9. Level of susceptibilityS-ScSecurity configurations on IoT devices depend on domains or pillars where IoT devices will be used.
H4. InterdependencySc-I-SysInterdependency of IoT device with other IoT, IT and OT systems could increase the probability of attacks on IoT systems and cause bigger damage.
H4. Attack surfaceSc-As-ndThe growth in the number of IoT devices could increase organizations’ susceptibility to suffering cyberattacks because of the large attack surface.
H1. VulnerabilitiesSc-VVulnerabilities of IoT devices could increase the probability of cyberattacks on IoT systems.
H9. Level of susceptibilitySc-TaIoT devices are susceptible to specific types of cyberattacks.
H2. Types of attacksSc-Ta2Previous attack allows the execution of new attacks.
H2. Types of attacksSc-Ta-LAttacks could be executed in different layers.
H8. Type of IoT deviceSc-TdSecurity configurations on IoT devices could increase their susceptibility to being attacked.
H5. SeverityRb-Sv-TaCyberattacks could generate degradation in the operation of IoT devices.
H5. SeverityRb-Sv-SrCyberattacks could affect CIA on IoT systems.
H7. Level of scalability Rb-SclCyberattacks could be scaled from one layer of an IoT system to another one.
H11. Factors not knownRb-U-fThe frequency of cyberattacks could increase their success.
H11. Factors not knownRb-U-TpShort times of the propagation of cyberattacks could increase their damage.
H7. Level of scalabilityRb-Scl-LCyberattack could affect different layers of IoT systems and increase the surface of damage.
Table 6. Research items validated in experimentation to identify the relation between factors of IoT devices.
Research ItemsVerifiable MeansRelation
Cyberattacks on IoT systems could affect economic, social or environmental domains.Experiment 1
Experiment 2
S-A
Cyberattacks on IoT systems could be targeted at IoT solutions to health, energy, traffic, agriculture.Experiment 1
Experiment 2
S-A-P
Cyberattacks on IoT systems could be affected by other IoT, IT and OT systems.Experiment 1S-I-Sys
The growth of the number of IoT devices could increase the probability of cyberattacks.Experiment 1S-I-nd
Cyberattacks on IoT systems could generate shock in markets or risk systemic events.Not verifiableS-Scl
Security configurations on IoT devices depends on domains or pillars where IoT devices will be used.Experiment 1
Experiment 3
S-Sc
Interdependency of IoT device with other IoT, IT and OT systems could increase the probability of an attack on IoT systems and cause bigger damage.Experiment 3
Experiment 4
Experiment 5
Sc-I-Sys
The growth of the number of IoT devices could increase organizations’ susceptibility to suffering cyberattacks because of the large attack surface.Not verifiableSc-As-nd
Vulnerabilities in IoT devices could increase the probability of cyberattacks on IoT systems.Experiment 4
Experiment 5
Sc-V
IoT devices are susceptible to specific type of cyberattacks.Experiment 1
Experiment 3
Sc-Ta
Previous attack allows the execution of new attacks.Experiment 3Sc-Ta2
Attacks could be executed in different layers. Experiment 4Sc-Ta-L
Security configurations on IoT device could increase susceptibility to being attacked.Experiment 4
Experiment 5
Sc-Td
Cyberattacks could generate degradation in the operation of IoT devices.No verificableRb-Sv-Ta
Cyberattacks could affect CIA on IoT systems.Experiment 3
Experiment 4
Experiment 5
Rb-Sv-Sr
Cyberattacks could be scaled from one layer of an IoT system to another one.Experiment 4Rb-Scl
The frequency of cyberattacks could increase their success.No verificableRb-U-f
Short times of the propagation of cyberattacks could increase their damage.Not verifiableRb-U-Tp
Cyberattacks could affect different layers of IoT systems and increase the surface of damage.Experiment 1
Experiment 2
Experiment 3
Rb-Scl-L
Table 7. Variance distributed in components (factors) using SPSS.
Total Variance Explained
ComponentInitial EigenvaluesExtraction Sums of Squared Loadings
Total% of VarianceCumulative %Total% of Variance
114,82254,89554,89514,82254,895
2334412,38567,280334412,385
3321811,91879,197321811,918
41938717886,37519387178
51671619092,56516716190
61219451697,08112194516
70.7882919100,0000.7882919
81321 × 10−154892 × 10−15100,0001321 × 10−154892 × 10−15
91228 × 10−154547 × 10−15100,0001228 × 10−154547 × 10−15
Table 8. MCDA to evaluate the security risk value for IoT systems.
ComponentsOrganization (54.9%)
DomainsPillarsSystemsSecurity configurationsVulnerabilities
Weight30%20%20%10%20%
ComponentsScalability (12.39%)
Impact/degradationP. OcurrenceP.timeP.coveragePrevious Attacks
Weight40%30%10%10%10%
ComponentsAttack Surface (11.92%)Susceptibility (6.19%)
Number IoT dev.ThreatsNumber IoT layersNo extra components
Weight40%40%40%100%
ComponentsSeverity (7.18%)
ConfidencialityIntegrityAvalabilityTrazabilityAuthenticity
Weight40%20%20%10%10%
ComponentsInterdependency (4.52%)
UpstreamDownstreamFunctionalGeographicalCybernetic
Weight20%20%20%20%20%
ComponentsUncertainity (2.9%)
No extra components
Weight100%
Domain (30 %)EconomicSocialEnvironmental
Weight60%25%15%
Table 9. Screenshot of the application of MCDA to evaluate the risk of three different IoT systems.
IoT SystemSeveritySusceptibilityRisk BehavioursRisk Total (/10)
0.60.30.1
IoTX1.442.100.494.03
IoTY0.700.770.211.68
IoTZ2.291.010.313.61
Table 10. Performance indices for the benchmark of risk methodology.
Performance Indices
Label for HypothesisFactorsConstructsInput Variables Output Variables
H1VulnerabilitiesOrganization, Attack Surface, Severity(a) Values of vulnerabilities
H2Type of attackOrganization, Risk Behavior, Severity, Uncertainty(a) Value of attack per layer
H3Attack surface Organization, Risk Behavior, Attack Surface, Interdependency(a) Number of IoT devices
(b) Security configurations
(c) Values of vulnerabilities
H4Interdependency Organization, Risk Behavior, Attack Surface, Susceptibility, Interdependency, Uncertainty (a) Values of interdependency
H5SeveritySeverity (a) Values of degradation of CIA
H6Application domainOrganization, Attack surface, Susceptibility, Interdependency (a) Value of economic impact
(b) Value of economic impact
(c) Value of economic impact
H7ScalabilityRisk behavior(a) Number of IoT devices,
(b) Historical attack,
(c) Time between attacks
H8Type of deviceSeverity, Interdependency, Uncertainty(a) Security level of CIA
H9SusceptibilityOrganization, Susceptibility(a) Frequency of attack
(b) Time between attacks
(c) Security levels
H 10Type informationOrganization(a) Security configurations
H 11UncertaintyAttack Surface, Susceptibility, Interdependency, Uncertainty(a) Number of IoT devices
(b) Security configurations
(c) Values of interdependency
Table 11. Performance indices for the benchmark of risk methodology.
IoT Factors (Input Variables)Impact (Output Variables)
VulnerabilitiesSusceptibilityAttack SurfaceInterdependencyEconomicSocialEnvironmental
70%50%60%60%70.77%63.98%55.90%
100%50%50%60%73.12%66.04%57.66%
100%100%50%60%76.56%69.08%60.26%
100%100%100%60%77.91%70.25%61.26%
100%100%100%100%86.05%77.15%67.28%
70%100%50%60%73.40%66.30%57.88%
70%50%50%100%84.86%76.22%66.43%
Table 12. Comparison of traditional methodologies versus the proposal of IoT security risk in the present study.
MethodologyComputer Security Risk Analysis (MAGERIT)IoT Risk
Focus onAssetsContext (social, environmental, economic)
PriorityTop of critical assetsTop of group of critical assets
Dependency ofAssetsAssets/threats
Type AssetsIndividual critical assetsGrouped critical assets (based on classes or security levels)
Security factors on the assetsConfidentiality, Integrity, Availability, Traceability and AuthenticityConfidentiality, integrity and availability (Based on classes)
VulnerabilitiesOverall approachBased on IoT layers (application, communication, and device)
Attack surfaceNot included in the methodology.Based on relationships among systems.
Publisher’s Note: MDPI stays neutral with regard to jurisdictional claims in published maps and institutional affiliations.

