Abstract
The evaporation of chemicals in applied chemical products such as cleaning products and paint has been evaluated using the evaporation mode of the ConsExpo model. However, it remains controversial whether the ConsExpo model can be used for non-applied chemical products such as air fresheners, because the ConsExpo model assumes that the mass of the non-applied chemical products does not change during the time of use. If most of the materials in the product are volatile, the product mass can decrease. To explain the effect of a change in product mass, the ‘Chemical Product Evaporation Model (CPEM)’ was developed. This study demonstrated that the product mass decreases linearly when the surface area of the product is invariant, theoretically and experimentally. It was found that the ConsExpo evaporation model can be applied to products in which the other materials do not evaporate, and the CPEM can be applied to products in which the other materials are volatile. If the target substance in a product evaporates completely before the exhaustion time, the average concentration of a target substance in the air can be estimated simply from its initial concentration in the product and the product mass reduction rate. Otherwise, we recommend using the CPEM.
1. Introduction
A volatile or semi-volatile substance can evaporate into indoor air from a chemical product with a long release time. To assess exposure due to evaporation from a consumer product, several tools have been developed [,,]. The ConsExpo evaporation model has been used to predict the amount of a substance that will evaporate from a chemical product into indoor air []. In the ConsExpo model, the inhalation exposure to vapor is divided into three scenarios: instantaneous release, constant rate, and evaporation emission modes. The instantaneous release scenario assumes that all substances are released from a product into the air at once. The constant rate scenario describes the release of a substance at a constant rate over the period that a product is used. The evaporation mode describes the release of a substance from the surface of a liquid or gel product by evaporation, which is driven by the difference between the vapor pressure and saturated vapor pressure of a substance in the air.
The ConsExpo evaporation model could successfully predict the measured air concentration of glutaraldehyde when a cleaner/sanitizer product was applied [], as well as the n-alkane concentration in the air from paint use []. In these two cases, the release areas of both products increased when the products were applied. Conversely, another case reported a decrease in product volume over time, such that 5-chloro-2-methylisothiazol-3(2H)-one (CMIT) and 2-methylisothiazol-3(2H)-one (MIT) concentrations in the air freshener studied increased over 7 days []. From these studies, the volume of a product can change and affect the air concentrations of volatile substances in that product. Because both the mass of the product and the amount of substance in the product decrease over time, the concentration of substances in the product can change. However, for non-applied products such as passive air fresheners, the mass of the product generally decreases over time. Therefore, the constant rate mode and evaporation mode in the ConsExpo model can lead to underestimation of the real exposure level of non-applied chemical products because both modes exclude the possibility that the target substance concentration in the product increases over time.
According to Park et al. (2016) [], because the ConsExpo evaporation model assumes that the volume of a given air freshener does not change, it is not able to account for the increasing concentrations of target substances in the product. Therefore, Park et al. (2016) developed a new evaporation exposure model incorporating the target substance concentration in the product as a state variable, which made it possible to predict increasing concentrations of target substances in a product that matched the experimental data. They described the evaporation process of a chemical in a product as an inter-phase mass transfer of volatile compounds. They also predicted fluxes from the product into the air assuming that the target substance concentrations in the product were negligible compared with other materials in the product and omitted the possibility of in-air saturation of the target substances. This assumption limited the application domain of the new model into the minor compounds, such as biocides with very low concentration in the product. In our study, we attempt to broaden the applicability of this new evaporation model, such that it can be used to analyze volatile major ingredients as well as minor compounds in a chemical product.
This study developed a new evaporation model, the chemical product evaporation model (CPEM), to estimate the air concentration of a target substance when using non-applied products containing volatile solvents while accounting for the saturation kinetics of the target substance in air. The CPEM includes the concentration of the target substance in a product as a state variable with the rate of mass reduction of liquid or gel products set as a parameter to predict the substance concentration in the air. First, we measured and modeled the decrease in product mass when a chemical product is used. Then, we compared the CPEM with existing evaporation models that assume a constant concentration of a substance or a constant mass of the product. Finally, a new screening tool was developed for assessing chemical product exposure; this was found to be suitable for evaluating non-applied products that lose mass by evaporation.
2. Theory
2.1. Derivation of the CPEM
Here, we develop the CPEM using the mass balance of substances that evaporate from a product into the air:
where is the mass of the target substance in the air ([]), is the flux of a substance into the air through surface contact between the air and product ([]), is the air flow rate by ventilation ([]), and is the substance concentration in the air ([]). According to [], can be described by Fick’s first law as follows:
where is the mass of a substance in the product ([]), is the mass transfer rate ([]), is the surface area of the product ([]), is the molecular weight of the substance ([]), is the universal gas constant, is the temperature ([]), is the equilibrium vapor pressure ([]), and is the actual vapor pressure. From Equations (1) and (2), the derivative for the concentration in the air is derived as follows:
where is the room volume ([]), and is the ventilation rate ([). According to Raoult’s law and the ideal gas equation, Equation (3) can be redescribed as follows:
where is the concentration of target substance in a product ([]), is the concentration of the other materials in the product ([]) and is assumed to be constant, is the saturated vapor pressure of the target substance, is the average molecular weight of the other materials ([]), and is the ventilation rate coefficient ([]). The flux for the other materials can be expressed according to Fick’s first law as follows:
where is the mass flux of the other materials per unit time through surface contact between the air and product, is the equilibrium vapor pressure of the other materials, is the actual vapor pressure of the other materials, and is the saturated vapor pressure of the other materials. If the other materials accounted for most of the product, was negligible, so was almost equal to . Because , dividing by gives the following:
where is the concentration of other materials in air ([]). Because all the parameters of Equation (6) are constants, is stable on a daily basis if the room air is ventilated once per day. After each active ventilation, the same flux is repeatedly generated from the product surface area because the concentration of other materials in the product does not change. Thus, the product mass reduction rate can be considered constant.
This means that the change in product mass can be described by zero-order kinetics as follows:
where is the product mass ([kg]) and is the decreasing rate of product mass ([]). If Equation (2) is divided by , then according to the chain rule the derivative for the substance concentration in the product is given by:
2.2. Model Simplification
2.2.1. Constant Substance Concentration in a Product
If is constant, the CPEM can be simplified as follows:
2.2.2. Unsaturation and Constant product Mass: The ConsExpo Evaporation Model without Saturation
If it is assumed that there are no saturation kinetics and that the product mass is constant, the CPEM is simplified to the following coupled differential equation:
2.2.3. Saturation and Constant Product Mass: The ConsExpo Evaporation Model or CPEM without Product Mass Change
If it is assumed that the product mass is constant, the CPEM can be simplified to the coupled differential Equations (12) and (13) as follows:
This coupled differential equation is equal to the ConsExpo evaporation model []. Because is less than in Equation (13), always decreases, and steady state air concentration does not exist.
2.2.4. Unsaturation and Variable Product Mass: The CPEM without Saturation
Assuming that there are no saturation kinetics, the CPEM can be simplified as follows:
where is the mass reduction rate coefficient ([]).
2.3. Indirect Estimation of the Air Substance Concentration from the Amount of Substance in a Product
If we can measure the product mass reduction rate coefficient , the mass balance of the target substance in the air is given by a function of the averaged product reduction rate (), as follows:
where is the difference in the mass of a substance in the product between and ([]), and is the exhaustion time of the product ([]). The averaged flux can be defined as . Dividing Equation (16) by gives the following:
If , then a steady state solution is derived as follows:
If the target substance in a product evaporates completely before the exhaustion time of the product, the steady state solution can be calculated using only the initial weight fraction and the exhaustion time of the product . If the target substance in a product does not evaporate completely before the exhaustion time of product, the remaining amount of the target substance is additionally required to calculate .
3. Material and Methods
3.1. Measurement of the Product Mass Reduction Rate
The product mass was measured in liquid and gel-type air fresheners every hour for 4 days to determine whether the product mass reduction rate was constant. In addition to these measurements, the weight differences of 20 liquid or gel products were measured for 1 week and used to calculate the product mass reduction rate assuming a constant rate of product mass reduction. First the product mass reduction rate was estimated, and the product mass reduction rate coefficient was then calculated by dividing by the initial product mass ().
3.2. Input Data for Simulation
Input parameters for the CPEM were divided into chemical-specific or product-specific parameters. The chemical-specific parameters were vapor pressure, molecular weight, and mass transfer rate, and the product-specific parameters were product mass, molecular weight of the residual material, weight fraction of the substance, release area, and product mass reduction rate. One air freshener product containing 2-phenoxyethanol was selected for simulation (Table 1). The weight fraction of the chemical in this product was 3.58%. 2-Phenoxyethanol is a chemical commonly used in air fresheners, with a molecular weight of 138.17 g/mol and vapor pressure of 1.33 Pa (20 °C). The mass transfer rate was calculated using the Thibodeaux method [] equation in the ConsExpo evaporation model documentation []. The initial product mass and mass reduction rate were measured in this study. To obtain , the average molecular weight of the other substances in the product was required. It was not possible to obtain the average molecular weight of each material, and therefore the method suggested by the RIVM report [] was used. Two cases were established, one in which the material to be evaluated was the main solvent of the product and a second in which it was not. The basic formula for calculating is , where is the content ratio of other materials in the product, and is the molecular weight of other materials in the product. If the material to be evaluated is not the main solvent of the product, , where is the molecular weight of the main solvent, and is the content ratio of the major solvent in the product. If the material to be evaluated is the main solvent of the product, . For the content ratio w of the substance in the product, the minimum value of the content of the target chemical in the product was applied based on data from the Chemistry Dashboard and Consumer Product Information Database of the US Environmental Protection Agency (US EPA). Because it is difficult to know the release area of every product on the market, three cases with respective release areas of 9, 25, and 49 were assumed. Finally, a ventilation rate of 1 and room volume of 30 were assumed as in Park’s study []. The temperature was assumed to be 293.15 K.

Table 1.
Model parameters for simulating the indoor air concentration of a target chemical and product (2-phenoxyethanol in a liquid air freshener).
3.3. Simulation Procedure
The CPEM includes , , and as state variables. The original CPEM and four simplified versions of the model were compared. The input variables and parameters of these models are shown in Table 1. The outputs of these models were the concentrations of substances in the air and the product and the mass of the product. In addition, cases of active ventilation in the room (once and twice per day) were also considered for evaluating the time-averaged concentration of substances in the air. After active ventilation, was reset to zero, but and changed continuously. When the product was exhausted, a new product was assumed to be used again to mimic a pattern of continuous use.
The model simulation was conducted in Python 3.7, and the numerical solutions of the simultaneous differential equation model were obtained using the odeint function in the scipy 1.5.0 software. The odeint function of the scipy package can solve an ordinary differential equation using a numerical method.
4. Results
4.1. Product-Specific Mass Reduction Rate
By measuring the weight change every hour, it was confirmed that the mass of all products decreased at a constant rate (Figure 1). The product mass reduction rate coefficient () was calculated and then divided by the initial mass of product (Table 2). The range of was 3.3 to 1.05 .
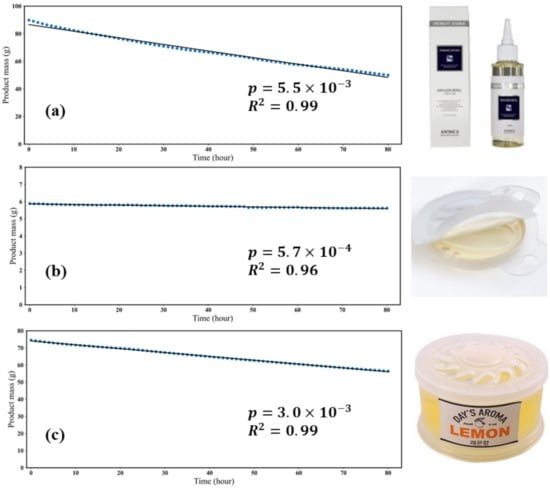
Figure 1.
The weight measurement results for three products: (a,b) liquid type, (c) gel type.
Table 2.
Product mass reduction rate coefficient of 20 products.
4.2. Comparison between the CPEM and Simplified CPEMs
Figure 2 and Figure 3 show the results of simulations with the CPEM and other simplified models using the parameter conditions given in Table 1. When the minimum value of was used, the model assuming a constant concentration of the target substance in the product produced the highest concentration of the target substance in the air. When the maximum value of p was used, the CPEM with and those without saturation kinetics produced the highest concentration of the target substance in the air. The greater the value of p, the greater the concentrations of the target substance in the product and air. There was no significant difference between the CPEM and ConsExpo evaporation model when the lowest of the measured p values from the 20 products was used. This is because the change in product mass was insignificant, and there was no significant difference in the concentration of the target substance in the air between the ConsExpo evaporation model and CPEM. If the evaporation rate of the substance per unit mass of the product was faster than , the concentration of the substance in the product decreased, as in the ConsExpo evaporation model. However, as increases, the product mass decreases rapidly, and therefore the concentration of the target substance in the product increases, with a consequent increase in the concentration of the target substance in the air.
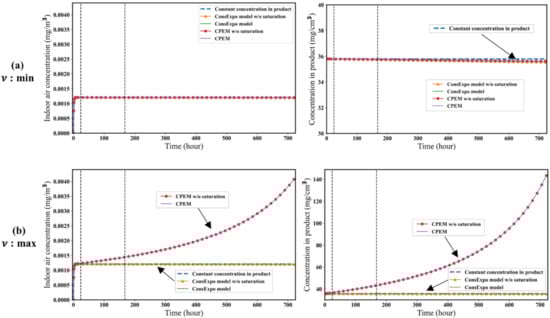
Figure 2.
Comparison of the five models in the case where K and S are minimum. The figures on the left show the indoor air concentration of the substance, and the figures on the right show the substance concentration in the product. The dotted lines correspond to 1 day and 1 week, respectively. (a) is minimum value in Table 2. (b) is maximum value in Table 2.
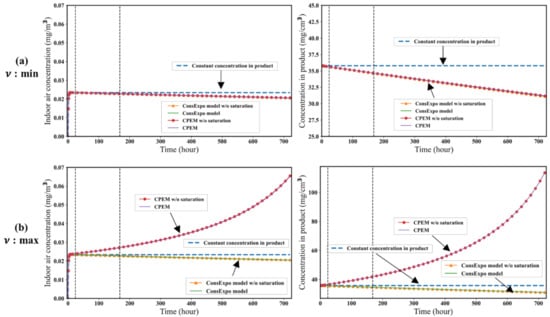
Figure 3.
Comparison of the five models in the case where K and S are maximum. The figures on the left show the indoor air concentration of the target substance, and the figures on the right show the substance concentration in the product. Dotted lines correspond to 1 day and 1 week, respectively. (a) is minimum value in Table 2. (b) is maximum value in Table 2.
Figure 2 and Figure 3 show the effects of the K and S values on the concentration of the target substance in the product and air. There were no significant differences between the models with and those without saturation kinetics. When the maximum values of K and S were used, the concentration of the target substance in the air was predicted to be higher than the minimum values of K and S because the amount of substance evaporated in air was proportional to these parameters. The ConsExpo evaporation model estimates of the concentration of the target substance in air were always smaller than those of the other models. In the ConsExpo evaporation model, only the target substance evaporates, so the substance concentration in the product always decreases. Therefore, when comparing the five models, the ConsExpo evaporation model estimated the lowest concentration of the target substance in the air.
Figure 4 shows a comparison of the results obtained for the CPEM and ConsExpo models under three active ventilation scenarios. The differences in the concentrations of the target substance in the air continuously increased during the period of use. Even with active ventilation, in the CPEM, the concentration of the target substance in the air increased as the mass of the product decreased over time. The more frequently active ventilation was conducted, the more frequently the substance was removed from the air, and the average concentration decreased. It can be seen that the time-integrated average concentration of target substance in the air with active ventilation once a day (Figure 4b) is higher than with active ventilation twice a day (Figure 4c).
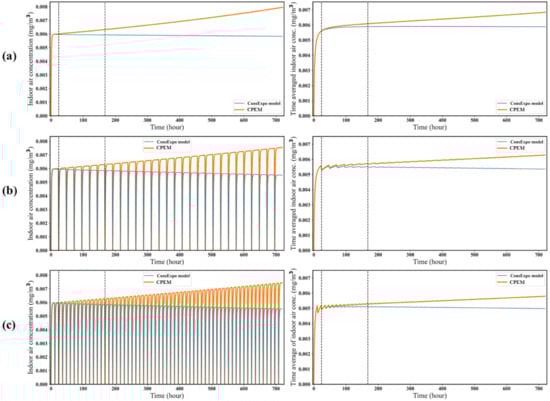
Figure 4.
Comparison of the target substance concentrations in the air under different ventilation conditions. The graphs on the left show the air concentrations of the target substance, and the graphs on the right show the time-averaged concentration of target substance in the air over 1 month. The simulation parameters are presented in Table 1. (a) No active ventilation, (b) active ventilation once a day, and (c) active ventilation twice a day.
4.3. Comparison of the Use of Direct versus Indirect Methods to Estimate the Evaporated Amount of the Target Substance
Here, we considered a case in which the target substance in a product evaporates completely before the exhaustion time of the product and another case in which the target substance does not evaporate completely before the exhaustion time. In Figure 5, was calculated assuming that , where is the exhaustion time of the product. In other words, it was assumed that there would be no target substance remaining in the product at the product exhaustion time. If the target substance is completely evaporated by the exhaustion time, in Equation (18) is equal to the time-averaged concentration of the target substance in the air estimated by CPEM at product exhaustion time (Figure 5a). However, is greater than the time-averaged concentration of a target substance in the air estimated by CPEM when the target substance in the product is not completely evaporated by the exhaustion time of the product (Figure 5b). In this case, the other materials evaporate faster than the target substance, and the target substance remains coagulated after the product is exhausted. Furthermore, it is expected that the average concentration of the target substance in the air can be estimated from the measurement of the remaining amount of the target substance in the product, which would be a useful screening tool (Equation (18)).
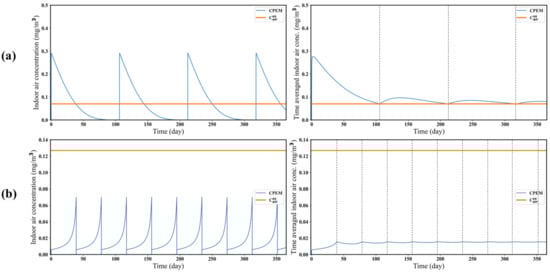
Figure 5.
Comparison of the estimated target substance concentrations in the air between the indirect estimation method ( and direct estimation method (CPEM). The graphs on the left show the air concentrations of the target substance at given times, and the graphs on the right show the time-averaged concentration of the target substance in the air over 1 year. The dotted line represents the product exhaustion time. (a) When the target substance in a product entirely evaporates until exhaustion time. (b) When the target substance in a product does not entirely evaporate until exhaustion time.
5. Discussion
In this study, a new evaporation model was developed to assess non-applied chemical products that reflect product mass reduction over time. Theoretically and experimentally, this study demonstrated the mass of the product decreased at a constant rate, under the assumption of a constant surface area in contact with the air. Under the assumption of a constant reduction rate of the product mass, we obtained three main results. The first was that the ConsExpo evaporation model underestimated the concentration of chemical evaporated in the room air from chemical products. Because the ConsExpo evaporation model assumed that the mass of the product does not change, the product mass would overestimate the mass of a product containing volatile solvents. Thus, the substance concentration in the product estimated by the ConsExpo evaporation model was lower than the substance concentration estimated by CPEM. The ConsExpo evaporation model considers only cases in which the concentration in the product decreases. However, in the CPEM, because the product mass was incorporated as a variable, it was possible for to increase depending on the measured product mass reduction rate.
Schendel proposed two assumptions for the ConsExpo evaporation model (i.e., low concentrations and a pure substance) to obtain an approximate solution []. In terms of the assumption of low concentrations, it was assumed that the concentration of the substance in the product was low enough that . In terms of the pure substance assumption, it was assumed that the whole product consisted of a substance whose concentration was stable, and = . A plateau stage may occur under the assumption of a pure substance but not in the case of low concentrations because the substance concentration of the product decreases. From our simulation results, it can be seen that the plateau stage does not occur, consistent with Schendel’s results. In this study, corresponding to the case of low concentrations, it was confirmed that if the evaporation of the target substance was slower than that of the other materials, the concentration of the substance in the product would increase. It was apparent that the predicted concentration of the target substance in the air was higher than that estimated in previous studies using the ConsExpo evaporation model. Therefore, the ConsExpo evaporation model should be applied when other materials do not volatilize, and the CPEM should be applied when other materials are volatilized.
The third finding was that we can suggest new methods for screening the chemical risk of a product by considering evaporation. If the target substance in a product is predicted to completely evaporate by the product exhaustion time, the average air concentration of the target substance can be estimated using the steady-state solution of Equation (18). Therefore, in this case, only the product of the weight fraction and the product mass reduction rate coefficient is required, without the need for modeling using, for example, the ConsExpo model or the CPEM. If the target substance in a product is not predicted to evaporate completely before the product exhaustion time, the total amount of evaporated substance could be estimated by measuring the amount of the substance remaining as coagulated solid after the product is consumed. However, it is difficult to estimate the remaining amount of target substance in a product, because it takes a long time to use a product completely. In addition, if a steady-state solution is calculated assuming the complete evaporation of the target substance, the average air concentration of the target substance may be overestimated, as Figure 5b. Therefore, it is beneficial to use the CPEM when the target substance in a product does not evaporate completely before the exhaustion time of the product.
The CPEM had two limitations. First, it was assumed that the concentration of the other materials in the product was constant because the substance concentration in the product was assumed to be negligible compared with the concentration of the residual material. The greater the weight fraction of the substance, the greater the uncertainty of the concentration of the other materials. Therefore, in this case, additional model development is required to model the concentration of the other materials independently because is no longer equal to .
The second limitation of the CPEM was related to the uncertainty of the mass transfer rate. McCready et al. suggested an approach to update the estimation of the mass transfer rate []. They recommend using the Sparks method [] for estimating the mass transfer rate for indoor evaporation. The Sparks method provides a better estimation of the predicted vapor concentrations compared with the experimental results than does the default mass transfer method. The Sparks method allows the estimation of the mass transfer rate of both the substance and the other materials. However, because volatilization inhibitors are usually included in chemical products, estimating the mass transfer rate of the substance and the other materials using the Sparks method also has a high level of uncertainty. Because the number of parameters required for the Thibodeaux method is much smaller than that of the Sparks method, the Thibodeaux method is a useful approach when the CPEM is used. Both the Langmuir and Thibodeaux methods can estimate the mass transfer rate with fewer parameters. The Langmuir, Thibodeaux, and Sparks methods predicted a peak vapor concentration 3.1, 2.3, and 1.3 times higher, respectively, than the experiment result []. Thus, the Thibodeaux method is more appropriate than the Langmuir method. When modeling the evaporation from paint, the n-alkane concentration in air was well predicted when the Thibodeaux method was used to estimate the mass transfer rate []. In addition, if the substance concentration in the product and the product mass are known at the same time during use, the product and chemical-specific mass transfer rate can be estimated indirectly from the difference between the initial and final amount of substance in the product.
Author Contributions
Conceptualization, G.Y. and J.-H.L.; methodology, G.Y., D.-y.K., and J.-H.L.; data curation, G.Y. and J.-H.P.; writing—original draft preparation, G.Y.; writing—review and editing, G.Y. and J.-H.L.; visualization, G.Y.; All authors have read and agreed to the published version of the manuscript.
Funding
This work was supported by Korea Environment Industry & Technology Institute (KEITI) through Technology Development Project for Safety Management of Household Chemical Products Development of the technology to assess the environmental pollutant load and exposure of hazardous substances contained in products, funded by Korea Ministry of Environment (MOE) (2020002970003, 1485017539).
Institutional Review Board Statement
Not applicable.
Informed Consent Statement
Informed consent was obtained from all subjects involved in the study.
Data Availability Statement
The data presented in this study are available on request from the corresponding author.
Conflicts of Interest
The authors declare no conflict of interest.
References
- USEPA. Consumer Exposure Model (CEM) Version 2.0 User’s Guide; EPA Contract EP-W-12-010; United State of America Environmental Protection Agency: Washington, DC, USA, 2017. [Google Scholar]
- Huang, L.; Ernstoff, A.; Fantke, P.; Csiszar, S.A.; Jolliet, O. A review of models for near-field exposure pathways of chemicals in consumer products. Sci. Total Environ. 2017, 574, 1182–1208. [Google Scholar] [CrossRef] [PubMed]
- Delmaar, J.E.; Schuur, A.G. ConsExpo Web: Consumer Exposure Models-Model Documentation; Rijksinstituut voor Volksgezondheid en Milieu RIVM: Utrecht, The Netherlands, 2016. [Google Scholar]
- McCready, D.; Fontaine, D. Refining consExpo evaporation and human exposure calculations for REACH. Hum. Ecol. Risk Assess. 2010, 16, 783–800. [Google Scholar] [CrossRef]
- Van Veen, M.P.; Fortezza, F.; Bloemen, H.J.T.; Kliest, J.J. Indoor air exposure to volatile compounds emitted by paints: Experiment and model. J. Expo. Anal. Environ. Epidemiol. 1999, 9, 569–574. [Google Scholar] [CrossRef] [PubMed][Green Version]
- Park, S.K.; Kwon, J.H. The fate of two isothiazolinone biocides, 5-chloro-2-methylisothiazol-3(2H)-one (CMI) and 2-methylisothiazol-3(2H)-one (MI), in liquid air fresheners and assessment of inhalation exposure. Chemosphere 2016, 144, 2270–2276. [Google Scholar] [CrossRef] [PubMed]
- Jayjock, M.A. Back Pressure Modeling of Indoor Air Concentrations from Volatilizing Sources. Am. Ind. Hyg. Assoc. J. 1994, 55, 230–235. [Google Scholar] [CrossRef]
- Bremmer, H.J.; Van Engelen, J.G.M. Paint products fact sheet. To assess the risks for the consumer. Updated version for ConsExpo 4. 2007. Available online: https://www.rivm.nl/bibliotheek/rapporten/320104008.pdf (accessed on 9 November 2021).
- Park, D.; Lee, J.H. Feasibility evaluation of computational fluid dynamics approach for inhalation exposure assessment: Case study for biocide spray. Appl. Sci. 2021, 11, 634. [Google Scholar] [CrossRef]
- Schendel, T.; Rogasch, E.C. Insights gained from an approximate analytical solution of the evaporation model used by consexpo web. Int. J. Environ. Res. Public Health 2021, 18, 2829. [Google Scholar] [CrossRef] [PubMed]
- Sparks, L.E. Gas-phase mass transfer model for predicting volatile organic compound (VOC) emission rates from indoor pollutant sources. Indoor Air 1996, 6, 31–40. [Google Scholar] [CrossRef]
Publisher’s Note: MDPI stays neutral with regard to jurisdictional claims in published maps and institutional affiliations. |
© 2022 by the authors. Licensee MDPI, Basel, Switzerland. This article is an open access article distributed under the terms and conditions of the Creative Commons Attribution (CC BY) license (https://creativecommons.org/licenses/by/4.0/).