Article

Optimization of Soybean Protein Extraction Using By-Products from NaCl Electrolysis as an Application of the Industrial Symbiosis Concept

by
Emilio Ovando
1,†,
Lucio Rodríguez-Sifuentes
2,†,
Luz María Martínez
1 and
Cristina Chuck-Hernández
3,*
1
School of Engineering and Sciences, Tecnológico de Monterrey, Monterrey 64849, Mexico
2
Facultad de Ciencias Biológicas, Universidad Autónoma de Coahuila, Torreon 27276, Mexico
3
The Institute for Obesity Research, Tecnológico de Monterrey, Monterrey 64849, Mexico
*
Author to whom correspondence should be addressed.
These authors contributed equally to this work.
Appl. Sci. 2022, 12(6), 3113; https://doi.org/10.3390/app12063113
Submission received: 9 January 2022 / Revised: 27 February 2022 / Accepted: 8 March 2022 / Published: 18 March 2022
(This article belongs to the Section Applied Industrial Technologies)

Abstract

:

Featured Application

This study shows the use of a by-product from the manufacture of a novel antiseptic/disinfectant (HOCl) to obtain a protein isolate from defatted soybean flour (a co-product from the soybean oil industry); an optimization process was carried out to create an industrial symbiosis.

Abstract

Defatted soybean flour is generated during the oil extraction process of soybean, and it has a protein content of ~50%. On the other hand, an alkaline solution of NaOH is produced during the electrolysis process of NaCl in a novel method used to make a potent disinfectant/antiseptic (HOCl). In the present work, we suggest using these two products to produce soy protein isolate (SPI), aiming to create an industrial symbiosis. A Box–Behnken experimental design was executed, and a surface response analysis was performed to optimize temperature, alkaline solution, and time used for SPI extraction. The SPI produced at optimal conditions was then characterized. The experimental results fit well with a second-order polynomial equation that could predict 93.15% of the variability under a combination of 70 °C, alkaline solution 3 (pH 12.68), and 44.7 min of the process. The model predicts a 49.79% extraction yield, and when tested, we obtained 48.30% within the confidence interval (46.66–52.93%). The obtained SPI was comparable in content and structure with a commercial SPI by molecular weight and molecular spectroscopy characterization. Finally, the urease activity (UA) test was negative, indicating no activity for trypsin inhibitor. Based on the functional properties, the SPI is suitable for food applications.

1. Introduction

The concept of industrial symbiosis, which arises from industrial waste, is within the circular economy area in which industrial waste from one process is used as raw material for another. This strategy is relevant against the excessive generation of waste [1]. In 2019, FAO estimated that 14% of the post-harvest food is lost before reaching the consumer, and in 2015, the contribution of large food groups to food waste and loss was analyzed, where the legume and cereal industry accounted for approximately 50% [2].
Soybean (Glycine max) is widely grown worldwide and is one of the most valued seed crops from which edible oil is obtained [3]. During oil extraction, the seeds provide 20% of oil, whereas 80% of soybean cake (meal) is generated as a by-product that is then heat-treated and milled to produce the co-product, soybean flour [4,5], which has been used as a protein source since it contains around 50% protein [6]. According to North Carolina Soybean Producers Association (2021), 97% of the soybean meal is marketed for livestock feeds, and just 3% is processed for human consumption [5].
The application of soybean flour in the food industry may be important since this co-product is used to fortify different foods like soup, cookies, snacks, bread, powdered drink, and hamburger patties, among others [7,8,9,10,11,12]. On the other hand, soy protein isolate (SPI) is the soy extract with the highest protein content; it is prepared by removing most of the non-protein components and must contain at least 90% protein content, according to the American Association of Official Food controls [13]. Therefore, soybean protein isolate (SPI) may be considered a valorized product because of its applications in drug delivery systems, packaging food, antimicrobial food coatings, tissue engineering, food formulation and fortification (the most used), and other innovative applications [14,15,16,17,18,19].
The functional properties of a protein provide information about its behavior in food systems, and they can be classified into three groups according to the type of interactions: protein–water (solubility, water absorption, viscosity, and others); protein–protein (coagulation, precipitation, and others), and protein–interface (emulsifying, foaming capacity and others) interactions. The applications of SPIs in the food industry depend on these properties [20,21].
The most common protein extraction methods are alkaline, acidic, enzyme-aided, and NaCl-aided methods, and recently, basic or acidic electro activation (NaCl electrolysis) [22,23,24,25,26]. Nevertheless, the traditional and most efficient extraction process is alkaline because it gives a protein yield of ~70% when virgin raw material is used [24].
The extraction of soy protein from soy flour through alkaline-mediated treatment is one of the simplest, fastest, cheapest, and easily adaptable methods to obtain SPI. In this process, the pH of the solvent (generally water) is adjusted to 8.0–12.0, and alkaline solution liberates and solubilizes proteins by breaking down the plant matrix, in which protein exists. First, the insoluble plant residues are separated by centrifugation, and then solubilized proteins are precipitated by adjusting the pH to 4–5, followed by a second centrifugation step [27].
Alkaline pH induces changes in the secondary, tertiary, and quaternary structure of the proteins and exposes their sulfhydryl groups, making them more soluble. At this condition, protein polymerization may appear due to an increase in the reactivity of some amino acid residues. Moreover, due to strong alkaline pH, Maillard reactions and protein hydrolysis may occur. All these reactions change the functional properties of the proteins, which are more susceptible when combining alkaline with other physical and chemical treatments [28]. Other alkaline sources have gained a scope over the last years, but none have used by-products of another industry, such as the chemical industry.
During the COVID-19 pandemic, hypochlorous acid (HOCl) may be considered a sustainable and environment-friendly alternative to polluting disinfectants, such as quaternary ammonium salts [29,30], or as a safe alternative to flammable and irritant alcohol-based antiseptics since this compound is an endogenous substance in all mammals [31]. HOCl can be generated by the electrolysis (also called electro activation technology) process of sodium chloride (NaCl) solution in which the electric current produces sodium and chlorine, and the presence of a cathode and anode favor the production of HOCl and sodium hydroxide (NaOH) as a by-product [32].
NaOH solutions produced by electrolysis are an emerging technology for protein extraction applied to soy protein extraction [22,23]. Nevertheless, there are no reports on the use of alkaline solutions by-products generated during the production process of HOCl disinfectant/antiseptic for the obtention of SPI and the optimization of this process, thus forming an industrial symbiosis between NaOH from HOCl production and soybean flour from soybean oil production.
The response surface methodology (RSM) is a collection of mathematical and statistical techniques for designing experiments, building models, evaluating the effects of factors, and searching optimum conditions of factors for desirable responses. The Box–Behnken design is one of the most common designs of RSM that has been applied in the optimization of the chemical and physical process because of its reasoning design and excellent outcomes [33].
This research aimed to obtain SPI from by-products of the food and the chemical industries to create an industrial symbiosis. A Box–Behnken design was employed to optimize process parameters (temperature, alkaline solution, and time) in soy protein extraction from soybean flour, and the evaluation of functional properties (urease activity, water solubility and absorption, emulsifying capacity, and stability, as well as foam activity, stability, and density) and structural characterization of the SPI (secondary structure and electrophoretic profile) were carried out.

2. Materials and Methods

2.1. Industrial Co- and By-Products

A defatted commercial soybean flour, generated by the oil extraction industry, was purchased from the Mexican company Procesadora de Ingredientes S.A, and a commercial SPI was bought from FIQA (Monterrey, Mexico). On the other hand, alkaline solutions by-products generated by electrolysis of NaCl when producing HOCl-based sanitizer at 100, 200, and 500 ppm were kindly donated by the Mexican company Bioproductos Laguneros S.A. de C.V.

2.2. Approximate Characterization of Soybean Flour

Crude protein, ash, moisture, and crude fiber contents were determined according to the micro-Kjeldahl method 978.02, gravimetric incineration method 923.03, gravimetric method 925.10, and gravimetric method 962.09 of the AOAC Official Methods of Analysis [34], respectively.
Briefly, for protein determination, 0.1 g of the defatted sample was digested until a crystalline green color was obtained. The sample was distilled in the micro-Kjeldahl equipment and finally titrated with 0.02 ± 0.02% N-valorized HCl solution until a crystalline purple color was obtained. For ash content, 3–5 g of the sample was placed in a muffle furnace at 550 ± 3 °C until complete calcination. Moisture was calculated by dehydrating 5 g of the sample at 100 °C for 24 h. Crude fiber was determined by sequential treatment of 1–2 g of the defatted sample with 1.25% H2SO4 and 1.25% NaOH under boiling conditions.
Fat was determined by the Goldfish gravimetric method 30–20.10 of AACC International (2000) [35]. Briefly, the fat of 1–5 g of dehydrated sample was extracted with petroleum ether in a Goldfisch fat extractor (Labconco, Kansas City, MO, USA) for 6 h. All the assays were carried out in triplicate.

2.3. Alkaline Solutions By-Product Characterization

NaOH concentration of the three alkaline solutions was determined according to Gerliani et al. (2020) with slight modifications [23]. First, a 10 mL sample was placed in a beaker with five drops of phenolphthalein and titrated with 0.02 ± 0.02% N-valorized HCl solution (Desarrollo de Especialidades Químicas S.A. de C.V.). The color change, from pink to transparent, indicated completion of the titration, and the NaOH concentration was calculated using Equation (1).
NaOH   concentration   N = HCl V 2 V 1  
where [HCl] is the HCl concentration (N), V2 is the volume (mL) of HCl that was used for titration, and V1 is the volume (mL) of the sample. The pH of the samples was measured in a HI 2550 potentiometer (Hanna Instruments, Romania). All the determinations were carried out in triplicate.

2.4. Protein Extraction

Soybean flour and alkaline solution were mixed in a relation of 1:20 (w/v), and the suspension was constantly mixed (150 rpm) at different temperatures and different periods in an SSI2 incubator (Sheldon Manufacturing, Cornelius, OR, USA) according to the experimental design. First, the mixture was centrifuged for 15 min, at 15 °C, 12,964× g (10,000 rpm) in a 5804 R centrifuge (Eppendorf, Hamburg, HH, Germany). Then, the pellet was discarded, and the supernatant was adjusted to pH 4.5 using a solution of 7.5% HCl and centrifuged, as mentioned before. Next, the pellet was dried at 60 °C for 24 h, weighted, and the protein content was determined by the micro-Kjeldahl method. Finally, for the optimized extraction, the mixture was centrifuged for 25 min, at 15 °C, 7827× g (4700 rpm) in an SL 40R centrifuge (ThermoFisher Scientific, Langenselbold, HE, Germany), and proteins were freeze-dried for 48 h for further analysis.
The protein yield was calculated according to Equation (2):
%   Protein   yield   = 100 g   of   extracted   proteins g   of   proteins   in   soybean   flour   sample  

2.5. Experimental Design and Statistical Analysis

An RSM Box–Behnken design with three factors at three levels was used to optimize protein extraction from soy flour. Temperature, time, and three alkaline solutions (generated when producing 100, 200, and 500 ppm HOCl solutions, respectively) were the independent factors selected for optimization, while soy flour was a constant parameter. A total of 15 experiments in triplicate were conducted, and the averages of the protein extraction percentage were recorded as the response (protein yield). Table 1 shows the coded and uncoded levels of the independent variables used in this study.
Minitab software version 2020 (Minitab Inc., Chicago, IL, USA) was employed for the analysis of variance (ANOVA) at a confidence level of 95% (p < 0.05) and for the regression and graphical analysis of the experimental data, which were fitted using Equation (3) (a second-order polynomial equation):
Y   =   β 0 + β 1 x 1 + β 2 x 2 + β 3 x 3 + B 12 x 1 x 2 + β 13 x 1 x 3 + β 23 x 2 x 3 + β 11 x 1 2 + β 22 x 2 2 + β 33 x 3 2
where Y is the predicted response and β0 is the model constant; x1, x2, and x3 are the independent variables; β1, β2, and β3 are the linear coefficients; β12, β13, and β23 are the cross-product coefficients; β11, β22, and β33 are the quadratic coefficients. The coefficient of determination R2 was used to express the quality of fit of the polynomial model equation.

2.6. Gel Electrophoresis

A freeze-dried sample of SPI was analyzed by gel electrophoresis (SDS-PAGE) according to Laemmli (1970) with some modifications and compared with a commercial SPI and a molecular weight ladder (Precision Plus ProteinTM All Blue Prestained Standards, Biorad, USA) [36]. A total of 25 µg was mixed with 2x Laemmli sample buffer, heated for 5 min, and loaded in the sample well. Electrophoresis was conducted in a Mini-PROTEAN Tetra Cell (Bio-rad, Hercules, CA, USA) on 15% polyacrylamide Tris-SDS gel with Tris-SDS running buffer (3 g/L Tris, 14.41 g/L glycine, and 1 g/L SDS) at 200 V until the dye front reached the bottom of the gel. The gel was stained for 1 h with 0.1% (w/v) Coomassie Blue G-250, and destained using 45% (v/v) ethanol, 10% (v/v) acetic acid, and 45% water. All chemical reagents were from Bio-Rad, Hercules, CA, USA.

2.7. Fourier-Transform Infrared Spectroscopy (FTIR) Analysis

A freeze-dried sample of SPI, a commercial SPI sample, and a soybean flour sample were analyzed in ATR-FTIR equipment (Perkin Elmer, Spectrum 1, Waltham, MA, USA). The samples were scanned from 650 to 4000 cm-1 at a resolution of 4 cm−1, and the amide I band (1600–1700 cm−1) was evaluated with Spectrum software (v. 5.3.0). The amide I quantification of secondary structures was made according to Long et al. (2015) and Zhao et al. (2008) [37,38].

2.8. Functional Properties

The water absorption (WAI) and water solubility (WSI) indices were determined according to Soria-Hernández et al. (2015); 1 g of SPI was added to 15 mL of distilled water and homogenized, then it was left to rest for 30 min, and after that, it was centrifuged, decanted, and finally dried for WAI and WSI determination [39]. Urease activity (UA) was calculated as a change in pH according to method Ba 9-58, adding 0.2 g of SPI with 10 mL of urea solution, it was incubated at 30°C for 30 min, and pH of the test and blank sample was measured to determine UA [40]. Foam activity (FA), foam stability (FS), foam density (FD), and emulsion stability were evaluated according to Haque and Kito (1983); a solution with 3% content of protein was prepared, then 75 mL of this solution was added to 75 mL of distilled water, this solution was stirred for 30 min, after that, it was whisked for 13 min for the determination of FA and FD, and finally, after 15 min, the FS was determined [41]. Emulsifying capacity (EC) and emulsion stability (ES) were determined according to Acosta-Domínguez et al. (2021) with slight modifications and Soria-Hernández et al. (2020), respectively; a solution with 7 g of SPI in 100 mL of distilled water was prepared, and 10 mL of this solution was homogenized with 10 mL of soybean oil for 2 min to determine EC and ES after 24 and 48 h [42,43]. Functional properties tests were done at pH 4.5 and 7. After the acid precipitation, the pH of the SPI was 4.5, and at this moment, the functional properties were tested, thus testing the functionality of the SPI in acidic conditions. To compare the functional characteristics at neutral pH, NaOH was added to obtain a pH of 7.

3. Results and Discussion

3.1. Characterization of the Industrial Co- and By-Products

The proximate composition of the commercial defatted soybean flour was very similar to the composition reported by Tian et al. (2018), only the fat content was very different, which may be due to differences in the oil extraction process or differences in sample processing (Table 2) [44]. Suryana et al. (2022) found that the method of drying had significant effect on the fat content of soybean flour [45]. The most significant component is the protein content when working with protein extraction processes. In this study, the protein content was 56.12%, which was comparable with the value of 53% reported by Tian et al. (2018) and the values of 53.6% to 54.58% reported by Lazo-Vélez et al. (2015) for four commercial soybean flours [6,44]. Further, Kumar et al. (2020) reported a protein content of 56.4% for soybean flour, which was almost the same amount for our sample [46]. This result showed that our soybean flour is rich in protein and can be valorized to produce protein isolates.
Because electrolysis of a NaCl solution produces a NaOH by-product solution, three were characterized to determine their efficacy in the alkaline soy protein extraction process. These solutions were generated when producing the sanitizer at concentrations of 100 ppm, 200 ppm, and 500 ppm HOCl and were coded as samples 1, 2, and 3, respectively (Table 3).
The concentration of the HOCl solution depends on the intensity of the electric current applied during the electrolysis process; higher intensity gives a higher HOCl concentration [31]. The NaOH concentration was higher in solutions obtained when sanitizer was produced at a higher HOCl concentration (Table 3). According to Faraday’s law, more Na+ ions are liberated to react with OH- ions at higher electric current intensities during the electrolysis process, and more NaOH molecules can be produced [31]. Our results are consistent with those reported by Gerliani et al. (2020), who observed an increase in NaOH concentration as they increased the intensity of the electric current during the electrolysis of NaCl solutions [23].
A higher concentration of NaOH meant a higher pH value, the three samples had a pH value greater than 12, and when combining with the soybean flour in a relation of 1:20 (w/v), the final pH was 8.73, 8.95, and 10.85 for alkaline solutions 1, 2, and 3, respectively. These pH values are considered adequate for the alkaline extraction of plant proteins [27].

3.2. Modeling

The RSM Box–Behnken design was used to evaluate temperature, time, and the three alkaline solutions’ by-products in the percentage protein yield after the extraction process. The experimental and predicted values and the entire experimental design are given in Table 4. The predicted values for the output parameter were calculated according to the regression model obtained (Equation (4)), where A is the temperature, B is the time, and C is the alkaline solution.
Yield   protein   = 42.40 + 1.264 A + 0.443 B + 17.83 C 0.002442 AB 0.2503 AC 0.0609 BC 0.00287 A 2 0.001002 B 2 + 1.648 C 2
The analysis of variance (ANOVA) showed that the regression model was statistically significant at a confidence level of 95% (p < 0.05) with a value of 0.9315 for the determination coefficient, indicating that 93.15% of the variability in protein yield could be predicted by Equation (4). Further, the interactions between independent variables were very strong and were also statistically significant (p < 0.05) (Table 5).
The experimental and predicted values were plotted in Figure 1 and were very close. The plot displayed an R2 = 0.9535, similar to that presented in Table 5 for the ANOVA. This analysis indicated that the effect of the process variables on the alkaline extraction process of soy protein is well represented by Equation (4), which can be used to study factors’ interactions and optimize the response variable.

3.3. Effect of Factors and Interactions

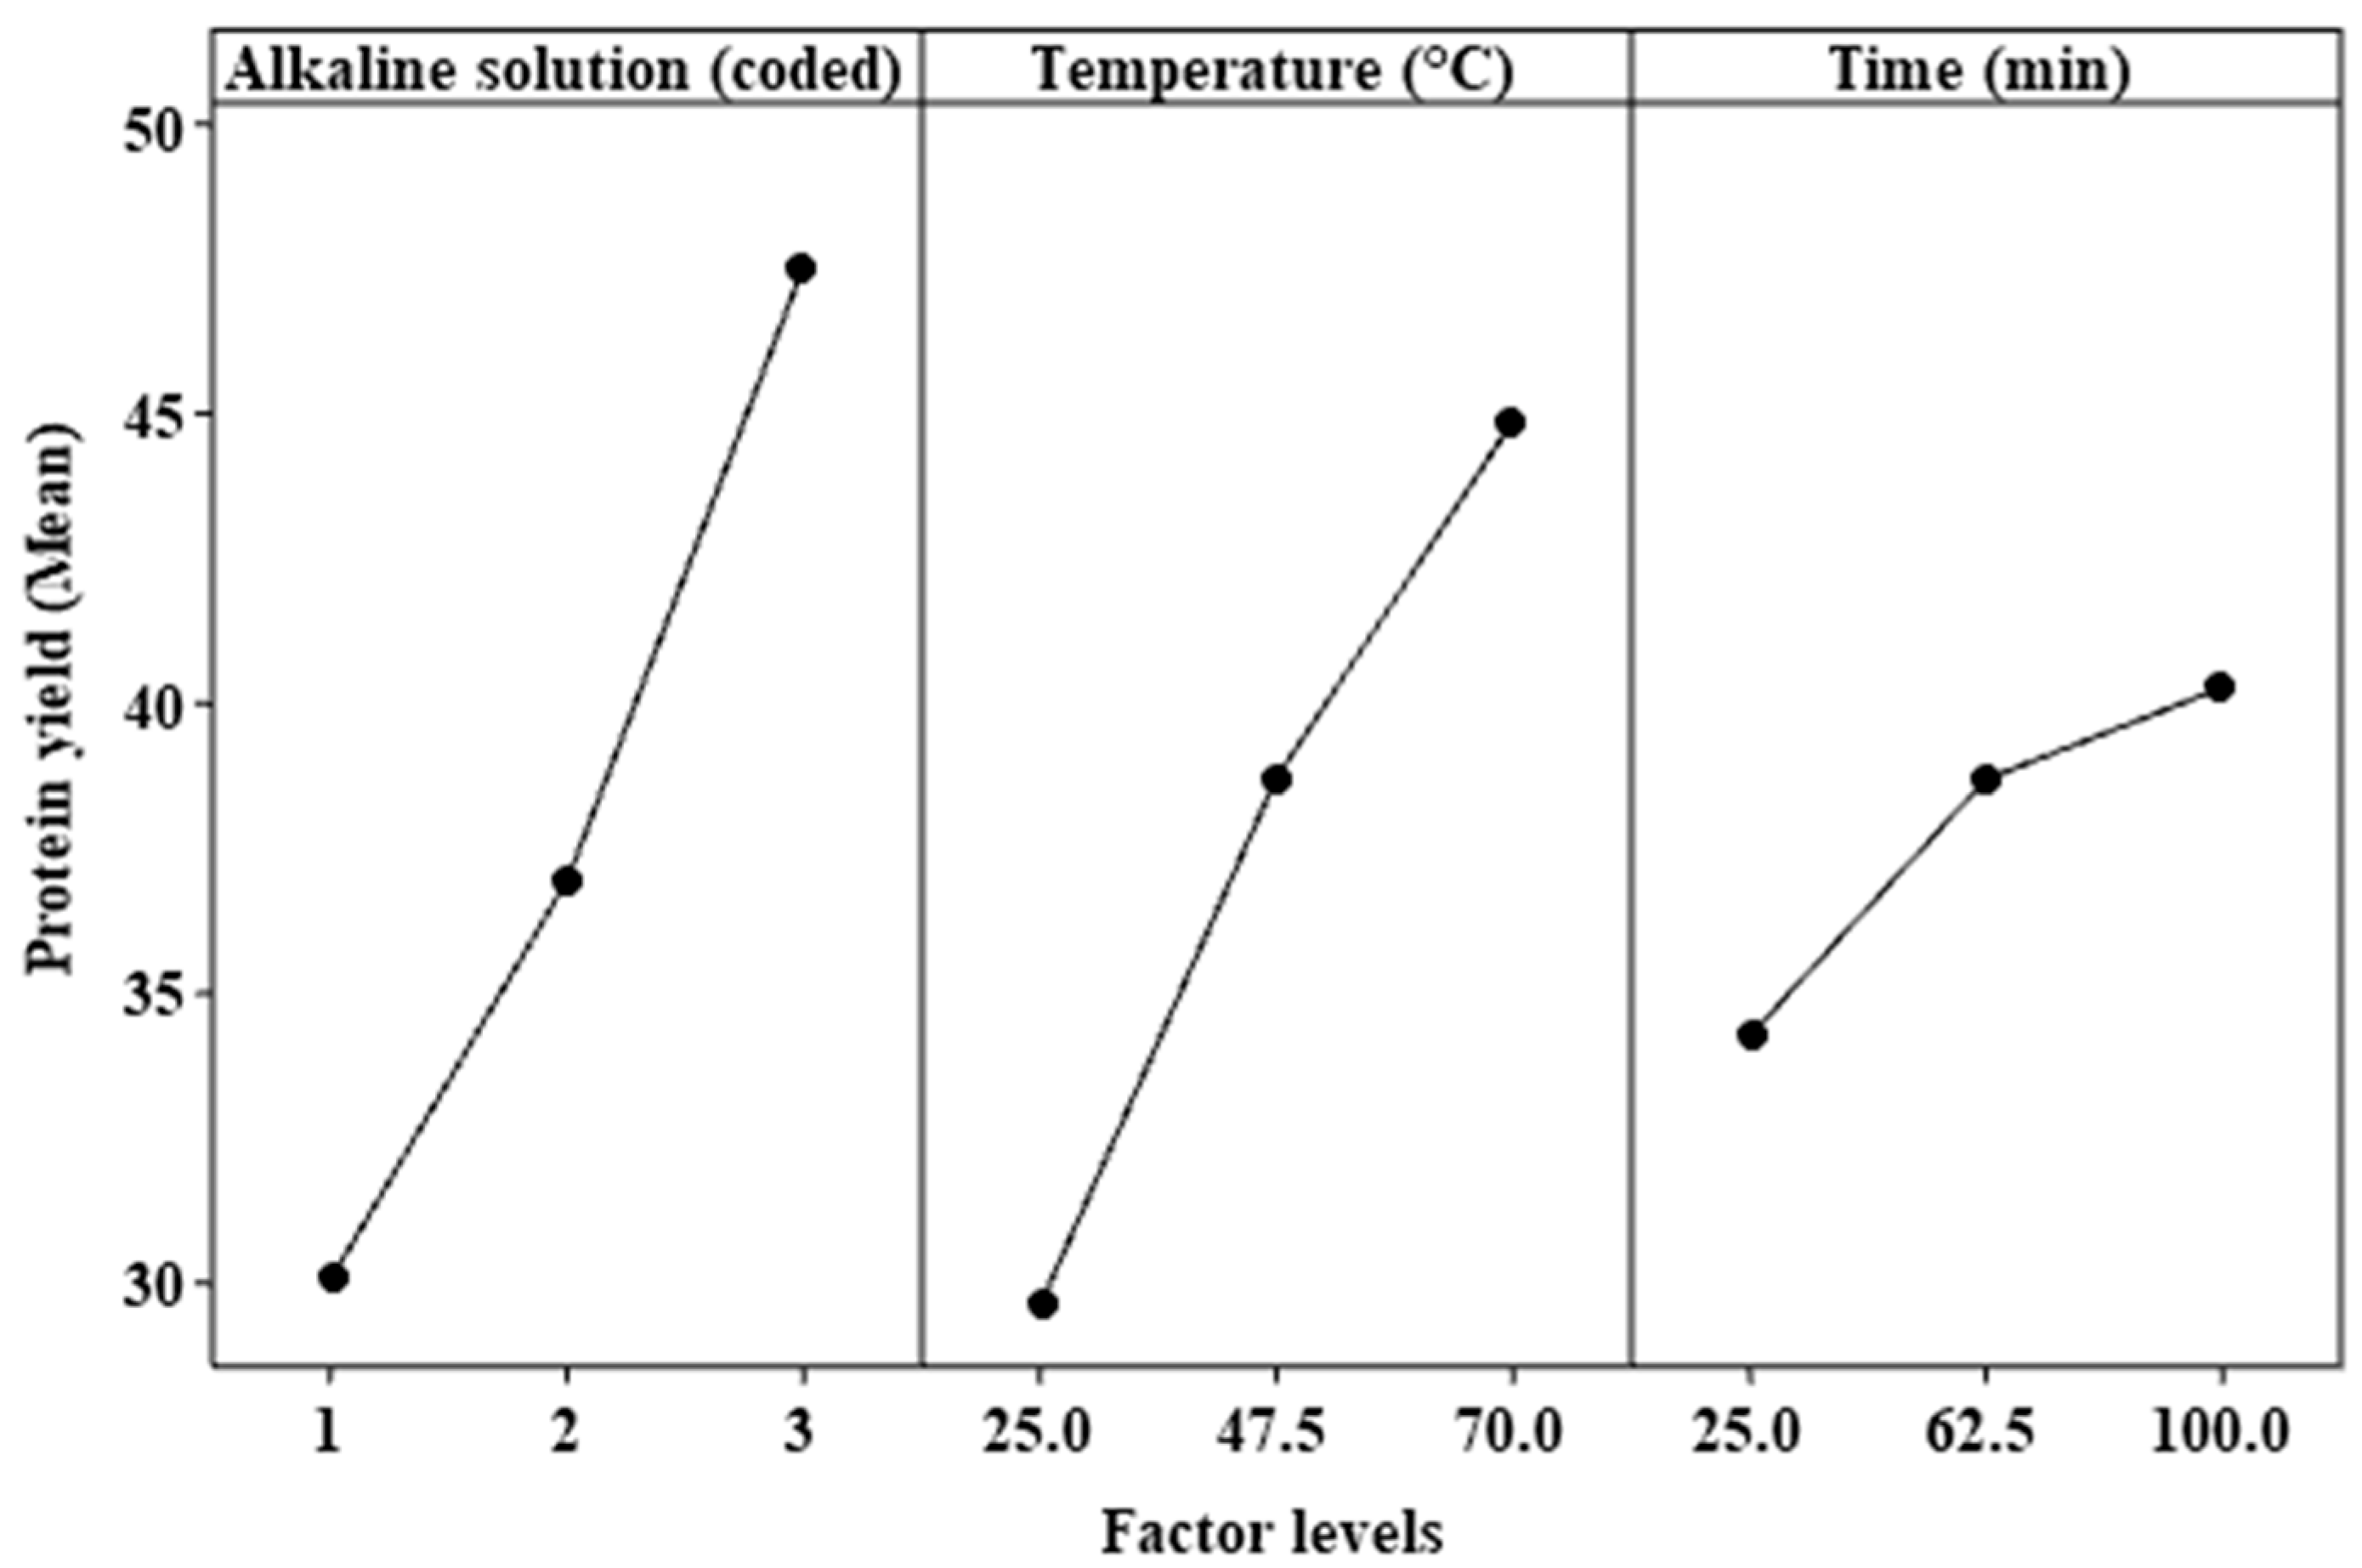
The effect of the independent variables on protein yield is represented in Figure 2. The three factors had a positive effect on the response when they were increased. However, for the case of temperature and time, an inflection point was observed from 47.5 °C and 62.5 min, respectively, which may represent a decrease in the effect of these factors. On the other hand, this inflection point was not observed in the alkaline solution variable. Alkaline protein extraction from plant material is a widely studied process, and it is known that when combining higher values of pH, temperature, and time, the cell wall is disrupted, and proteins are liberated and solubilized [27,47].
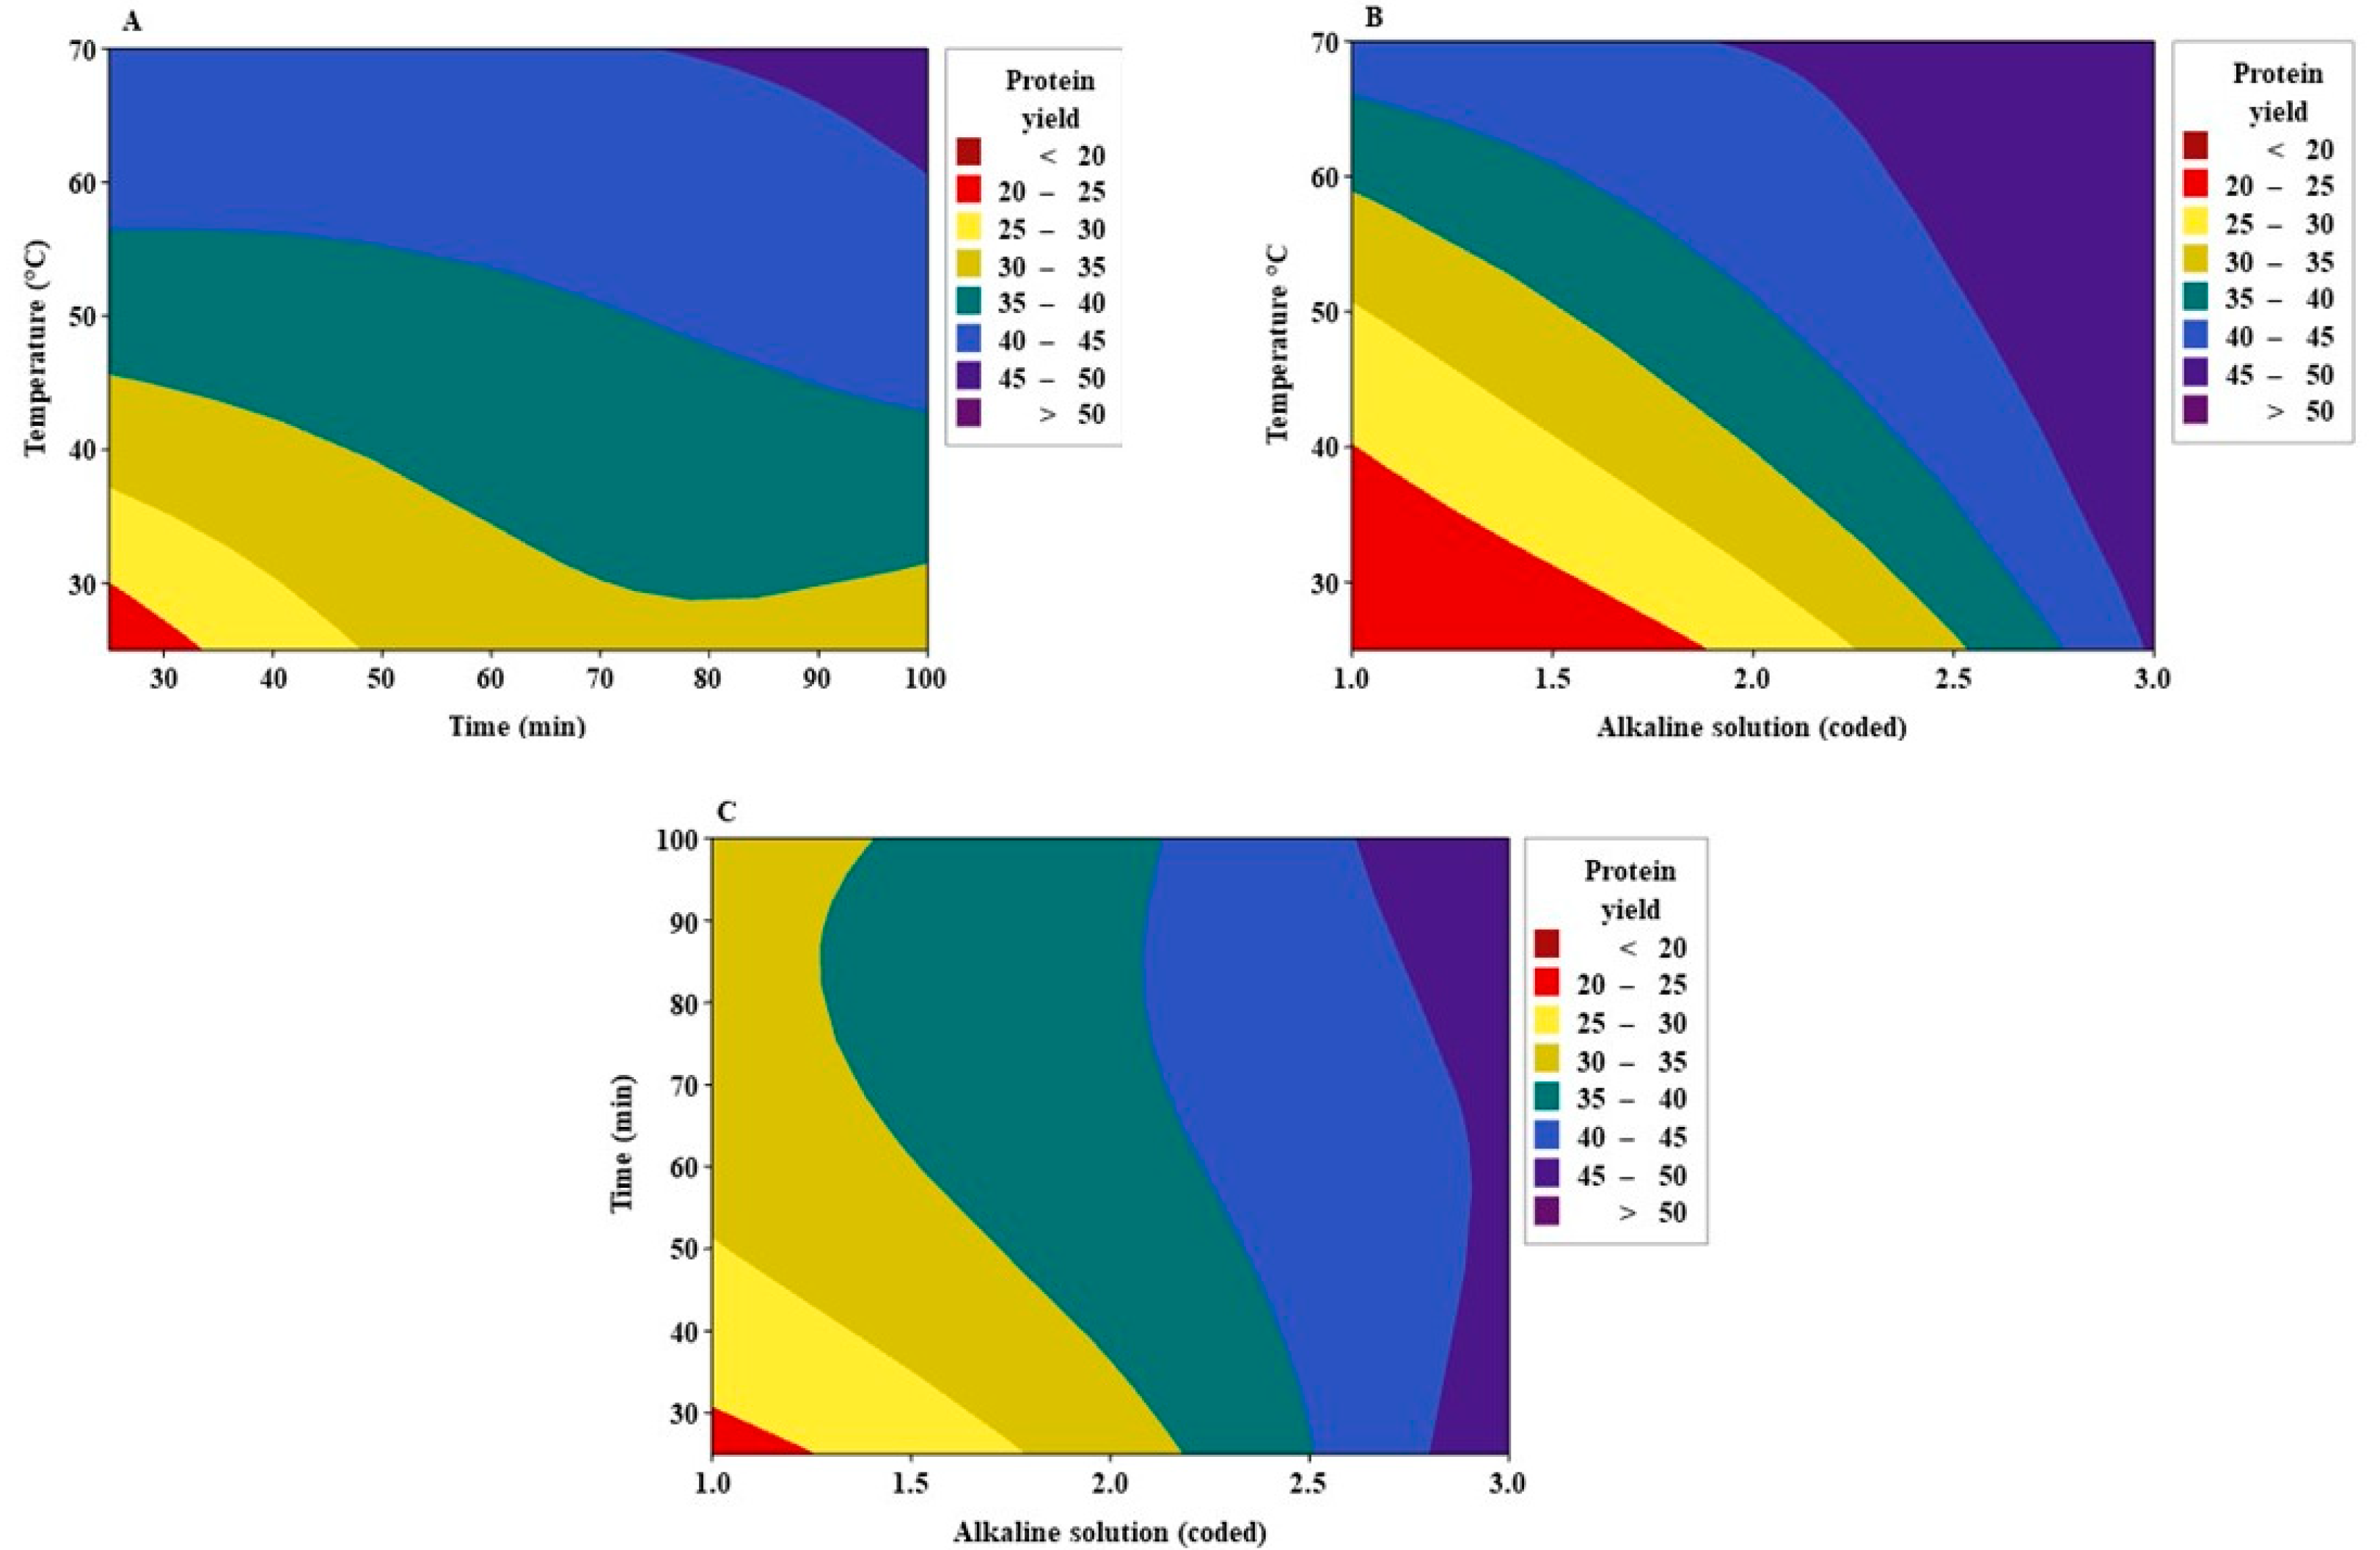
The interactions between factors are visualized in the contour plots (Figure 3). At 30 °C with a time of 50 min, protein yield was the maximum (30–35%), and this value was the same for up to the maximum level of time. A temperature of 50 °C represented a significant increase of yield protein in just 25 min. At 60 °C, protein yield was 40–45% with no change with the time, while in the case of 70 °C, it seems that 45–50% of the response can be reached from 80 min (Figure 3A).
As mentioned before, the values of the alkaline solution were coded as 1, 2, and 3, with pH values of 12.10, 12.29, and 12.68, respectively (Table 3). For every temperature, the response increased consistently when increasing pH value and vice versa. The pH strongly influenced protein extraction, even at a temperature as low as 30 °C with a pH value of 12.68, the response was 45–50% (Figure 3B). In the case of the time and alkaline solution interaction, the protein yield improved for all the times when increasing the pH value. It was observed that, at a pH of 12.68, a maximum response was achieved regardless of time level (Figure 3C).
Gerliani et al. (2020) carried out alkaline dry matter extraction from commercial soybean flour using NaOH solutions at different pH values generated by the electrolysis of NaCl solutions [23]. Higher extraction yields of dry matter were found at higher pH values. The highest protein content in the extract was 45.55%, obtained from a NaOH solution with a pH value of 12.75.
In the present study, suspensions of alkaline solutions with soybean flour (relation 1:20) had pH values from 8.73 to 10.85. These values were in the range of or above 8.0 to 8.5, as mentioned by Preece et al. (2017) for soy protein extraction, who also mentioned that higher pH values increase protein extraction due to an improvement in protein solubility [4]. Furthermore, increasing the temperature promotes breaking the carbohydrate–protein complex, leading to improved protein extraction. On the other hand, it has been reported that protein extraction is improved with time, but after a certain period, the protein extraction is plateaued [4].

3.4. Optimization

The optimization was carried out to achieve the maximum protein yield according to the mathematical model. The optimal levels for temperature, alkaline solution, and time are given in Table 6. An additional experiment was conducted to validate the model, a protein yield of 48.30% was achieved with 70 °C, 44.7 min, and pH 12.68. This result was higher than that reported by Gerzhova et al. (2015), who obtained a maximum protein extractability of 33.82% for defatted canola flour using alkaline solutions generated by electrolysis [22]. Furthermore, our result was slightly higher than that of 47.0% obtained by Perović et al. (2020) when optimizing soy protein extraction by using enzyme treatment for 1 h and alkaline extraction for 2 h [46]. Even though the protein yield was not higher than traditional alkaline extraction reports (~70%) [24], a ~50% of protein yield using by-products is significant, and the use of this industrial waste that is generally discarded may be scalable and form an industrial symbiosis.
The mathematical model we obtained is valid since the response was within the confidence interval of 46.66–52.93 (Table 6), and it is important to highlight that the protein content in the SPI obtained was 91.85 ± 0.30%, which matched the protein content for commercial products [48,49].

3.5. Molecular Weight (MW) of SPI

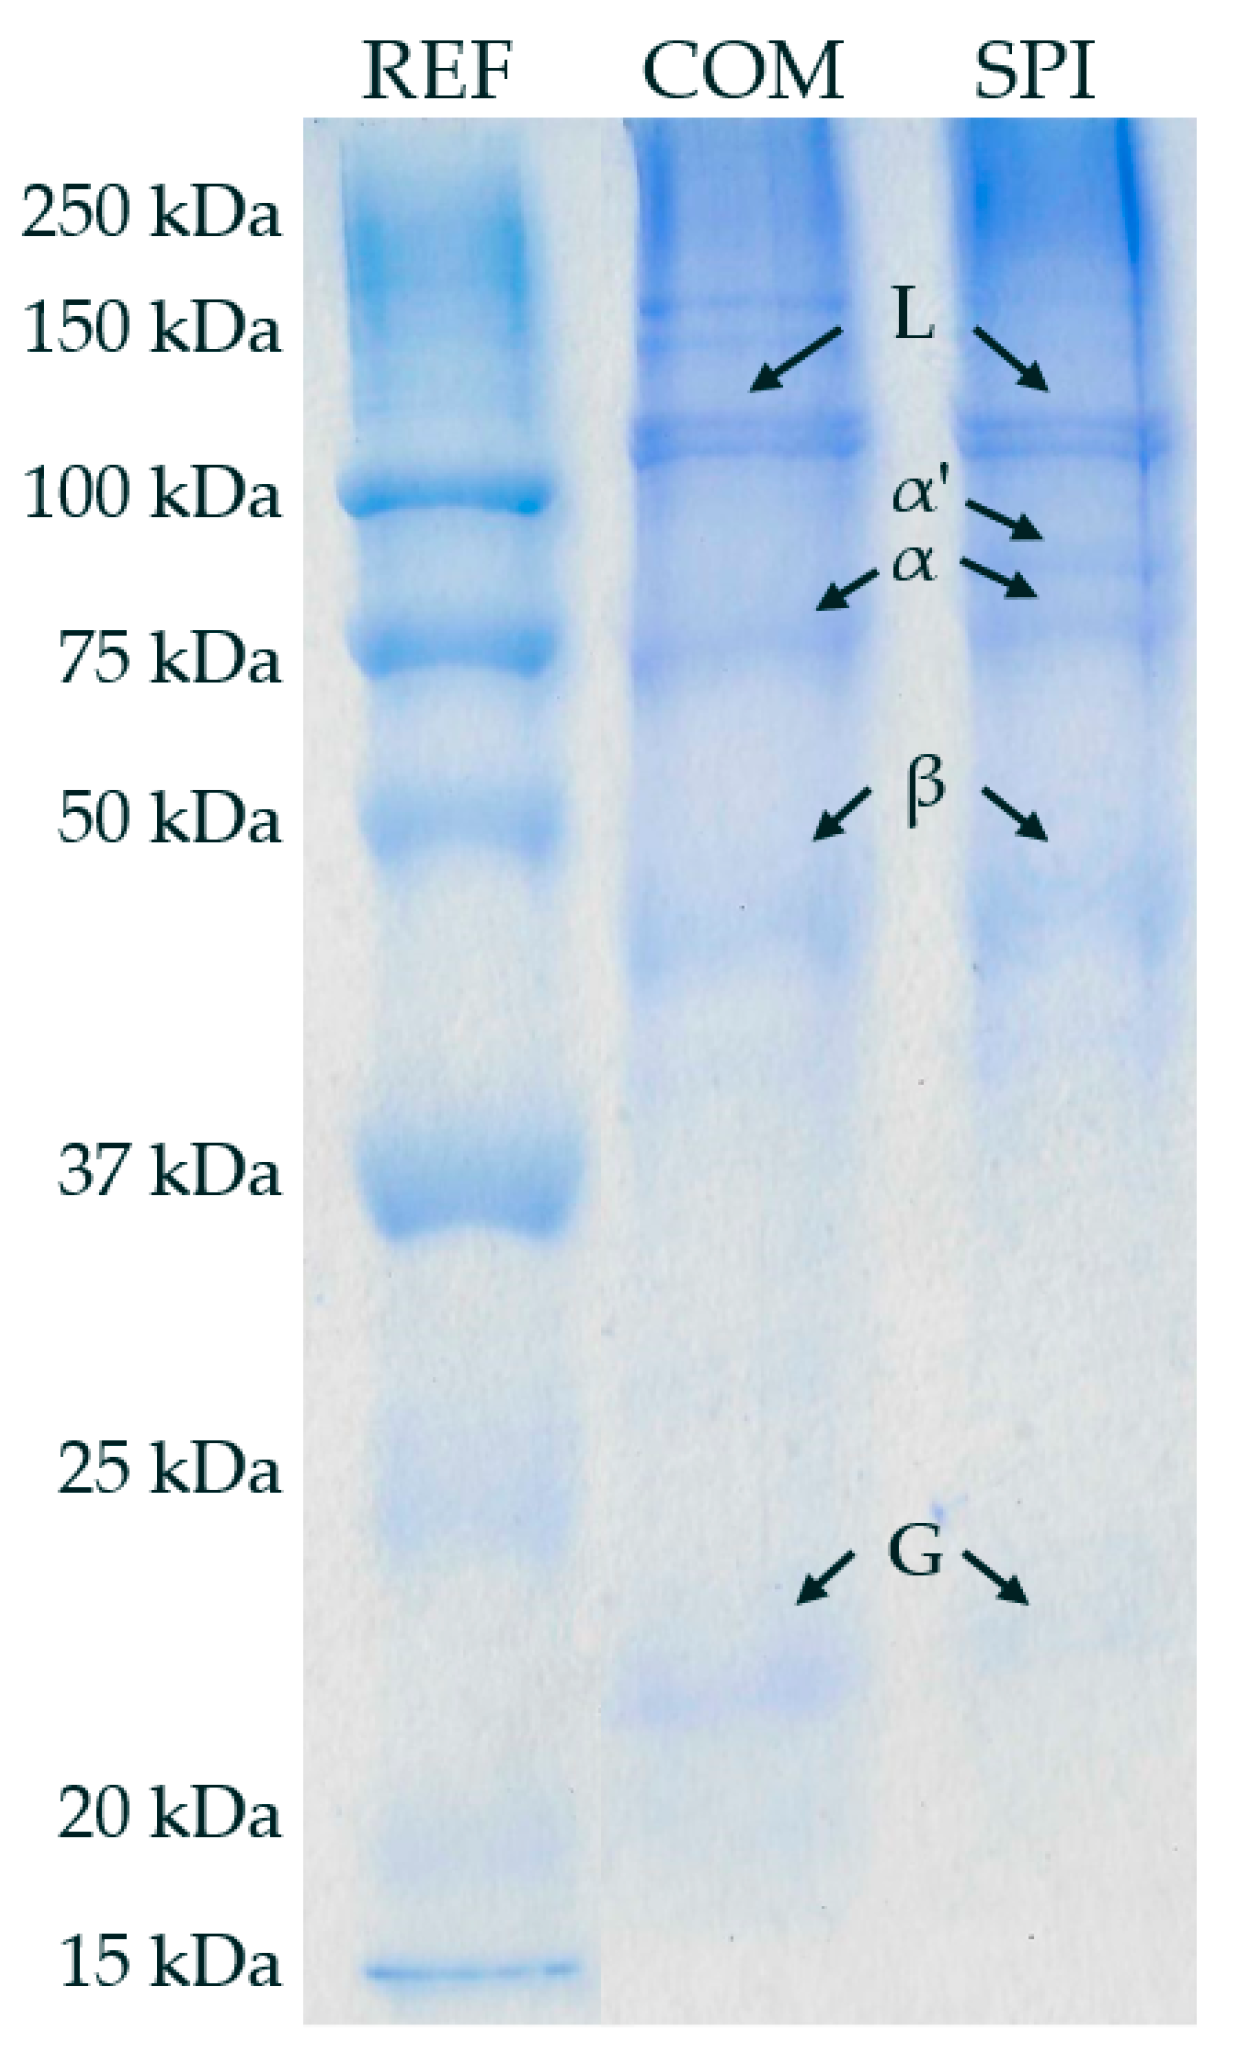
SDS-PAGE analysis of SPI and commercial SPI (COM) is shown in Figure 4. Both samples exhibited a similar electrophoretic profile, showing bands with molecular weight ranging from ~110 to ~23 kDa. Soy proteins mainly consist of albumins and globulins, and ~90% correspond to fractions 7S (β-conglycinin) and 11S (glycinin), which are globulins. Fraction 7S contains the subunits α’, α, and β with a MW of 72, 68, and 52 kDa, respectively, while fraction 11S contains two subunits with a MW of 35 and 20 kDa [50].
The bands in SPI and COM with a MW of ~72 KDa, and ~52 KDa corresponded to α’ and β subunits of fraction 7S, respectively. The subunit α’ was observed just in SPI. Yang et al. (2016) reported that there might be a loss of α′, α, and β-7S subunits by enzymatic hydrolysis of soybean proteins and complete disappearance of these bands after 3 h of digestion, which can explain the loss of the α′ subunit in the commercial sample [51]. Furthermore, a band of ~23 kDa was present in both samples that revealed the presence of glycinin (Figure 4).

3.6. Structural Analysis by ATR-FTIR

The structural conformation of proteins affects the digestibility and functional properties of the SPI, thus playing a crucial role in the application of the isolate. FTIR spectroscopy determines the functional groups present in an organic sample and has been recently used to determine secondary structures in protein samples [52,53]. In addition, the number of β-conformations (β-sheet and β-turn) and α-helix determines the digestibility and degree of hydrolysis of the protein [51].
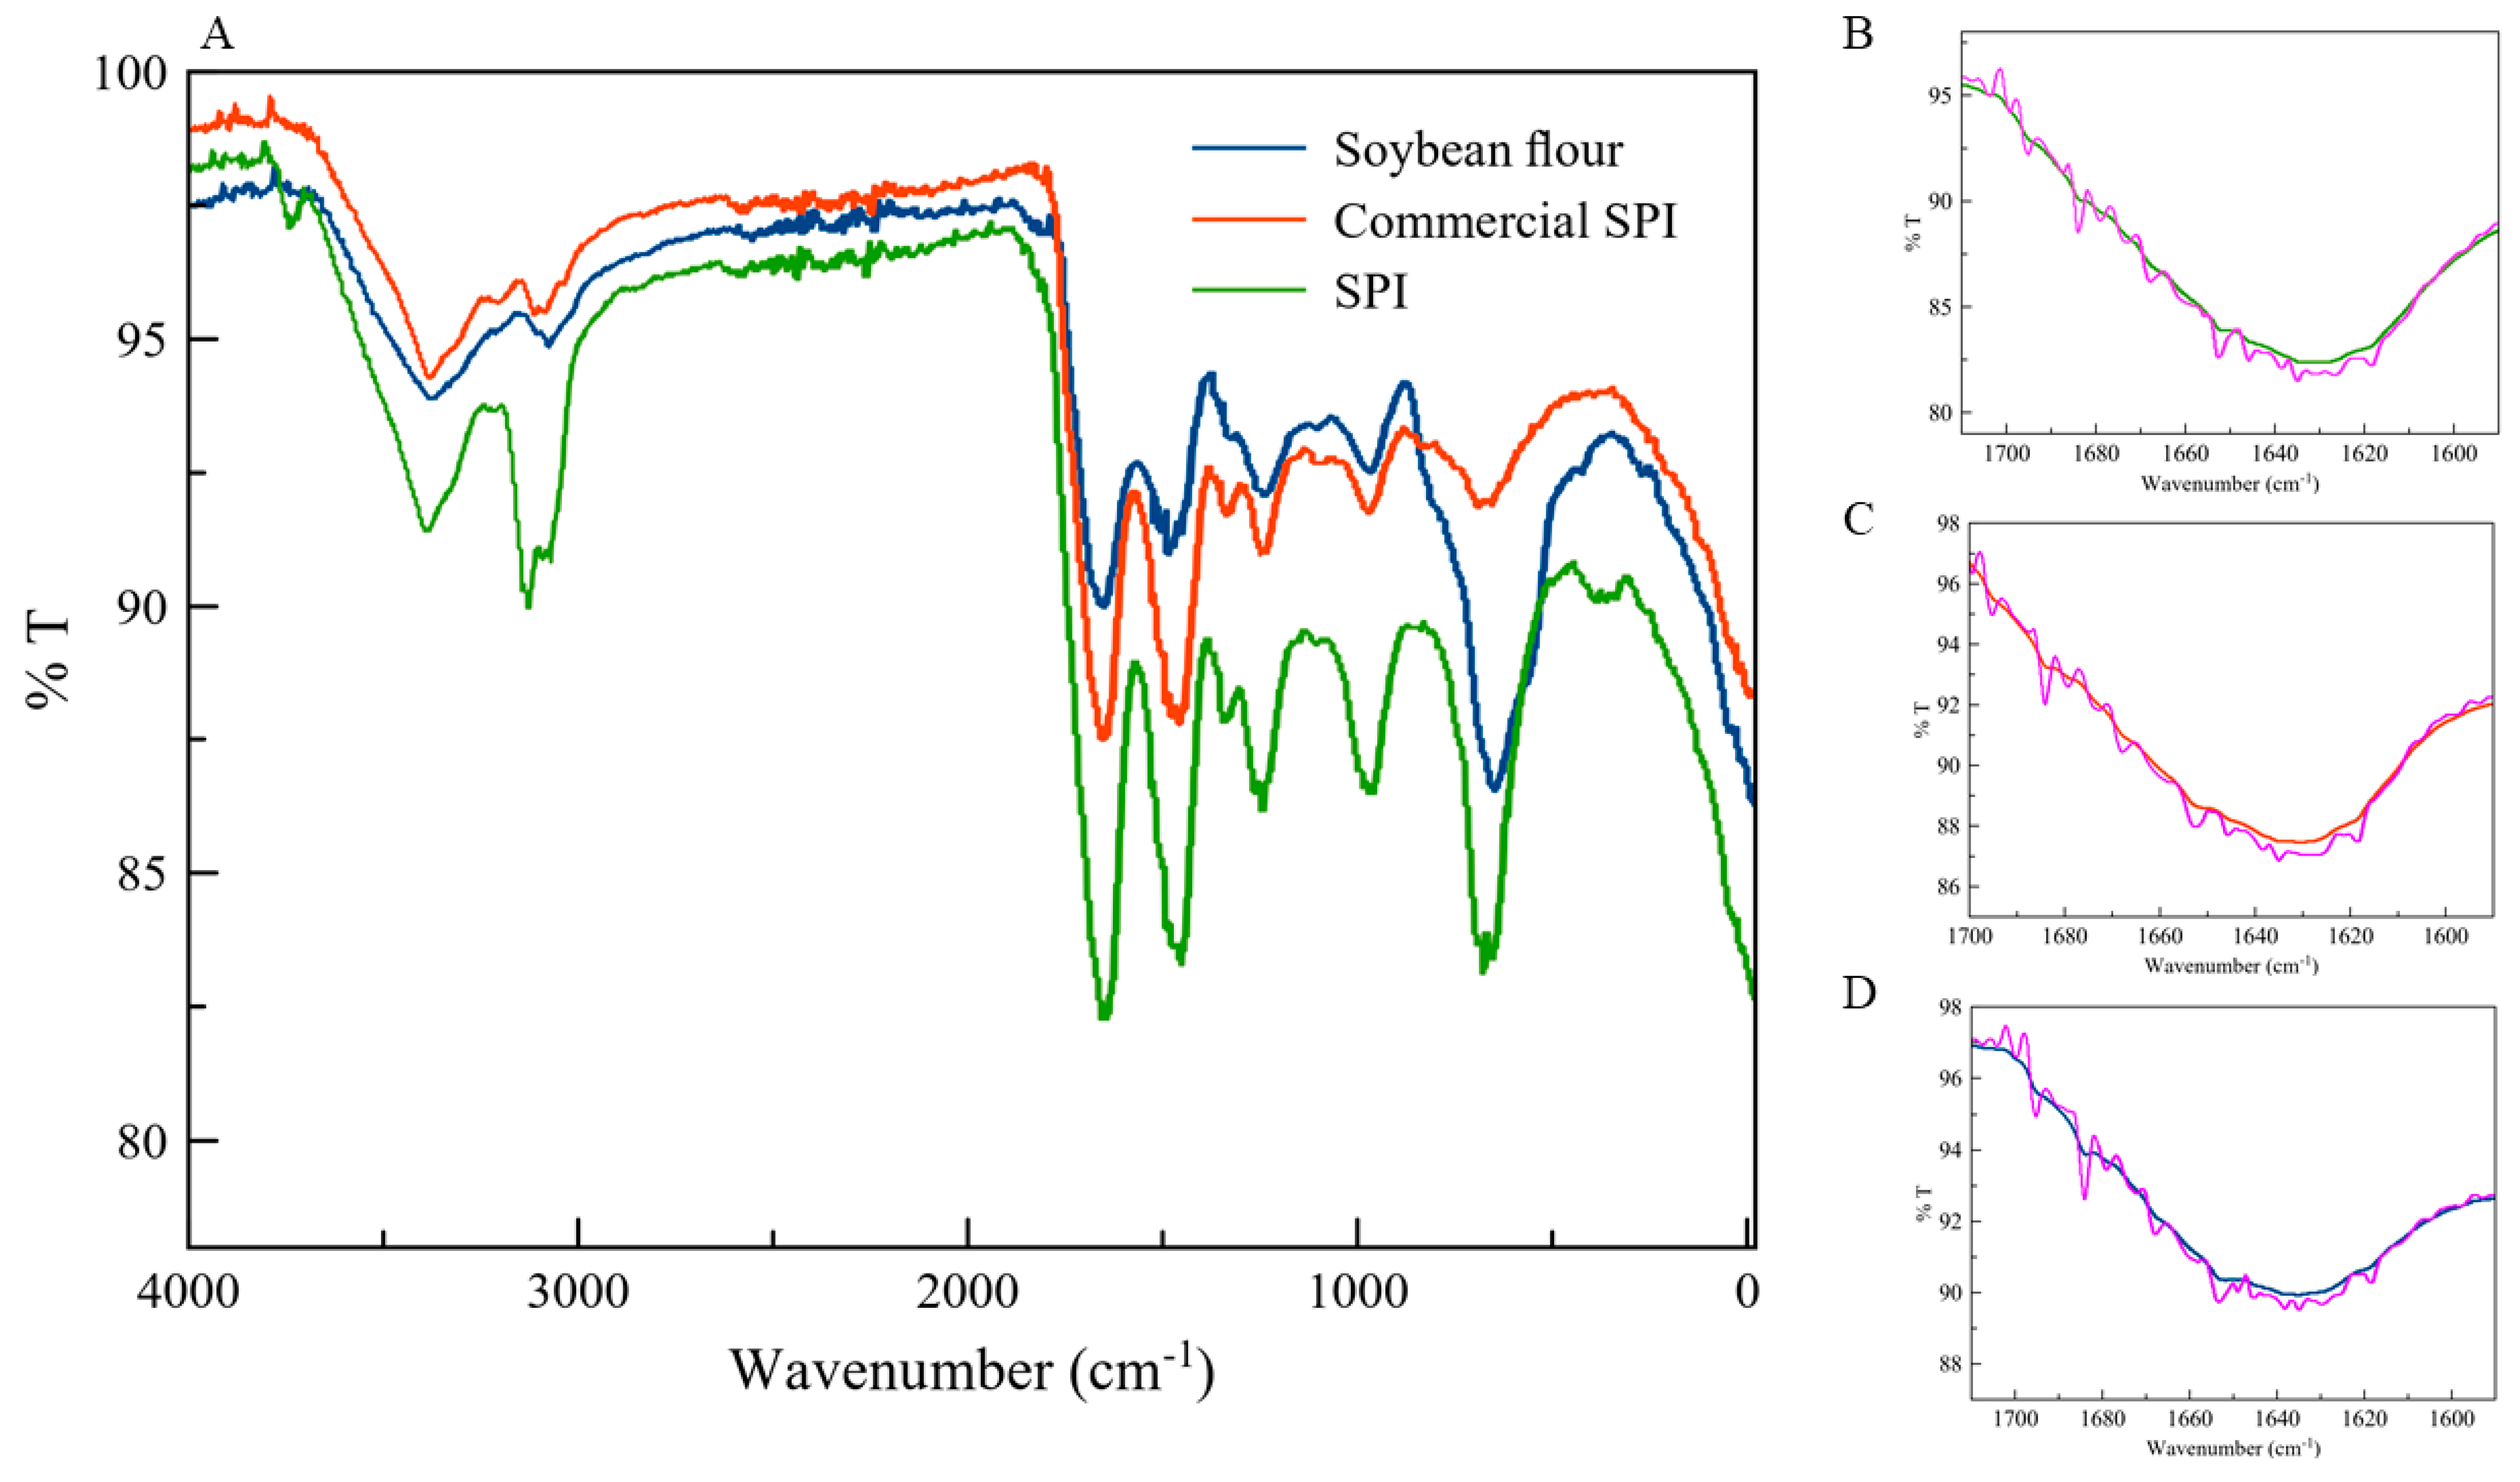
Figure 5A depicts the FTIR spectra of the soybean flour, commercial SPI, and obtained SPI. The three samples showed the characteristic spectra of soybean: at ~3400 cm−1, the -NH and -OH stretching’ amide I between 1700 and 1600 cm−1; and amide II between 1600 and 1500 cm−1 [37]. Figure 5B–D present the deconvolution of the amide I in the obtained SPI, commercial SPI, and soybean flour, respectively. Long et al. (2015) and Zhao et al. (2008) reported that the range of wavenumber (cm−1) within each secondary structure is present [37,38]. Then, knowing the number of peaks corresponding to β-conformations, α-helix, and random coil, the relative percentage was calculated.
The calculated percentages of secondary structures in the samples are reported in Table 7. This study shows that SPI samples have a higher ratio of β-conformations and α-helix (β:α ratio) than the soybean flour sample, which is consistent with de la Rosa-Millán et al. (2015), who found that a higher β-conformations number was correlated with more heat treatment on the sample [53]. Soybean flour results were comparable to Bai et al. (2016), who obtained a 26% higher β:α ratio that can be explained due to differences in soybean treatment [54]. Our SPI sample had the highest β:α ratio, followed by commercial SPI and soybean flour. Carbonaro et al. (2012) and Yang et al. (2016) found a negative correlation between β-conformations presence and digestibility. However, this decrease in digestibility is necessary to avoid antinutritional factors such as urease activity (UA), which will be discussed next [51,55].

3.7. Urease Activity (UA) and Functional Properties

Urease and trypsin inhibitor are the main unwanted components in soybean because they can cause hyperammonemia and pancreatitis, and low UA values have been correlated to lower values of trypsin inhibitor [56,57]. As trypsin inhibitor and urease are inactivated with high temperature or radiation, UA is a measure of the heat treatment that the sample has undergone; it is known that a UA value around 0.3 indicates that the product has had enough heat treatment to inactivate trypsin inhibitor and urease [39]. Table 8 shows the UA value of the obtained SPI of 0.06, comparable to Soria-Hernández et al. (2020), who found a 0.04 UA value, and was better than the one obtained from the commercial SPI (0.12 UA value) [43]. Therefore, it can be said that the obtained SPI has marginal antinutritional factor activity and has a better value than a commercially available product, thus proving the need for treatment with temperatures of above 60°C [53].
The functional characteristics determine the application a product has in the food industry, the main functional properties of SPI at pH 4.5, SPI at pH 7, and previously reported SPI can be seen in Table 8. Water solubility is the most important functional property because it will determine foam activity and emulsion capacity [39].
The WSI in SPI at pH 7 was 1196% and 146% higher than the WSI in SPI at pH 4.5 and reported SPI, respectively. Solubility at pH 4.5 is the lowest because it is near the isoelectric pH (IpH) of soybean proteins [58]. The obtained SPI was more soluble than the reported SPI due to the heat and basic treatment that hydrolyzed the protein, making it easily soluble in water. Soria-Hernández et al. (2015) reported values ranging from 20% to 95% of WSI, which indicates that the obtained value is between the expected range [39]. The WAI of SPI at pH 4.5 was less than half of the reported value because of the poor solubility of the SPI at IpH.
A two-phase interaction property is foam activity (FA), which is the ability of proteins to form a stable foam where a liquid layer stabilizes air droplets, and foam stability (FS), which is the capacity of a protein sample to maintain the air droplets stable for a certain amount of time. These properties are important to determine if the SPI is applicable in cakes, souffles, or whipped toppings [58]. FA of SPI at pH 4.5 was slightly higher than SPI at pH 7, and reported SPI had a significantly higher FA; these results are congruent to the report of Soria-Hernández et al. (2020), who discussed that a lower WSI had a higher FA, but as SPI at pH 4.5 had such low solubility, almost no protein was available to form the foam [43]. On the contrary, FD of SPI at pH 7 was twice the value of SPI at pH 4.5 due to the higher solubility and greater availability of proteins to form and stabilize the foam. Furthermore, FS increased more than half from SPI at pH 4.5 to SPI at pH 7 because of the better availability of proteins in the foam. Moreover, SPI at pH 7 results were comparable to reported SPI.
As foaming characteristics, emulsion capacity (EC) is also a two-phase interaction property, but with an oil–water interface interaction that is stabilized by the proteins, and emulsion stability (ES) is the ability of the proteins to stabilize the emulsion through time. To form stable emulsions, emulsifiers are needed. In this case, Zhu et al. (2018) discussed that mainly amino acids, such as L-arginine and L-lysine, because of their basicity, act as emulsifiers and accrue in the interface between water and oil to help soothe the emulsion by increasing the repulsion by electrostatic forces and diminishing the tension in the interface [59]. EC was slightly higher in SPI at pH 4.5 because proteins near their IpH have higher adsorption and viscoelasticity at an oil–water interface due to the increased surface hydrophobicity [58,60]. As proteins at IpH have better emulsifying properties, ES at 24 and 48 h was expected to be higher for the SPI at pH 4.5.

4. Conclusions

The co- and by-products of the food and chemical industries were validated to produce SPI, thus forming an industrial symbiosis. Furthermore, the optimization of the SPI extraction was carried out, and statistical analysis showed a good fit between experimental and calculated protein yield with a correlation of 0.95. Then, molecular weight (SDS-PAGE) and structural analysis (ATR-FTIR spectroscopy) showed that the obtained SPI was comparable to a commercial SPI sample. Furthermore, antinutritional factors were discarded because the UA value was 0.06, which meant that the SPI retained little to no urease activity, and this value was lower than the commercial’s SPI UA. Finally, the functional properties were determined; WSI was astounding for SPI at pH 7 and had a more comparable FA, FD, FS, and ES than previous SPI reports. Therefore, the SPI can be included in bakery products or protein shakes to increase the average protein consumption, especially in kids. With this research, the Zero Hunger and Sustainable Consumption and Production goals from the United Nations are closer to becoming a reality in Mexico.

Author Contributions

Conceptualization, C.C.-H. and L.R.-S.; Methodology, E.O. and L.R.-S.; Data curation, E.O. and L.R.-S.; Funding acquisition, C.C.-H.; Project administration, C.C.-H., L.M.M., and L.R.-S.; Writing—original draft preparation, E.O. and L.R.-S.; Writing—review and editing, C.C.-H., L.M.M., and L.R.-S. All authors contributed to this work and approved the submitted version. All authors have read and agreed to the published version of the manuscript.

Funding

This research received no external funding.

Institutional Review Board Statement

Not applicable.

Informed Consent Statement

Not applicable.

Data Availability Statement

The data presented in this study are available from the corresponding author on reasonable request.

Acknowledgments

The authors thank Consejo Nacional de Ciencia y Tecnología (CONACYT) for the scholarship 002823 and Tecnológico de Monterrey School of Engineering and Sciences for its support. We also thank Bertha Barba for her guidance with the FTIR spectroscopy analysis, Aidee Sanchez for her technical help and Centro del Agua para América Latina y el Caribe for its support.

Conflicts of Interest

The authors declare no conflict of interest.

References

  1. Song, B.; Yeo, Z.; Kohls, P.; Herrmann, C. Industrial symbiosis: Exploring big-data approach for waste stream discovery. Procedia CIRP 2017, 61, 353–358. [Google Scholar] [CrossRef]
  2. FAO. The State of Food and Agriculture 2019. Moving Forward on Food Loss and Waste Reduction; FAO: Rome, Italy, 2019; pp. 1–156. ISBN 9781315764788. [Google Scholar]
  3. Wijewardana, C.; Reddy, K.R.; Bellaloui, N. Soybean seed physiology, quality, and chemical composition under soil moisture stress. Food Chem. 2019, 278, 92–100. [Google Scholar] [CrossRef] [PubMed]
  4. Preece, K.E.; Hooshyar, N.; Zuidam, N.J. Whole soybean protein extraction processes: A review. Innov. Food Sci. Emerg. Technol. 2017, 43, 163–172. [Google Scholar] [CrossRef] [Green Version]
  5. North Carolina Soybean Producers Association. Uses of Soybeans. Available online: https://ncsoy.org/media-resources/uses-of-soybeans/ (accessed on 6 June 2021).
  6. Lazo-Vélez, M.A.; Chuck-Hernandez, C.; Serna-Saldívar, S.O. Evaluation of the functionality of five different soybean proteins in yeast-leavened pan breads. J. Cereal Sci. 2015, 64, 63–69. [Google Scholar] [CrossRef]
  7. Farzana, T.; Mohajan, S.; Saha, T.; Hossain, N.; Haque, Z. Formulation and nutritional evaluation of a healthy vegetable soup powder supplemented with soy flour, mushroom, and moringa leaf. Food Sci. Nutr. 2017, 5, 911–920. [Google Scholar] [CrossRef]
  8. Elisia, H.; De Barros, A.; Vinicius, C.; Natarelli, L.; Maria, I.; Tavares, D.C.; Valério, E.; Vilas, D.B.; Franco, M. Nutritional clustering of cookies developed with cocoa shell, soy, and green banana flours using exploratory methods. Food Bioproc. Technol. 2020, 13, 1566–1578. [Google Scholar]
  9. Riska, N. Formulating baked-roll cake by using a composite of wheat flour, soy flour, and vegetable flour (Carrot, Purple Yam, and Red Bean) as a healthy snack for children aged 5–6 years at kindergarten in Tangerang. Int. J. Multidiscip. Curr. Res. 2017, 5, 1087–1093. [Google Scholar]
  10. Azarbad, H.R.; Tehrani, M.M.; Rashidi, H. Optimization of gluten-free bread formulation using sorghum, rice, and millet flour by D-optimal mixture design approach. J. Agric. Sci. Technol. 2019, 21, 101–115. [Google Scholar]
  11. Farzana, T.; Mohajan, S.; Hossain, N.; Ahmed, M.M. Formulation of a protein and fibre enriched soy-mushroom health drink powder compared to locally available health drink powders. Mal. J. Nutr. 2017, 23, 129–138. [Google Scholar]
  12. Cho, H.; Jung, Y.; Auh, J.; Lee, D. Effects of jet-milled defatted soy flour on the physicochemical and sensorial properties of hamburger patties. Food Sci. Anim. Resour. 2017, 37, 840–846. [Google Scholar] [CrossRef]
  13. Berk, Z. Isolated soybean protein (ISP). In Technology of Production of Edible Flours and Protein Products from Soybeans; FAO Agricultural Services Bulletin No. 97: Rome, Italy, 1992. [Google Scholar]
  14. Wongkanya, R.; Chuysinuan, P.; Pengsuk, C.; Techasakul, S.; Lirdprapamongkol, K.; Svasti, J.; Nooeaid, P. Electrospinning of alginate / soy protein isolated nano fibers and their release characteristics for biomedical applications. J. Sci. Adv. Mater. Devices 2017, 2, 309–316. [Google Scholar] [CrossRef]
  15. Aydogdu, A.; Yildiz, E.; Ayhan, Z.; Aydogdu, Y.; Sumnu, G.; Sahin, S. Nanostructured poly (lactic acid)/soy protein/HPMC films by electrospinning for potential applications in food industry. Eur. Polym. J. 2019, 112, 477–486. [Google Scholar] [CrossRef]
  16. González-Estrada, R.R.; Chalier, P.; Ragazzo-Sánchez, J.A. Antimicrobial soy protein based coatings: Application to Persian lime (Citrus latifolia Tanaka) for protection and preservation. Postharvest Biol. Technol. 2017, 132, 138–144. [Google Scholar] [CrossRef]
  17. Tansaz, S.; Liverani, L.; Vester, L.; Boccaccini, A.R. Soy protein meets bioactive glass: Electrospun composite fibers for tissue engineering applications. Mater. Lett. 2017, 199, 143–146. [Google Scholar] [CrossRef]
  18. Thrane, M.; Paulsen, P.V.; Orcutt, M.W.; Krieger, T.M. Soy protein: Impacts, production, and applications. In Sustainable Protein Sources Advances for a Healthier Tomorrow, 1st ed.; Nadathur, S., Wanasundara, J.P.D., Scanlin, L., Eds.; Elsevier: Amsterdam, The Netherlands, 2016; pp. 23–45. ISBN 9780128027783. [Google Scholar]
  19. Gentile, L. Protein-polysaccharide interactions and aggregates in food formulations. Curr. Opin. Colloid Interface Sci. 2020, 48, 18–27. [Google Scholar] [CrossRef]
  20. Schmitt, C.; Bovay, C.; Frossard, P. Kinetics of formation and functional properties of conjugates prepared by dry-state incubation of -lactoglobulin/ acacia gum electrostatic complexes. J. Agric. Food Chem. 2005, 53, 9089–9099. [Google Scholar] [CrossRef] [PubMed]
  21. Monteiro, S.R.; Lopes-da-Silva, J.A. Critical evaluation of the functionality of soy protein isolates obtained from different raw materials. Eur. Food Res. Technol. 2019, 245, 199–212. [Google Scholar] [CrossRef]
  22. Gerzhova, A.; Mondor, M.; Benali, M.; Aider, M. A comparative study between the electro-activation technique and conventional extraction method on the extractability, composition and physicochemical properties of canola protein concentrates and isolates. Food Biosci. 2015, 11, 56–71. [Google Scholar] [CrossRef]
  23. Gerliani, N.; Hammami, R.; Aïder, M. Extraction of protein and carbohydrates from soybean meal using acidic and alkaline solutions produced by electro-activation. Food Sci. Nutr. 2020, 8, 1125–1138. [Google Scholar] [CrossRef]
  24. Deak, N.A.; Johnson, L.A. Effects of extraction temperature and preservation method on functionality of soy protein. J. Am. Oil Chem. Soc. 2007, 84, 259–268. [Google Scholar] [CrossRef]
  25. Garg, D.; Chakraborty, S.; Gokhale, J.S. Optimizing the extraction of protein from Prosopis cineraria seeds using response surface methodology and characterization of seed protein concentrate. LWT 2020, 117, 108630. [Google Scholar] [CrossRef]
  26. Gerliani, N.; Hammami, R.; Aïder, M. Assessment of the extractability of protein-carbohydrate concentrate from soybean meal under acidic and alkaline conditions. Food Biosci. 2019, 28, 116–124. [Google Scholar] [CrossRef]
  27. Momen, S.; Alavi, F.; Aider, M. Alkali-mediated treatments for extraction and functional modification of proteins: Critical and application review. Trends Food Sci. Technol. 2021, 110, 778–797. [Google Scholar] [CrossRef]
  28. Deleu, L.J.; Lambrecht, M.A.; Van De Vondel, J.; Delcour, J.A. The impact of alkaline conditions on storage proteins of cereals and pseudo-cereals. Curr. Opin. Food Sci. 2019, 25, 98–103. [Google Scholar] [CrossRef]
  29. Hora, P.I.; Pati, S.G.; McNamara, P.J.; Arnold, W.A. Increased use of quaternary ammonium compounds during the SARS-CoV-2 pandemic and beyond: Consideration of environmental implications. Environ. Sci. Technol. Lett. 2020, 7, 622–631. [Google Scholar] [CrossRef]
  30. Yaqub, M.; Woo, C.; Lee, W. Optimization of hypochlorous acid generation by HCl electrolysis through response surface methodology and artificial neural networks. J. Environ. Chem. Eng. 2021, 9, 105826. [Google Scholar] [CrossRef]
  31. Mourad, K.A.; Hobro, S. Developing chlorine-based antiseptic by electrolysis. Sci. Total Environ. 2020, 709, 136108. [Google Scholar] [CrossRef]
  32. Ampiaw, R.E.; Yaqub, M.; Lee, W. Electrolyzed water as a disinfectant: A systematic review of factors affecting the production and efficiency of hypochlorous acid. J. Water Process Eng. 2021, 43, 102228. [Google Scholar] [CrossRef]
  33. Dong, C.H.; Xie, X.Q.; Wang, X.L.; Zhan, Y.; Yao, Y.J. Application of Box-Behnken design in optimisation for polysaccharides extraction from cultured mycelium of Cordyceps sinensis. Food Bioprod. Process. 2009, 87, 139–144. [Google Scholar] [CrossRef]
  34. AOAC. Official Methods of Analysis, 15th ed.; AOAC International: Washington, DC, USA, 1990; ISBN 0-935584-42-0. [Google Scholar]
  35. AACC. International Approved Methods of the American Association of Cereal Chemists; Minnesota University Press: St. Paul, MN, USA, 2000. [Google Scholar]
  36. Laemmli, U.K. Cleavage of structural proteins during the assembly of the head of bacteriophage T4. Nature 1970, 227, 680–685. [Google Scholar] [CrossRef]
  37. Long, G.; Ji, Y.; Pan, H.; Sun, Z.; Li, Y.; Qin, G. Characterization of thermal denaturation structure and morphology of soy glycinin by FTIR and SEM. Int. J. Food Prop. 2015, 18, 763–774. [Google Scholar] [CrossRef] [Green Version]
  38. Zhao, X.; Chen, F.; Xue, W.; Lee, L. FTIR spectra studies on the secondary structures of 7S and 11S globulins from soybean proteins using AOT reverse micellar extraction. Food Hydrocoll. 2008, 22, 568–575. [Google Scholar] [CrossRef]
  39. Soria-Hernández, C.; Serna-Saldívar, S.; Chuck-Hernández, C. Physicochemical and functional properties of vegetable and cereal proteins as potential sources of novel food ingredients. Food Technol. Biotechnol. 2015, 53, 269–277. [Google Scholar] [CrossRef] [PubMed]
  40. AOCS. Official and Tentative Methods of American Oil Chemists Society, 3rd ed.; American Oil Chemists Society: Champaign, IL, USA, 1980. [Google Scholar]
  41. Haque, Z.; Kito, M. Lipophilization of. alpha. s1-casein. 2. Conformational and functional effects. J. Agric. Food Chem. 1983, 31, 1231–1237. [Google Scholar] [CrossRef]
  42. Acosta-Domínguez, L.; Cocotle-Ronzón, Y.; Alamilla-Beltrán, L.; Hernandez-Martinez, E. Effect of a cryogenic treatment in the microstructure, functional and flow properties of soy protein isolate. Food Hydrocoll. 2021, 119, 106871. [Google Scholar] [CrossRef]
  43. Soria-Hernández, C.G.; Serna-Saldívar, S.O.; Chuck-Hernández, C. Comparison of physicochemical, functional and nutritional properties between proteins of soybean and a novel mixture of soybean-maize. Appl. Sci. 2020, 10, 6998. [Google Scholar] [CrossRef]
  44. Tian, H.; Guo, G.; Fu, X.; Yao, Y.; Yuan, L.; Xiang, A. Fabrication, properties and applications of soy-protein-based materials: A review. Int. J. Biol. Macromol. 2018, 120, 475–490. [Google Scholar] [CrossRef]
  45. Suryana, A.L.; Rosiana, N.M.; Olivia, Z. Effect of drying method on the chemical properties of local soy flour. IOP Conf. Ser. Earth Environ. Sci. 2022, 980, 012030. [Google Scholar] [CrossRef]
  46. Kumar, V.; Lee, S.; Cleveland, B.M.; Romano, N.; Lalgudi, R.S.; Benito, M.R.; McGraw, B.; Hardy, R.W. Comparative evaluation of processed soybean meal (EnzoMealTM) vs. regular soybean meal as a fishmeal replacement in diets of rainbow trout (Oncorhynchus mykiss): Effects on growth performance and growth-related genes. Aquaculture 2020, 516, 734652. [Google Scholar] [CrossRef]
  47. Perović, M.N.; Knežević Jugović, Z.D.; Antov, M.G. Improved recovery of protein from soy grit by enzyme-assisted alkaline extraction. J. Food Eng. 2020, 276, 109894. [Google Scholar] [CrossRef]
  48. Chen, J.; Mu, T.; Goffin, D.; Blecker, C.; Richard, G.; Richel, A.; Haubruge, E. Application of soy protein isolate and hydrocolloids-based mixtures as promising food material in 3D food printing. J. Food Eng. 2019, 261, 76–86. [Google Scholar] [CrossRef]
  49. Yang, F.; Liu, X.; Ren, X.; Huang, Y.; Huang, C.; Zhang, K. Swirling cavitation improves the emulsifying properties of commercial soy protein isolate. Ultrason. Sonochem. 2018, 42, 471–481. [Google Scholar] [CrossRef] [PubMed]
  50. Tang, C.H. Emulsifying properties of soy proteins: A critical review with emphasis on the role of conformational flexibility. Crit. Rev. Food Sci. Nutr. 2017, 57, 2636–2679. [Google Scholar] [CrossRef] [PubMed]
  51. Yang, Y.; Wang, Z.; Wang, R.; Sui, X.; Qi, B.; Han, F.; Li, Y.; Jiang, L. Secondary structure and subunit composition of soy protein in vitro digested by pepsin and its relation with digestibility. Biomed Res. Int. 2016, 2016, 5498639. [Google Scholar] [CrossRef] [PubMed] [Green Version]
  52. Glassford, S.E.; Byrne, B.; Kazarian, S.G. Recent applications of ATR FTIR spectroscopy and imaging to proteins. Biochim. Biophys. Acta 2013, 1834, 2849–2858. [Google Scholar] [CrossRef] [PubMed] [Green Version]
  53. De la Rosa-Millán, J.; Chuck-Hernandez, C.; Serna-Saldívar, S.O. Molecular structure characteristics, functional parameters and in vitro protein digestion of pressure-cooked soya bean flours with different amounts of water. Int. J. Food Sci. Technol. 2015, 50, 2490–2497. [Google Scholar] [CrossRef]
  54. Bai, M.; Qin, G.; Sun, Z.; Long, G. Relationship between molecular structure characteristics of feed proteins and protein in vitro digestibility and solubility. Asian-Australas. J. Anim. Sci. 2016, 29, 1159–1165. [Google Scholar] [CrossRef] [Green Version]
  55. Carbonaro, M.; Maselli, P.; Nucara, A. Relationship between digestibility and secondary structure of raw and thermally treated legume proteins: A Fourier transform infrared (FT-IR) spectroscopic study. Amino Acids 2012, 43, 911–921. [Google Scholar] [CrossRef]
  56. Yalcin, S.; Basman, A. Effects of infrared treatment on urease, trypsin inhibitor and lipoxygenase activities of soybean samples. Food Chem. 2015, 169, 203–210. [Google Scholar] [CrossRef]
  57. Jiang, Y.; Li, L.; He, F.; Yan, W.; Tang, Y.; Yang, R.; Zhao, W. Highly effective inactivation of anti-nutritional factors (lipoxygenase, urease and trypsin inhibitor) in soybean by radio frequency treatment. Int. J. Food Sci. Technol. 2021, 56, 93–102. [Google Scholar] [CrossRef]
  58. Kinsella, J.E. Functional properties of soy proteins. J. Am. Oil Chem. Soc. 1979, 56, 242–258. [Google Scholar] [CrossRef]
  59. Zhu, X.; Ning, C.; Li, S.; Xu, P.; Zheng, Y.; Zhou, C. Effects of l-lysine/l-arginine on the emulsion stability, textural, rheological and microstructural characteristics of chicken sausages. Int. J. Food Sci. Technol. 2018, 53, 88–96. [Google Scholar] [CrossRef]
  60. Wang, Y.; Ma, T.; Liu, C.; Guo, F.; Zhao, J. L-Histidine improves solubility and emulsifying properties of soy proteins under various ionic strengths. LWT 2021, 152, 112382. [Google Scholar] [CrossRef]
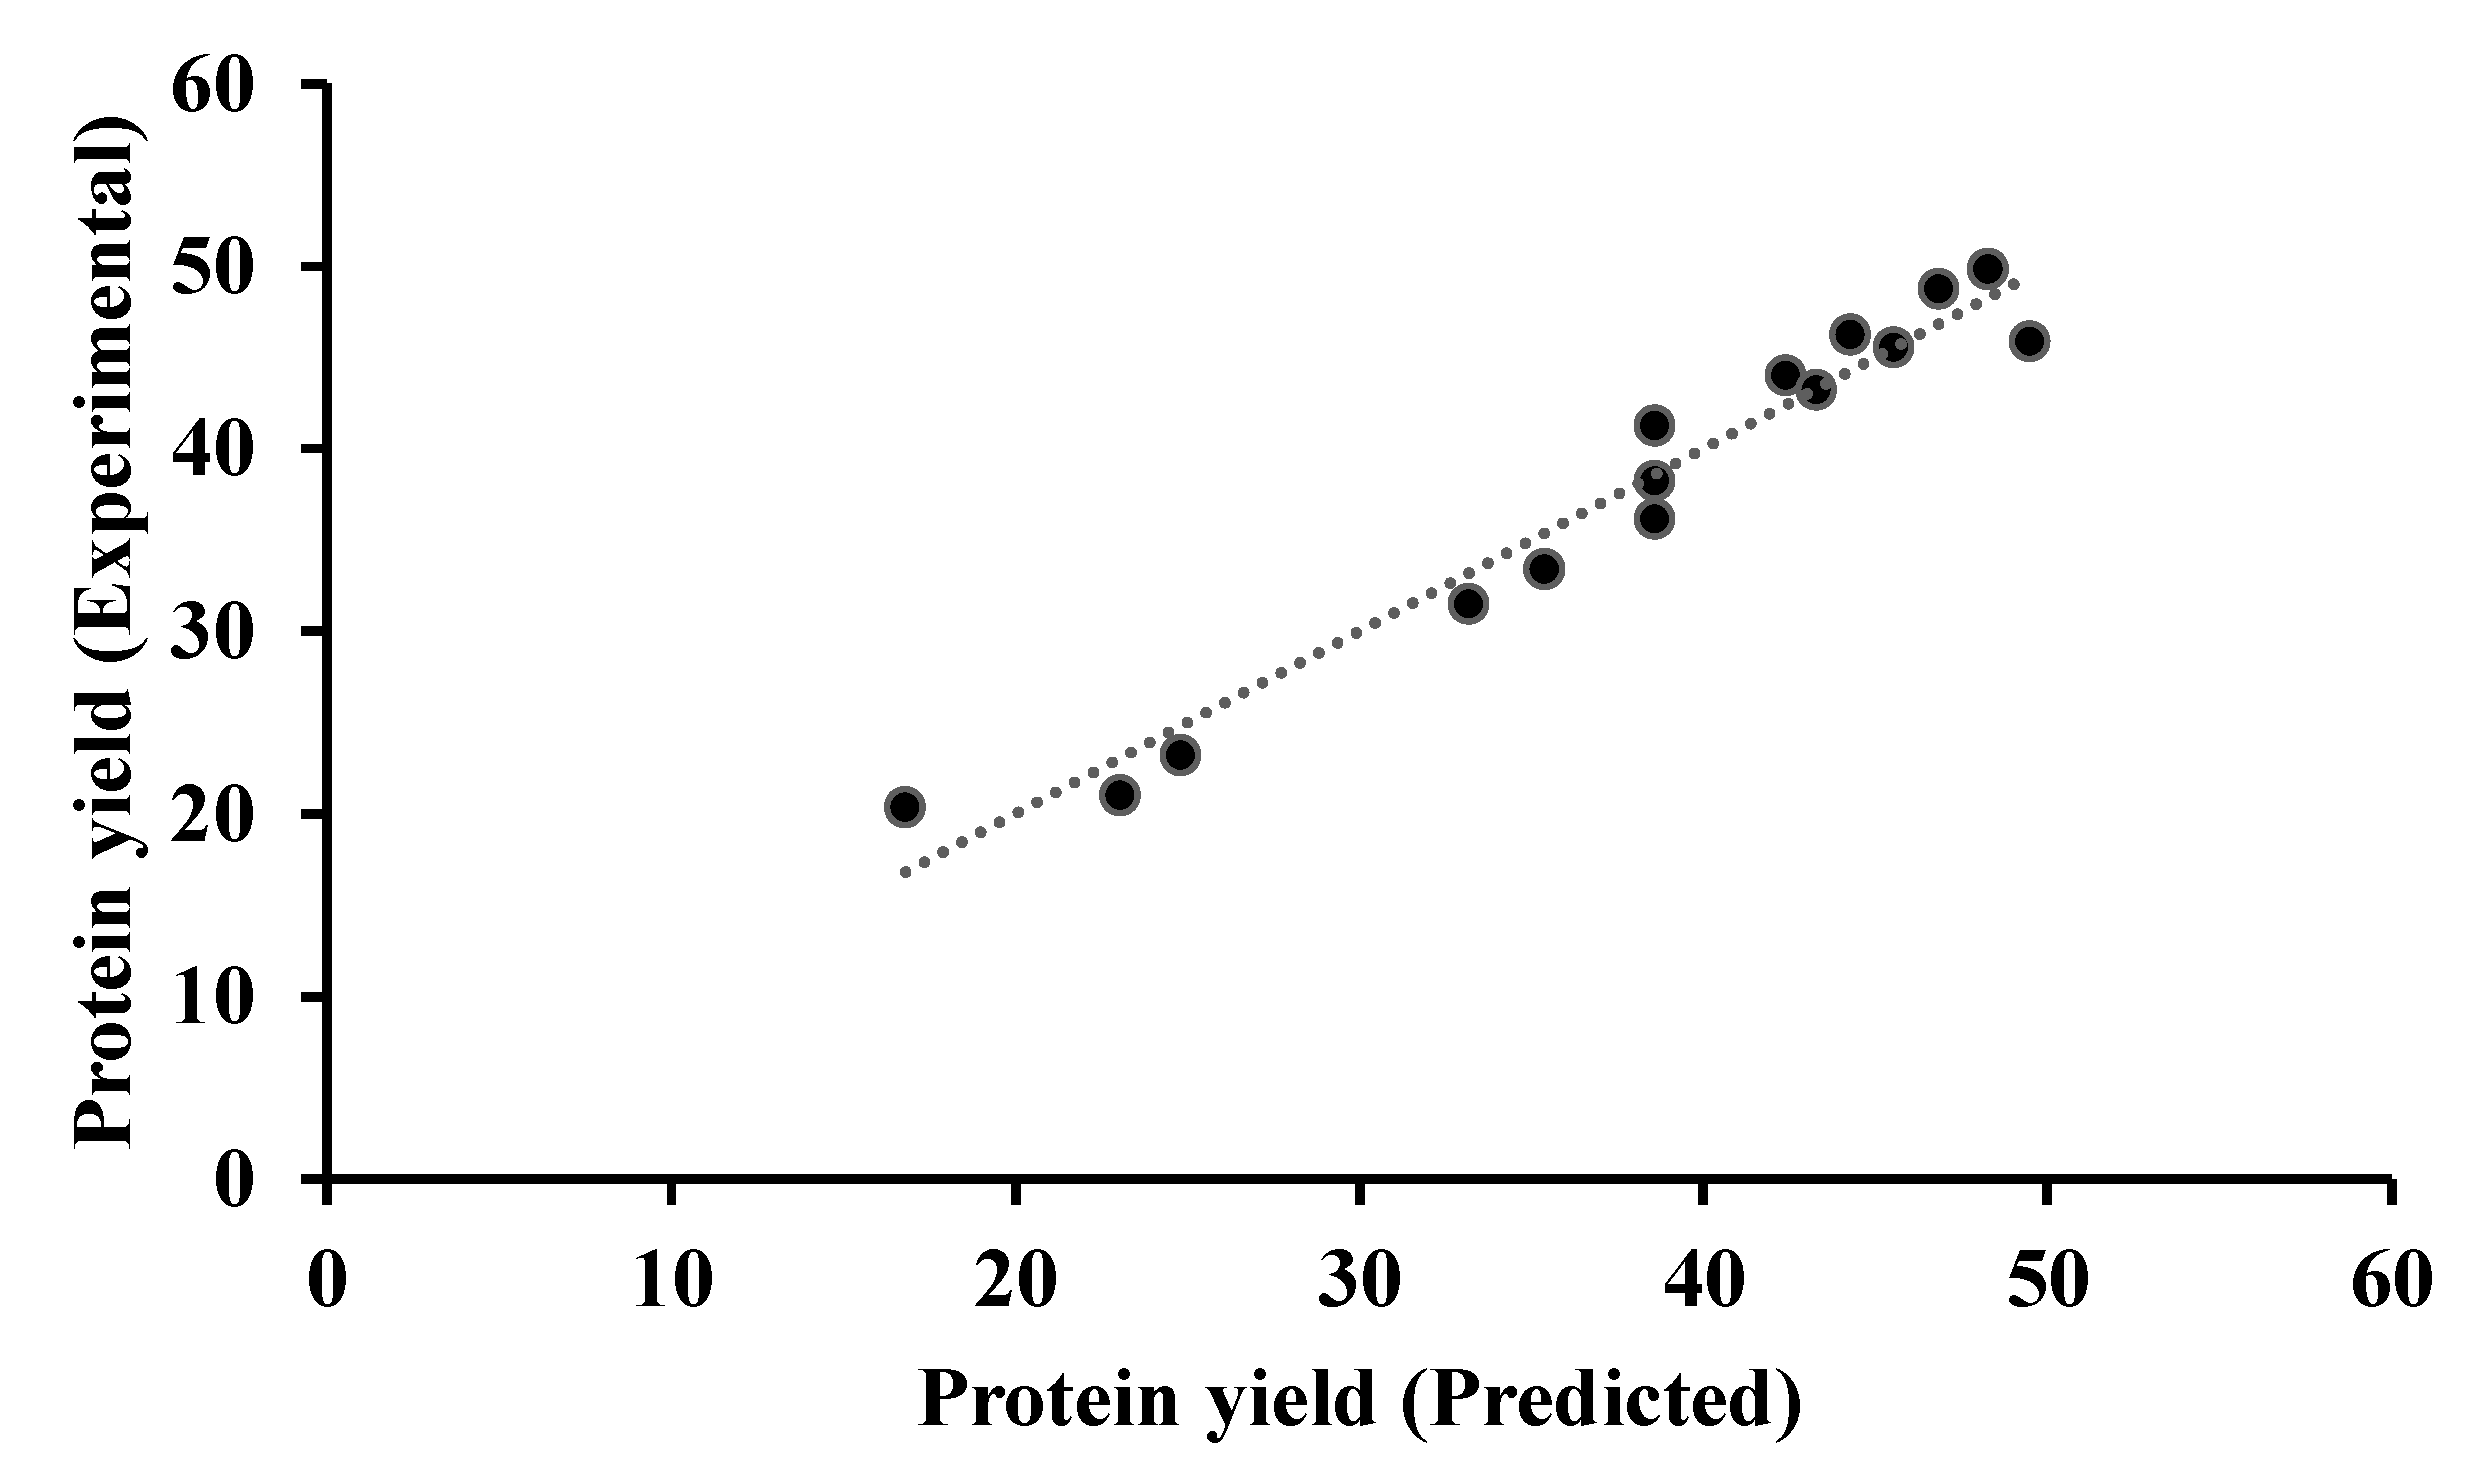
Figure 1. Protein yield (%) from experimental and predicted values.
Applsci 12 03113 g001
Figure 2. Main effects of factors for protein yield (%).
Applsci 12 03113 g002
Figure 3. Contour plots of the interactions of temperature vs. time (A), temperature vs. alkaline solution (B), and time vs. alkaline solution (C).
Applsci 12 03113 g003
Figure 4. Electrophoretic profile of soy protein isolates. REF: standard; COM: commercial soy protein isolate; SPI: soy protein isolate extracted at optimal conditions (alkaline solution 3, for 45 min and 70 °C).
Applsci 12 03113 g004
Figure 5. FTIR spectra of soybean flour, commercial SPI, and obtained SPI (A); deconvolution of obtained SPI (B), deconvolution of commercial SPI (C), and deconvolution of soybean flour sample (D).
Applsci 12 03113 g005
Table 1. Levels of the factors used in the Box–Behnken design.
VariablesLevels
LowMediumHigh
Temperature (°C)2547.570
Time (min)2562.5100
Alkaline solution (coded) 1123
1 Alkaline solution 1 was NaOH obtained when producing 100 ppm HOCl, solution 2 when producing 200 ppm, and solution 3 when 500 ppm HOCl is generated.
Table 2. Proximate analysis of the commercial soybean flour.
ComponentThis Study (%)Reported Values (%) [44]
Fiber4.28 ± 0.103.0
Fat0.87 ± 0.095.1
Protein56.12 ± 1.0153.0
Ash6.99 ± 0.026.0
Carbohydrate *31.7226.4
Moisture6.82 ± 0.096.5
Percentage of fiber, fat, protein, and ash are on a dry-matter basis. * Carbohydrate content was calculated by subtracting the percentage of the components from 100.
Table 3. Physicochemical characterization of NaCl electrolysis by-product solutions.
Electric Current Intensity (A) *Sanitizer Concentration Generated (ppm) *By-Product Solution GeneratedNaOH Concentration (N)pH
4610010.0086 ± 0.000212.10 ± 0.0252
6020020.0112 ± 0.000512.29 ± 0.0200
11050030.0214 ± 0.000512.68 ± 0.0173
* According to Bioproductos Laguneros S.A. de C.V. procedures.
Table 4. Experimental and predicted values of the protein yield after the extraction process according to the Box–Behnken design.
FactorsProtein Yield (%)
RunTemperature (°C)Time (min)Alkaline Solutions (Coded)Experimental *Predicted **Difference
125100231.51 ± 1.8333.161.65
247.525123.19 ± 1.3624.801.60
32562.5345.56 ± 1.1645.510.04
47025244.03 ± 2.2842.381.65
547.562.5241.29 ± 1.2038.572.71
647.5100349.86 ± 2.3148.261.60
72562.5120.39 ± 1.4416.793.59
847.525348.77 ± 1.9646.821.94
92525221.04 ± 1.6623.031.99
107062.5345.88 ± 1.4249.473.59
1147.5100133.43 ± 2.7235.371.94
1247.562.5238.26 ± 1.1138.570.30
137062.5143.23 ± 2.7443.280.04
1447.562.5236.17 ± 1.5838.572.40
1570100246.25 ± 1.2344.261.99
* Mean of three replicates, ** Calculated according to Equation (4).
Table 5. ANOVA for the quadratic model.
Source of VariationDegree of FreedomSum of SquareMean SquareF-Valuep-ValueDetermination Coefficient (R2)
Model94009.98445.5552.880.0000.9315
Linear33435.291145.10135.890.000
Two-way interaction3494.05164.6819.540.000
Temperature vs. time150.9350.936.040.019
Temperature vs. alkaline solution1380.52380.5245.160.000
Time vs. alkaline solution162.662.67.430.010
Table 6. Multiple response prediction.
FactorsPredicted
Optimized Level
Predicted Protein Yield (%)Confidence
Interval (95%)
Experimental Protein Yield (%)
Temperature (°C)7049.79(46.66–52.93)48.30 ± 0.21
Time (min)44.7---
Alkaline
solution (coded)
3---
Table 7. Secondary structures determined by deconvolution of amide I, using ATR-FTIR.
Sampleβ-Conformations (%)α-Helix (%)Random Coil (%)β:α Ratio
Soybean flour69.2315.3815.384.50
Soybean flour [54]69.2012.1612.345.69
Commercial SPI77.7711.1111.117.00
SPI81.819.099.099.00
SPI [51]72.0012.00- *6.00
* Not reported.
Table 8. Functional properties and urease activity of SPI.
TestSPI pH 4.5SPI pH 7Reported SPI [43]
UA- *0.06 ± 0.020.04 ± 0.01
WSI (%)6.28 ± 0.1081.39 ± 3.0233.11 ± 1.13
WAI3.26 ± 0.15- *7.97 ± 0.16
FA (%)315.90 ± 15.53302.30 ± 19.91442.00 ± 15.57
FD (%)12.12 ± 1.8924.90 ± 1.2718.46 ± 0.54
FS (%)34.54 ± 4.7288.63 ± 4.6190.17 ± 2.42
EC (%)82.78 ± 5.0879.76 ± 3.72- *
ES 24 h (%)82.78 ± 5.0879.76 ± 3.7243.39 ± 0.92
ES 48 h (%)100.00 ± 0.0097.76 ± 0.1076.39 ± 4.31
* Not reported or calculated. UA: urease activity; WSI: water solubility index; WAI: water activity index; FA: foam activity; FD: foam density; FS: foam stability; EC: emulsion capacity; ES: emulsion stability.
Publisher’s Note: MDPI stays neutral with regard to jurisdictional claims in published maps and institutional affiliations.