Abstract
In existing biometric authentication methods, the user must perform an authentication operation such as placing a finger in a scanner or facing a camera. With ear acoustic authentication, the acoustic characteristics of the ear canal can be used as biometric information. Therefore, a person wearing earphones does not need to perform any authentication operation. Existing studies which use the acoustic characteristics of the ear canal as biometric information only measure the characteristics of one ear. However, the acoustic characteristics of the human ear canal can be measured from both ears. Hence, we proposed a new method for acoustic authentication based on the ability to measure the acoustic characteristics of the ear canal from both ears. The acoustic characteristics of the ear canal of 52 subjects were measured. Comparing the acoustic characteristics of the left and right ear canals, a difference in the signal between the left and right ear was observed. To evaluate the authentication accuracy, we calculated the evaluation indices of biometric authentication, equal error rate (EER), and area under curve (AUC). The EER for bilateral ear acoustic authentication using signals from both ears was 0.39%, which was lower than that of a single ear. The AUC was 0.0016 higher for bilateral ear acoustic authentication. Therefore, the use of bilateral signals for ear acoustic authentication was proved to be effective in improving authentication accuracy.
1. Introduction
Biometric authentication can minimize the risks of information loss, theft, or leaks. Over the past few decades, many types of biometric authentication have been studied, including authentication using fingerprints [1], palmprints [2,3], face [4], iris [5], retina [6], and voice [7]. These methods require an authentication operation by the user, such as placing a finger on a scanner or facing a camera. Wearable biometric devices that do not require an authentication operation have been studied in recent years. Yang et al. devised a new type of sensor that is attached to the throat [8]. Other wearable biometrics have been proposed using electrocardiograms [9]. The authors focused on the acoustic characteristics of the ear canal, and proposed an ear acoustic authentication system [10]. Ear acoustic authentication is a new wearable biometric authentication method that uses earphones to perform biometric authentication. We acquired ear canal-reflected sounds using an impulse response measurement method and pseudo-noise signals [11]. This strategy is used as a feature for personal identification and authentication. We confirmed its effectiveness by conducting experiments with real subjects [10]. Ear acoustic authentication was investigated to improve the signal-to-noise ratio (SNR) by extracting the signal from background noise and reducing the fluctuations in the observations, using additive averaging [12]. Mahto et al. investigated individual authentication using inaudible sound frequencies [13]. Gao et al. evaluated the effectiveness of biometric authentication in everyday life using the differences in the acoustic characteristics of the ear canal [14].
Although ear acoustic authentication has been studied as a wearable biometric authentication method, wearing earphones on both ears has not been studied. We hypothesized that the accuracy of ear acoustic authentication could be improved by measuring the acoustic characteristics of the ear canal from both ears, because the authentication information is doubled. In the field of sound-image localization, it has been established that differences in the shape of the listener’s head, ear, and ear canal strongly influence the quality of sound localization [15,16,17]. This sound image localization technique requires earphones to be worn in both ears, and not just one. This is because the location of the sound is estimated from the sounds heard by both ears. The use of bilateral signals for authentication is inspired by this. In this paper, we construct a system that can measure the ear canal acoustic characteristics of both ears simultaneously. We visualize and analyze the characteristics to find out if there is a difference in the bilateral signal because if there is a difference, it may improve the accuracy of authentication. In addition, we calculate and evaluate the accuracy of the bilateral ear acoustic authentication using a 1:1 authentication system.
2. Ear Acoustic Authentication
In ear acoustic authentication, biometric authentication is performed using a special earphone with a small embedded microphone, as shown in Figure 1. In this study, ear canal transfer characteristics are defined as the characteristics related to signal transmission between the earphone and microphone placed at the entrance of the ear canal. The ear canal transmission characteristics include the acoustic characteristics of the ear canal, electroacoustic conversion characteristics of the earphone, acoustoelectric conversion characteristics of the microphone, and characteristics depending on the positional relationships between the microphone and earphone. The ear canal transfer characteristics become the ear canal impulse response (ECIR) in the time domain and are represented by the ear canal transfer function (ECTF) in the complex frequency domain. An ECIR can be derived by measuring the acoustic characteristics using an impulse response measurement method with a time-stretched pulse signal or a maximum length sequence (MLS) signal. The acoustic characteristics differ for each user because they depend on the unique physical characteristics of the individual [18]. In ear acoustic authentication, focus is placed on the individuality of the ear canal transfer characteristics, and biometric authentication is performed by applying feature extraction processing to the discriminator.
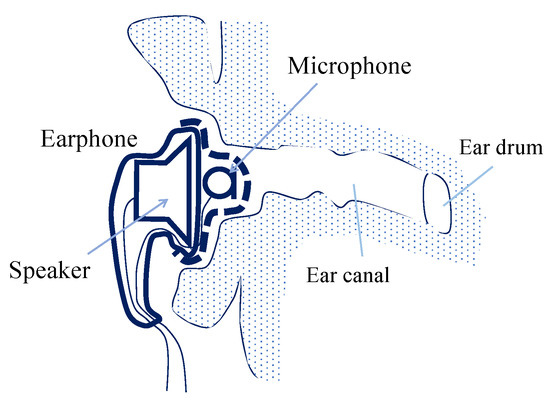
Figure 1.
Sketch of outer ear with measurement device (earphone with microphone) for identification of ear canal acoustics.
3. Data Acquisition
3.1. Subjects
We enrolled 52 students and employees of the National Institute of Technology, Nagaoka College, aged between the late teens and 50s. Following college rules, we obtained informed consent from all participants to participate in this study.
3.2. Measurement and Preprocessing
The ECIR was measured according to the process shown in Figure 2. To make it easier to reproduce the experiment, a picture of the actual measurement is shown in Figure 3. The earphone used was a SoundTrue Ultra (Bose Corporation, Framingham, MA, USA). Glue was used to attach a small microphone MAA-03A-L60(STAR MICRONICS Co., Ltd., Shizuoka, Japan) to the earphone. The earphone was chosen because it has ear tips that are shaped to fit the ear concha. We hypothesized the ear tips would reduce fluctuations in earphone position caused by putting on and taking off. We selected small microphones with characteristics in the audible range of 20 Hz to 20 kHz. The MLS signal was output from Quad-CAPTURE (Roland Corporation, Shizuoka, Japan). Sound level meter TYPE6226 (ACO Co., Ltd., Miyazaki, Japan) was used as a microphone amplifier, and the amplified microphone signal (reflected sound) was recorded on a PC using Quad-CAPTURE. The MLS signal (signal length of ) was measured and played five times to obtain an average noise level of approximately 65 dB (A). The sound levels were measured using a modelled head before measuring the ECIR. The sensitivity of the sound processor was set as high as possible without saturating the waveform. The MLS signal was output five times successively, and the reflected sound was processed as an additive average. The impulse response (ECIR) was derived from the additive-averaged reflected sound using the Hadamard transform. Additive averaging can be used to measure ear acoustic characteristics more accurately [12]. For the derived impulse response, a minimum phase-system transformation was performed using the Hilbert transform to ensure that the impulse response component is at the beginning of the signal. Because the signal component is at the beginning of the signal, a minimum phase-system transformation was performed to make the clipping process easier. After minimum phase-system transformation, normalization was performed. The measurements were made over several days, during which the volume and sensitivity knobs of Quad-CAPTURE may have changed slightly. The magnitude of the signal may vary due to slight differences in the volume and sensitivity between the day of measurement. To allow for this variation in the data, normalization is a popular method used in machine learning. Normalization is defined as follows:
where n indicates the point of the samples and N is the total length of the signal. indicates the signal after a minimum phase-system transformation. After normalizing, a clipping process was performed. Because the impulse response component was 200–300 samples from the beginning of the signal, 256 samples were clipped out to extract the signal components. A total of 256 samples were determined based on the authors’ experience with the waveform. Finally, bandpass filtering (100 Hz–22 kHz) was performed to remove the direct current component.
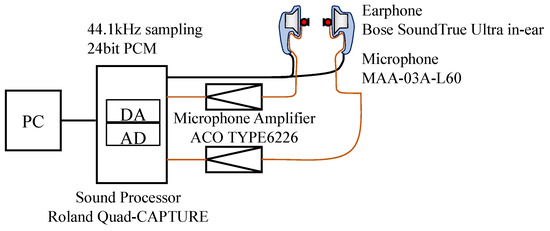
Figure 2.
The measurement system for measuring bilateral ear data.
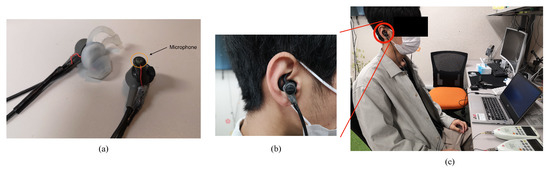
Figure 3.
Photos of a special earphone and measurements. (a) a special earphone. (b) the subject wearing the earphone. (c) measurements. The earpieces in (b,c) are black, however the white earpieces shown in (a) were used in the experiment.
The measurements comprise two sessions, with each session consisting of 30 trials. In the first session, measurements were performed for 30 trials without removing the earphones. In the second session, earphones were attached and detached for each trial, and measurements were taken.
4. Analysis of Bilateral Signals
In this section, the waveforms are visualized and discussed to confirm the difference between the signals of the two ears. Furthermore, cosine similarity was used to assess the existence of a numerical difference.
4.1. Visualization
The signals measured in Session 2 are visualized. Figure 4 shows the averaged signals and their frequency responses for all thirty trials of the three subjects. The frequency response is plotted to show the variability. Only the averaged signal is shown because the time-series signal variability was difficult to visualize. Figure 4a–c show the preprocessed ECIR data, and Figure 4d–f show its frequency response. Comparing the time series data of the left and right ears, it can be observed that the two types of waveforms are different without complete overlapping.
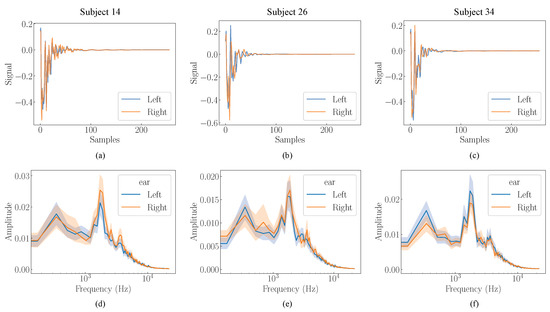
Figure 4.
Preprocessed ECIR data and their frequency characteristics of three subjects. (a,d) Subject No. 14. (b,e) Subject No. 26. (c,f) Subject No. 34.
The frequency response shows that all subjects have peaks in the same frequency band. It can also be observed that the characteristics of the data for the left and right ears are similar. Therefore, we can conclude that there was no significant discrepancy in the measurement.
As shown in Figure 4, although a difference exists between the left and right ear data, it is unclear whether it is sufficiently large or small to have a positive effect on authentication. These differences are presumed to be caused by the difference in the shape of the actual ear and the differences in the characteristics of the left and right earphones and microphones. Different data for the left and right ears may increase the amount of information available for authentication, which may probably improve the accuracy of the authentication process. If the data from the left and right ears do not have a positive effect on authentication, the accuracy will not improve and will be similar to that of a single ear authentication.
4.2. Cosine Similarity
We analyze the existence of numerical differences between the left and right data. We assumed that a high cosine similarity within the data of the same ear and a low cosine similarity between the left and right ears can imply a difference between the data of the two ears. We define the left and right datasets as and , respectively. i indicates the trial number, . The cosine similarity of the data for each ear is calculated as follows:
The cosine similarity of the data between the left and right ears is calculated as follows:
The cosine similarity of the 52 subjects was computed. The average results are listed in Table 1. The mean value of the cosine similarity for the left and right ears was 0.985 and 0.988, respectively. In contrast, the cosine similarity between the signals of the left and right ear was 0.915. The student’s t-test was used to compare the cosine similarity of the left ear to the bilateral cosine similarity, and the p-value was less than 0.01. Similarly, the p-value for the right ear was less than 0.01. Therefore, we can conclude that there is a significant difference between the cosine similarity of one ear and that of the two ears. A high cosine similarity within the data of the same ear and a low cosine similarity between the left and right ears indicates a probable difference between the data of the left and right ears.

Table 1.
Cosine similarity within one ear data and between two ears.
5. Evaluations
In Section 4, we discovered a probable difference in the signals between the two ears. However, its validity for authentication is not yet proven. In this section, we evaluate the effectiveness of bilateral ear acoustic authentication by adopting an authentication system and calculating authentication accuracy.
5.1. Bilateral Ear Acoustic Authentication System
In this study, we adopt the ear acoustic authentication system illustrated in Figure 5. This system employs 1:1 authentication, a type of authentication that initially identifies the user and subsequently ascertains whether the measured biometric information belongs to that user. We used support vector machine (SVM), a type of supervised learning used for classification, regression, and outlier detection, as the discriminator of authentication. It can also calculate posterior probabilities as suggested by Platt et al. [19] and Wu et al. [20]. If the posterior probability is high, the probability of identifying the user is high. Ultimately, the system compares the posterior probability to a threshold and outputs “Accept” or “Reject”.
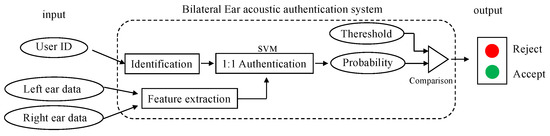
Figure 5.
Overview of bilateral ear acoustic authentication system.
5.2. Factors of Evaluation
In 1:1 authentication, the biometric information provided is classified as belonging to an authorized user. The false acceptance rate (FAR) is the rate at which biometric information belonging to an unauthorized user is incorrectly accepted as that of an authorized user. The false rejection rate (FRR) is the rate at which biometric information belonging to an authorized user is incorrectly rejected as that of an unauthorized user. The true acceptance rate (TAR) is the rate at which the biometric information of an authorized user is correctly accepted as such. These are defined by the following equations:
where is the number of authentications performed, is the number of authorized users incorrectly rejected, and is the number of unauthorized users incorrectly accepted. When performing classifications, it is necessary to set a threshold that determines the minimum probability of true acceptance. If the threshold is set low, it is more difficult to incorrectly reject an authorized user and easier to incorrectly accept an unauthorized user. Contrarily, if the threshold is set high, it becomes easier to reject authorized users. Therefore, as illustrated in Figure 6a, there is a trade-off between FAR and FRR. The graph shown in Figure 6a, which indicates the relationship between FAR and FRR, is known as a detection error tradeoff (DET) curve. The intersection between the FAR and FRR is known as the equal error rate (EER), which is used as a performance indicator of biometric authentication. The lower the EER, the higher the authentication accuracy. The graph shown in Figure 6b, which indicates the relationship between TAR and FAR, is known as a receiver operating characteristic (ROC) curve. The area below the ROC curve is referred to as the area under the curve (AUC) and is used as a performance indicator of biometric authentication. The AUC varies from 0 to 1, that is, if there are no authentication mistakes, the AUC is one, and in the case of accidental authentication, 0.5. Therefore, the higher the AUC, the higher the authentication accuracy.
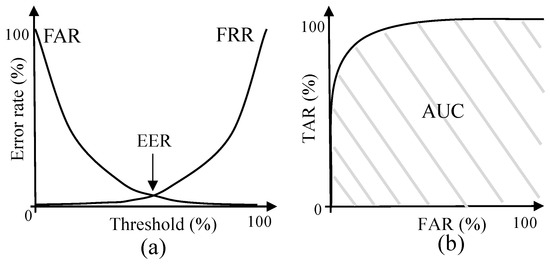
Figure 6.
DET curve and ROC curve. (a) DET curve: FAR and FRR against the threshold. (b) ROC curve: TAR versus FAR.
5.3. Classification
As mentioned previously, this study is based on 1:1 authentication, which analyzes whether the feature-amount input belongs to an authorized user or an unauthorized user. Classification was performed using the SVC function, which is an SVM for classification implemented in scikit-learn [21]. The SVC function was implemented based on libsvm [22] and could specify the kernel and regularization parameters used. The data of an authorized user were divided into six samples of training data and 24 samples of test data. For unauthorized users, one unauthorized user was selected as test data while the rest of the unauthorized users were treated as training data. Similar to the authorized user, 24 out of 30 trials of the test data were used. As illustrated in Figure 7, Person 1 is the authorized user, Person 2 is the unauthorized user for the test data, and Persons 3 to 52 are the unauthorized users for learning. The authorized and unauthorized users for the test generated 2652 possible combinations, and the SVM learned each combination and calculated the accuracy. For each sample of test data, the SVC function calculated the probability of being an authorized user in the range of 0 to 1. The FAR, FRR, and TAR, when the threshold was changed, were calculated from the estimated probability using the roc_curve function of scikit-learn. To calculate the posterior probability, the probability parameter of the SVC function was set to true and other parameters of the SVC function were set to default. The default kernel is the radial basis function, default cost is 1.0, and default gamma is . Where is the number of features observed during the SVM training and is the variance of the input feature (training data).
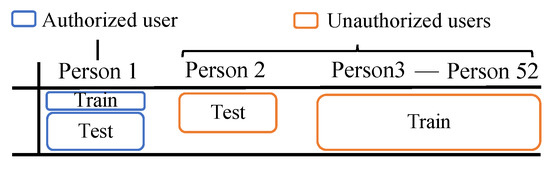
Figure 7.
An example of splitting training data and test data.
5.4. Feature Extraction for Bilateral Data
The process of extracting features from the bilateral data is unknown. In this study, we calculated and evaluated the accuracy of each of the three methods: adding (Plus), subtracting (Minus), and concatenating (Joint) data from both ears, as shown in Figure 8. The accuracy of the left and right ear acoustic authentication was calculated and compared with that of binaural acoustic authentication to confirm its effectiveness.
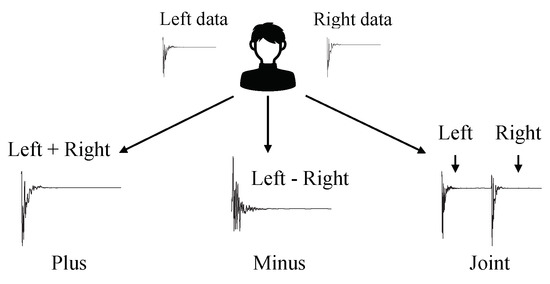
Figure 8.
Feature extraction method for bilateral ear data. Plus is a method of adding data to the left ear and the right ear. Minus is a method of subtracting data from the left and right ear. Joint is a method for concatenating data from the left and right ears.
5.5. Result
The calculated EER and AUC for each subject are shown in Figure 9. The bar is the average of 52 subjects. There are 52 points in a bar, showing the value for each subject. The lower the EER and the larger the AUC, the higher the authentication accuracy. Bilateral ear acoustic authentication (Joint method) had the highest authentication accuracy, with an EER and AUC of 0.39% and 0.9995 which were the lowest and highest of the five methods, respectively. Compared to single-ear authentication (left method), the EER was 0.92% lower and the AUC was 0.0016 larger. The Plus method had the second-highest authentication accuracy, and the difference in EER between the left and plus methods was 0.38 %. The accuracy of the bilateral ear authentication method, Minus, was low compared to that of the single-ear authentication method. The results show that concatenating the features of both ears is the most effective method for combining the signals of both ears. Contrary to our expectations, the authentication accuracy of the Minus method was poor. The performance of the Minus method is discussed in Section 6.2.
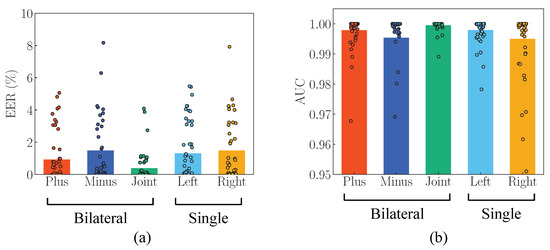
Figure 9.
Authentication accuracy for bilateral ear acoustic authentication (Plus, Minus, and Joint) and single-ear acoustic authentication (Left and Right). (a) EER. (b) AUC.
6. Discussion
6.1. Efficacy of Bilateral Ear Acoustic Authentication
The EER for left ear acoustic authentication was 1.31%, and the AUC was 0.9979. Contrastingly, the EER and AUC of bilateral ear acoustic authentication (Joint method) was 0.39% and 0.9995, respectively. By combining the signals from both ears, the EER was reduced by 0.92% and AUC was increased by 0.0016. The F-test and t-test were performed to determine the existence of a difference between the accuracy of bilateral (Joint method) and single (Left method) authentication. The result of F-test showed that the population variances were not equal; therefore, Welch’s t-test was performed. The p-value was less than 0.01, indicating a significant difference between accuracies. This implies that the use of signals from both ears for ear acoustic authentication is effective in improving accuracy.
6.2. Deterioration of Authentication Accuracy by Minus Method
The FAR and FRR curves are shown in Figure 10. The FAR and FRR curves are not an average of the results of the 52 subjects. They are calculated from the posterior probabilities of all 52 subjects. The minus signal, which was obtained by subtracting the binaural signals from Figure 10, had the lowest FAR and the highest FRR. A low FAR and a high FRR denotes a low probability of accidentally accepting an unauthorized user and a high probability of rejecting an authorized user, respectively. In other words, the subtracted signal (Minus method) is a third signal, which differs from the signals of the authorized and unauthorized users. Hence, it is unsuitable for biometric authentication. A signal that is suitable for biometric authentication has a low variance within users and a high variance between authorized and unauthorized users. Bilateral authentication (Minus method) exhibited higher EER compared to single-ear authentication (Left method). This is because the variance within authorized users and within unauthorized users for the Minus method increased. Specifically, subtraction increased the variance within authorized and unauthorized users, making the signal unsuitable for biometric authentication.
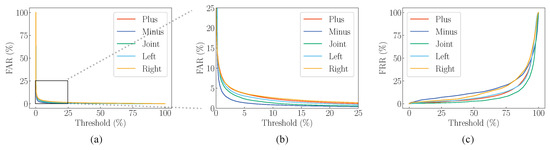
Figure 10.
FAR and FRR curves for bilateral and single ear acoustic authentication. (a) FAR curve. (b) Enlarged FAR curves. (c) FRR curve.
6.3. Exclusion of Low SNR Data
It is interesting to know the SNR of our method and whether it is related to the accuracy of the authentication. The distribution of SNRs of our measured ear canal acoustic characteristics is shown in Figure 11a. In our experience, the SNR of 20 dB is excellent. We verified whether SNR affects the accuracy of authentication by excluding signals with SNR less than 30 dB. Undersampling was performed to equalize the number of trials when the signal of SNR below 30 dB were excluded. Other conditions are the same as in Section 5. Since the correspondence between SNR and authentication accuracy is clearer for single ear authentication, we calculated the accuracy of single ear authentication. Figure 10a,b shows the result of EER and AUC, respectively. In Figure 11a,b, “SNR-” are the results when signals with SNR less than 30 dB are excluded. Excluded results are slightly lower for EER. The excluded results are smaller and less accurate with respect to the AUC. Based on these results, it can be concluded that excluding signals with SNR less than 30 dB does not improve the accuracy.
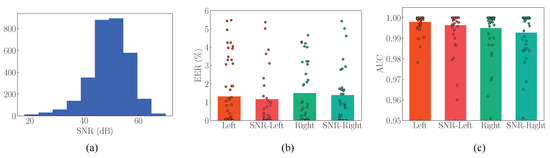
Figure 11.
(a) Histogram of SNRs. (b) EER when signals with SNR less than 30 dB are excluded. (c) AUC when signals with SNR less than 30 dB are excluded.
6.4. Issues for Practical Use
An important method for improving accuracy is to reduce the observation error when attaching and detaching each time. In this study, the earphones were left on for 30 trials in Session 1, whereas in Session 2, they were removed and attached after each trial. Therefore, we compared the EER and AUC of Sessions 1 and 2 to examine the effects of attaching and detaching the earphones. The EER and AUC of Sessions 1 and 2 are shown in Figure 12. Comparing Sessions 1 and 2, the authentication accuracy was higher in Session 1, where 30 measurements were taken while wearing the earphones. This difference in accuracy is due to observation errors during attachment and detachment. The EER for bilateral ear acoustic authentication (Joint method) in Session 1 was 0.026%, which was 0.36% lower than that in Session 2. If the error due to each attachment and detachment can be reduced, EER = 0.026% can be used for authentication. Therefore, it is essential to devise earpieces and earphone shapes that can reduce the errors caused by each attachment and detachment.
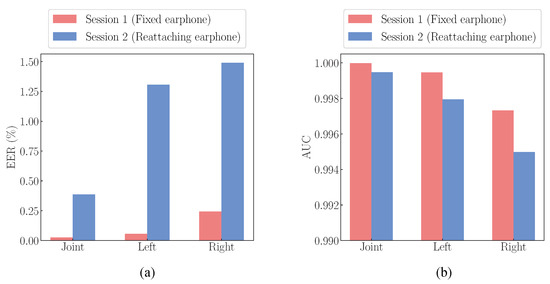
Figure 12.
Comparison of EER and AUC for Sessions 1 and 2. (a) EER. (b) AUC.
7. Conclusions
Biometric authentication using the acoustic characteristics of the ear canal has not yet been studied for bilateral authentication. In this study, we propose a bilateral ear acoustic authentication method that uses signals from both ears. We constructed a system to acquire the acoustic characteristics of the ear canals of both ears of 52 subjects simultaneously. Subsequently, we measured the signals of both ears. The effectiveness of the system was verified by comparing the signals of the left and right ears and calculating authentication accuracy. As a result, bilateral ear acoustic authentication decreased the EER and increased the AUC by 0.92% and 0.0016, respectively, compared to single ear acoustic authentication, which solely relies on the signal of the left ear. Therefore, it can be concluded that the accuracy of bilateral ear acoustic authentication is higher than that of single ear acoustic authentication. This proves the effectiveness of our proposed method. Bilateral ear acoustic authentication (Joint method) achieved the highest accuracy, with an EER of 0.39% and an AUC of 0.9995. Observation error was caused by each attachment and detachment. The difference in the EER caused by observation error was 0.36%. This is owing to the challenges associated with attachment and detachment. An issue to be solved in future is that noise presence due to the improper placement or positioning divergence might be intensified by normalizing a signal. If the external noise is too large, the measurement should be restarted to minimize the possibility of noise intensification due to the normalization. In addition, whether the characteristics of ear acoustic authentication change with age and the effects of ear wax have not been investigated, thus further research is needed.
Author Contributions
Conceptualization, M.Y. and S.Y.; methodology, M.Y.; software, M.Y. and S.Y.; validation, M.Y., S.Y. and I.N.; formal analysis, M.Y., S.Y. and I.N.; investigation, M.Y. and S.Y.; resources, S.Y. and I.N.; data curation, M.Y.; writing—original draft preparation, M.Y.; writing—review and editing, S.Y. and I.N.; visualization, M.Y.; supervision, S.Y.; project administration, S.Y.; funding acquisition, S.Y. All authors have read and agreed to the published version of the manuscript.
Funding
This work was supported by JSPS KAKENHI Grant Numbers JP19H04112 and JP19K22851.
Institutional Review Board Statement
Ethical review and approval were waived for this study, due to National Institute of Technology, Nagaoka College judged that the examination was unnecessary.
Informed Consent Statement
Informed consent was obtained from all subjects involved in the study.
Data Availability Statement
Data sharing is not applicable to this article.
Conflicts of Interest
The authors declare no conflict of interest.
References
- Jain, A.; Ross, A.; Prabhakar, S. An introduction to biometric recognition. IEEE Trans. Circuits Syst. Video Technol. 2004, 14, 4–20. [Google Scholar] [CrossRef]
- Lu, G.; Zhang, D.; Wang, K. Palmprint recognition using eigenpalms features. Pattern Recognit. Lett. 2003, 24, 1463–1467. [Google Scholar] [CrossRef]
- Zhang, D.; Shu, W. Two novel characteristics in palmprint verification: Datum point invariance and line feature matching. Pattern Recognit. 1999, 32, 691–702. [Google Scholar] [CrossRef]
- Zhao, W.; Chellapa, R.; Phillips, P.; Rosenfeld, A. Face recognition: A literature survey. ACM Comput. Surv. 2003, 35, 399–458. [Google Scholar] [CrossRef]
- Thomas, T.; George, A.; Devi, K.I. Effective Iris Recognition System. Procedia Technol. 2016, 25, 464–472. [Google Scholar] [CrossRef][Green Version]
- Borgen, H.; Bours, P.; Wolthusen, S.D. Visible-Spectrum Biometric Retina Recognition. In Proceedings of the 2008 International Conference on Intelligent Information Hiding and Multimedia Signal Processing, Harbin, China, 15–17 August 2008; pp. 1056–1062. [Google Scholar]
- Campbell, J. Speaker recognition: A tutorial. Proc. IEEE 1997, 85, 1437–1462. [Google Scholar] [CrossRef]
- Yang, J.; Chen, J.; Su, Y.; Jing, Q.; Li, Z.; Yi, F.; Wen, X.; Wang, Z.; Wang, Z.L. Eardrum-Inspired Active Sensors for Self-Powered Cardiovascular System Characterization and Throat-Attached Anti-Interference Voice Recognition. Adv. Mater. 2015, 27, 1316–1326. [Google Scholar] [CrossRef] [PubMed]
- Fratini, A.; Sansone, M.; Bifulco, P.; Cesarelli, M. Individual identification via electrocardiogram analysis. Biomed. Eng. Online 2015, 14, 78. [Google Scholar] [CrossRef] [PubMed]
- Yano, S.; Arakawa, T.; Koshinaka, T.; Irisawa, H. Peoposal of authentication method by acoustical characterstics of ear canal. In Proceedings of the Fifth Symposium on Biometrics, Recognition and Authentication(SBRA), Tokyo, Japan, 12–13 November 2015; pp. 94–95. [Google Scholar]
- Moriya, N.; Kaneda, Y. Optimum signal for impulse response measurement that minimizes error caused by ambient noise. J. Acoust. Soc. Jpn. 2008, 64, 695–701. [Google Scholar]
- Yano, S.; Arakawa, T.; Koshinaka, T.; Imaoka, H.; Irisawa, H. Improving Acoustic Ear Recognition Accuracy for Personal Identification by Averaging Biometric Data and Spreading Measurement Errors over a Wide Frequency Range. IEICE Trans. 2017, J100-A, 161–168. [Google Scholar]
- Mahto, S.; Arakawa, T.; Koshinaka, T. Ear Acoustic Biometrics Using Inaudible Signals and Its Application to Continuous User Authentication. In Proceedings of the 26th European Signal Processing Conference, Rome, Italy, 3–7 September 2018. [Google Scholar]
- Gao, Y.; Wang, W.; Phoha, V.V.; Sun, W.; Jin, Z. EarEcho: Using Ear Canal Echo for Wearable Authentication. Proc. ACM Interact. Mob. Wearable Ubiquitous Technol. 2019, 3, 81:1–81:24. [Google Scholar] [CrossRef]
- Henrik, M. Fundamentals of binaural technology. Appl. Acoust. 1992, 36, 171–218. [Google Scholar]
- Wenzel, E.M.; Arruda, M.; Kistler, D.J.; Wightman, F.L. Localization using non-individualized head-related transfer functions. J. Acoust. Soc. Am. 1993, 94, 111–123. [Google Scholar] [CrossRef] [PubMed]
- Jens, B. Spatial Hearing; MIT Press: Cambridge, MA, USA, 1997. [Google Scholar]
- Yano, S.; Hokari, H.; Shimada, S. A Study on the Personal Difference in the Transfer Functions of Sound Localization Using Stereo Earphones. IEICE Trans. Fundam. 2000, E83-A, 877–887. [Google Scholar]
- Platt, J.C. Probabilistic Outputs for Support Vector Machines and Comparisons to Regularized Likelihood Methods. In Advances in Large Margin Classifiers; MIT Press: Cambridge, MA, USA, 1999; pp. 61–74. [Google Scholar]
- Wu, T.F.; Lin, C.J.; Weng, R.C. Probability Estimates for Multi-Class Classification by Pairwise Coupling. J. Mach. Learn. Res. 2004, 5, 975–1005. [Google Scholar]
- Pedregosa, F.; Varoquaux, G.; Gramfort, A.; Michel, V.; Thirion, B.; Grisel, O.; Blondel, M.; Prettenhofer, P.; Weiss, R.; Dubourg, V.; et al. Scikit-learn: Machine Learning in Python. J. Mach. Learn. Res. 2011, 12, 2825–2830. [Google Scholar]
- Chang, C.C.; Lin, C.J. LIBSVM: A library for support vector machines. ACM Trans. Intell. Syst. Technol. 2011, 2, 27:1–27:27. [Google Scholar] [CrossRef]


Publisher’s Note: MDPI stays neutral with regard to jurisdictional claims in published maps and institutional affiliations. |
© 2022 by the authors. Licensee MDPI, Basel, Switzerland. This article is an open access article distributed under the terms and conditions of the Creative Commons Attribution (CC BY) license (https://creativecommons.org/licenses/by/4.0/).