1. Introduction
The occurrence of the novel coronavirus COVID-19 has produced changes in the indicators used for evaluating the airplane boarding methods [
1,
2,
3,
4]. In addition to the classical metric represented by the boarding time—namely the amount of time since the first passenger enters the aircraft and the last passengers occupies his/her assigned seat—highly used in non-pandemic situations (to which we are going to refer in the following as “normal times”), a series of health metrics have been proposed in the research literature for the times characterized by COVID-19, for the purpose of better evaluating the appropriateness of each boarding method for the new situation the world-wide air transportation industry was facing [
1,
5,
6]. These metrics refer to the calculus of a series of health risk indicators through which the risk of contracting the disease by the passengers involved in an airplane boarding process can be evaluated [
1,
7,
8,
9,
10,
11,
12].
As mentioned above, the research literature associated with the airplane boarding process pre-COVID-19 has been mainly focusing on answering the question:
What is the fastest airplane boarding method that will ensure the minimization of the airplane turnaround time? [
9]. To answer this question, a series of assumptions have been made regarding passengers boarding, such as the passengers’ movement inside the aircraft [
13,
14], passengers’ personal characteristics [
15,
16,
17], the presence or absence of passenger groups [
18], the type and the quantity of the hand luggage [
13,
17,
18,
19,
20], the occurrence of boarding interferences—namely the situations in which either the passengers are blocking the aisle while loading luggage in the overhead compartment (also called aisle interference) or the passengers are interacting with other passengers already seated on the same row as their allocated seat, when they need to make space to allow the other passengers to occupy their allocated seats (known as type-1, type-2, type-3, or type-4 seat interferences—as presented later on in this paper) [
16,
18,
21,
22,
23]. In addition to these assumptions, some research papers have extracted data from field trials [
24,
25], which have been used in calibrating the models for comparing different boarding methods in terms of boarding time. The boarding time has been the performance metric employed in the pre-COVID-19 situations in which improvements of the classical boarding methods have been proposed in the scientific literature [
13,
18,
19,
20,
22,
23,
26,
27,
28,
29].
Throughout the COVID-19 pandemic, the research question accompanying the scientific literature dedicated to airplane boarding process has been:
What is the safest airplane boarding method that ensures a short boarding time? [
4,
9,
11]. For answering this question, the airplane boarding methods used by the airline companies have been tested while accounting for the imposed social distancing measures represented by leaving the middle seat empty [
4,
11] or by keeping only 50% of the seats occupied in the airplane [
1], and imposing a minimum 1–2 m social distance among the passengers while walking down the aisle to their assigned seats [
1,
6,
12]. The performance evaluation of the boarding methods used by airplanes or proposed in the research literature for the COVID-19 times has been made through the use of health risk indicators (e.g., aisle seats risk, window seat risk, number of seat interferences, transmission risk, etc.) [
2,
5,
6,
30].
As the signals regarding the recovery of the global aviation industry have been pointed out in the recent research literature [
31,
32], there is an expected return to business-as-usual after COVID-19 in the near future [
33,
34]. In this context, the lessons learned from the COVID-19 pandemic should not be left behind as the occurrence of another epidemic, pandemic, or endemic situations might arise unexpectedly any time. As in the case of COVID-19, in the future, it also might take some time between the moment an epidemic arises and the time it is well acknowledged by the medical scientific community. To be prepared for such situations, which might arise unexpectedly, the airlines could try to proactively address these cases by selecting and using in practice boarding methods that consider the passengers’ health risk along with a reduced boarding time. Furthermore, even without a pandemic, epidemic, or endemic situation, there are advantages in providing passengers with less exposure to other passengers who might have any number of contagious illnesses (e.g., influenza, common cold).
As a result, the present paper analyzes some of the most common airplane boarding methods employed in normal times (with all seats occupied and no imposed aisle social distance of 1–2 m) from the perspective of the passengers’ health risk. To provide a proper comparison between the selected boarding methods, the risk indicators used for the evaluation of the boarding methods in times of COVID-19 are adapted for the normal times. Additionally, some new health risk indicators are proposed, which have been especially created for the case of normal times in which the middle seats are not kept empty. In addition to the health risk indicators, the boarding time is provided for each of the considered airplane boarding methods for the purpose of offering the airlines the possibility to consider both the risk and the boarding time when making their decision related to the use of a particular boarding method in practice. Furthermore, the results of the present research can be used in epidemic, pandemic, or endemic situations by the airlines that decide not to consider the imposed social distancing measures—as it has happened even in the case of COVID-19, when some airlines have not respected the imposed social distancing measures inside the aircraft—e.g., America Airlines, which has announced that their seats will be filled as much as they can in these times, not keeping the middle seats empty [
9,
10].
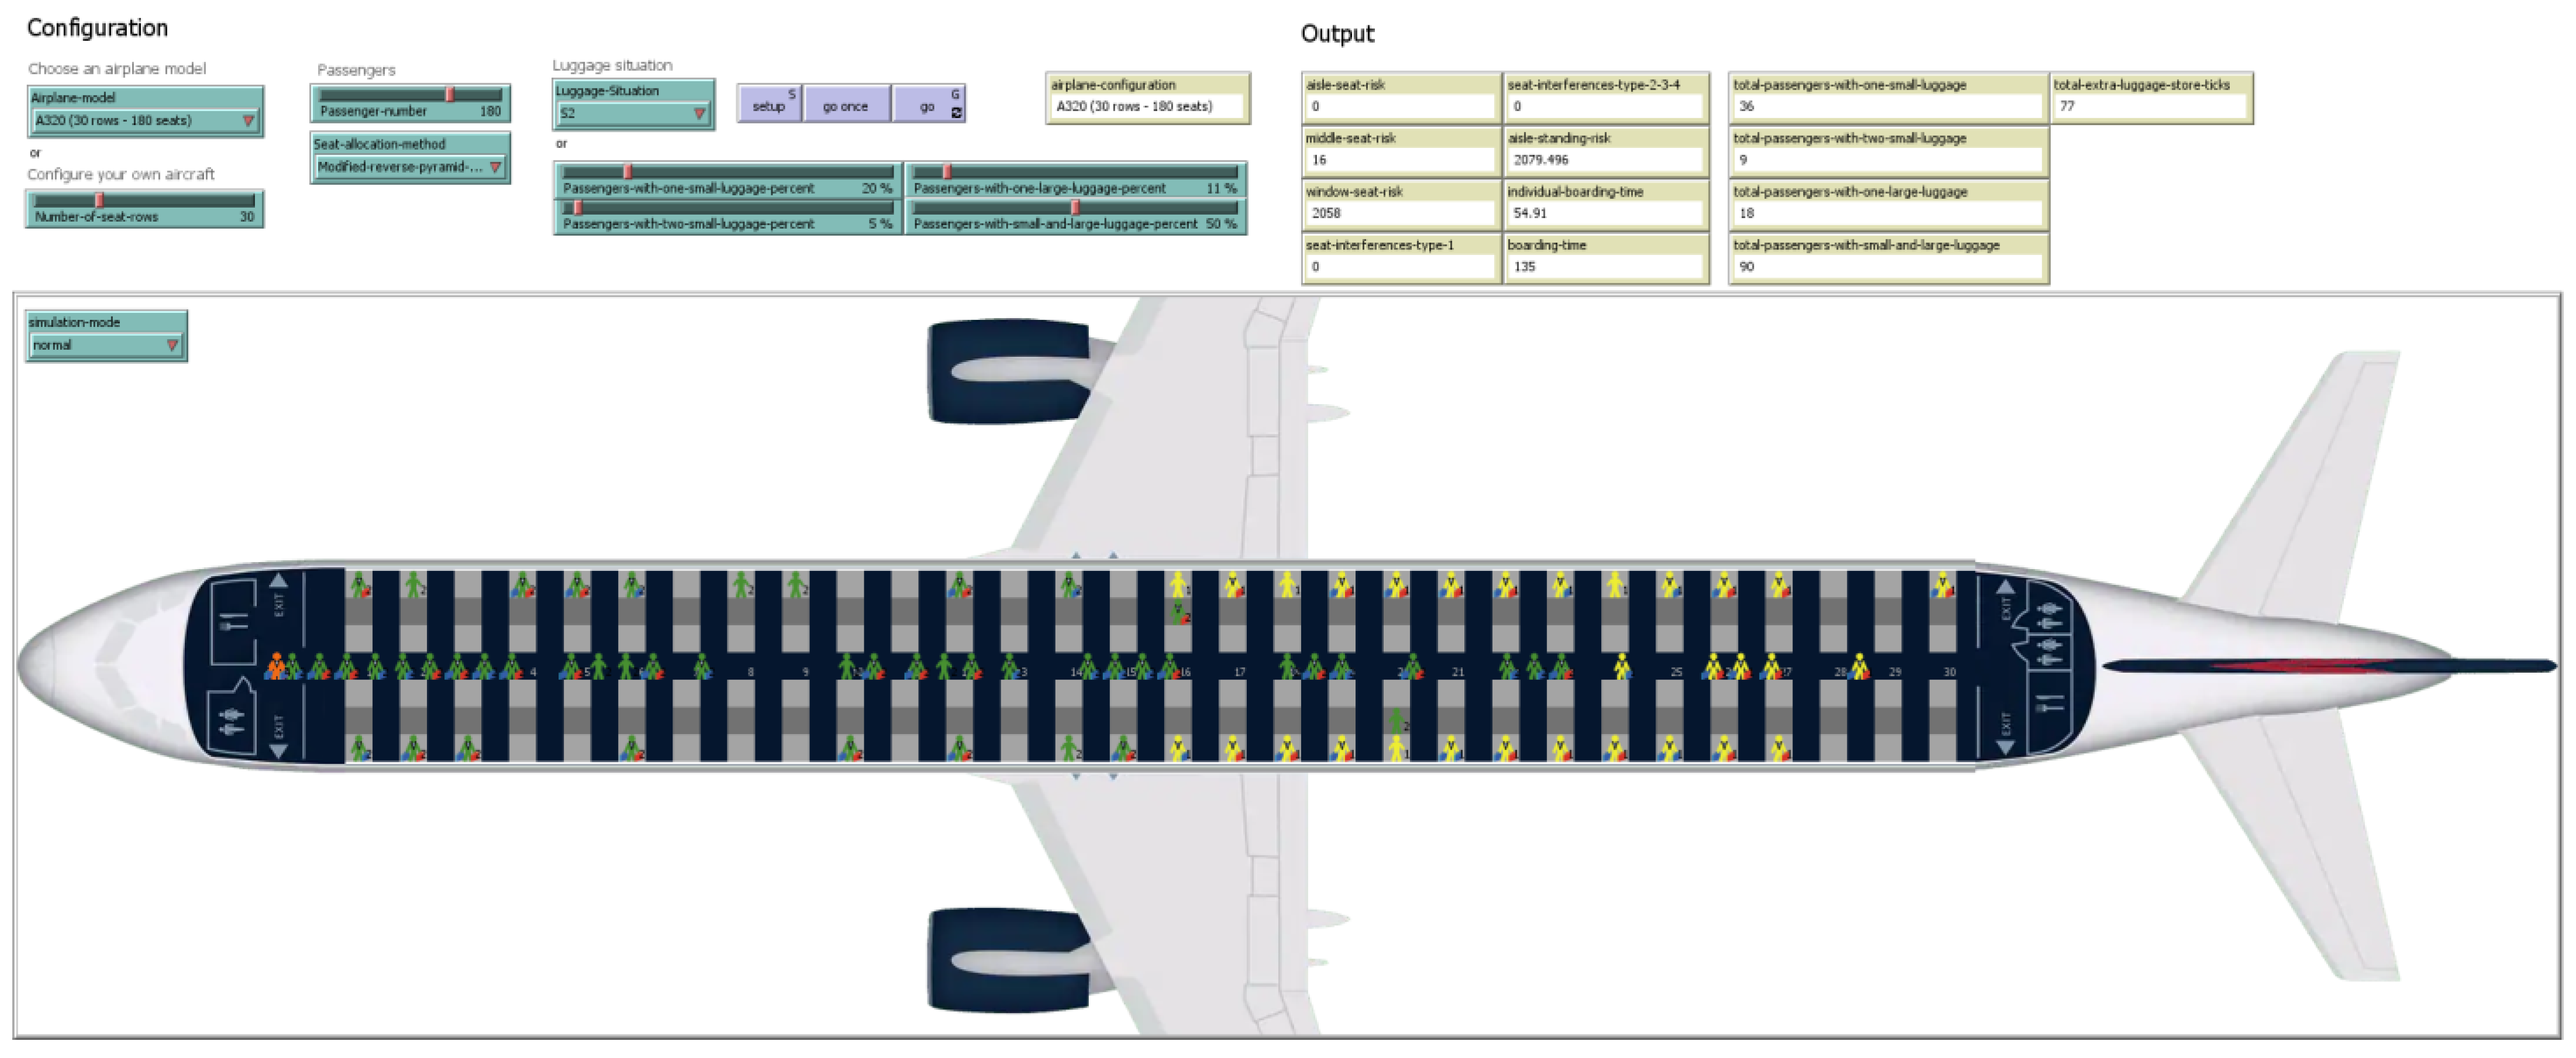
For comparing the considered airplane boarding methods, we created an agent-based model in NetLogo and calibrated it using the measurements made in the literature from field trials [
24,
25]. A narrow airplane, Airbus A320, with 30 rows and 6 seats per row is used in the simulations as suggested by [
21,
23,
29,
35,
36,
37]. Even though the principles and conclusions in this paper apply to more airplanes than the A320 aircraft, we have chosen this airplane model for the same reasons mentioned by Bazargan [
21]: namely, it is the most common type of airplane used by the airlines and discussed in the scientific literature, enabling a proper comparison among the results obtained in various scientific papers. We assume that the airplane is occupied at its maximum capacity, being able to accommodate 180 passengers, as presented in
Figure 1.
The remainder of the paper is organized as follows:
Section 2 provides the schemes of the considered airplane boarding methods to be simulated and compared through the use of the metrics and scenarios provided in
Section 3 and through the simulations conducted with the agent-based model described in
Section 4. The results of the simulations are discussed in
Section 5, while the concluding remarks and further research directions are included in
Section 6. The paper is accompanied by videos representing simulations of the airplane boarding methods for the selected scenarios.
2. Airplane Boarding Methods
The airplane boarding methods considered are some of the most common boarding methods used world-wide by the airlines before the pandemic, either on all the flights or only on selected flights, as listed in
Table 1.
Most of the boarding methods are based on seat assignment where prior to boarding, the passengers know their allocated seat, usually being stamped on the boarding ticket. An exception is the open seating method where the passengers choose their seats after entering the airplane based on their preference [
38,
40].
When seats are assigned, in the scientific literature, three types of airplane boarding methods emerge based on the passengers’ entrance into the aircraft, namely
random,
by group, and
by seat. In the case of
random boarding with assigned seats, the passengers know the position of their seats in the aircraft and are called for boarding in a random manner, without considering their seat [
41,
42]. The
by group boarding methods divide the passengers prior to boarding into several groups depending on their seat positions in the aircraft and are called in each group for boarding according to some given rules. Some of the most-known by group methods are: back-to-front, WilMA, reverse pyramid, modified optimal method, rotating zone, and non-traditional method [
29,
41,
43,
44]. Last, the
by seat boarding methods call the passengers one-by-one to board into the airplane based on their seat position, usually starting from the back of the airplane and by following some given rules. The methods included in this category are: Steffen, Variation in Steffen method, and By seat descending order [
13,
43].
As it can be observed from
Table 1, in practice, only
random (random with assigned seats) and
by group (WilMA, back-to-front-by-group, back-to-front-by-row, reverse pyramid) methods are used by airlines. The
by seat methods are hard to implement in practice due to the additional support staff needed for airlines to invite the passengers one-by-one to board.
The rules accompanying the methods in
Table 1 are presented in the following for each airplane boarding method.
2.1. Open Seating Method
When the open seating method is used, the passengers do not have assigned seats. Once the passengers arrive inside the aircraft, they select from the unoccupied seats based upon their preference.
2.2. Random with Assigned Seats
In the random with assigned seats method, the passengers know their seats prior to boarding. The seats are either allocated by the system when the check-in is performed online or in the airport or they are selected by the passengers based on their preferences when completing the check-in. The passengers admission into the airplane is completed in a random manner. Once arrived inside the aircraft, each passenger proceeds to his/her assigned seat.
2.3. WilMA
The WilMA boarding method derives its name from the initials of the three groups in which the passengers are divided prior to boarding: window (W), middle (M), and aisle (A). The method is also known as Outside-in as the three groups are formed based on the seat positions (near the window, middle seats, or near the aisle seats) and are called for boarding starting from the seats located as close as possible to the margins of the airplane (window) to the seats located near the center of the airplane (aisle).
Figure 2 depicts the scheme for this boarding method.
2.4. Back-to-Front-by-Group Boarding Method
The back-to-front-by-group boarding method divides the passengers into groups based on the rows of their seats. The first group of passengers to board is formed by the passengers having their seats located closest to the rear of the airplane. The next group is composed of the passengers with seats as close to the rear of the airplane that have not been allocated to the first group. The last group to board has the seats located nearest to the front of the airplane.
Depending on the airline boarding strategy and the length (number of rows) of the airplane, the back-to-front-by-group boarding method may use from three to five groups.
Figure 3 presents the groups formed when the back-to-front-by-group method features the division of the passengers into three groups,
Figure 4 shows a division into four groups, and
Figure 5 shows a division into five groups. Once the groups are formed, the passengers with seat rows within the mentioned groups are called-in for boarding in a random manner within each group.
2.5. Back-to-Front-by-Row Boarding Method
In the back-to-front-by-row boarding method, the first group of passengers to board are located in the row closest to the rear of the airplane. The next group has the seats in the second-to-last row of the airplane. The final group to board has the seats in the first row of the airplane.
Figure 6 presents the boarding scheme for this method, wherein 30 groups (one per row) are called to board in sequence. Each of these groups has six passengers.
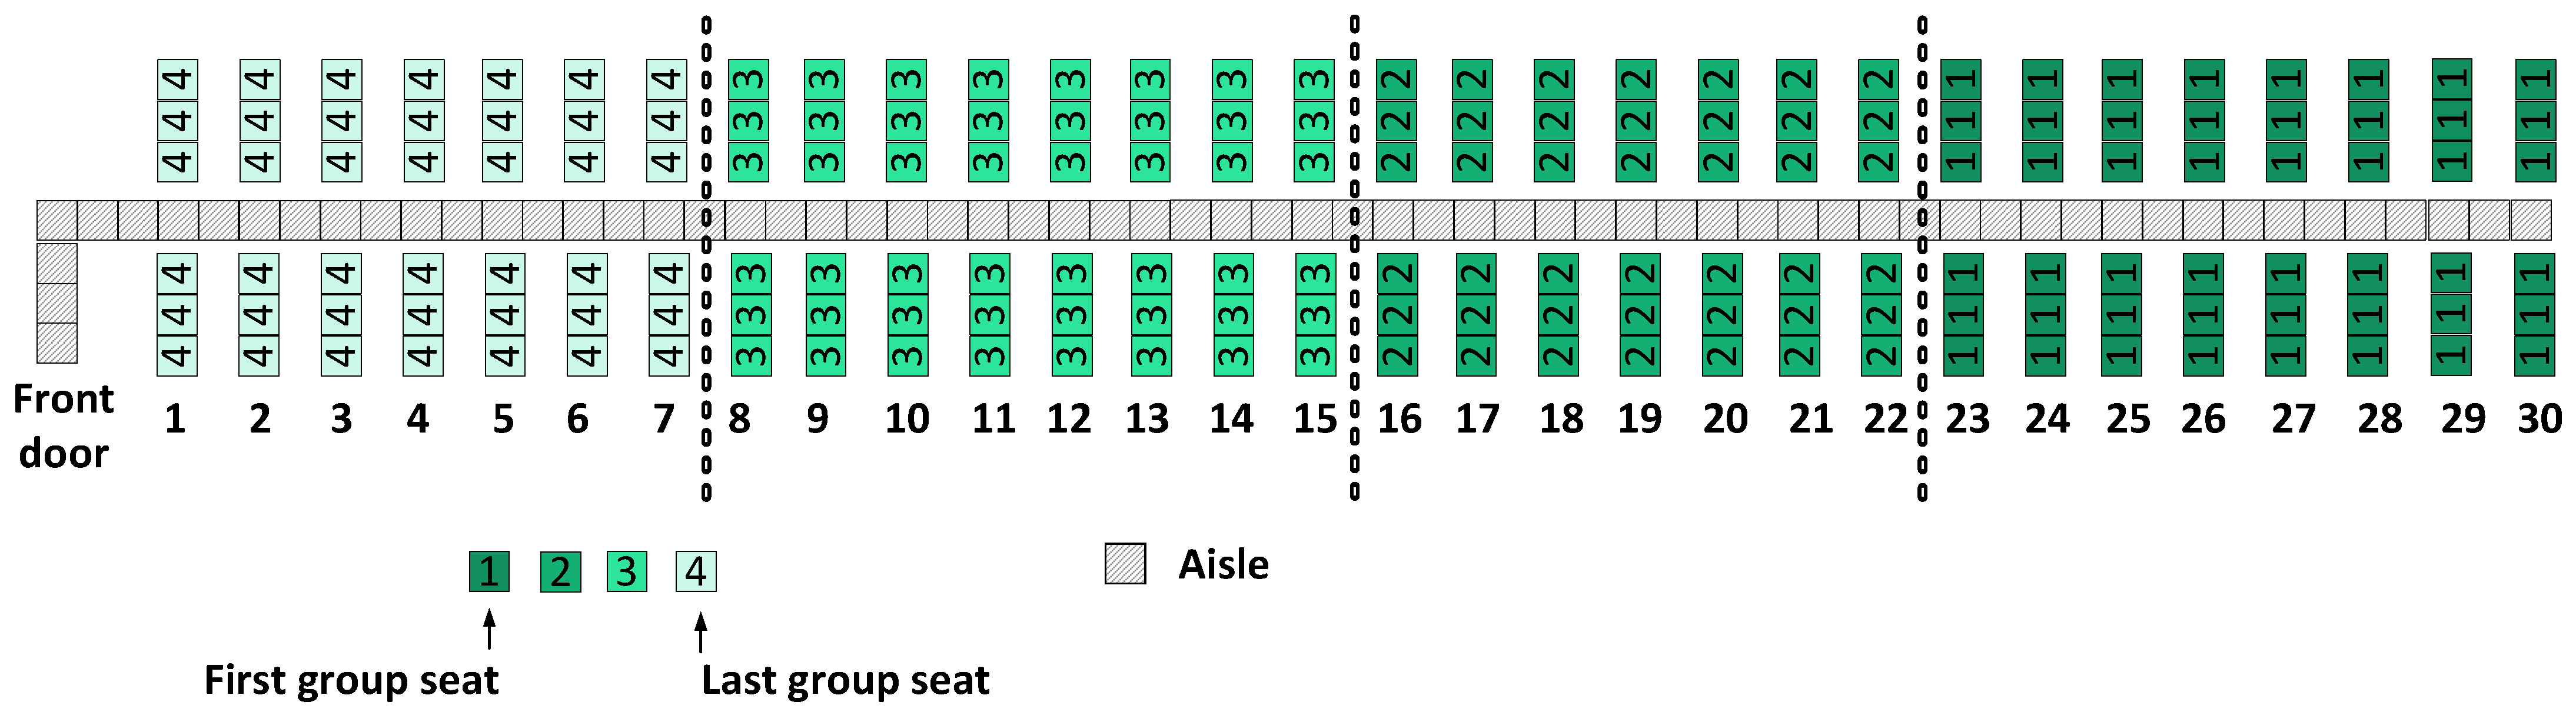
2.6. Reverse Pyramid
The original reverse pyramid boarding method was proposed by Van den Briel et al. [
29] and divides the passengers into five groups based on their seat locations. Over time, the method has proven its efficiency in diminishing the airplane boarding time as the passengers interfere with each other at a minimum level when taking their assigned seats.
The reverse pyramid method used in this paper is a variation of the original reverse pyramid boarding scheme; in our paper and other works, the method involves four boarding groups of passengers [
45]. The first group to board has window seats in the rear half of the airplane, while the last group to board has aisle seats in the front half of the airplane. The remaining groups (2 and 3) board in a diagonal scheme: each group fills the remaining seats closest to the window and in the rear half of the airplane for one seat type (middle for group 2 and aisle for group 3). This boarding scheme is illustrated for our case in
Figure 7.
5. Simulation Results
Each airplane boarding method has been simulated 10,000 times for each luggage scenario, resulting a number of 560,000 simulations for which the results have been reported in the following by using the average value, rounded to the nearest integer. For performing the simulations, the BehaviourSpace tool provided by NetLogo [
51,
62] has been used both for setting up the experiments and for running them. The results are reported for each health metric. A discussion is made based on the health metrics results and the boarding time reported for each airplane boarding method in a given luggage scenario.
5.1. Numerical Results for Aisle Seat Risk
The overall risk experienced by the passengers with aisle seats who have already taken their seats while other passengers are still moving down the aisle to their assigned seats is measured through the aisle seat risk indicator.
Table 3 presents the average aisle seat risk for each of the boarding methods as a function of the luggage scenario. These results are based on agent-based simulations (rounded to the nearest integer and expressed in seconds). For all the boarding methods, this risk decreases as the quantity of luggage brought in the airplane by the passengers decreases from the high-luggage scenario S
1 to the no-luggage scenario S
7.
For each of the seven luggage scenarios, the best and third best-performing methods according to this criterion are the reverse pyramid and WilMA boarding methods, respectively. (We highlight the best value of each luggage scenario in bold font within the table.) These two methods share a common attribute of boarding all aisle seat passengers after all window and middle seat passengers have boarded. This means that their aisle seat passengers have aisle seat risk only from other aisle seat passengers. Observe that with WilMA, all 60 aisle seat passengers board in one group whereas with reverse pyramid, there are 30 aisle seat passengers in group 3 and the other 30 aisle seat passengers in group 4. With reverse pyramid, the passengers in group 3 have aisle seat risk only from other group 3 passengers, and similarly, its group 4 passengers have aisle seat risk only from other group 4 passengers. The division of aisle seat passengers into two groups essentially halves the number of passengers potentially causing aisle seat risk. For each luggage scenario, the aisle seat risk of reverse pyramid is approximately half that of WilMA. The relationship is not exact because aisle seat risk is a time-based metric and thus influenced by the passengers’ boarding dynamics over time and not solely by the number of potential interactions. The implication of boarding dynamics is illustrated by the fact that for each of these two boarding methods, the high-luggage scenario S1 results in about twice as much aisle seat risk as the no-luggage scenario S7.
While those two methods have an advantage with aisle seat risk from their aisle seat passengers boarding last, the second-best performing method, back-to-front-by-row, has an advantage in that its aisle seat risks result only from passengers assigned seats in the same row. Due to the boarding dynamics, those passengers in the same row may be standing in that row’s aisle a long time due to seat interferences. Overall, the back-to-front-by row method provides an increased aisle seat risk compared to reverse pyramid by up to 80.38%.
The back-to-front-by-5-groups, back-to-front-by-4-groups, and back-to-front-by-3-groups are the 4th, 5th, and 6th best-performing methods for aisle seat risk, respectively. Their relative performance stems from the same advantage that reverse pyramid has over WilMA: namely, the fewer number of passengers who can breathe near each other, the lower that risk.
Even higher values for this risk are reported for the open seating and random with assigned seats methods. The latter method has the worst aisle seat risks. The increased risks vary from 716.53% (with S1) to 1072.44% (with S7) compared to the same luggage scenarios when the reverse pyramid method is used.
5.2. Numerical Results for Middle Seat Risk
The middle seat risk indicator measures the overall risk experienced by the passengers with middle seats as a result of potentially contagious passengers proceeding down the aisle to their assigned sets. The values obtained through simulations in all the luggage scenarios are presented in
Table 4.
While boarding aisle seat passengers last helped the reverse pyramid and WilMA with aisle seat risk, it worsened their performance with middle seat risk. As indicated in
Table 4, the back-to-front-row method results in the smallest values of middle seat risk followed by back-to-front-by-5-groups, back-to-front-by-4-groups, and back-to-front-by-3-groups respectively. The variations in the value of this risk for the back-to-front-by-row method resulted in 60.38% more middle seat risk with the high-luggage scenario S1 than with the no-luggage scenario S7.
The reverse pyramid method performed better than WilMA again, this time due to its middle seat passengers being divided into two boarding groups as opposed to the one group of WilMA. For this metric, WilMA’s performance was the second worst for the no-luggage scenario S7 and the third worst for the other luggage scenarios, swapping places in the open seating method, which was the third and second worst method for those scenarios, respectively.
The highest values for the middle seat risk results from the random with assigned seats method. For this method, we observed that its middle seat risk is lower for each luggage scenario than its corresponding aisle seat risks. We explain why as follows. Within a particular row and side of the airplane, there is an equal chance of any particular passenger (aisle, middle, or window) boarding first, second, or third. However, the different types of seat interferences influence the risk to aisle seat passengers differently than middle seat passengers. Aisle seat passengers need to leave their seats for type-1, type-3, and type-4 seat interferences whereas middle seat passengers need to leave their seats only for type-1 and type-2 seat inferences. The time spent clearing the path for a later boarding passenger is included within the aisle and middle seat risks. Consequently, the aisle seat passengers incur a greater duration risk for a subsequent passenger in the aisle of that row than the middle seat passengers. In the same manner, the window seat risk (which will be discussed in the following subsection) is lower than the middle seat risk. That is because a passenger seated next to the window never needs to leave the seat to clear a path for any later boarding passengers. Consequently, the window seat passengers incur increased risk duration only for the type-4 seat interference.
5.3. Numerical Results for Window Seat Risk
Back-to-front-by-row provides the smallest value for the window seat risk in all the luggage scenarios, as illustrated in
Table 5. For this method, the window seat risk for the high-luggage scenario S1 is 82.79% higher than the no-luggage scenario S7. The middle seat risk with this method varies between 18.41% and 34.95% higher than the corresponding window seat risk depending on the luggage scenario. As implied by the discussion of the previous subsection, seat interferences contribute to the differences.
The airplane boarding methods featuring a back-to-front-by-group approach score the second, third, and fourth best values for the window seat risk, in the same sequence as with the other two seat risks. The reverse pyramid method has the fourth worst results for window seat risk. WilMA provides the third worst results for luggage scenario S7 and the second worst results for the other six scenarios, the reverse being true for the random with assigned seats method.
The open seating method provides the highest values of the window seat risk for all luggage scenarios. This is due to the passengers’ preferences for window seats located near the front door of the airplane. After sitting down in those window seats, the passengers will be passed by many later boarding passengers.
5.4. Numerical Results for Seat Interferences
We first discuss the results for the total number of seat interferences that involve two passengers (namely the aisle and middle seat passengers) needing to leave their seat to clear space for a later boarding passenger (namely the window seat passenger) to sit. This is the type-1 seat interference. Secondly, we will discuss the total number of seat inferences that involve exactly one passenger (either the aisle or the middle seat passenger) needing to leave their seat to clear space for a later boarding passenger. These are the type-2, type-3, and type-4 seat interferences that we will total because they all involve one passenger leaving a seat to clear space for a later boarding passenger.
5.4.1. Numerical Results for Total Number of Type-1 Seat Interferences
The total number of type-1 seat interferences is zero for reverse pyramid and WilMA—
Table 6. This situation occurs because the window seat passengers of a given row always board before any other passengers in that row. For the open seating method, the values appear to be zero in
Table 6, because the results have been rounded to the nearest integer; however, if decimal places had been included in the table, then the reported values would have been near zero. This is due to it being rare that a passenger will prefer a middle seat on the airplane and furthermore due to the predilection for passengers to prefer window seats most often when the aisle and middle seats are empty. The rare condition would occur when a passenger strongly prefers a window seat in a row and side of the airplane where the aisle and middle seat passengers are already seated.
For the other boarding methods, in each row and side of the airplane, it is equally likely that the aisle, middle, or window seat passenger is the last to board the airplane. The means that
of the time, that final passenger of the three to board will have the window seat. With 30 rows and two sides of the airplane, there would be an average of 30 × 2 ×
= 20 type-1 seat interferences for those other boarding methods, which matches the results in
Table 6 for each luggage scenario. Another way to view this is illustrated in
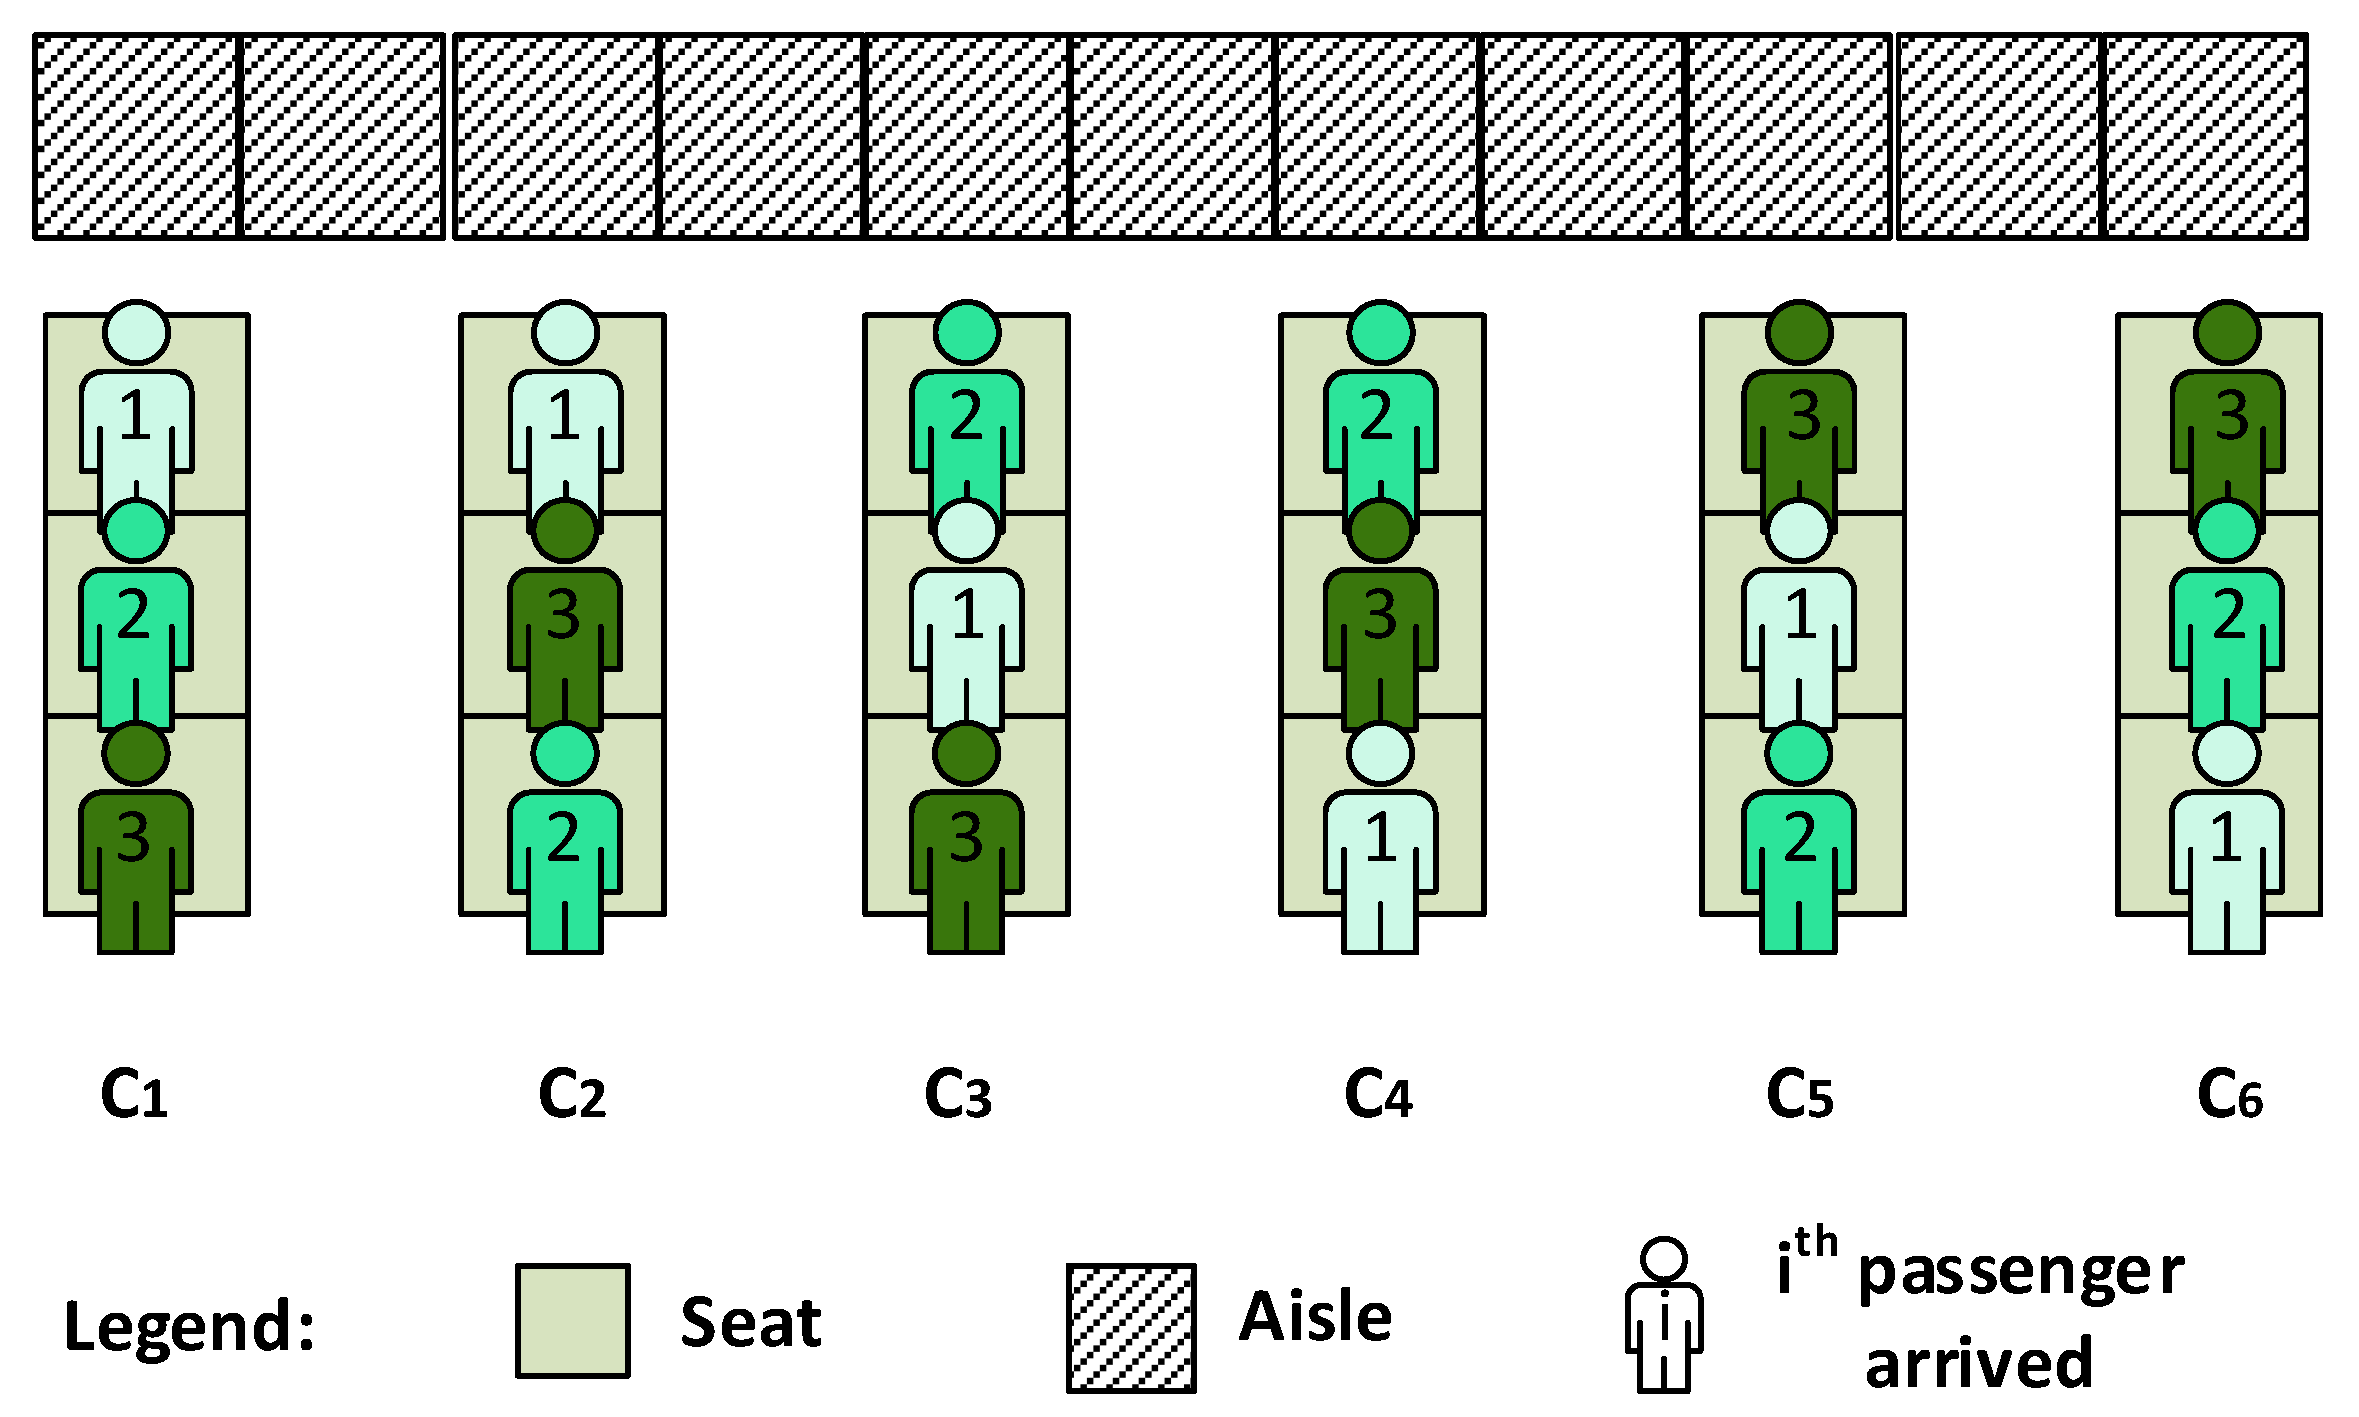
Figure 11, which shows the six possible sequences (cases) in which the three passengers for each side of an airplane’s row would board the airplane.
Each of the six sequences (cases) has a probability of of occurring when the sequence is randomly generated such as during a computer simulation run. Among these cases, only C1 and C3 involve type-1 seat interferences. As a result, of the six cases on each side of a row results in a type-1 seat interference. So, again, we have 30 row × 2 sides × = 20 type-1 seat interferences for those other boarding methods.
5.4.2. Numerical Results for Total Number of Type-2-3-4 Seat Interferences
The total number of type-2-3-4 seat interferences is zero for reverse pyramid and WilMA—
Table 7. These methods board in the C
6 sequence, which involves no seat interferences.
All but one of the remaining boarding methods averages 50 seat interferences of type-2, type-3, and type-4. For these methods, type-2 seat interferences result from case C
5, and type-3 seat interferences result from case C
2, while type-4 seat interferences result from cases C
1, C
2, and C
4. This is a total of five case occurrences for each of the 30 rows and two sides of the airplane, resulting in 30 × 2 ×
= 50 occurrences combined of type-2, type-3, and type-4 seat interferences, as shown for the average values in
Table 7.
A higher value for window seat risk is reported for the open seating method, where 53 cases combined of type-2, type-3, and type-4 seat interferences are reported. The increased number of these seat interferences compared to random methods is a consequence of the fact that the passengers boarding in an open seating approach tend to choose more of the window seats, which decreases the number of type-1 seat interferences (C1 and C3), increases the number of C2 and C5 cases, and highly increases the number of C4 and C6 cases. The total number of type-2, type-3, and type-4 seat interferences is highly dependent on the passengers’ preference to the position of certain seats in the airplane and the agglomeration degree, and its value might change were the passengers to have different preferences.
5.5. Numerical Results for Aisle Standing Risk
The numerical results for the aisle standing risk are reported in
Table 8. For this metric, the best-performing method is WilMA, which is followed closely by reverse pyramid. Both of these methods work well as they avoid seat interferences and spread the passengers of each group over a large number of rows. Those attributes lead to less congestion in the aisle, leading to fewer and briefer occurrences of a passenger proceeding down the aisle being impeded by the (slower) progress of the previous passenger to board. While the passengers of each group are assigned to a single seat type (window, middle, or aisle) with both methods, WilMA performs better than reverse pyramid. This situation occurs due to the fact that the passengers of each of the former method’s groups is spread across all 30 rows of the airplane, whereas that is true for two of the latter method’s four boarding groups with its first and last groups spread across half the rows of the airplane. The presence of hand luggage influences the value of this risk for both methods. For WilMA, the change in the quantity of luggage, from S
7 to S
1, increases the aisle standing risk by 92.41%. A similar increasement, of 91.10%, is reported for the reverse pyramid boarding method when comparing S
7 to S
1.The third and fourth best methods for this risk are open seating and random with assigned seats, which have an increasement ranging between 20.35 and 48.93%, respectively, and between 39.44 and 84.19%, when compared to WilMA.
The highest values for this risk result from the back-to-front-by-row, back-to-front-by-5-groups, back-to-front-by-4-groups, and back-to-front-by-3-groups, and back-to-front-by-row, in that sequence. These methods have the least spread across rows per boarding group and the most congestion in the aisle. The worst performing back-to-front-by-row method has a value for this risk that varies between 195.98% to 296.91% higher than the best-performing method, WilMA.
5.6. Numerical Results for Individual Boarding Time
The best (and equally good) individual boarding times result from WilMA and reverse pyramid in each of the considered luggage scenarios—
Table 9. The increasement in the quantity and type of hand luggage brings an increasement of this risk of at most 94.59% (S
7 vs. S
1). The low values of the individual boarding times for these methods is related to the absence of seat interferences.
The remaining boarding methods, from best to worst, are the following in sequence: open seating, random with assigned seats, back-to-front-by-row, back-to-front-by-5-groups, back-to-front-by-4-groups, and back-to-front-by-3-groups, and back-to-front-by-row. This sequence of relative performance is identical to the sequence for aisle standing risk. Consequently, individual boarding time may be used as a proxy for aisle standing risk when comparing boarding methods. We mention this because individual boarding time would be easier to calculate than aisle standing risk and has an added advantage in that it bears a relationship with customer satisfaction due to passengers preferring shorter individual boarding times.
5.7. Discussion
The relative performance of the boarding methods obtained for the considered health risk metrics differs depending on the metric. None of the methods is best for all of the health indicators. Before discussing the health performance, we show the total boarding times (average time to complete boarding of the airplane) for the methods and luggage scenarios in
Table 10.
Reverse pyramid provides the fastest boarding time, followed by WilMA. The open seating method, random with assigned seats, and all three of the back-to-front-by-group methods provide similar boarding times with their results ranging between 454 and 885 s, depending on the quantity of hand luggage. The longest boarding process results from back-to-front-by-row, which provides a boarding time up to 148.58% higher than reverse pyramid.
Table 11 provides an ordinal ranking of the considered boarding methods for all the metrics based on the results obtained in the S
1 luggage scenario.
Based on the ranking in
Table 11, the reverse pyramid method performs best in five of the eight metrics, namely: aisle seat risk, type-1 seat interferences, type-2-3-4 seat interferences, individual boarding time, and time to complete the boarding process for all passengers. Furthermore, reverse pyramid performs nearly as well for aisle standing risk as that metric’s best method, WilMA. Moreover, we note that the two metrics for which reverse pyramid performs poorly, namely middle seat risk and window seat risk, may not be as important for health as aisle seat risk and the seat interferences given that the middle seat risk and window seat risk refer to risks of the passengers being further from other passengers than with the other health risks. As such, the reverse pyramid method should be seriously considered by airlines who prefer short times to complete the boarding of their airplanes while reducing health risks to their passengers.
Meanwhile, WilMA also performs well. It performs best for four of the metrics, namely, aisle standing risk, type-1 seat interferences, type-2-3-4 seat interferences, and individual boarding time. It performs second best for boarding time and third best for aisle seat risk. Its performance for middle seat risk and window seat risk is worse than reverse pyramid. Overall, WilMA performs well but not as well as reverse pyramid. WilMA may be the second-best method for most airlines.
Moderate results stem from the back-to-front-by-group methods. The back-to-front-by-5-groups airplane boarding method provides slightly better results than back-to-front-by-4-groups and back-to-front-by-3-groups for three risk indicators: aisle seat risk, middle seat risk, and window seat risk; meanwhile, they achieve the same results for type-1 seat interferences and type-2-3-4 seat interferences and worse results for the aisle standing risk, individual boarding time, and time to complete boarding of the airplane.
The back-to-front-by-row boarding method performs better than the back-to-front-by-group methods for aisle seat risk, middle seat risk, and window seat risk, the same for type-1 seat interferences and type-2-3-4 seat interferences, and worse for aisle standing risk, individual boarding time, and time to complete boarding of the airplane.
The open seating method performs better than the back-to-front methods for type-1 seat interferences, aisle standing risk, individual boarding time, and the time to complete boarding of the aircraft. The random with assigned seats method does not perform well enough on any metric to make it a good choice for airlines other than its ease of implementation.
6. Conclusions
As the restrictions for the airplane boarding process imposed by the occurrence of the novel coronavirus begin to wane, the challenge becomes how to reduce the health risks to passengers during normal (non-pandemic) times. In this paper, we analyzed through an agent-based approach the airplane boarding methods used in practice by the airlines in terms of the health metrics used during the pandemic situation and new health metrics that apply when there is no social distancing. In short, we provide an overview on the performance of the airplane boarding methods used in practice from a health perspective. Especially because epidemic situations might occur in the future before they are acknowledged by the medical scientific community, airlines may want to assess the health risks to their passengers when deciding upon an airplane boarding method.
Based on the numerical results of agent-based simulations, the reverse pyramid method provides favorable health outcomes for important metrics, while at the same time providing the shortest time to complete boarding of the airplane. Airlines interested in passenger health and short boarding times should seriously consider using the reverse pyramid method. The WilMA method may be the second-best boarding method, and random boarding with assigned seats may be the worst.
The best-performing airplane boarding method in
Table 11, reverse pyramid, has not been commonly used in practice by the airlines. To successfully use some of these best-performing boarding methods in practice, the airports need to offer additional infrastructure and to better monitor the entire boarding process. We conjecture that with the advancement of technology, in the near future, these impediments can be overcome, and the airlines can opt for the best-performing airplane boarding methods determined based on the considered health indicators.
Future research may consider alternative airplane configurations, groups of passengers that board together (e.g., families), and the use of apron buses rather than jet bridges for passengers to reach the airplane. Epidemiological research may examine how different types of diseases spread within an airplane. Additional boarding methods and health metrics may emerge.


