Measurement of the Speed of Induction Motors Based on Vibration with a Smartphone

 ,
,  ,
,  and
and 
Abstract
:1. Introduction
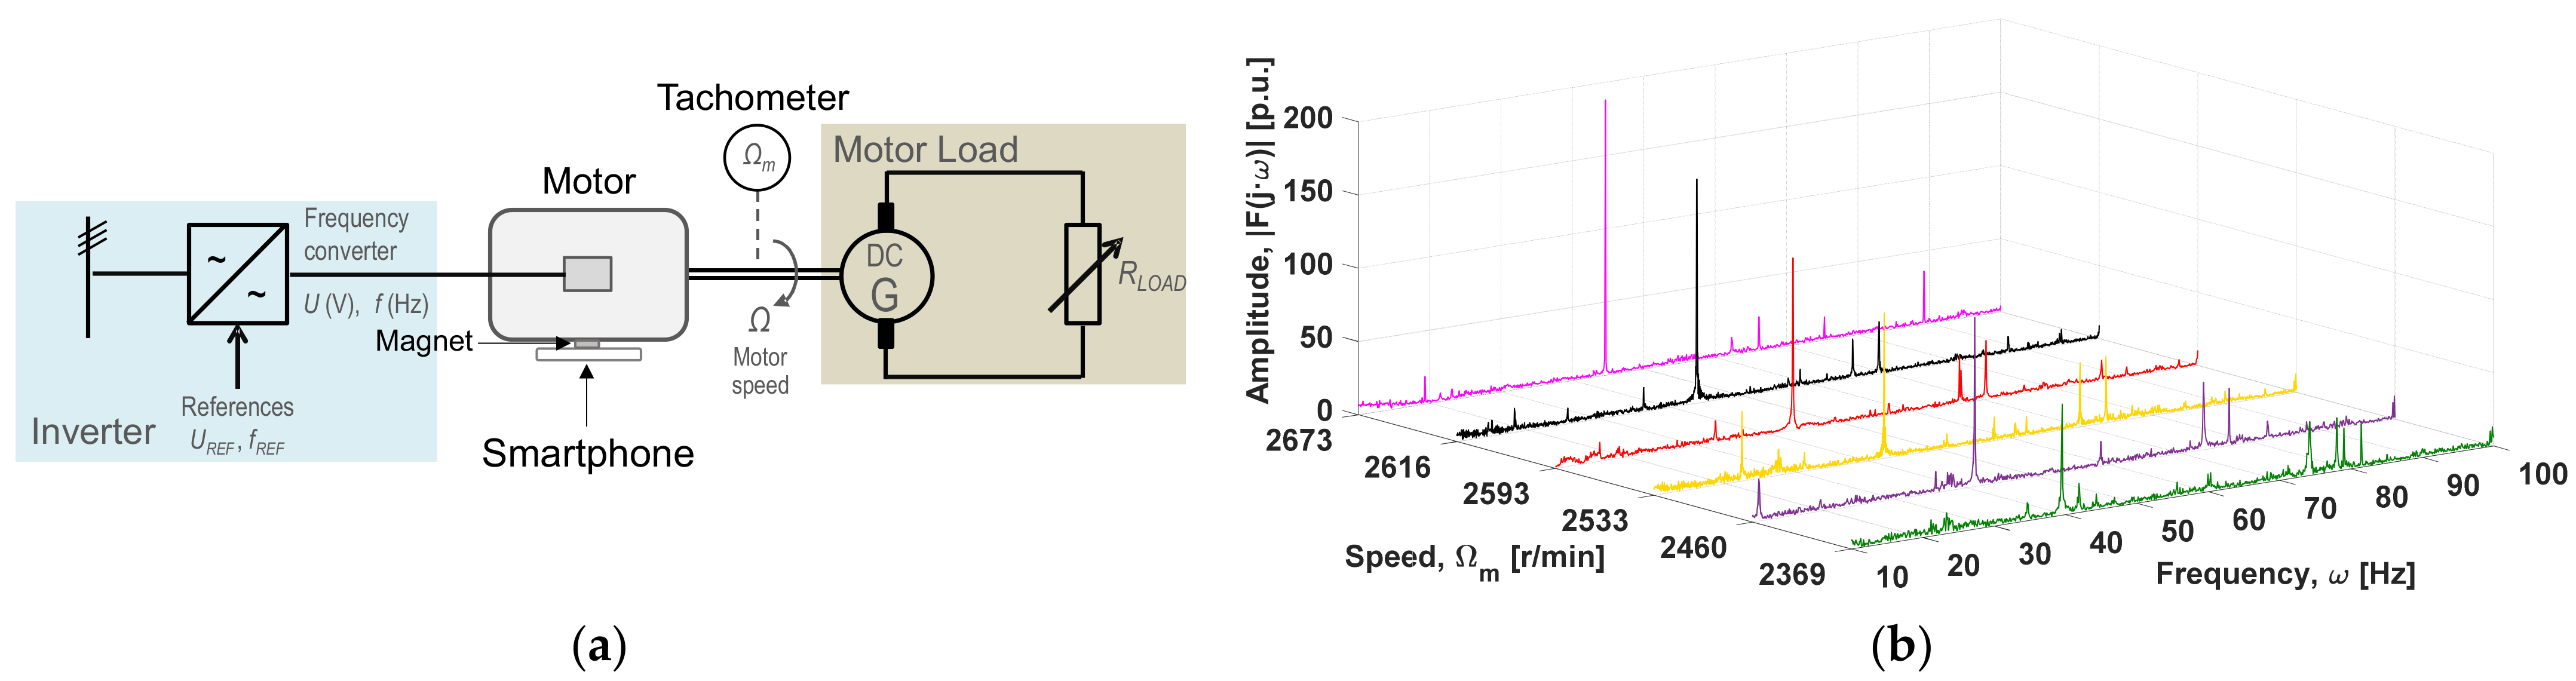
2. Materials and Methods
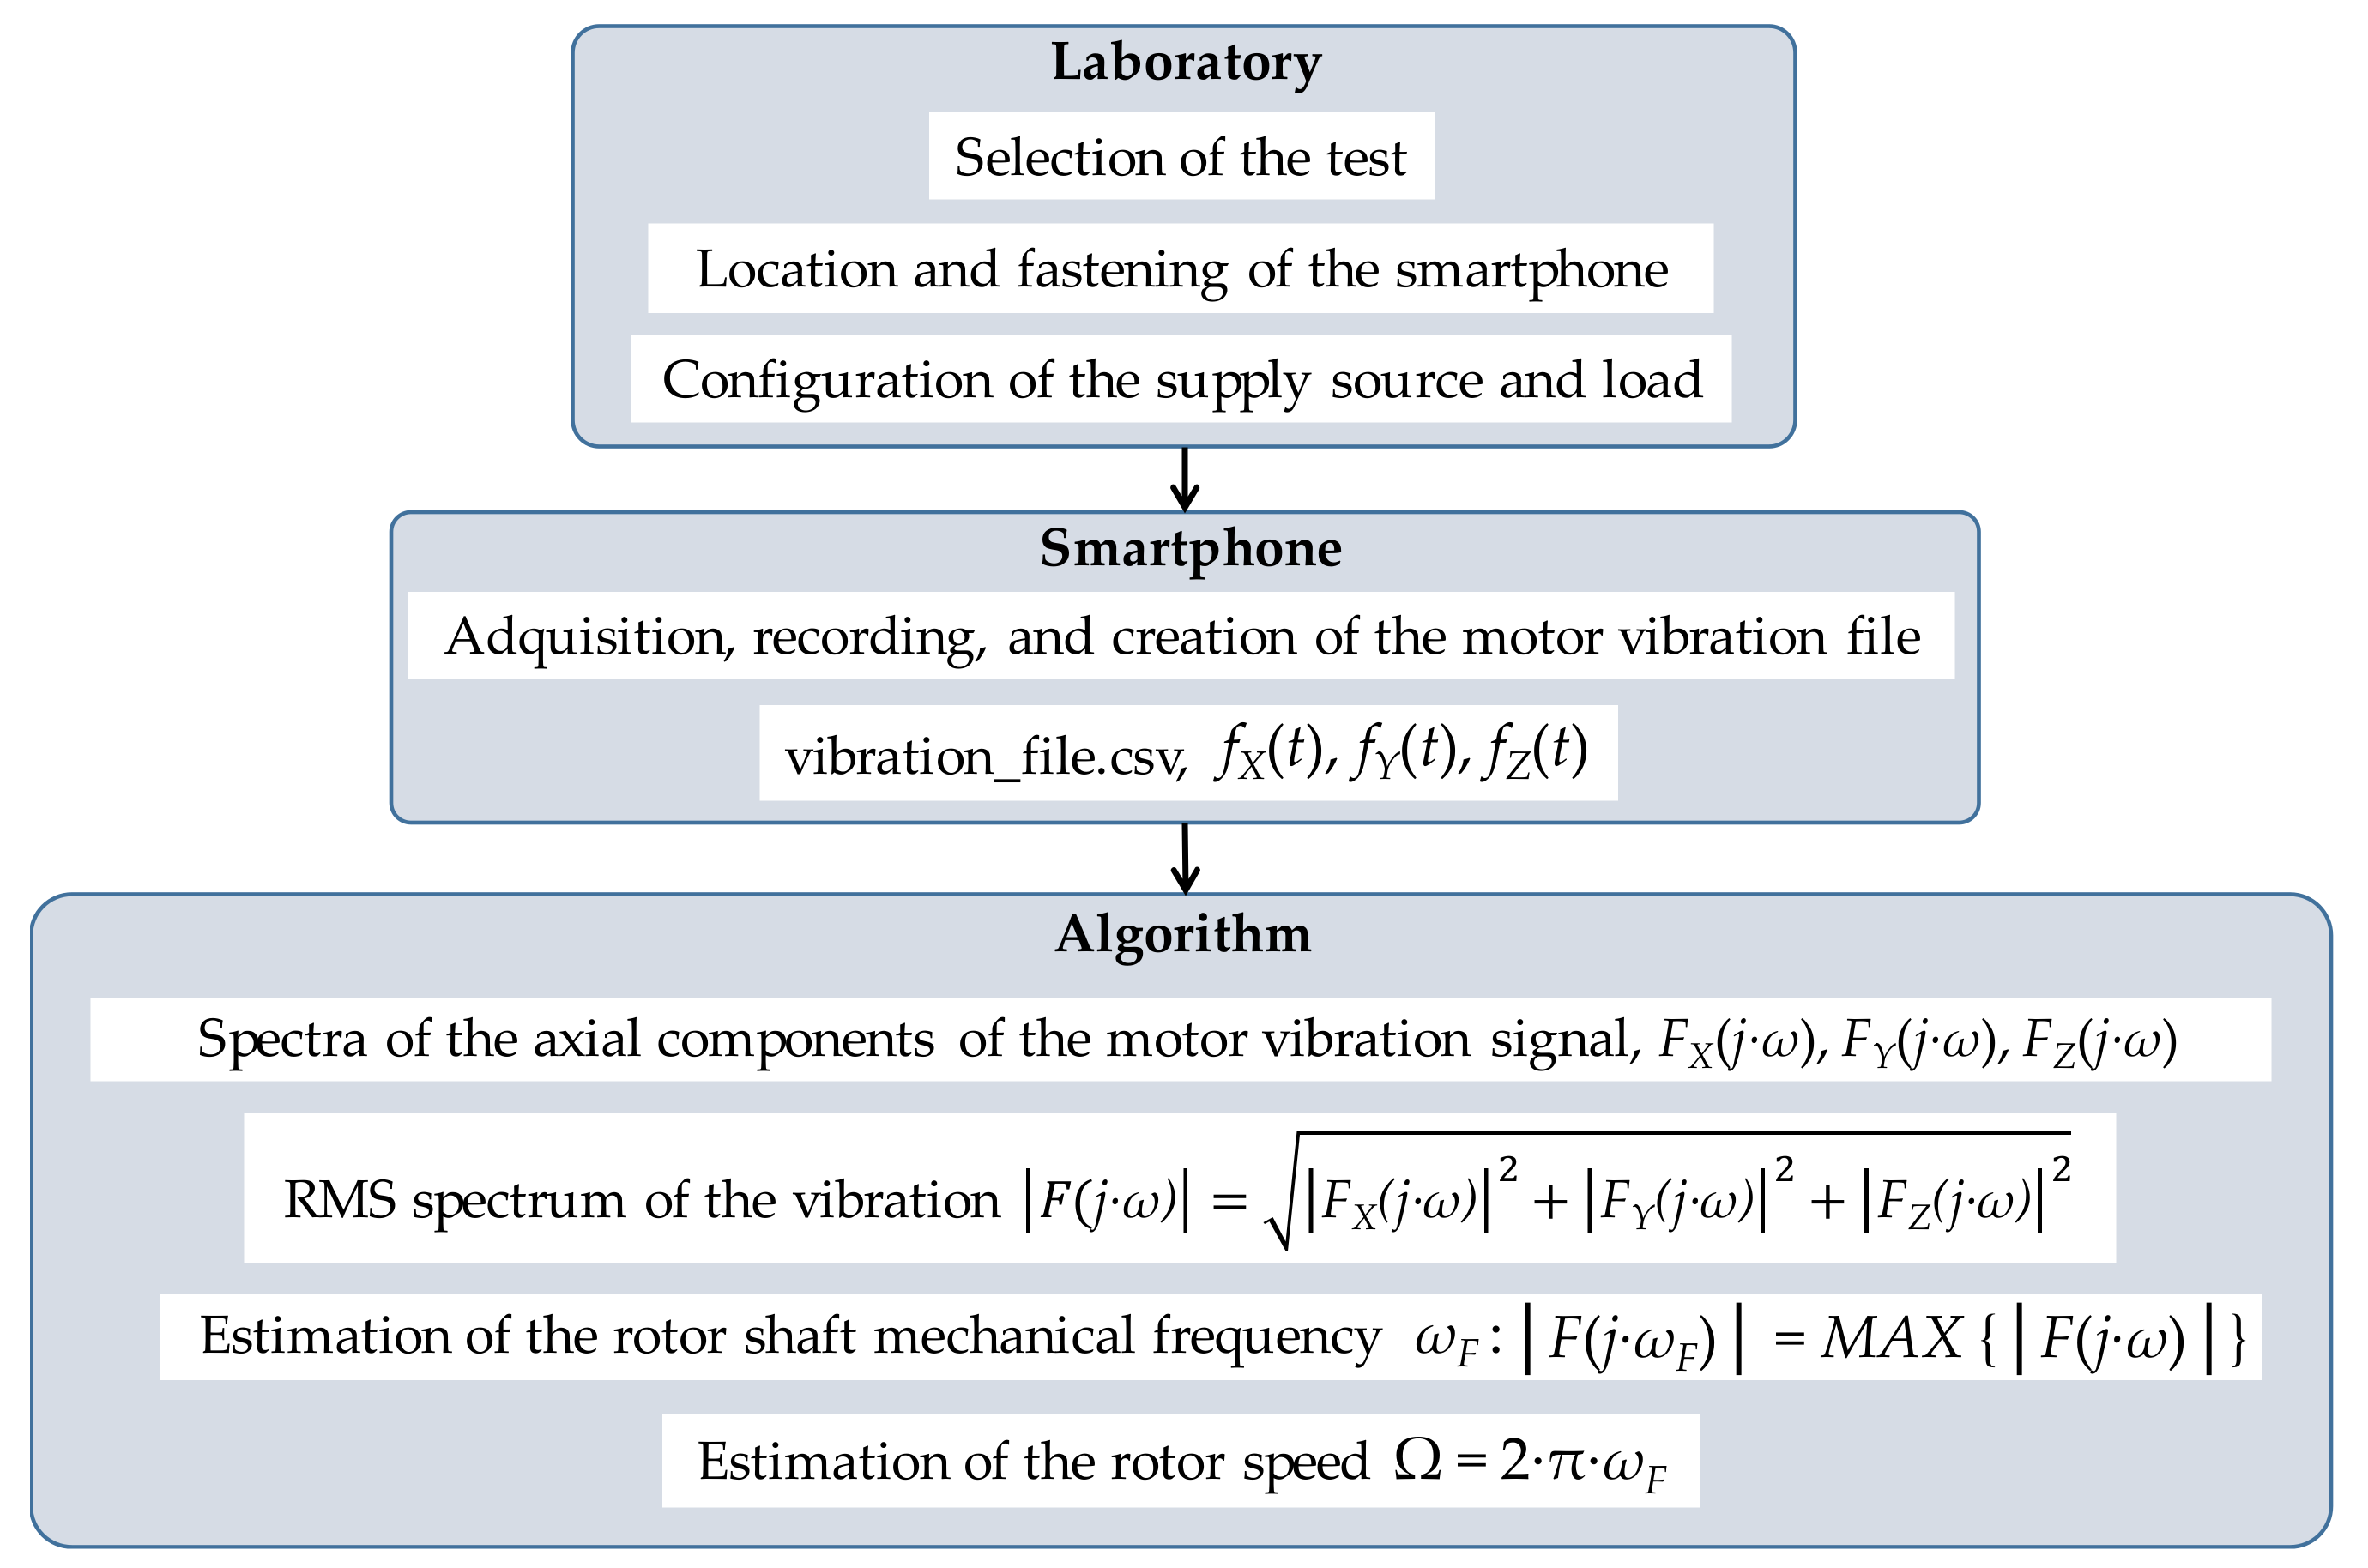
Speed Estimation Method
3. Results
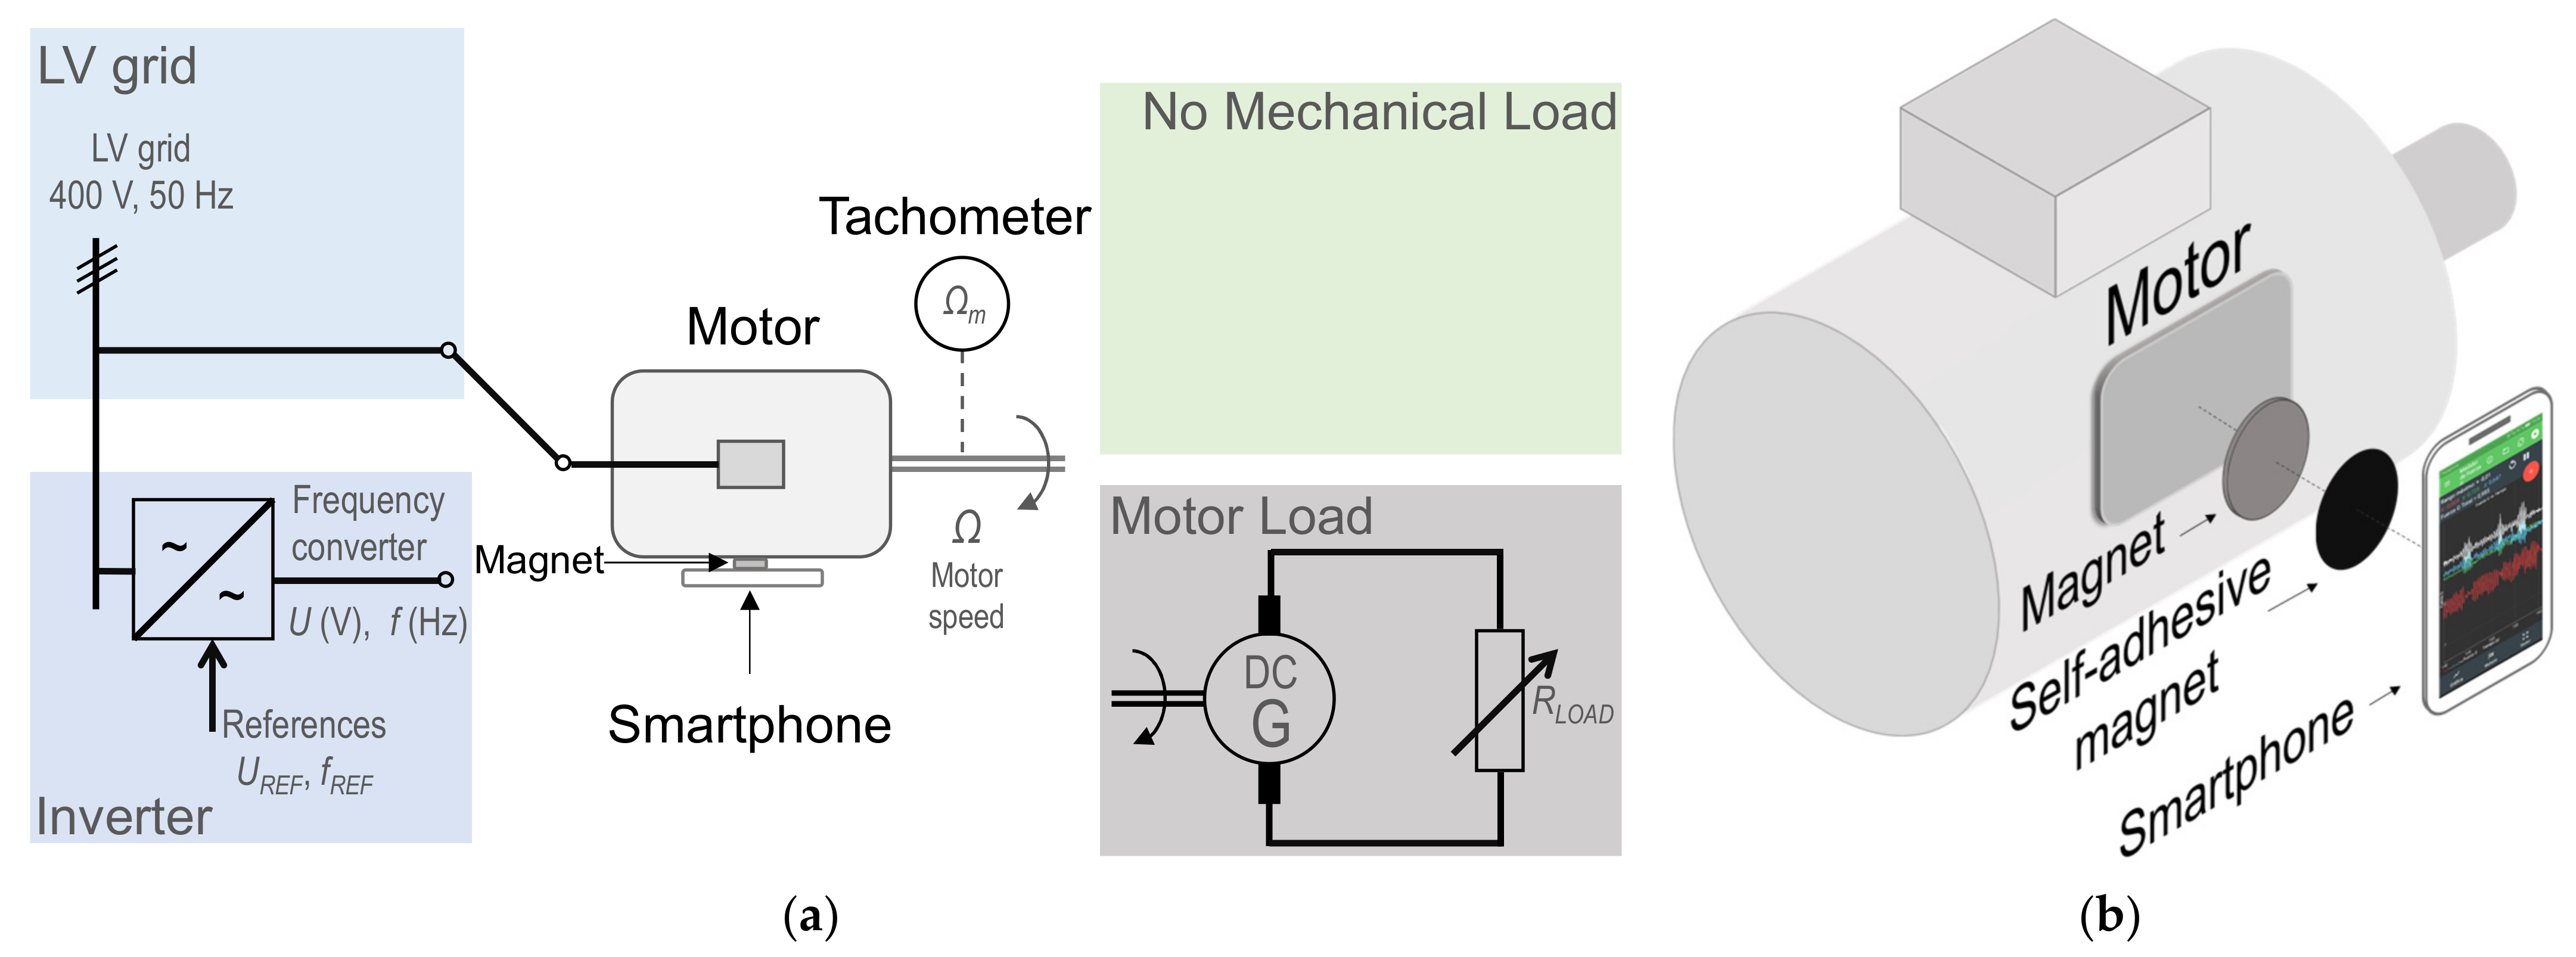
- Feeding source
- ◦
- Supply grid (400 V, 50 Hz)
- ◦
- Frequency converter or inverter, which allows adjusting voltage and frequency values of the motor power supply
- Mechanical load
- ◦
- No mechanical load (free motor shaft)
- ◦
- DC generator feeding a variable resistive load
3.1. Motor Supply from Mains with a DC Generator as Variable Mechanical Load
3.2. Motor Fed from a Inverter Coupled to a DC Generator
4. Discussion
Extended Method
5. Conclusions
Author Contributions
Funding
Institutional Review Board Statement
Informed Consent Statement
Data Availability Statement
Acknowledgments
Conflicts of Interest
Appendix A

| Tachometer | Tachometer 1 | Tachometer 2 |
|---|---|---|
| Number of digits | 5 | 5 |
| Range | 2.5 to 99,999 r/min | 5 to 99,999 r/min |
| Precision | ±0.051% + 1 digit | ±0.050% + 1 digit |
| Motor | Voltage (V) | Current (A) | Power (kW) | Power Factor | Speed (r/min) | Frequency (Hz) |
|---|---|---|---|---|---|---|
| DL1021 DeLorenzo (two poles) | 220/380 (Δ/Y) | 4.5/2.6 (Δ/Y) | 1.1 | 0.85 | 2820 | 50 |
| DC Generator | Voltage (V) | Current (A) | Power (kW) |
|---|---|---|---|
| DL1024 DeLorenzo | 220 | 3.4 | 0.75 |
| Frequency Converter | Power (kW) | Speed Range in Open-Loop Mode (Hz) | Voltage (V) |
|---|---|---|---|
| Telemecanique Altivar 71 | 0.75 | 1–100 | 200–240 |
References
- Karlovský, P.; Lettl, J. Application of MRAS Algorithm to Replace the Speed Sensor in Induction Motor Drive System. Procedia Eng. 2017, 192, 421–426. [Google Scholar] [CrossRef]
- Marfoli, A.; Di Nardo, M.; Degano, M.; Gerada, C.; Chen, W. Rotor Design Optimization of Squirrel Cage Induction Motor-Part I: Problem Statement. IEEE Trans. Energy Convers. 2021, 36, 1271–1279. [Google Scholar] [CrossRef]
- Di Nardo, M.; Marfoli, A.; Degano, M.; Gerada, C.; Chen, W. Rotor Design Optimization of Squirrel Cage Induction Motor—Part II: Results Discussion. IEEE Trans. Energy Convers. 2021, 36, 1280–1288. [Google Scholar] [CrossRef]
- Beleiu, H.G.; Maier, V.; Pavel, S.G.; Birou, I.; Pica, C.S.; Darab, P.C. Harmonics consequences on drive systems with induction motor. Appl. Sci. 2020, 10, 1528. [Google Scholar] [CrossRef] [Green Version]
- Waide, P.; Brunner, C.U. Energy-Efficiency Policy Opportunities for Electric Motor-Driven Systems; International Energy Agency: Paris, France, 2011; Available online: https://iea.blob.core.windows.net/assets/d69b2a76-feb9-4a74-a921-2490a8fefcdf/EE_for_ElectricSystems.pdf (accessed on 2 February 2022).
- Sousa-Santos, V.; Cabello-Eras, J.J.; Sagastume-Gutierrez, A.; Cabello-Ulloa, M.J. Assessment of the energy efficiency estimation methods on induction motors considering real-time monitoring. Meas. J. Int. Meas. Confed. 2019, 136, 237–247. [Google Scholar] [CrossRef]
- Chirindo, M.; Khan, M.A.; Barendse, P. Analysis of Non-Intrusive Rotor Speed Estimation Techniques for Inverter-Fed Induction Motors. IEEE Trans. Energy Convers. 2021, 36, 338–347. [Google Scholar] [CrossRef]
- Salomon, C.P.; Sant’Ana, W.C.; Lambert-Torres, G.; Borges Da Silva, L.E.; Bonaldi, E.L.; De Oliveira, L.E.D.L. Comparison among methods for induction motor low-intrusive efficiency evaluation including a new AGT approach with a modified stator resistance. Energies 2018, 11, 691. [Google Scholar] [CrossRef] [Green Version]
- Zaky, M.S.; Khater, M.; Yasin, H.; Shokralla, S.S. Review of different speed estimation schemes for sensorlessinduction motor drives. JEE 2008, 8, 102–140. [Google Scholar]
- Alsofyani, I.M.; Idris, N.R.N. A review on sensorless techniques for sustainable reliablity and efficient variable frequency drives of induction motors. Renew. Sustain. Energy Rev. 2013, 24, 111–121. [Google Scholar] [CrossRef]
- Aiello, M.; Cataliotti, A.; Nuccio, S. An induction motor speed measurement method based on current harmonic analysis with the chirp-Z transform. IEEE Trans. Instrum. Meas. 2005, 54, 1811–1819. [Google Scholar] [CrossRef]
- Phumiphak, P.; Chat-uthai, C. Nonintrusive method for estimating field efficiency of inverter- fed induction motor using measured values. In Proceedings of the 2008 IEEE International Conference on Sustainable Energy Technologies, Singapore, 24–27 November 2008; pp. 580–583. [Google Scholar] [CrossRef]
- Rodopoulos, K.; Yiakopoulos, C.; Antoniadis, I. A parametric approach for the estimation of the instantaneous speed of rotating machinery. Mechan. Syst. Signal Processing 2014, 44, 31–46. [Google Scholar] [CrossRef]
- Rzeszucinski, P.; Lewandowski, D.; Pinto, C.T. Mobile device-based shaft speed estimation. Measurement 2017, 96, 52–57. [Google Scholar] [CrossRef]
- Combet, F.; Zimroz, R. A new method for the estimation of the instantaneous speed relative fluctuation in a vibration signal based on the short time scale transform. Mechan. Syst. Signal Processing 2009, 23, 1382–1397. [Google Scholar] [CrossRef]
- Wang, T.; Yan, Y.; Wang, L.; Hu, Y. Rotational speed measurement through image similarity evaluation and spectral analysis. IEEE Access 2018, 6, 46718–46730. [Google Scholar] [CrossRef]
- Ferreira, F.J.T.E.; Duarte, A.F.F.; Lopes, F.J.P. Experimental evaluation of a novel webcam-based tachometer for in-situ rotational speed measurement. Proc. IEEE Int. Conf. Ind. Technol. 2020, 2020, 917–924. [Google Scholar] [CrossRef]
- Da Silva, J.C.; de Vasconcelos Lima, T.L.; de Lucena Júnior, J.A.; Lyra, G.J.; Souto, F.V.; de Souza Pimentel, H.; Belo, F.A.; Filho, A.C.L. Non-invasive method for in-service induction motor efficiency estimation based on sound acquisition. Appl. Sci. 2020, 10, 3757. [Google Scholar] [CrossRef]
- Paramo-Balsa, P.; Roldan-Fernandez, J.M.; Burgos-Payan, M.; Riquelme-Santos, J.M. A Low-Cost Non-Intrusive Method for In-Field Motor Speed Measurement Based on a Smartphone. Sensors 2021, 21, 4317. [Google Scholar] [CrossRef]
- Asad, B.; Vaimann, T.; Belahcen, A.; Kallaste, A.; Rassõlkin, A.; Ghafarokhi, P.S.; Kudelina, K. Transient Modeling and Recovery of Non-Stationary Fault Signature for Condition Monitoring of Induction Motors. Appl. Sci. 2021, 11, 2806. [Google Scholar] [CrossRef]
- Meira, M.; Bossio, G.R.; Verucchi, C.J.; Ruschetti, C.R.; Bossio, J.M. Speed Estimation during the Starting Transient of Induction Motors. IEEE Trans. Instrum. Meas. 2021, 70, 9000108. [Google Scholar] [CrossRef]
- Meira, M.; Bossio, G.; Verucchi, C.; Ruschetti, C.; Bossio, J. A speed self-sensing method in starting of induction motors. In Proceedings of the 18th Workshop on Information Processing and Control (RPIC), Salvador, Brazil, 18–20 September 2019; pp. 53–58. [Google Scholar] [CrossRef]
- Song, X.; Wang, Z.; Li, S.; Hu, J. Sensorless Speed Estimation of an Inverter-fed Induction Motor Using the Supply Side Current. IEEE Trans. Energy Convers. 2018, 34, 1432–1441. [Google Scholar] [CrossRef]
- Jia, Z.; Sharma, A. Review on engine vibration fault analysis based on data mining. J. Vibroeng. 2021, 23, 1433–1445. [Google Scholar] [CrossRef]
- Jamal, M.R.; Al Rasheed, K.S. Vibration Measurement of a Rotating Shaft using Electrostatic Sensor. Int. J. Recent Technol. Eng. 2021, 10, 97–105. [Google Scholar] [CrossRef]
- Dlamini, V.; Naidoo, R.; Manyage, M. A non-intrusive method for estimating motor efficiency using vibration signature analysis. Int. J. Electr. Power Energy Syst. 2013, 45, 384–390. [Google Scholar] [CrossRef] [Green Version]
- Karlsson, R.; Hendeby, G. Speed Estimation From Vibrations Using a Deep Learning CNN Approach. IEEE Sens. Lett. 2021, 5, 7000504. [Google Scholar] [CrossRef]
- Dionisio, R.; Torres, P.; Ramalho, A.; Ferreira, R. Magnetoresistive sensors and piezoresistive accelerometers for vibration measurements: A comparative study. J. Sens. Actuator Netw. 2021, 10, 22. [Google Scholar] [CrossRef]
- Kalra, D. Overriding FINTECH. In Proceedings of the 2019 International Conference on Digitization (ICD), Sharjah, United Arab Emirates, 18–19 November 2019; pp. 254–259. [Google Scholar] [CrossRef]
- Krichen, M. Anomalies Detection through Smartphone Sensors: A Review. IEEE Sens. J. 2021, 21, 7207–7217. [Google Scholar] [CrossRef]
- Poulose, A.; Kim, J.; Han, D.S. A Sensor Fusion Framework for Indoor Localization Using Smartphone Sensors and Wi-Fi RSSI Measurements. Appl. Sci. 2019, 9, 4379. [Google Scholar] [CrossRef] [Green Version]
- Ashraf, I.; Hur, S.; Park, Y. Application of Deep Convolutional Neural Networks and Smartphone Sensors for Indoor Localization. Appl. Sci. 2019, 9, 2337. [Google Scholar] [CrossRef] [Green Version]
- Gutierrez-Martinez, J.-M.; Castillo-Martinez, A.; Medina-Merodio, J.-A.; Aguado-Delgado, J.; Martinez-Herraiz, J.-J. Smartphones as a Light Measurement Tool: Case of Study. Appl. Sci. 2017, 7, 616. [Google Scholar] [CrossRef]
- Cerrato-Alvarez, M.; Frutos-Puerto, S.; Arroyo, P.; Miró-Rodríguez, C.; Pinilla-Gil, E. A portable, low-cost, smartphone assisted methodology for on-site measurement of NO2 levels in ambient air by selective chemical reactivity and digital image analysis. Sens. Actuators B Chem. 2021, 338, 129867. [Google Scholar] [CrossRef]
- Kalra, N.; Goyal, R.K.; Parashar, A.; Singh, J.; Singla, G. Driving Style Recognition System Using Smartphone Sensors Based on Fuzzy Logic. Comput. Mater. Contin. 2021, 69, 1967–1978. [Google Scholar] [CrossRef]
- Nasr, M.; Islam, M.M.; Shehata, S.; Karray, F.; Quintana, Y. Smart Healthcare in the Age of AI: Recent Advances, Challenges, and Future Prospects. IEEE Access 2021, 9, 145248–145270. [Google Scholar] [CrossRef]
- Vieyra Software. Physics Toolbox Sensor Suite (Version 7 August 2021) [Mobile Application]. Google Play Store. 2021. Available online: https://play.google.com/store/apps/details?id=com.chrystianvieyra.physicstoolboxsuite&hl=es_419&gl=US (accessed on 8 August 2021).
- Heideman, M.; Johnson, D.; Burrus, C. Gauss and the history of the fast Fourier transform. IEEE ASSP Mag. 1984, 1, 14–21. [Google Scholar] [CrossRef] [Green Version]


| Resistance | Experimental | Algorithm | Relative Error | ||
|---|---|---|---|---|---|
| Ωm (r/min) | ωm (Hz) | Ω (r/min) | ωF (Hz) | ε (%) | |
| R7 | 2857 | 47.62 | 2859.4 | 47.66 | 0.0831 |
| R6 | 2872 | 47.87 | 2871.1 | 47.85 | 0.0316 |
| R5 | 2900 | 48.33 | 2900.4 | 48.34 | 0.0135 |
| R4 | 2920 | 48.67 | 2920.9 | 48.68 | 0.0308 |
| R3 | 2942 | 49.03 | 2941.4 | 49.02 | 0.0202 |
| R2 | 2962 | 49.37 | 2961.9 | 49.37 | 0.0029 |
| R1 | 2969 | 49.48 | 2970.7 | 49.51 | 0.0574 |
| R0 | 2990 | 49.83 | 2991.2 | 49.85 | 0.0405 |
| Resistance | Time Recording (s) | Relative Error, ε (%) | ||
|---|---|---|---|---|
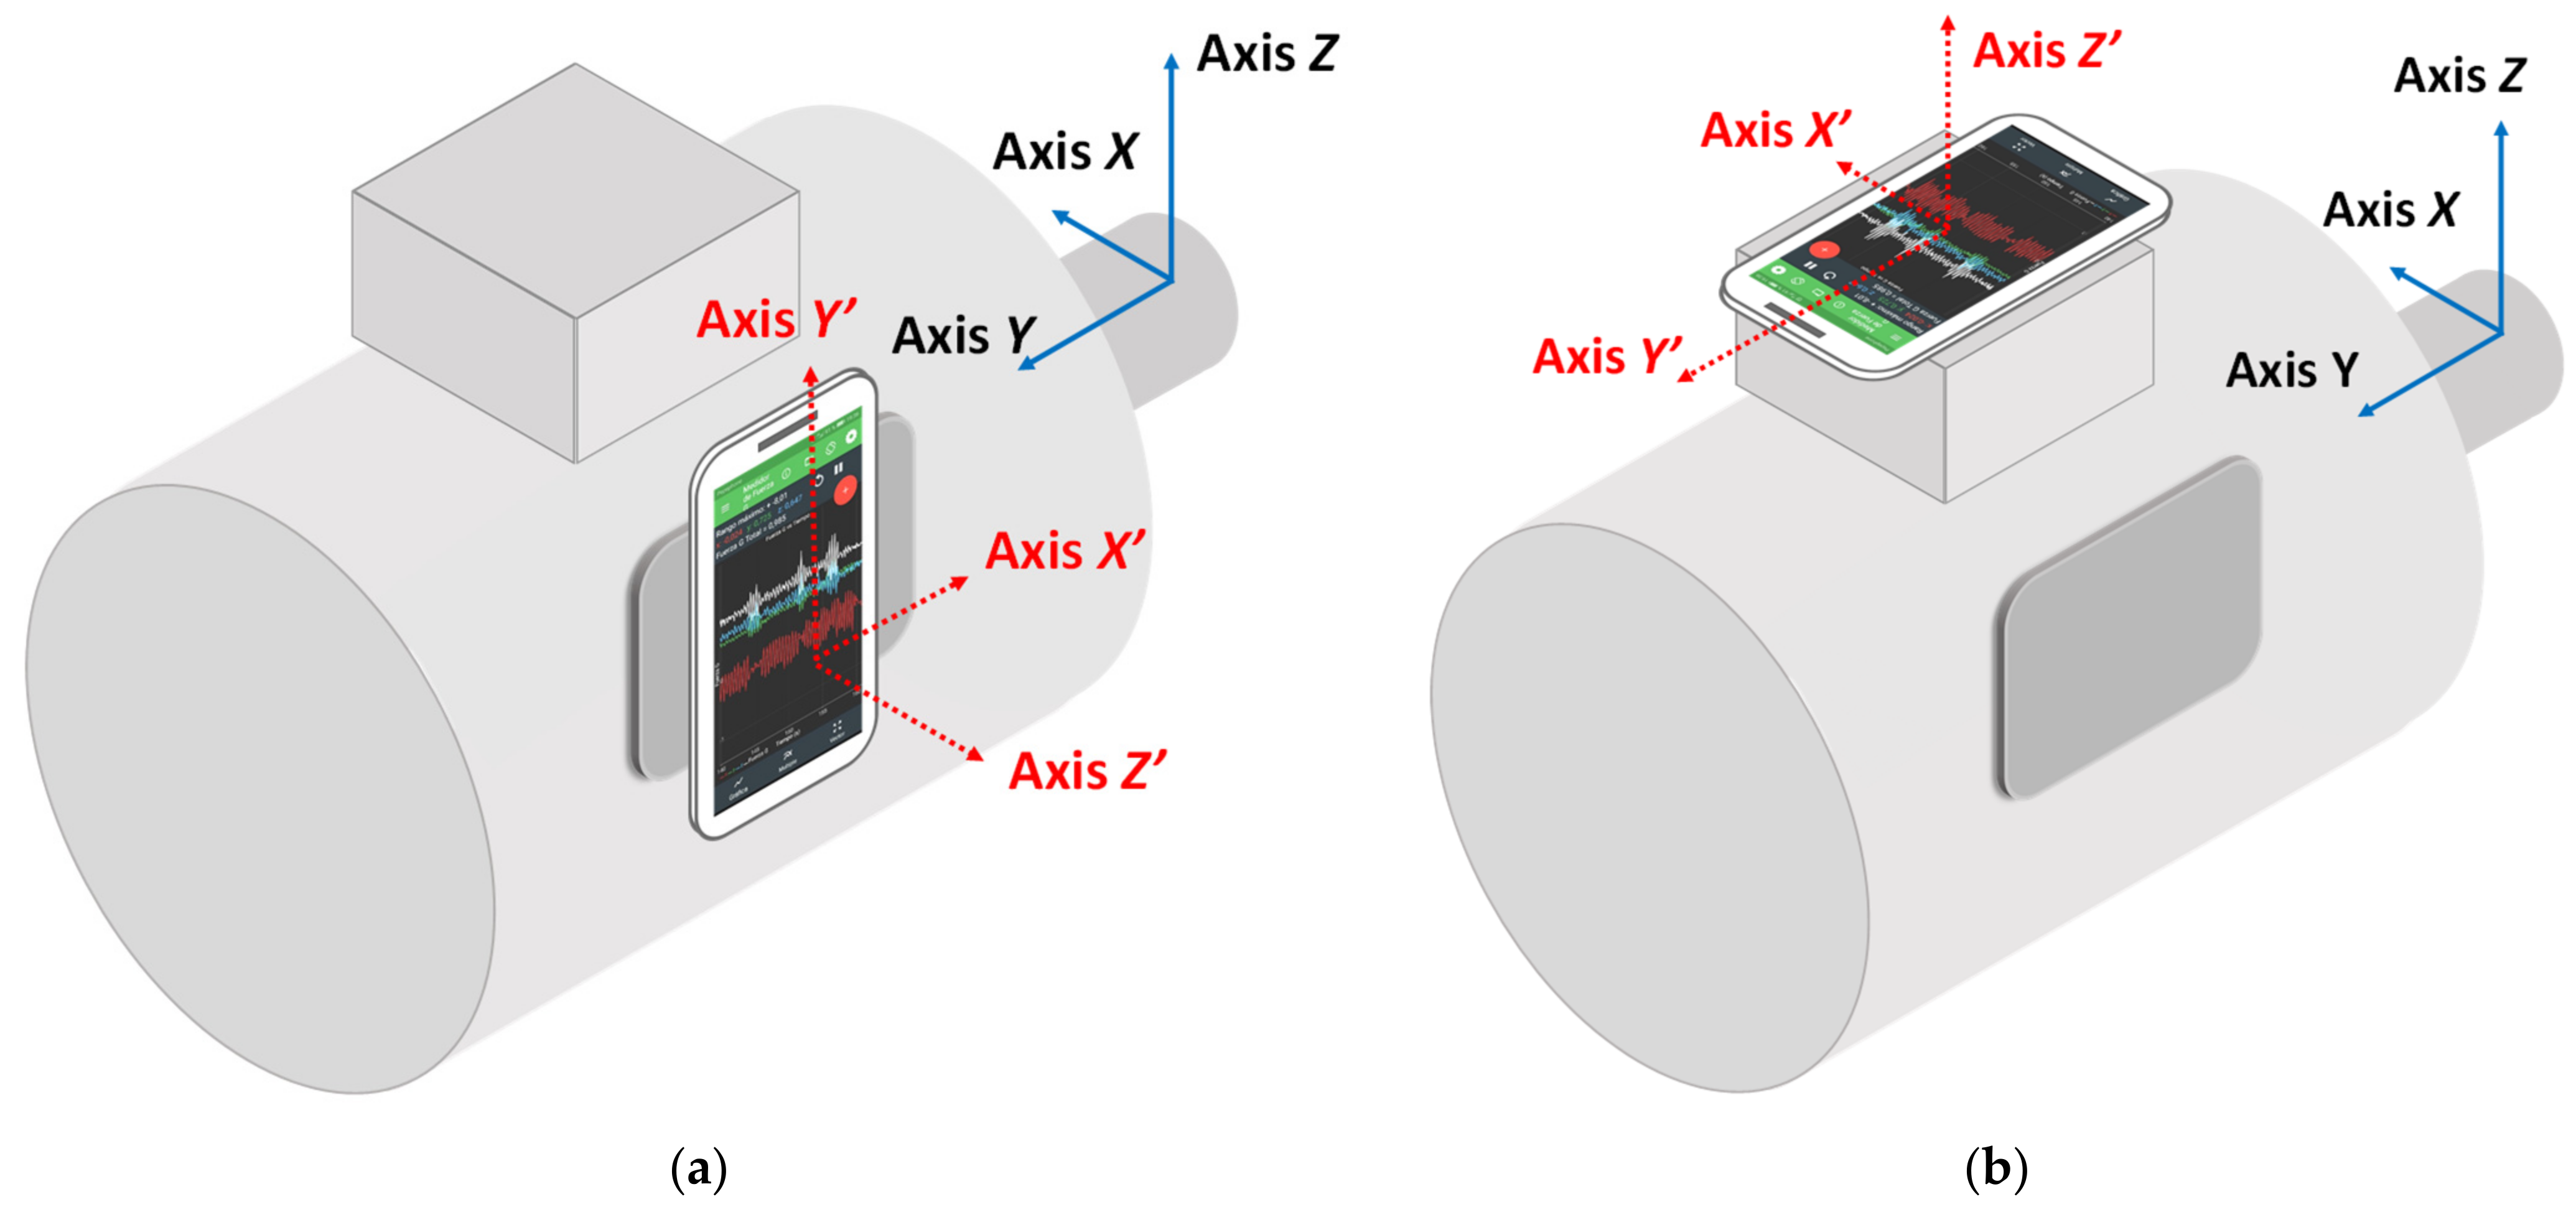
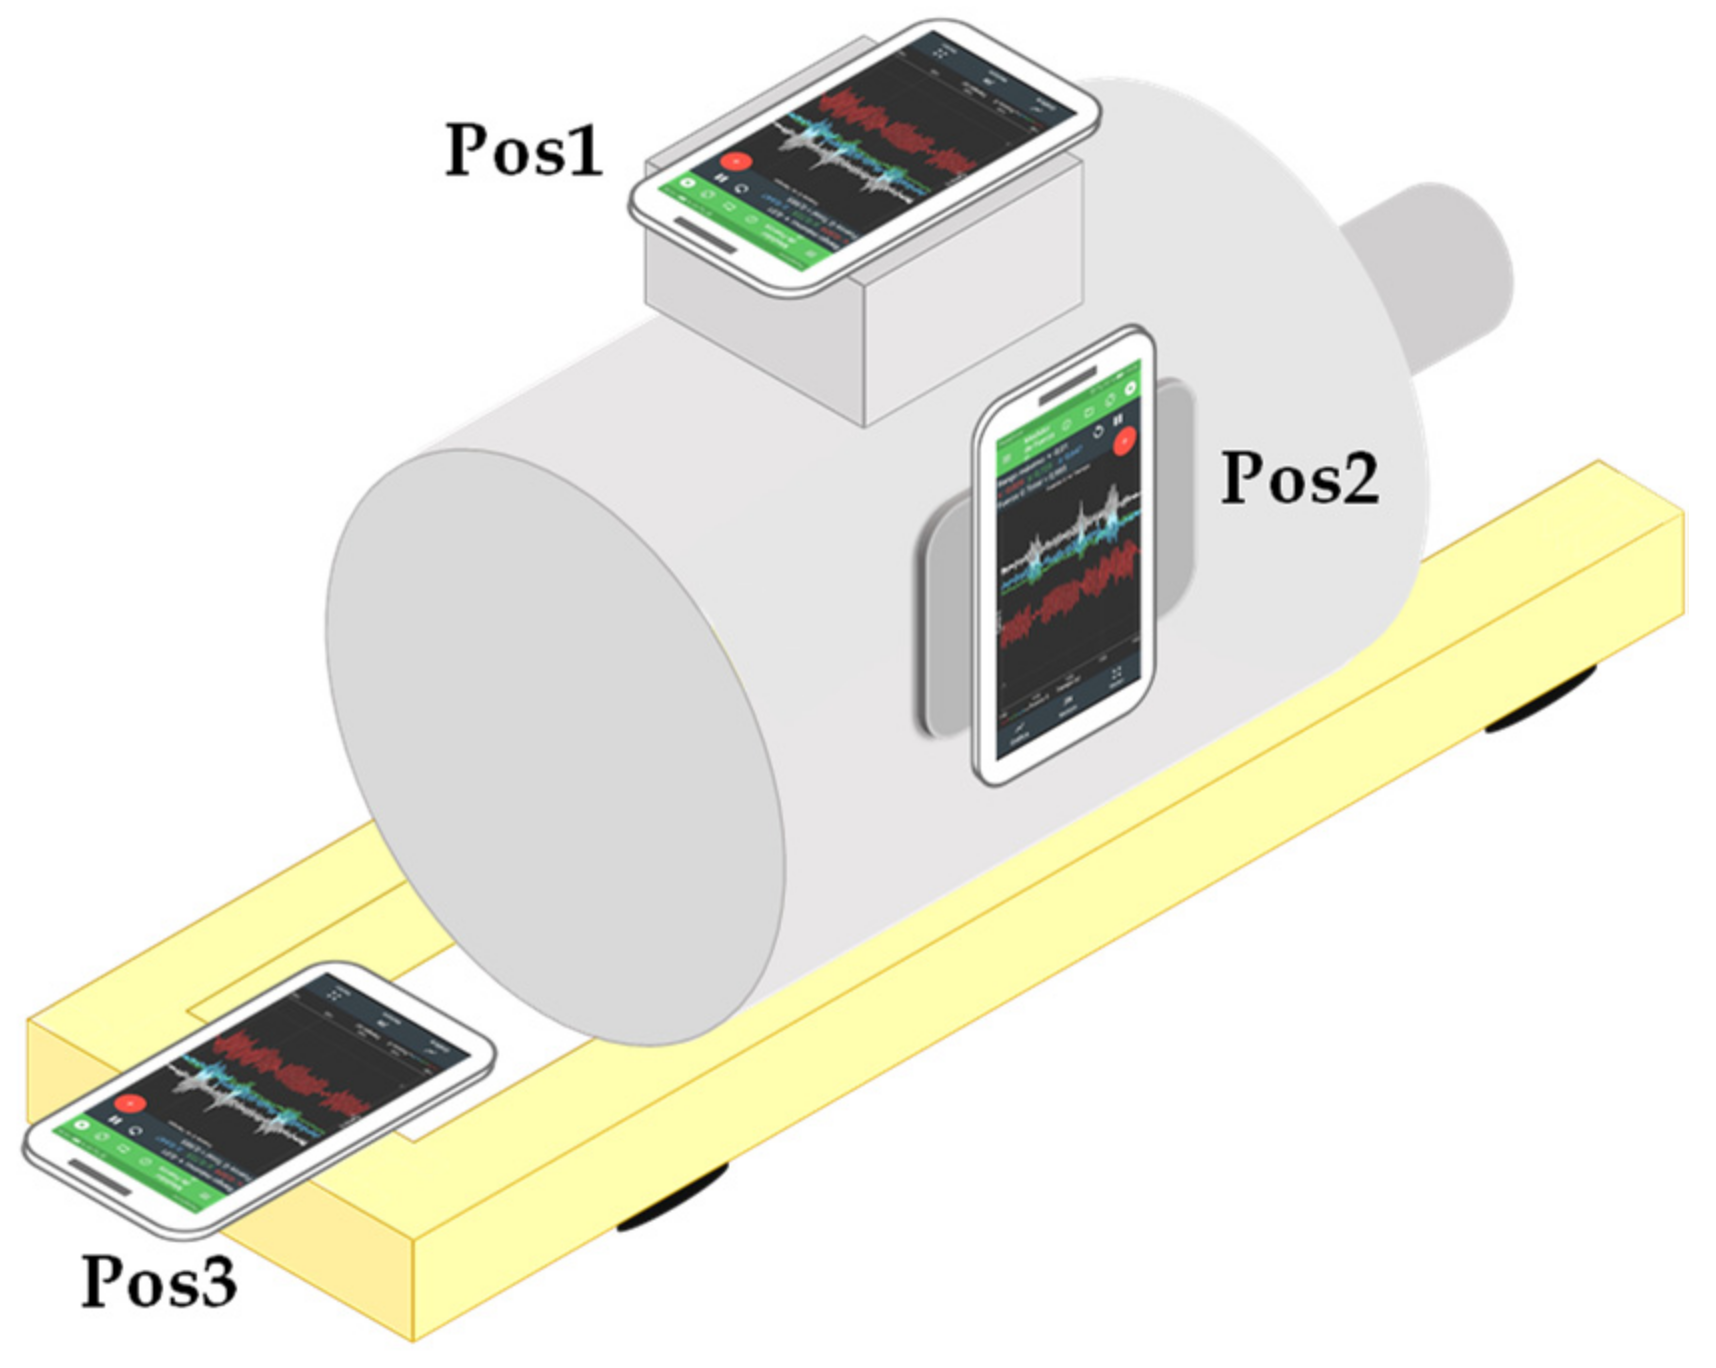
| Smartphone Locations over the Motor | ||||
| Pos1 | Pos2 | Pos3 | ||
| R7 | 5 | 0.1130 | 0.0831 | 0.0131 |
| 10 | 0.1130 | 0.0831 | 0.0131 | |
| 15 | 0.0106 | 0.0194 | 0.0131 | |
| R4 | 5 | 0.0696 | 0.0696 | 0.0626 |
| 10 | 0.1311 | 0.0308 | 0.0626 | |
| 15 | 0.0308 | 0.0308 | 0.0377 | |
| R1 | 5 | 0.0911 | 0.0574 | 0.0237 |
| 10 | 0.0911 | 0.0574 | 0.0237 | |
| 15 | 0.0911 | 0.0574 | 0.0237 | |
| Frequency supplied (Hz) | Ω1 ** (r/min) | Ωm (r/min) | |||||||
|---|---|---|---|---|---|---|---|---|---|
| R7 | R6 | R5 | R4 | R3 | R2 | R1 | R0 | ||
| 30.00 | 1800 | 1464 | 1490 | 1581 | 1640 | 1681 | 1722 | 1739 | 1779 |
| 35.00 | 2100 | 1621 | 1701 | 1815 | 1885 | 1960 | 2016 | 2025 | 2074 |
| 45.00 | 2700 | 2369 | 2460 | 2533 | 2593 | 2616 | 2673 | ||
| 60.00 | 3600 | 3220 | 3400 | 3451 | 3564 | ||||
| 70.00 | 4200 | 3790 | 3922 | 4142 | |||||
| 80.00 | 4800 | 4243 | 4700 | ||||||
| Resistance | Experimental | Algorithm | Relative Error | ||
|---|---|---|---|---|---|
| Ωm (r/min) | ωm (Hz) | Ω (r/min) | ωF (Hz) | ε (%) | |
| R7 | 1621 | 27.02 | 1620.1 | 27.00 | 0.0545 |
| R6 | 1701 | 28.35 | 1702.1 | 28.37 | 0.0675 |
| R5 | 1815 | 30.25 | 1816.4 | 30.27 | 0.0775 |
| R4 | 1885 | 31.42 | 1886.7 | 31.45 | 0.0912 |
| R3 | 1960 | 32.67 | 1962.9 | 32.71 | 0.1475 |
| R2 | 2016 | 33.60 | 2015.6 | 33.59 | 0.0186 |
| R1 | 2025 | 33.75 | 2024.4 | 33.74 | 0.0289 |
| R0 | 2074 | 34.57 | 2074.2 | 34.57 | 0.0105 |
| Resistance * | Experimental | Algorithm | Relative Error | ||
|---|---|---|---|---|---|
| Ωm (r/min) | ωm (Hz) | Ω (r/min) | ωF (Hz) | ε (%) | |
| R3 | 3220 | 53.67 | 3222.7 | 53.71 | 0.0825 |
| R2 | 3400 | 56.67 | 3401.4 | 56.69 | 0.0402 |
| R1 | 3451 | 57.52 | 3451.2 | 57.52 | 0.0050 |
| R0 | 3564 | 59.40 | 3562.5 | 59.38 | 0.0421 |
| Resistance * | Experimental | Algorithm | Relative Error | ||
|---|---|---|---|---|---|
| Ωm (r/min) | ωm (Hz) | Ω (r/min) | ωF (Hz) | ε (%) | |
| R2 | 3790 | 63.17 | 3791.0 | 63.18 | 0.0268 |
| R1 | 3922 | 65.37 | 3925.8 | 65.43 | 0.0964 |
| R0 | 4142 | 69.03 | 4139.6 | 68.99 | 0.0568 |
| Motor Rated Power | Measurement | Estimate | Error | ||
|---|---|---|---|---|---|
| Load Condition | Ωm (r/min) | ωm (Hz) | Ω (r/min) | ε (%) | |
| 15 kW | No load | 1502.3 | 25.01 | 1500.62 | 0.11 |
| Full load | 1454.0 | 24.37 | 1461.97 | 0.55 | |
| 11 kW | No load | 1498.0 | 24.95 | 1496.98 | 0.07 |
| Full load | 1463.0 | 24.41 | 1464.36 | 0.09 | |
| 3 kW | No load | 1491.0 | 24.82 | 1489.08 | 0.13 |
| Full load | 1396.0 | 23.20 | 1392.20 | 0.27 | |
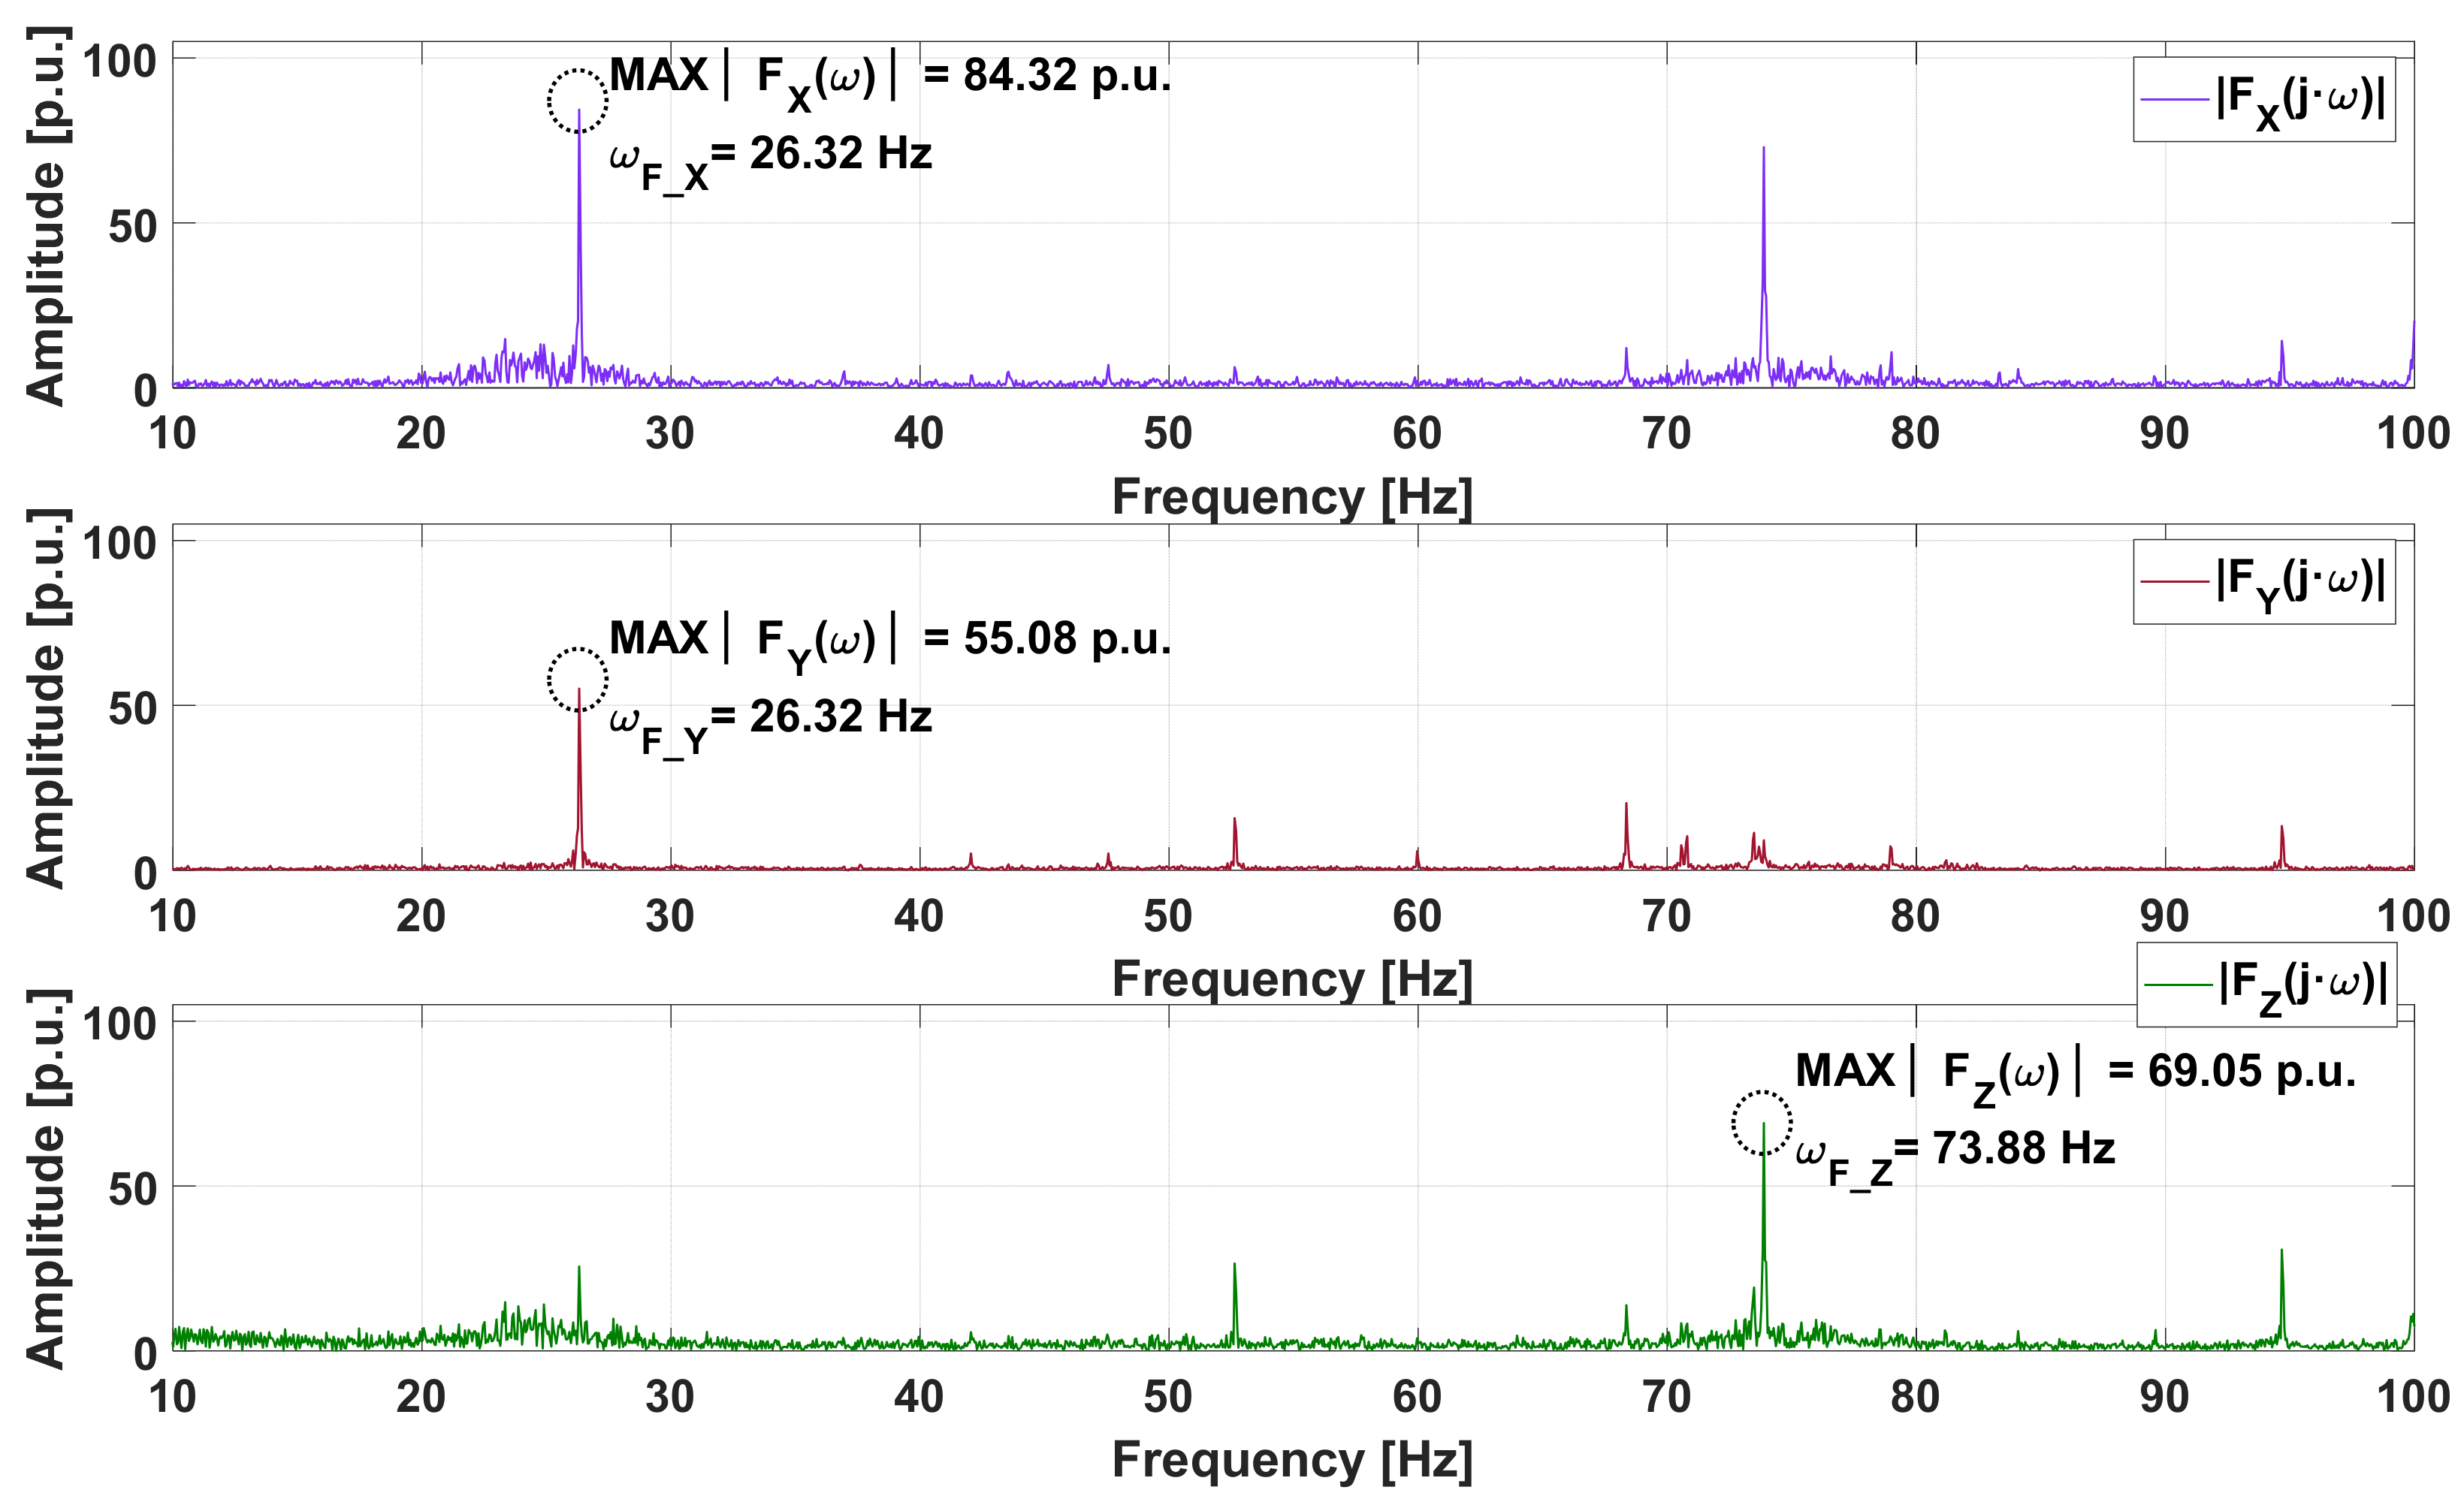
| Vibration Component Axis | Peak Value of the Amplitude of the Axial Vibration Signal Spectra, |FREF(ωF_REF)| = MAX{|FREF(ω)|} | Frequency Corresponding to the Peak Value of the Amplitude of the Axial Vibration Signal Spectra, ωF_REF: |FREF(ωF_REF)| = MAX{|FREF(ω)|} |
| X | MAX{|FX(ω)|} = |FX(ωF_X = 26.3184 Hz)| = 84.3203 p.u. | ωF_X = 26.3184 Hz |
| Y | MAX{|FY(ω)|} = |FY(ωF_Y = 26.3184 Hz)| = 55.0815 p.u. | ωF_Y = 26.3184 Hz |
| Z | MAX{|FZ(ω)|} = |FZ(ωF_Z = 73.8770 Hz)| = 69.0521 p.u. | ωF_Z = 73.8770 Hz |
| Vibration Component | Peak Value of the Amplitude of the RMS Vibration Signal Spectra, |F (ωF_ RMS)| = MAX{|F(ω)|} | Frequency Corresponding to the Peak Value of the Amplitude of the RMS Vibration Signal Spectra, ωF_RMS: |F(ωF_ RMS)| = MAX{|F(ω)|} |
| RMS | MAX{|F(ω)|} = |F(ωF_RMS = 73.8770 Hz)| = 93.2191 p.u. | ωF_RMS = 73.8770 Hz |
Publisher’s Note: MDPI stays neutral with regard to jurisdictional claims in published maps and institutional affiliations. |
© 2022 by the authors. Licensee MDPI, Basel, Switzerland. This article is an open access article distributed under the terms and conditions of the Creative Commons Attribution (CC BY) license (https://creativecommons.org/licenses/by/4.0/).
Share and Cite
Paramo-Balsa, P.; Roldan-Fernandez, J.M.; Gonzalez-Longatt, F.; Burgos-Payan, M. Measurement of the Speed of Induction Motors Based on Vibration with a Smartphone. Appl. Sci. 2022, 12, 3371. https://doi.org/10.3390/app12073371
Paramo-Balsa P, Roldan-Fernandez JM, Gonzalez-Longatt F, Burgos-Payan M. Measurement of the Speed of Induction Motors Based on Vibration with a Smartphone. Applied Sciences. 2022; 12(7):3371. https://doi.org/10.3390/app12073371
Chicago/Turabian StyleParamo-Balsa, Paula, Juan Manuel Roldan-Fernandez, Francisco Gonzalez-Longatt, and Manuel Burgos-Payan. 2022. "Measurement of the Speed of Induction Motors Based on Vibration with a Smartphone" Applied Sciences 12, no. 7: 3371. https://doi.org/10.3390/app12073371