Article

Analysis of the Seismic Behavior of a Wall Pier of a Covered Bridge Based on the Multi-Layer Shell Element

1
School of Transportation, Southeast University, Nanjing 211189, China
2
Research Institute of Highway, Ministry of Transport, Beijing 100088, China
*
Author to whom correspondence should be addressed.
Appl. Sci. 2022, 12(7), 3499; https://doi.org/10.3390/app12073499
Submission received: 4 March 2022 / Revised: 22 March 2022 / Accepted: 27 March 2022 / Published: 30 March 2022
(This article belongs to the Section Civil Engineering)

Abstract

:

Feature Application

This work can serve to determine the damage state indexes of a wall pier with a quite small height-to-width ratio or validate the accuracy of damage limits referring to the pier column for the wall pier so as to analyze the vulnerability of a covered bridge.

Abstract

To investigate the seismic behavior of the wall pier of a covered bridge, the multi-layer shell element in OpenSEES was used to carry out the numerical analysis under a horizontal low cyclic loading in the weak axis direction. The effects of the mesh divisions of the wall pier models were evaluated and the hysteretic curves, skeleton curves, bearing and energy dissipation capacity, stiffness degradation and displacement ductility of the wall pier with different lateral loading modes were mainly researched. The results demonstrate that the discretization of layers along the thickness direction of the multi-layer shell element model has a very limited effect on the hysteretic and skeleton curves. The mesh division of the horizontal direction depends on that of the vertical, and the vertical mesh spacing shall be longer than the plastic hinge with a length of 0.5744 m. The arrangement of the loading points is critical for the seismic behavior of the wall pier. The pier suffering the force from the five points presents a relatively strong energy dissipation and larger ductility, but this layout may cause a more concentrated force at the local position. When the loading points are evenly distributed, the capacity and displacement changes sharply and the ductility diminishes. Successively, the seismic performance indexes at the local position of the wall pier tend to be more consistent with the increasing loading points. The deformation and energy dissipation capacity of the nearby position with the denser side loading points becomes larger, but this has a minor impact on the seismic performance of the position far from the points. The wall pier without the bent cap and with three bearings set is supposed to be more reasonable for the covered bridge through the overall analysis of seismic performance.

1. Introduction

Covered bridges have been widely used in recent years in urban construction for the integration of functionality and appreciation, rational use of space and saving of land resources. The stiffness of the covered bridge pier increases to meet the space layout and the huge dead load generated by the superstructure. The longitudinal and transverse dimensions of the section differ greatly, forming wall piers [1]. The seismic performance of piers is definitely of vital importance in the seismic research of bridge structures [2], but studies on that of wall piers are more often conducted by numerical simulation because of their high test costs. At present, the finite element model of wall piers is only involved in the vulnerability analysis of bridges. Bignell [3] used a four-node simplified integral shell element in ABAQUS to simulate the wall piers. Each layer of reinforcement was embedded in the shell element of the pier using the anisotropic membrane element by the *rebar layer command and the dispersion crack concrete constitutive model with a reduced elastic modulus was used to consider the effects of reinforcement joint degradation and bond slip at the bottom of the wall. Siddiquee [4] performed a nonlinear static pushover analysis and dynamic time analysis of the wall pier using the fiber element in SeismoStruct. Since wall piers are similar to shear walls and railway piers in terms of structural form and force characteristics, Chen et al. [5] adopted a layered shell element to simulate the piers of a typical simply supported girder bridge and verified the accuracy of the shell element by the test results of shear walls. For railway piers, Zhou [6] selected the separated modeling method in ABAQUS to analyze the elastic–plastic seismic response of the round-end-shaped solid piers of a high-speed railway, in which the three-dimensional truss element and the three-dimensional solid element were adopted for the reinforcement and the concrete, respectively. Ma et al. [7] established four finite element models for a railway bridge using the multi-vertical-line element, the beam element and the slab element, respectively, and carried out seismic response analysis of gravity piers and compared the results, suggesting that it is reasonable to choose the multi-vertical-line element model to simulate railway piers. Shao et al. [8] conducted an experimental study in the longitudinal and transverse directions on the seismic performance of round-ended railway piers with low shear span ratio. The applicability of the Chang–Mander concrete constitutive model to simulate railway piers with large cross-sections and low reinforcement ratios was investigated based on the test results. Li [9] established the finite element model of a high-speed railway pier using the solid element of ANSYS, compared it with the experimental data to verify the correctness of the model and analyzed the ductility and failure of the piers with different parameters. Salazar et al. [10] utilized the frame element in SAP2000 to conduct pushover analysis on the piers of the railway bridge connecting the SantaMesa and Pandacan stations and derived the fragility curves of the railway bridge.
The solid element or beam element is generally utilized to simulate wall piers or members similar to its structural type from the present research, but it takes a longer time to compute and requires higher computer performance for the solid element. Furthermore, the transverse aspect ratio of this kind of pier is far less than 2.5 and its structural type is different from the ordinary single-column pier, double-column pier or bent pier. Although the structural form of the shear wall is similar to that of the wall pier, the force applied has a great difference in the simulation using the shell element. In the low cycle reciprocating loading analysis or pushover analysis of the shear wall, the horizontal lateral loading is usually applied to only one point due to the small size of the member in the direction subject to the analysis. Meanwhile, it is considered that the out-of-plane performance is similar to the bending behavior of one-dimensional column members [5,11,12]. However, the wall pier, as an important component of the covered bridge, is no longer a single-point loading cantilever column under the action of a longitudinal earthquake, which cannot better conform to the characteristics of the beam element. Its horizontal loading pattern is related to the location of superstructure load transferring. The width of the wall pier is much larger than the size of the other two directions and the responses of different positions on the pier are different in the out-of-plane dimension.
A wall pier with a uniform cross-section of a rounded rectangular form, commonly used in covered bridges, is taken as the prototype. The finite element models are established by employing the multi-layered shell element in OpenSEES to perform numerical analyses under low cycle reciprocating loading in the weak axis direction of the pier. The influence of the discretization of layers along the thickness direction and mesh divisions on the hysteretic performance of wall pier is discussed. Moreover, the seismic performance of the wall pier under different horizontal lateral loading patterns is focused on and the optimum layout of bearings on the wall pier is recommended.

2. Numerical Model of the Wall Pier
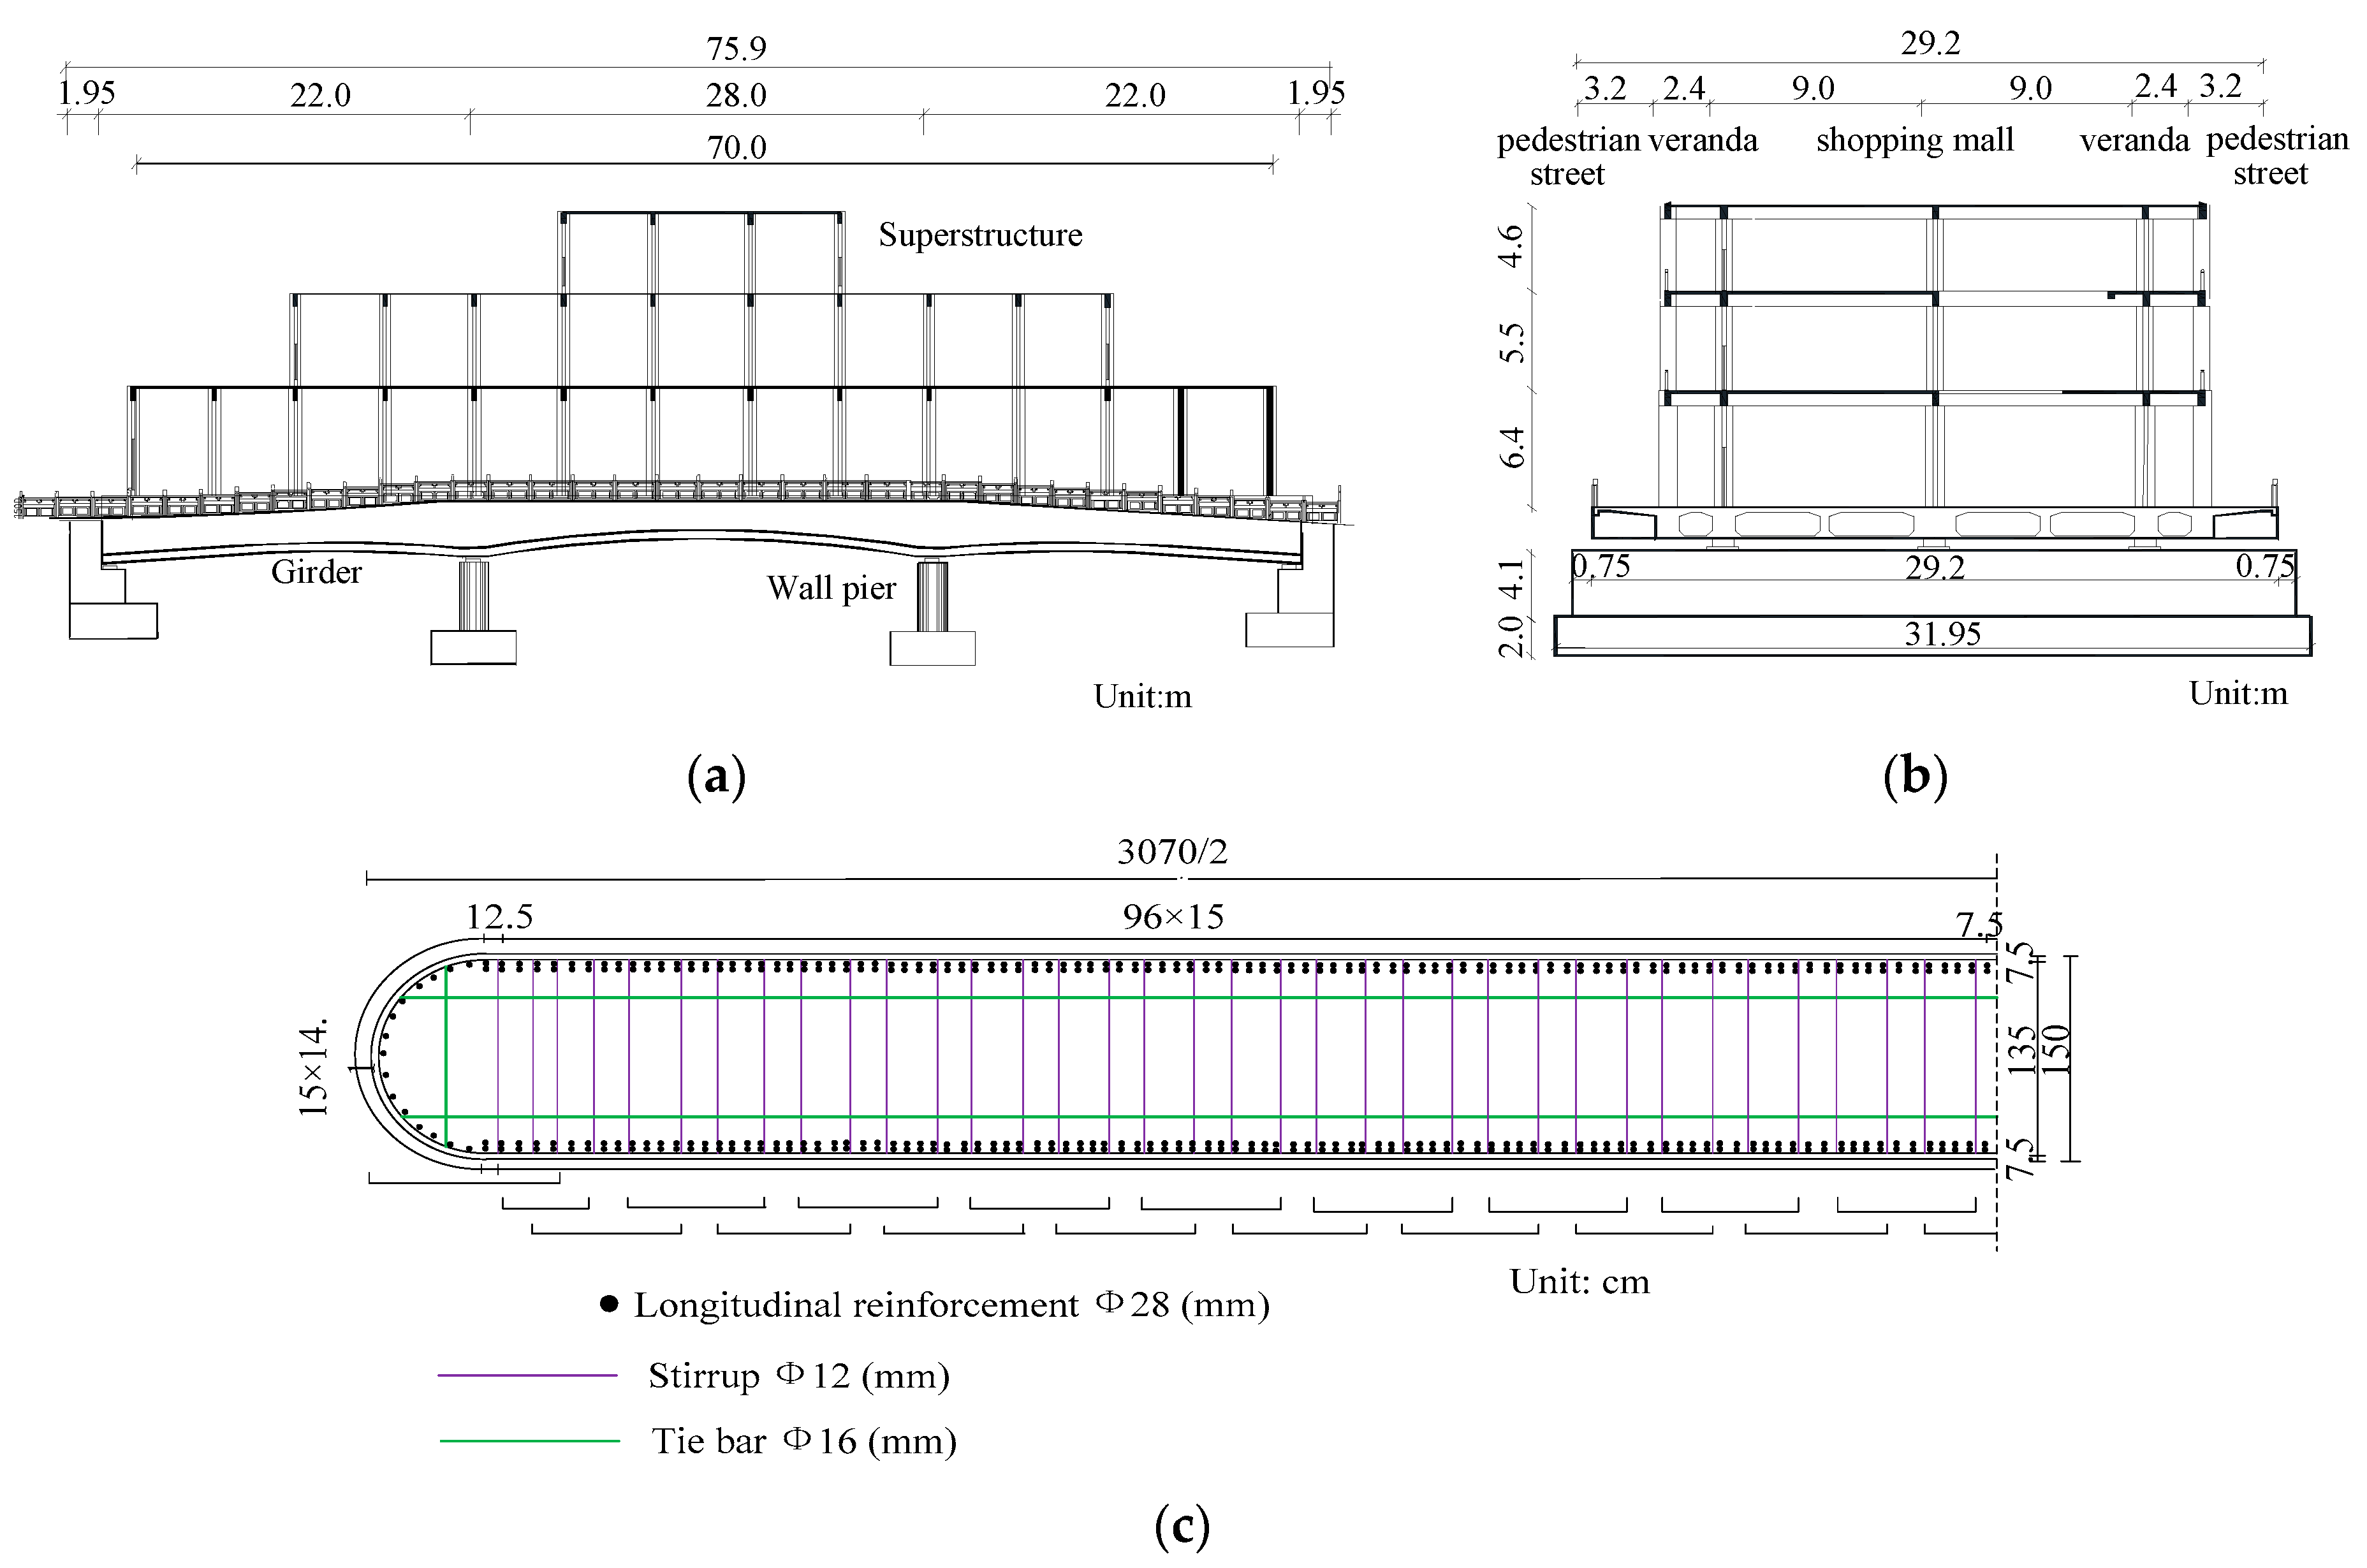
2.1. Wall Pier

The wall pier of a continuous covered bridge is selected as a reference pier. The total length of the bridge is 75.9 m, with a full width of 29.2 m. It is composed of three spans measuring 22 m + 28 m + 22 m. The main plane size of the superstructure is 70.0 m × 22.8 m and it is a local three-story frame structure with an overall height of 16.5 m. The girder of the bridge is a cast-in-place box girder with variable heights. The layout at the transverse direction of the beam-type covered bridge consists of 3.2 m (pedestrian street) + 2.4 m (veranda) + 18 m (shopping mall) + 2.4 m (veranda) + 3.2 m (pedestrian street). The piers are 30.70 m × 1.5 m round-ended solid wall piers with a height of 4.1 m, made of C40 concrete. The diameter of the longitudinal reinforcement, stirrup and tie bar is 28 mm, 12 mm and 16 mm, respectively, with a grade of HRB400. The details of the wall pier are shown in Figure 1. The axial load ratio of the pier is 5.8%. Where, the axial load ratio = N/(Agfc′); N is the axial load, Ag is the area of cross-section and fc′ is the compressive strength of concrete.

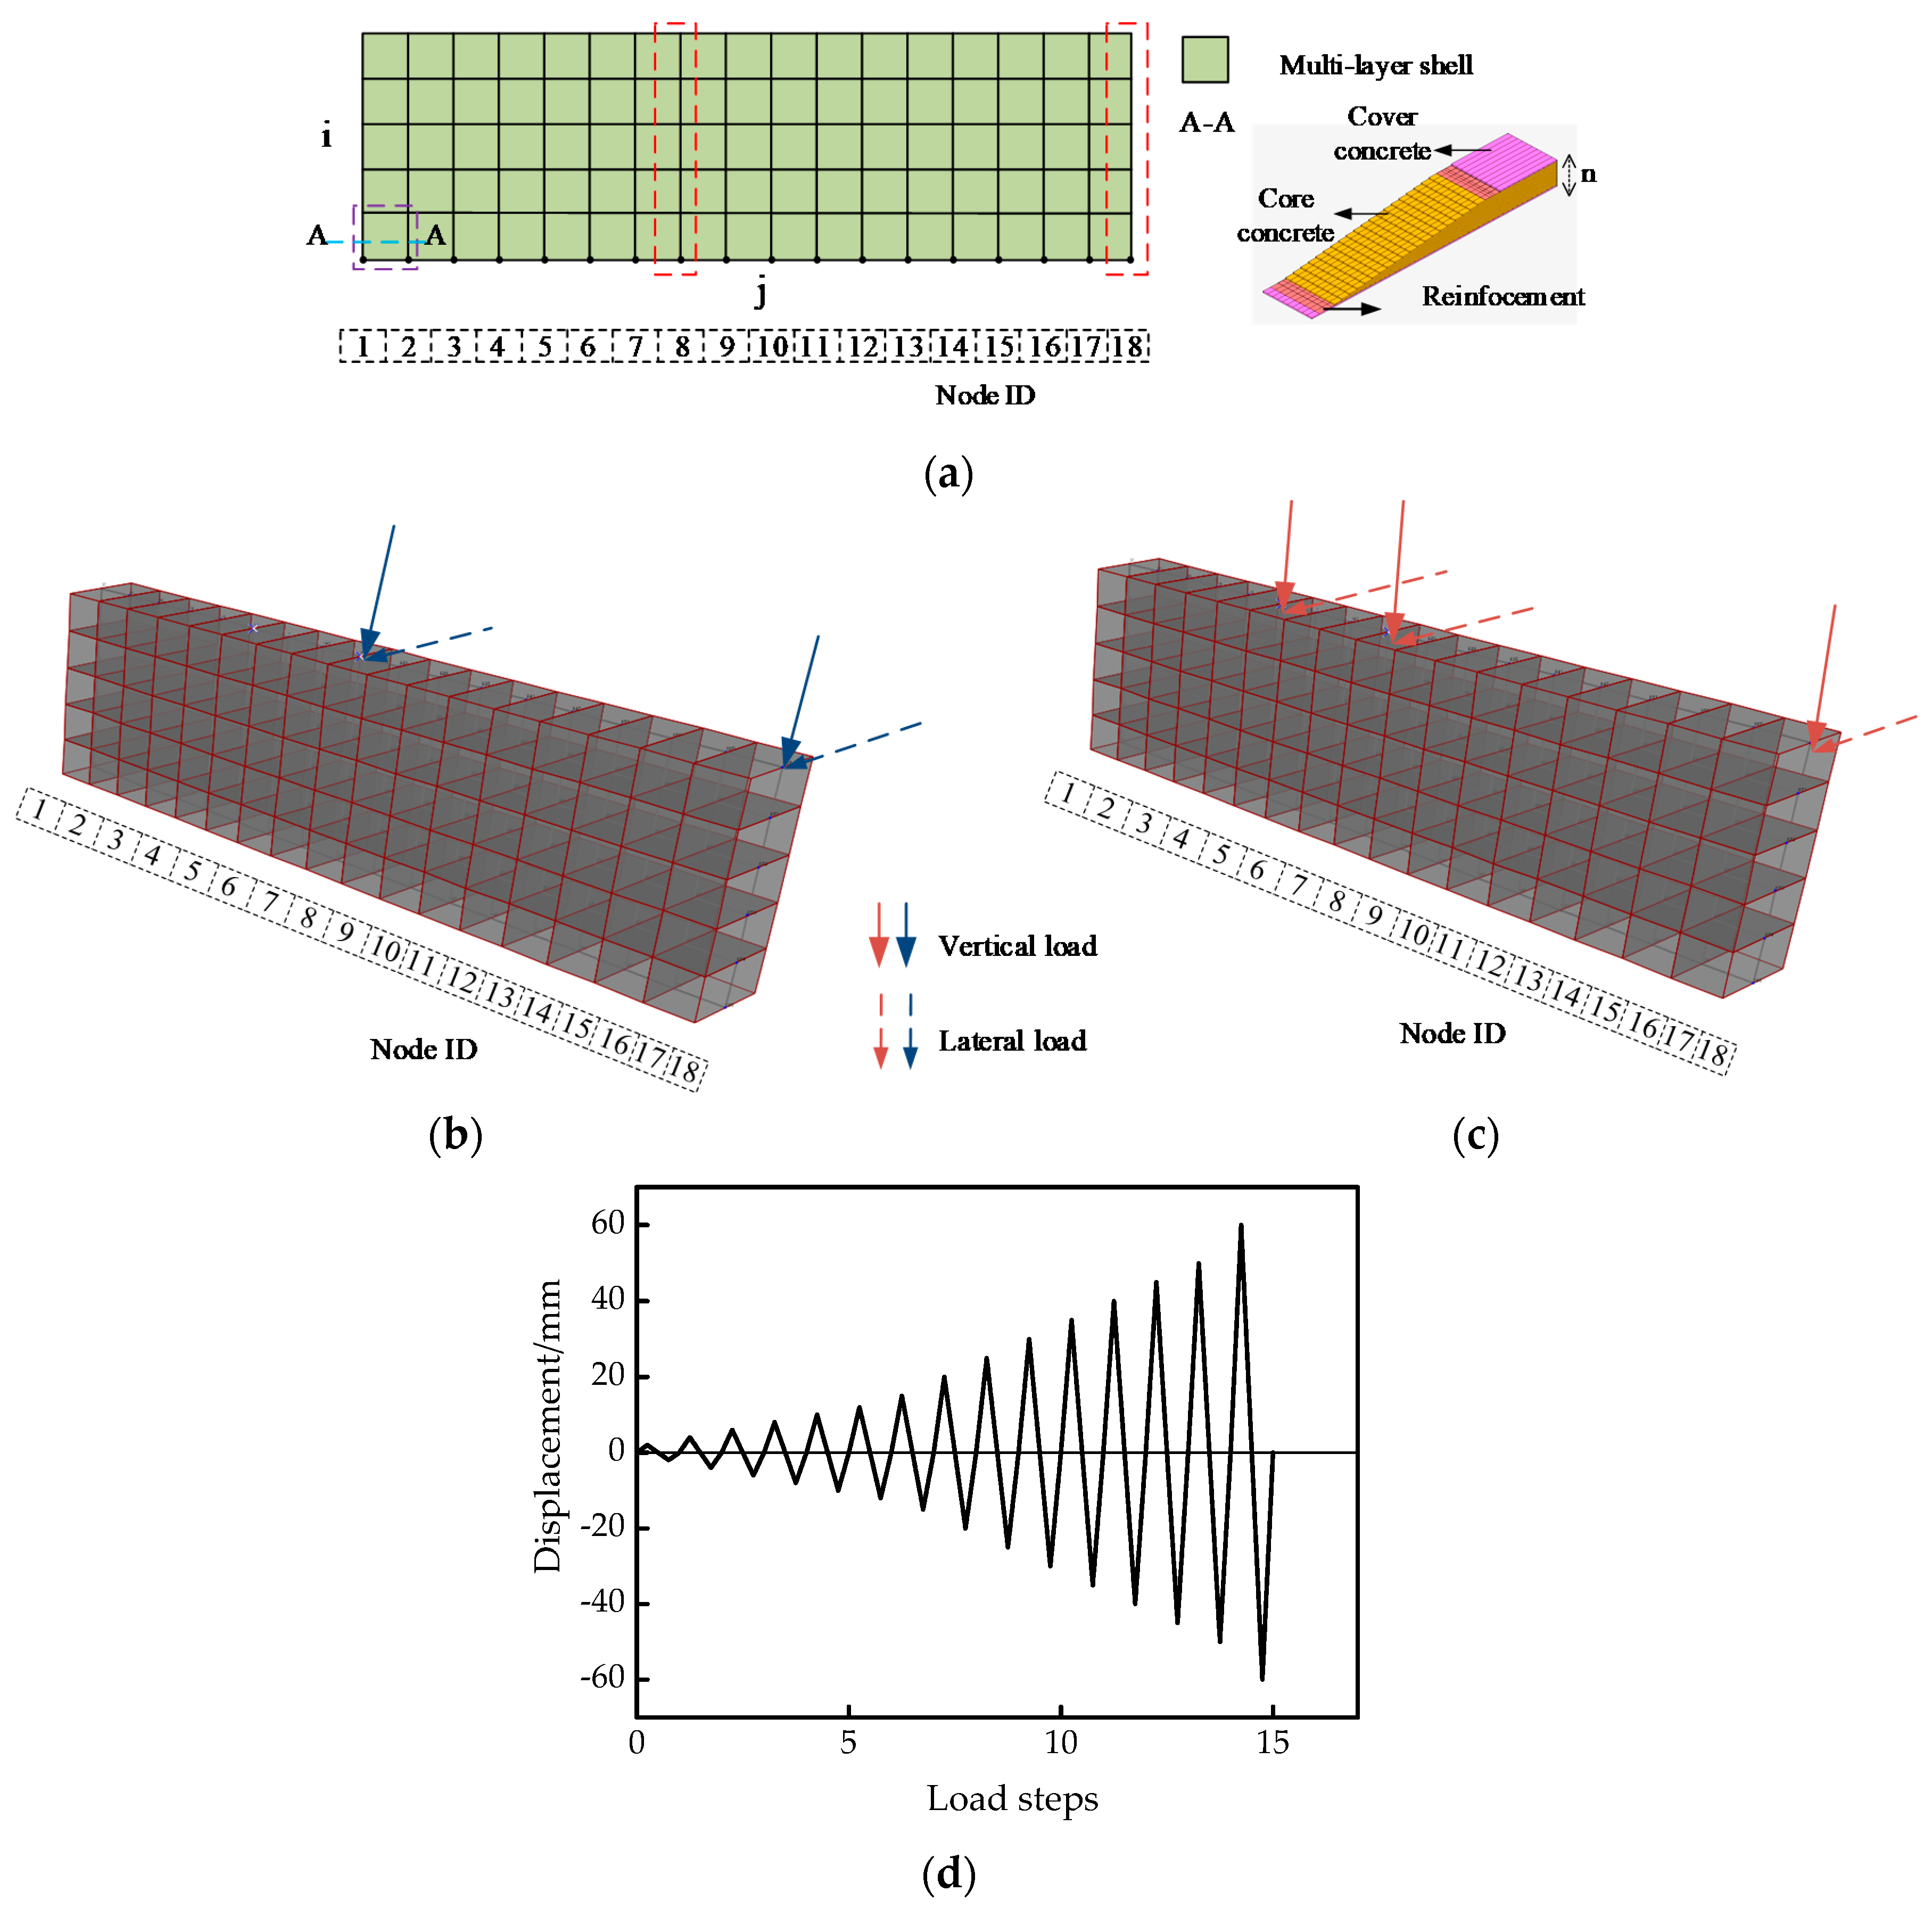
2.2. Finite Element Model

Based on the principle of composite mechanics [11,12,13], the multi-layered shell element is divided into concrete layers and reinforcement layers in the thickness direction. Each layer can be given a definite thickness according to the actual size and reinforcement arrangement of the member, as shown in Figure 2. The multi-layered shell model adopts the multi-dimensional concrete material (nDmaterial PlaneStressMaterial) based on damage mechanics and dispersion crack model and the multi-dimensional reinforcement material (nDmaterial PlateRebar). The longitudinal reinforcements and transverse reinforcements are discretized into orthogonal reinforcement layers, which are respectively arranged at the corresponding physical positions of the component.
The coupling between in-plane bending, in-plane shear and out-of-plane bending is considered in the multi-layer shell element [14], which can comprehensively reflect the spatial mechanical properties of the component [15]. Based on the layered shell theory, some researchers [15,16] developed a two-dimensional concrete constitutive model and layered shell model in OpenSEES and verified the rationality of the model through a series of numerical examples [17,18,19]. A new high-performance quadrilateral plate and shell element DKGQ, proposed by Wang et al. [20], is utilized here. The concrete adopts a two-dimensional constitutive model, for which the specific meaning and value can be found in [15] and the reinforcement employs the Menegotto–Pinto modified model [21] considering the Bauschinger effect, as shown in Figure 3, embedded according to the actual position of the two layers of reinforcements in Figure 1, in which R0 = 18.5, a1 = 0.925, a2 = 0.15 and b = 0.01. In Figure 3, ft is the tensile strength of the concrete, fc is the compressive strength of the concrete, εcu is the strain at crushing strength, εc0 is the strain at compressive strength, εt is the strain at tensile strength and εtu is the ultimate tensile strain. Moreover, σy indicates the yield strength of the reinforcement, E0 is the initial elastic tangent and εy is the strain at yield strength.

2.3. Modeling Parameters

Due to the element mesh of the finite element model affecting the calculation speed and accuracy [22,23], especially for large structures, and the higher calculation cost with finer mesh sensitivity, it is necessary to determine the element division parameters. Considering that the multi-layer shell element model discretizes the concrete and reinforcement into several layers, the wall pier in Figure 1 is modeled in diverse layers along the thickness direction and various meshes. A total of 10 pier models are established to plot its hysteretic curves and skeleton curves to determine the best model parameters. The model attributes are shown in Table 1.
The wall pier is a significant lateral force resisting member of the covered bridge under the action of an earthquake. The research shows that the wall pier performs well in the strong axis direction and it is found that the influence of its in-plane performance on the vulnerability can be ignored when conducting the transverse pushover analysis [24]. Therefore, the study on the out-of-plane performance of the wall pier is the key point. Under the longitudinal seismic action, the wall pier is no longer a cantilever beam suffering a single-point loading and its horizontal lateral loading mode is related to the force applied from the superstructure; that is, it concerns the layout of the bearings. Three or five bearings are usually arranged on the pier of the covered bridge and some wall piers are generally designed with the bent cap as well. Consequently, the diverse numbers of loading points are designed to study the seismic performance of the wall pier and the parameters are shown in Table 2. Figure 4b,c show the lateral and vertical loading modes of half of the wall pier models of TestA-2 and TestA-6.
The model is fixed at the bottom during the analysis of low cycle reciprocating loading. All models are subjected to the loading protocol shown in Figure 4d. The protocol consists of a series of displacement-controlled cycles given in lateral drift [25,26,27,28] and the lateral drift for each model is increased by Δ (where Δ = 2 mm). The applied displacement amplitude increases step-by-step until the bearing capacity of the model decreases to about 85% of the peak bearing capacity. The dead load of the pier and the vertical reaction force (51,000 kN) of the superstructure are applied to the specific locations of the bearings before the horizontal load to simulate the weight of the superstructure transmitting to the pier through the bearings.

3. Results and Discussions

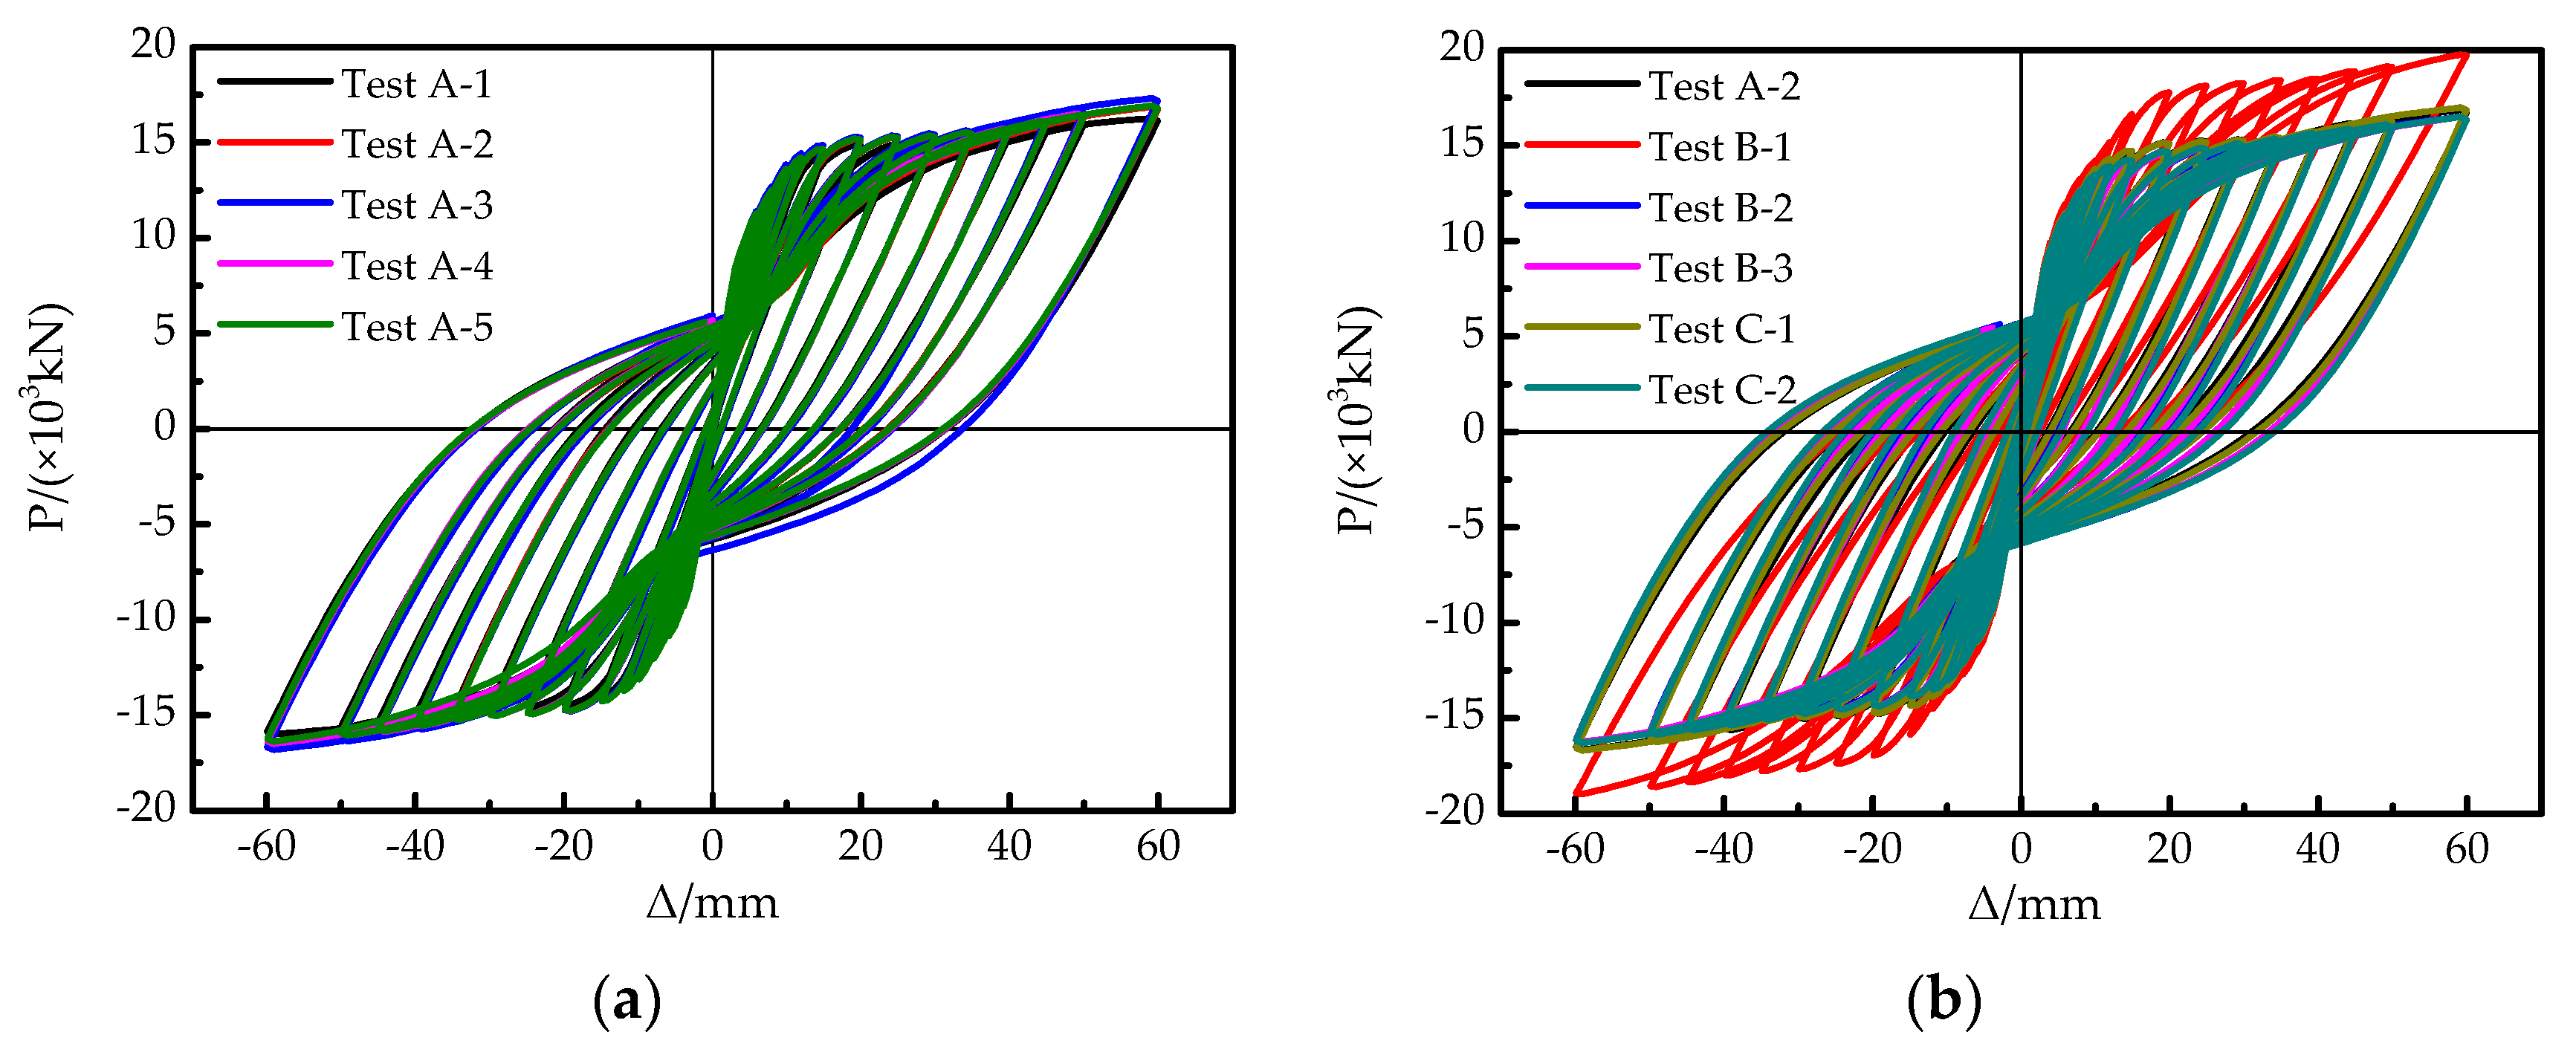
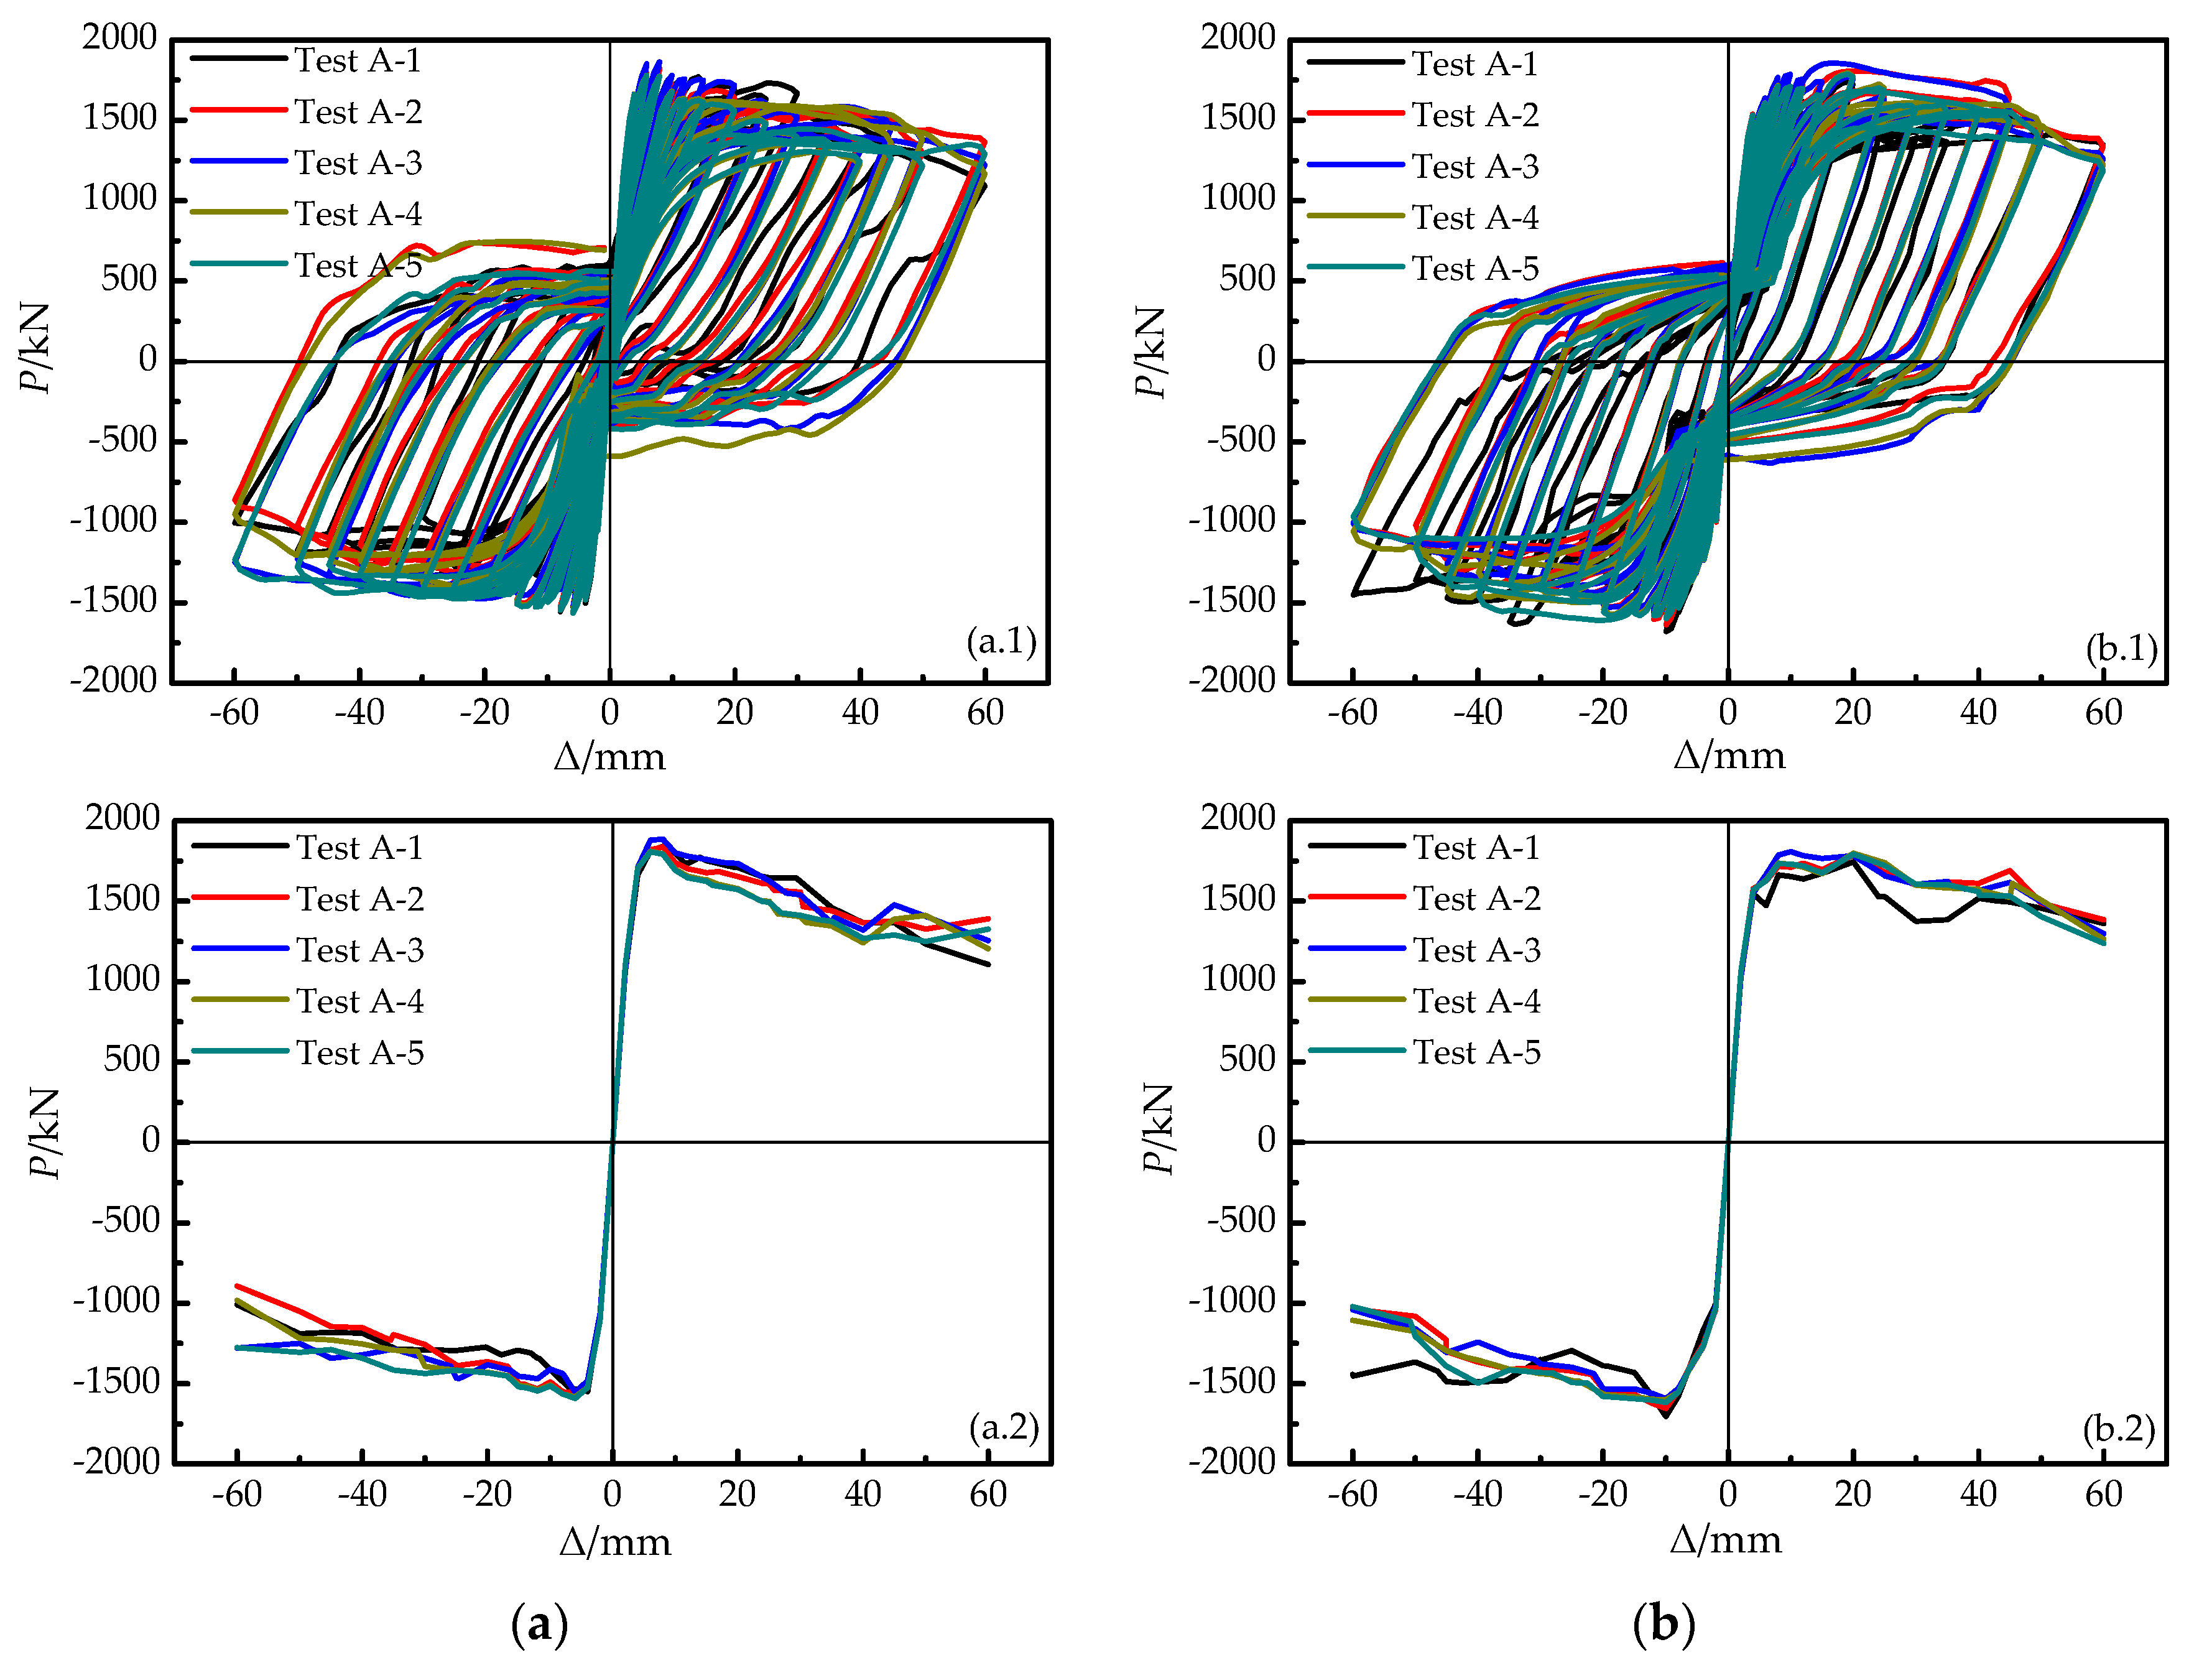
3.1. Hysteretic Curves and Skeleton Curves

The parameters of the mesh are set as i = 5 and j = 34, as shown in Table 1, while the influence of layer division on the seismic performance of the wall pier is investigated. The horizontal lateral load mode of three loading points is adopted. The global force–displacement response of each model is plotted in Figure 5. It can be seen that the bow-shaped hysteretic curves of the wall pier models are plump and present a certain pinch effect, indicating their strong energy dissipation capacity. The models are working in the elastic stage in the period of initial loading and the hysteretic curves are concentrated and overlapped. The shape, area and loading and unloading trend of the hysteretic curves simulated for different layer divisions are similar, demonstrating that the layer discretization has very little effect on the accuracy. Hence, taking the pier thickness, calculation speed and accuracy into overall consideration in the follow-up study with other variables, n = 26 is used as the layer parameter of the multi-layer shell element model.
The results of the mesh of the multi-layer shell element model on the seismic performance of a wall pier under cyclic load are shown in Figure 5b. The vertical division of elements directly affects this greatly. When i = 5, the curves tend to be overlapped. It can be also concluded that rough meshing will reduce the accuracy, whereas the bearing capacity of TestB-1 is obviously higher than that of other models.

3.1.1. Number of Layers

Varying from the ordinary beam or column members, the width of the wall pier studied is much larger than that in the other two directions, so the stress and deformation vary with the positions of the pier. The force–displacement curve of the pier top reflects the global performance of the pier. However, the characteristics of its local position are closely related to the vertical mesh as a result of the nonlinear deformation being concentrated at the key position of the maximum moment. In the cantilever pier model, nonlinearity occurs in the lowest row of elements. To further acquaint the effect of the division of layers and meshing in the multi-layer shell element on the mechanical properties of wall piers, the reaction of the pier bottom corresponding to the horizontal lateral loading point in Figure 4, that is, the reactions at Node8 and Node18, are drawn into hysteretic curves and skeleton curves with the pier top displacements, as shown in Figure 6.
It can be discovered from the curves at Node8 and Node18 that the loading in the positive and negative directions is basically symmetrical and the bottom of the wall pier is in the elastic stage before cracking and there are minor differences in the slope of each hysteretic curve. With the increase in horizontal loading displacement, the stiffness of the pier begins to degrade and the hysteretic area increases, but the shape is still a bow with an obvious pinch effect. The bearing capacities of models decrease rapidly after reaching the peak load in the light of the skeleton curves at Node8. The platform stages of the skeleton curves at Node18 are more obvious compared with those of Node8, which states that the pier is destroyed when the displacement grows steadily to a certain stage after its yielding.

3.1.2. Parameters i and j of Meshing

Figure 7 describes that the hysteretic curve of TestB-1 (i = 2) presents a prolate fusiform shape and the pier has no obvious characteristics such as the reduced bearing capacity. The hysteretic curves of TestA-2, TestB-2 and TestB-3 are bow shaped and obviously pinched. There is almost no gap in the initial stiffness of the models, but the bearing capacity decreases significantly after reaching the peak load. Regardless of TestB-1, Figure 7(a.1) shows that the bearing capacity degradation of TestA-2 is slower than that in other cases after the peak in the positive direction, but in the negative direction, the degradation of TestB-2 is more delayed. Figure 7(b.1) states that the bearing capacity of TestA-2 is slightly greater than that of the other two models. This phenomenon is caused by the asymmetry of the loading in the positive and negative directions due to the directionality of the initial loading and the Bauschinger effect of reinforcement.
From the hysteretic curve drawn by the horizontal displacement and the horizontal reaction force at Node8 in Figure 7(a.2), it can be concluded that the peak load is greater and the horizontal bearing capacity decreases more obviously with a finer horizontal division. When the height-to-width ratio of each mesh is about 1, the hysteretic curve of TestA-2 at Node18 (Figure 7(b.2)) is plumper and dissipates more energy than that of TestC-1. Figure 7(a.3) illustrates that the horizontal mesh division has a limited impact on the initial stiffness, peak bearing capacity and the downward trend of capacity. However, it can obviously affect the shape of the hysteretic curve at Node18 during unloading, as shown in Figure 7(b.3). The upward depression of the curve is distinct during unloading, such as TestC-2. Therefore, it is clear that the horizontal meshing depends on that of the vertical and it has a significant impact on the hysteretic curves of different locations of the wall pier studied.
The discretization of layers has little effect on the results, in view of the shape of the hysteretic curve and the skeleton curve. Except for model TestB-1, the energy dissipations of other models are almost equivalent from the perspective of energy. When i = 5, i.e., Δh = 0.82 m, the results tend to be accurate. Referring to the plastic hinge formula of the column, Δh is supposed to be greater than the plastic hinge length, LP = 0.5744 m. The height-to-width ratio of mesh should be about 1 to ensure the calculation speed and accuracy simultaneously when using the multi-layer shell element model. Therefore, the mesh parameters of i = 5 and j = 34 are more reasonable in this model.
There is a lot to be found in common when comparing and analyzing the hysteretic characteristics of models. The loading and unloading curves coincide in the initial stage of loading. The large initial stiffness indicates that the pier is in a linear elastic working state. With the increase in loading displacement, the pier gradually enters the elastic–plastic stage and the hysteretic curve gradually becomes plumper. The area of the curve also increases and there is residual deformation after unloading. The results of layer and mesh division of the multi-layer shell element model on the global seismic performance of the pier are relatively interchangeable, but the responses of the local position are different. Adopting the force–displacement curve of the local position is more conducive to the study of the seismic performance of the wall pier. The curves at Node8 and Node18 simultaneously demonstrate that the hysteretic curves are not completely smooth in the unloading process and present a certain pinch effect. It can be inferred that there is a certain bite effect between the reinforcement layer and the concrete layer in the layered shell model. The bearing capacity borne by the cover concrete layer transits to the reinforcement with the increase in loading displacement and in this process, the capacity decreases slightly because the deformation between layers in the multi-layer shell element meets the plane section assumption. The discretization of layer and meshing do not affect the initial stiffness and peak load significantly, but the decline rate of bearing capacity is somewhat different. In general, the bearing capacity at Node8 of the wall pier decreases faster than that at Node18 after exceeding the peak load.

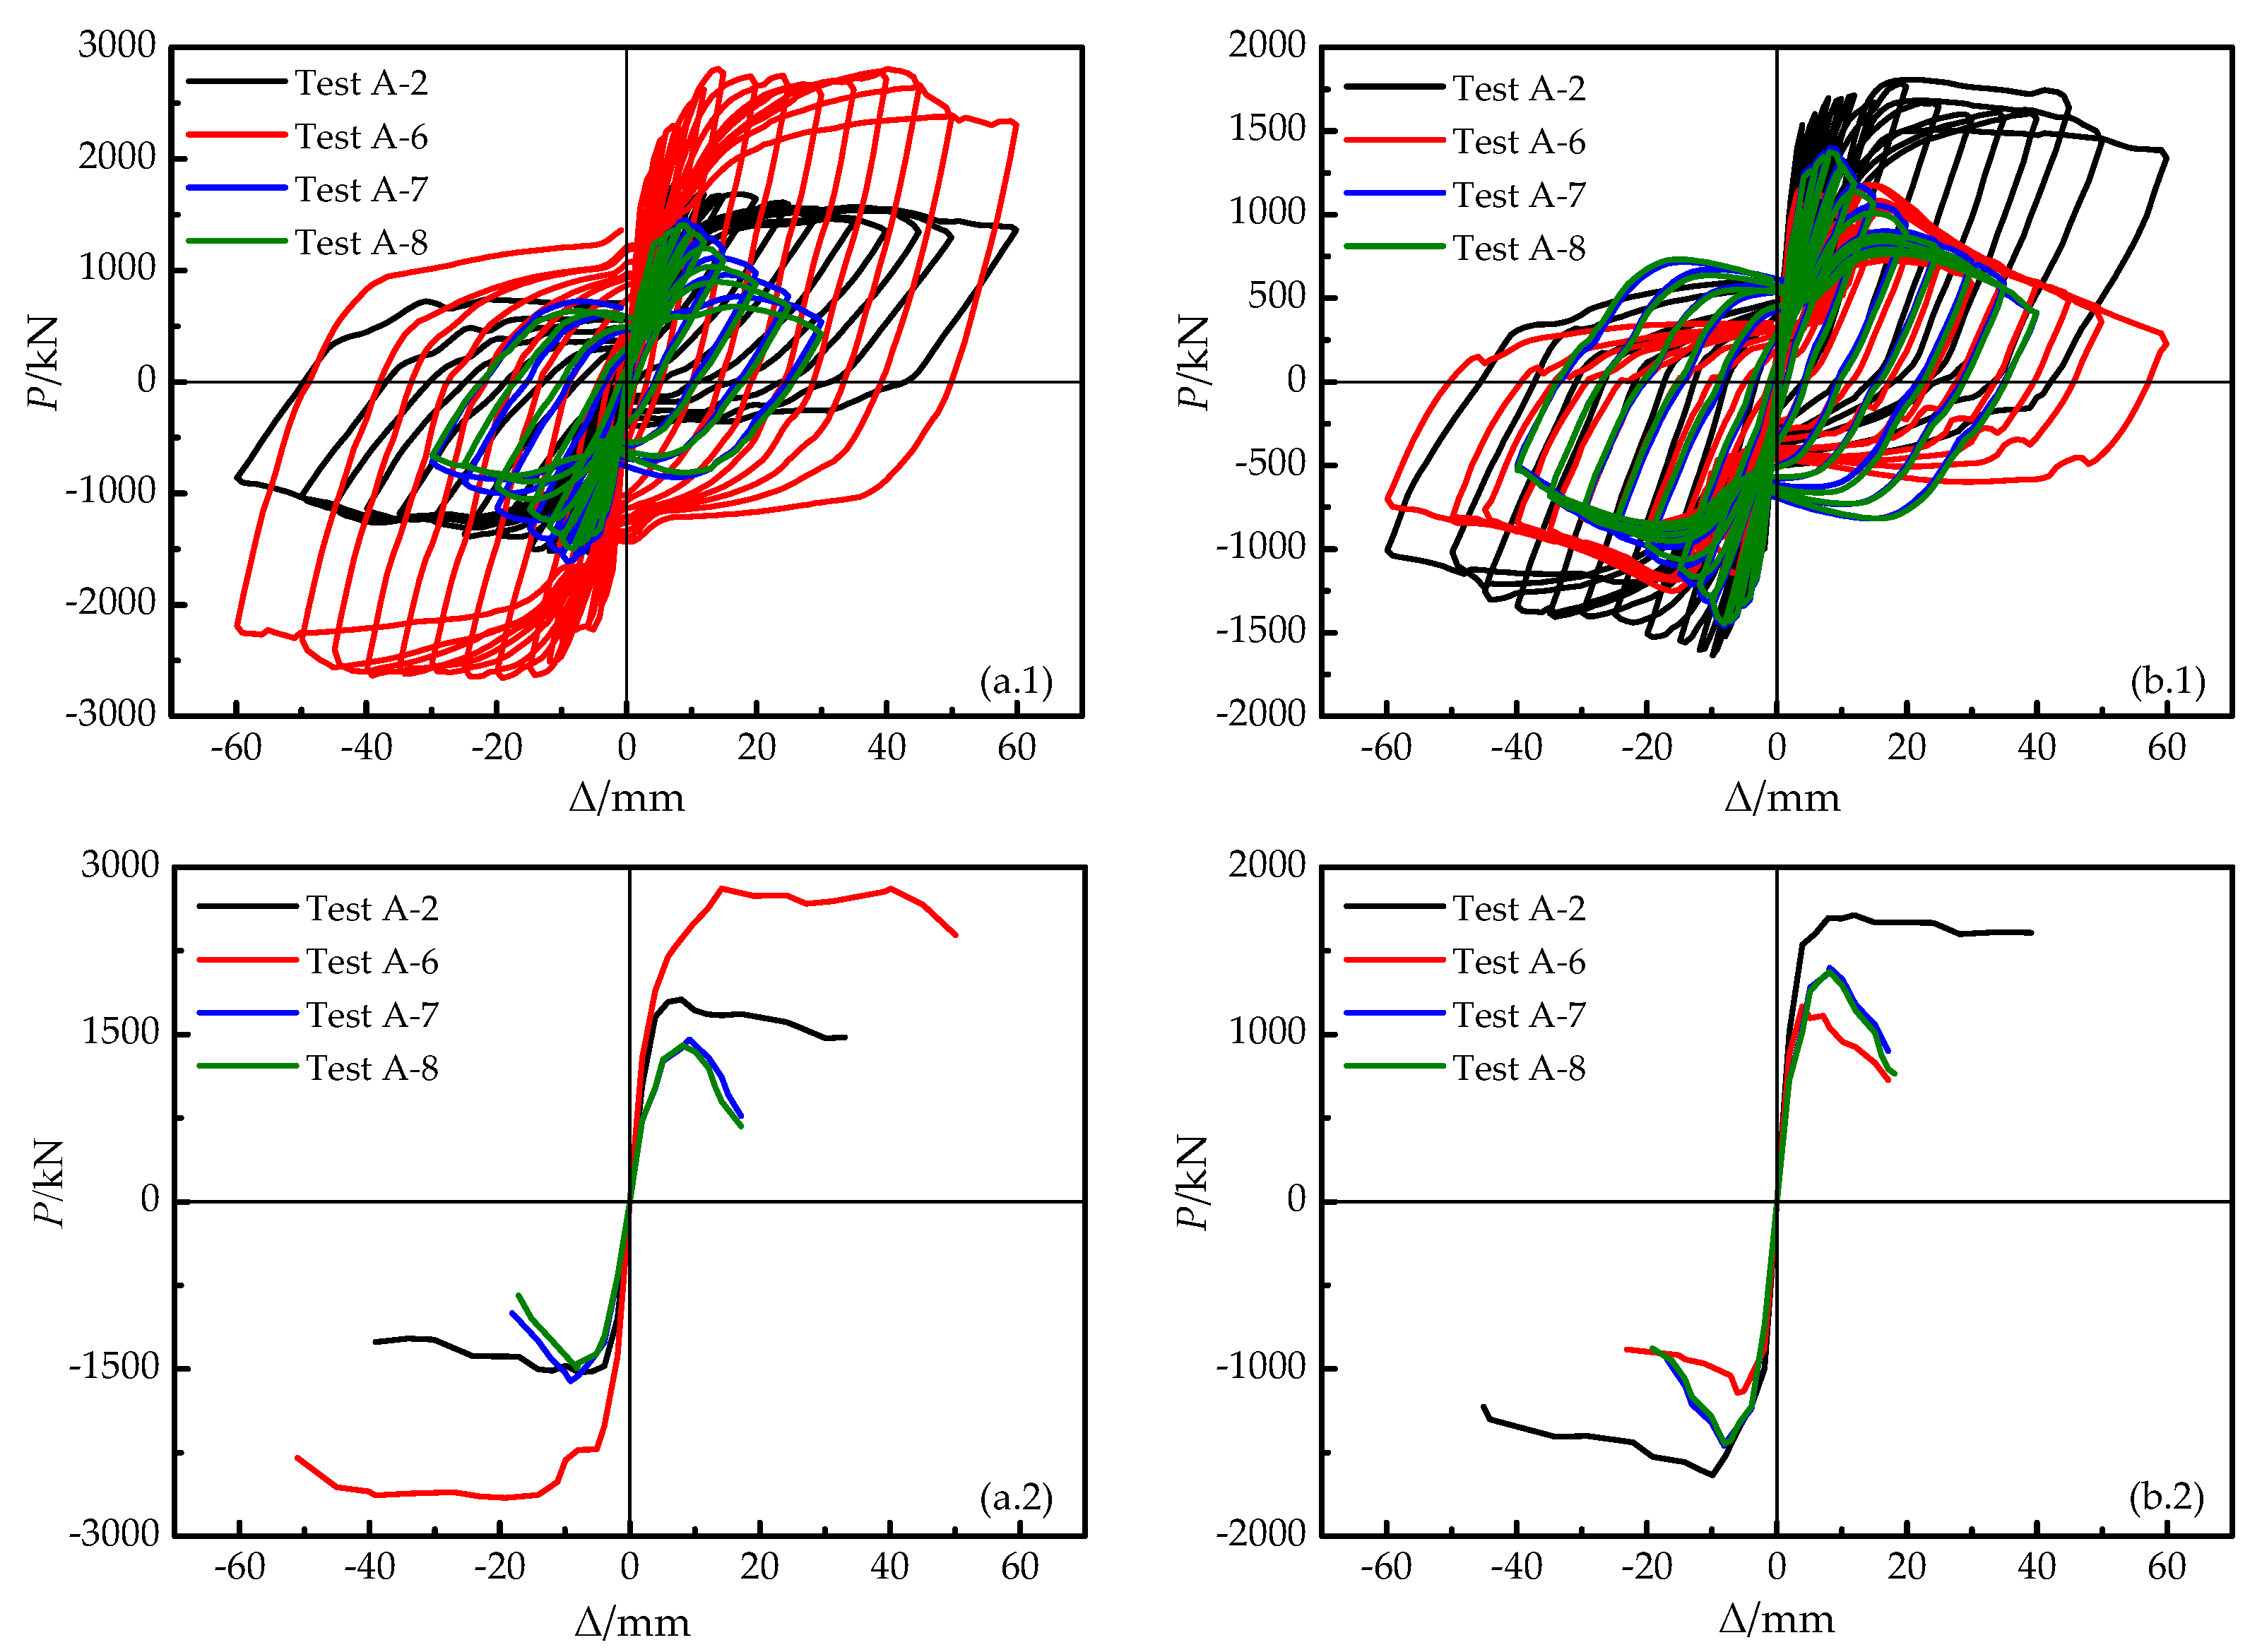
3.1.3. Loading Pattern

As the width of the wall pier of the covered bridge being investigated is extraordinarily large, the influence of the application pattern of a lateral load under a cyclic load on its energy dissipation, stiffness and strength degradation and ductility should be studied.
The hysteretic curve and skeleton curve of the layered shell element model with different lateral load applications are presented in Figure 8. Figure 8(a.1) shows that the bearing capacity of TestA-6 is significantly greater than that of TestA-2, TestA-7 and TestA-8. This is because in the arrangement of five loading points, the loading point on the pier top corresponding to Node8 is close to the loading point on the left (see in Figure 4), resulting in extrusion and distortion, and causing stress concentration near this position and the pier bottom during the loading process. Similarly, since the loading point corresponding to Node18 is far from the loading points on both sides, this phenomenon does not occur, as shown in Figure 8(b.1). Figure 8(a.1) and Figure 8(b.1) both show that with the increase in horizontal loading displacement, the hysteretic loops of TestA-7 and TestA-8 incline to the displacement axis, but the shapes have no change and more coincidence. The skeleton curves in Figure 8(b.2) indicate that the plastic deformation capacity of each model decreases with the increase in the loading points. According to Figure 8(a.2), the skeleton curves of TestA-7 and TestA-8 are in broad agreement and there is a significant decline after the peak load, while TestA-2 shows a large deformation capacity.

3.2. Energy Dissipation

Figure 9 describes the change curve of the cumulative hysteretic energy dissipation Ehyst of the model with loading displacement Δ under horizontal lateral loading mode. As can be seen from Figure 9a, when the horizontal displacement Δ ≤ 12 mm, the TestA-2 is still in the elastic stage. The energy dissipation of each model is at a low level and the curve grows relatively modestly. With the increase in displacement amplitude, the concrete and reinforcement of TestA-2 and TestA-6 gradually enter the plastic working state and the energy dissipation curve shows a stable growth trend. The cumulative energy dissipation of TestA-6 is generally greater than that of TestA-2. The reason for this may be that in the multi-layer shell element model, five lateral horizontal loadings cause the distortion and extrusion of the shell element and more energy loss. The least energy dissipation exists when all nodes are loaded, which is due to the increase in loading points. The force on each loading point is small, but the resultant force of all loading points is approximately equal to that of the three or five loading points.
The cumulative energy dissipation of TestA-8 is 12.74% of that of TestA-2. It can be seen from Figure 9b that for the cumulative energy dissipation at Node8, TestA-6 possesses the maximum value, whereas the value of TestA-2 is the minimum. Nevertheless, the cumulative energy dissipations of the two models at Node18 are basically equal. The bearing capacities of TestA-7 and TestA-8 decrease rapidly after the peak load and as a result, the energy dissipations are inadequate. Due to the poor deformation capacity, the total value is much lower than that of TestA-2, but under the same horizontal load level, their energy dissipation capacity is slightly greater than that of TestA-2. Compared with Figure 9b,c, the energy dissipation capacity of Node8 of TestA-6 is 2.52 times that of Node18. In general, the local energy dissipation law of the models is consistent with those of the global one.

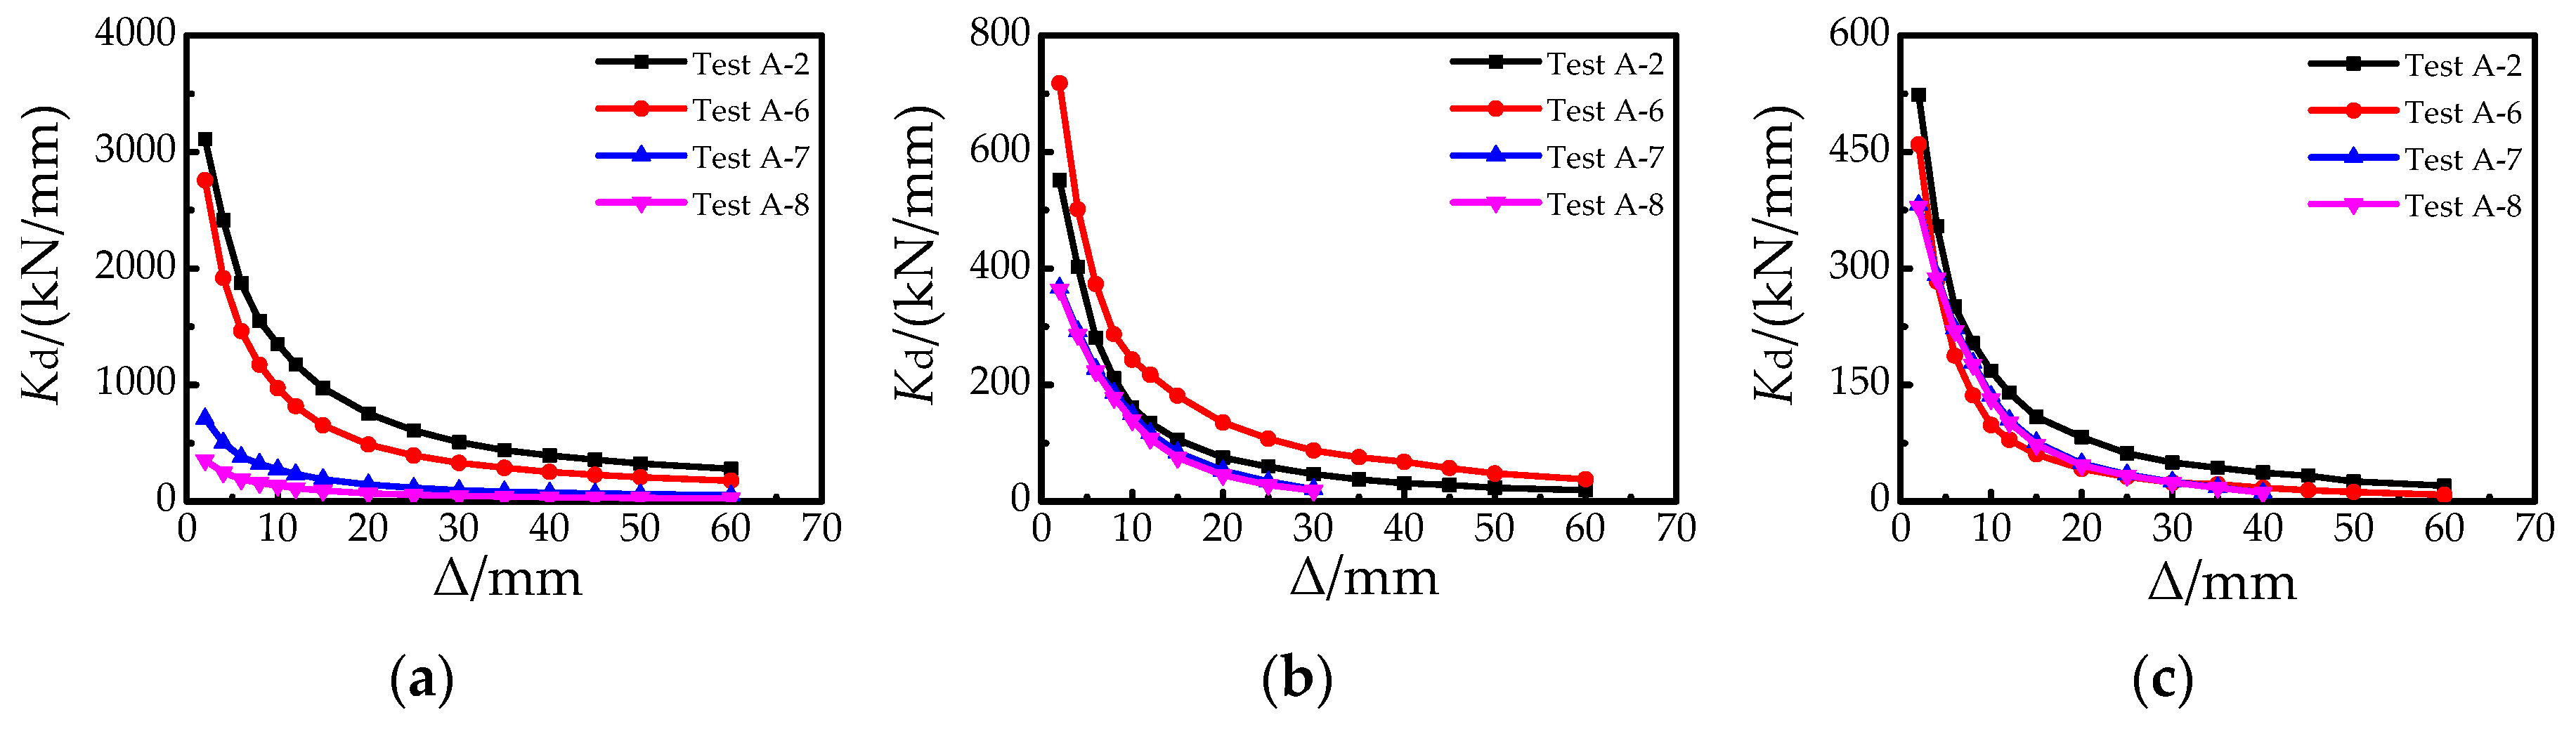
3.3. Stiffness Degradation

Figure 10 illustrates that with the increase in horizontal displacement, the stiffness begins to decrease. After TestA-2 and TestA-6 enter the plastic state, the stiffness degradation is not more obvious than that in the elastic stage. Figure 10a shows that with increasing horizontal loading points, the relationship curves between secant stiffness and displacement of corresponding models (TestA-7 and TestA-8) are smoother and closer to the displacement axis than that of TestA-2 and TestA-6. The lateral stiffness of the pier decreases very slowly in the latter stage of loading. Under the four loading modes, the stiffness attenuations are more than 92%. It can be seen from Figure 10b,c that the horizontal lateral loading mode has no obvious impact on the stiffness degradation at the local position. Comparing the two figures, it can be concluded that under the horizontal loading mode of five points, a tremendous difference exists in the stiffness degradation at Node8 and Node18, which is due to the close distance between the two loading points corresponding to the top horizontal load of Node8. Thus, the pier body is squeezed and warped and the force and displacement at some positions are suddenly changed. The loading point at the top and middle of the pier corresponding to Node18 is far away from the edge load loading point, so the deformation and stress of the wall pier body is not being greatly affected. The stiffness degradation range of all the models is more than 94%, which is only about 2% different from the global stiffness degradation.

3.4. Bearing Capacity and Displacement Ductility

The method proposed by Park [29] is used to determine the yield displacement and ultimate displacement of the wall pier, and the displacement ductility is defined as the ratio of the two items. The characteristic points of the skeleton curve of the multi-layer shell element model are summarized in Table 3 and the data in the table are the average values brought about by positive and negative loading.
It can be concluded from Table 3 that due to the small spacing of the side loading points in the lateral horizontal loading mode of five points, TestA-6 at Node8 has the largest bearing capacity and displacement, which is not applicable at Node18. Regardless of the characteristics of TestA-6, the bearing capacity of the model gradually decreases with the increase in horizontal loading points, but there is no evident divergence of the yield displacement. The great gap in ductility between TestA-2, TestA-7 and TestA-8 is that the ultimate displacement of TestA-2 is significantly beyond that of TestA-7 and TestA-8. The displacement ductility coefficient at Node18 is generally greater than that at Node8 without the consideration of TestA-6. The ductility values of TestA-7 and TestA-8 are approximately equal to each other and the average value is 2.42.
When studying the influence of the horizontal lateral loading mode on the seismic performance of a wall pier, the arrangement of loading points is equivalent to the restraint system of pier, which may cause stress concentration at the local position of the pier. When the loading points increase and are evenly distributed, such as TestA-7 and TestA-8, compared with TestA-2, the capacity and displacement changes sharply and the ductility diminishes. Successively, from TestA-2 and TestA-7 to TestA-8, the seismic performance indexes at the local position of the wall pier tend to be more consistent with the increasing loading points. That means the pier is subject to denser constraints, so the plastic deformation capacity decreases. As for TestA-6, whose one side of the loading point is dense and the other side is relatively dispersed, compared with TestA-2, whose loading points on both sides are relatively dispersed, the one side of the loading point on the pier top corresponding to Node8 can be regarded as constrained and the other side can be considered as a free end. This pier is squeezed under this action, so it has a large plastic deformation and strong energy dissipation capacity. The results at Node18 follow the ductility reduction for raising the total loading points. Overall, it can be concluded that the form of setting three bearings and no bent cap for the wall pier of the covered bridge is more reasonable through the comprehensive analysis of the energy dissipation capacity, stiffness degradation, bearing capacity and displacement ductility, as well as the more concentrated force at the local position.

4. Conclusions

Finite element models of the wall pier are established by the multi-layer shell element. The seismic performance of the pier under low cyclic reciprocating loading is studied and the following conclusions are obtained:
(1)
Adopting the force–displacement curve of the local position is more conducive to studying the seismic performance of wall pier.
(2)
The discretization of layers along the thickness direction of the multi-layer shell element model has a very limited effect on the hysteretic curves and skeleton curves. The horizontal mesh division depends on that of the vertical, and the length of vertical mesh should be longer than the plastic hinge length of 0.5744 m.
(3)
The arrangement of loading points is critical for the seismic behavior of the wall pier. The pier suffering the force from the five points presents a relatively strong energy dissipation and larger ductility, but this layout may cause a more concentrated force at the local position.
(4)
When the loading pattern is evenly distributed, the capacity and displacement changes sharply and the ductility diminishes. Successively, the seismic performance indexes at the local position of the wall pier tend to be more consistent with the increasing loading points. The deformation and energy dissipation capacity of the nearby position with the denser side loading points become larger, but it has a minor impact on the seismic performance of the position far from the points.
(5)
The wall pier without a bent cap and with three bearings set is supposed to be more reasonable for the covered bridge through the overall analysis of seismic performance.

Author Contributions

Conceptualization, W.Q.; methodology, W.Q.; writing-original draft preparation, W.Q. and K.W.; writing-review and editing, W.Y. All authors have read and agreed to the published version of the manuscript.

Funding

This study was supported by the Science and Technology Project of Department of Housing and Urban-Rural Development in Anhui Province (2019YF-007).

Acknowledgments

The authors want to acknowledge the comments of the reviewers, whose comments significantly improved quality and readability of the paper.

Conflicts of Interest

The authors declare no conflict of interest.

References

  1. Bignell, J.L.; LaFave, J.M.; Hawkins, N.M. Seismic vulnerability assessment of wall pier supported highway bridges using nonlinear pushover analyses. Eng. Struct. 2005, 27, 2044–2063. [Google Scholar] [CrossRef]
  2. Wang, K.H. Seismic Research of Bridges, 2nd ed.; China Railway Press: Beijing, China, 2015; pp. 136–138. (In Chinese) [Google Scholar]
  3. Bignell, J.L. Assessment of the Seismic Vulnerability of Wall Pier Supported Highway Bridges on Priority Emergency Routes in Southern Illinois. Ph.D. Thesis, University of Illinois at Urbana-Champaign, Urbana, IL, USA, 2006. [Google Scholar]
  4. Siddiquee, K.N. Seismic Vulnerability Assessment of Wall Pier Highway Bridges in British Columbia. Master’s Thesis, University of British Columbia, Okanagan, BC, Canada, 2015. [Google Scholar]
  5. Chen, L.B.; Tu, Y.; He, L.Q. A probabilistic capacity model and seismic vulnerability analysis of wall pier bridges. Appl. Sci. 2020, 10, 926. [Google Scholar] [CrossRef] [Green Version]
  6. Zhou, Z. The Influence of Shear-Span Ration on the Seismic Response of Round-Ended Solid Piers in High Speed Rail. Master’s Thesis, Central South University, Changsha, China, 2014. (In Chinese). [Google Scholar]
  7. Ma, L.; Xia, X.S.; Chen, X.C. Analysis and comparison of analysis models for seismic responses of railway bridge transverse piers. J. Lanzhou Jiaotong Univ. 2019, 38, 20–25. (In Chinese) [Google Scholar]
  8. Shao, G.Q.; Jiang, L.Z.; Chouw, N. Experimental investigations of the seismic performance of bridge piers with rounded rectangular cross-sections. Earthq. Struct. 2014, 7, 463–484. [Google Scholar] [CrossRef]
  9. Li, L. Ductility Seismic Analysis of High-speed Railway Bridge Piers with Low Reinforcement Ratio. Master’s Thesis, Beijing Jiaotong University, Beijing, China, 2017. (In Chinese). [Google Scholar]
  10. Salazar, R.; Baylon, M.B.; Lomibao, J.P.M. Seismic Vulnerability Assessment of Pandacan Rail Bridge Wall Pier Using Fragility Curves. Bachelor’s Thesis, University of the City of Manila, Manila, Philippines, 2018. [Google Scholar]
  11. Miao, Z.W.; Lu, X.Z.; Jiang, J.J. Nonlinear FE model for RC shear walls based on multi-layer shell element and microplane constitutive model. In Computational Methods in Engineering and Science; Tsinghua University Press & Spring: Sanya, China, 2006. [Google Scholar]
  12. Lu, X.Z.; Jiang, Q.; Miao, Z.W. Elasto-Plastic Analysis of Buildings against Earthquake, 2nd ed.; Building Industry Press of China: Beijing, China, 2015; pp. 198–203. (In Chinese) [Google Scholar]
  13. Xie, L.L.; Huang, Y.L.; Lu, X.Z. Elasto-plastic analysis for super tall RC frame-core tube structures based on OpenSEES. Eng. Mech. 2014, 31, 64–71. (In Chinese) [Google Scholar]
  14. Feng, D.C.; Ren, X.D.; Li, J. Cyclic behavior modeling of reinforced concrete shear walls based on softened damage-plasticity model. Eng. Struct. 2018, 166, 363–375. [Google Scholar] [CrossRef]
  15. Lu, X.Z.; Xie, L.L.; Guan, H. A shear wall element for nonlinear seismic analysis of super-tall buildings using OpenSEES. Finite Elem. Anal. Design 2015, 98, 14–25. [Google Scholar] [CrossRef] [Green Version]
  16. Lu, X.; Lu, X.Z.; Guan, H. Collapse simulation of reinforced concrete high-rise building induced by extreme earthquakes. Earthq. Eng. Struct. Dyn. 2013, 42, 705–723. [Google Scholar] [CrossRef] [Green Version]
  17. Maio, Z.W.; Ye, L.P.; Guan, H.; Lu, X.Z. Evaluation of modal and traditional pushover analyses in frame-shear-wall structures. Adv. Struct. Eng. 2011, 14, 815–836. [Google Scholar] [CrossRef] [Green Version]
  18. Hallinan, P.; Guan, H. Layered finite element analysis of one-way and two-way concrete walls with openings. Adv. Struct. Eng. 2007, 10, 55–72. [Google Scholar] [CrossRef] [Green Version]
  19. Guan, H.; Loo, Y.C. Flexural and shear failure analysis of reinforced concrete slabs and flat plates. Adv. Struct. Eng. 1997, 1, 71–85. [Google Scholar] [CrossRef]
  20. Wang, L.S.; Cen, S.; Xie, L.L. Development of a shear wall model based on new flat shell element for large deformation simulation and application in OpenSEES. Eng. Mech. 2016, 33, 47–54. (In Chinese) [Google Scholar]
  21. Menegotto, M.; Pinto, P.E. Method of analysis for cyclically loaded R. C. plane frames including changes in geometry and non-elastic behavior of elements under combined normal force and bending. In Symposium on the Resistance and Ultimate Deformability of Structures Acted on by Well Defined Repeated Loads; International Association for Bridge and Structural Engineering: Zurich, Switzerland, 1973; pp. 15–22. Available online: https://xueshu.baidu.com/usercenter/paper/show?paperid=55bb32dc263dc66729848ec15f1a82f5 (accessed on 3 March 2022).
  22. Pozo, J.D.; Hube, M.A.; Kurama, Y.C. Quantitative assessment of nonlinear macro-models for global behavior and design of planar RC walls. Eng. Struct. 2020, 224, 111190. [Google Scholar] [CrossRef]
  23. Kolozvari, K.; Biscombe, L.; Dashti, F.; Dhakal, R.P.; Gogus, A.; Gullu, M.F.; Henry, R.S.; Massone, L.M.; Orakcal, K.; Rojas, F.; et al. State-of-the-art in nonlinear finite element modeling of isolated planar reinforced concrete walls. Eng. Struct. 2019, 194, 46–65. [Google Scholar] [CrossRef]
  24. Bignell, J.L.; LaFave, J.M. Analytical fragility analysis of southern Illinois wall pier supported highway bridges. Earthq. Eng. Struct. Dyn. 2010, 39, 709–729. [Google Scholar] [CrossRef]
  25. Hantouche, E.G.; Harajli, M.; Haddadin, F.; Elsouri, A. Seismic strengthening of bond-critical regions in wall-type bridge piers using active confinement. J. Bridge Eng. 2014, 20, 04015002. [Google Scholar] [CrossRef] [Green Version]
  26. Zhi, Q.; Kang, L.; Jia, L.; Xiong, J.; Guo, Z. Seismic performance of precast shear walls prestressed via post-tensioned high strength bars placed inside grouted corrugated pipes. Eng. Struct. 2021, 237, 112153. [Google Scholar] [CrossRef]
  27. Xu, C.X.; Deng, J.; Peng, S.; Li, C.Y. Seismic fragility analysis of steel reinforced concrete frame structures based on different engineering demand parameters. J. Build. Eng. 2018, 20, 736–749. [Google Scholar] [CrossRef]
  28. Psycharis, I.N.; Kalyviotis, I.M.; Mouzakis, H.P. Experimental investigation of the response of precast concrete cladding panels with integrated connections under monotonic and cyclic loading. Eng. Struct. 2018, 159, 75–88. [Google Scholar] [CrossRef]
  29. Park, R. Evaluation of ductility of structures and structural assemblages from laboratory testing. Bull. N. Z. Soc. Earthq. Eng. 1989, 22, 155–166. [Google Scholar] [CrossRef]
Figure 1. Details of the wall pier: (a) Elevation of the wall pier; (b) Side view of the wall pier; (c) Dimension and reinforcement arrangement of wall pier.
Applsci 12 03499 g001
Figure 2. Multi-layer shell element model: (a) Multi-layer shell element; (b) Distribution of the rebar layer.
Applsci 12 03499 g002
Figure 3. Constitutive models of materials.
Applsci 12 03499 g003
Figure 4. Loading modes of half of multi-layer shell element model: (a) Elevation of the wall pier model; (b) TestA-2; (c) TestA-6; (d) Loading protocol.
Applsci 12 03499 g004
Figure 5. Lateral force–displacement hysteretic curves at pier top: (a) Layer divisions; (b) Mesh divisions.
Applsci 12 03499 g005
Figure 6. Hysteretic curves and skeleton curves of different layer divisions: (a) Node8; (b) Node18.
Applsci 12 03499 g006
Figure 7. Hysteretic curves of different mesh divisions: (a.1a.3) Node8; (b.1b.3) Node18.
Applsci 12 03499 g007
Figure 8. Hysteretic curves and skeleton curves of different lateral loading modes: (a.1,a.2) Node8; (b.1,b.2) Node18.
Applsci 12 03499 g008
Figure 9. Accumulative energy dissipation curves: (a) Pier top; (b) Node8; (c) Node18.
Applsci 12 03499 g009
Figure 10. Stiffness degradation curves: (a) Pier top; (b) Node8; (c) Node18.
Applsci 12 03499 g010
Table 1. Mesh and layer division of multi-layer shell element.
DivisionModeln 1i 2j 3
Layer divisionTestA-110534
TestA-226534
TestA-336534
TestA-456534
TestA-5106534
Vertical divisionTestB-126234
TestA-226534
TestB-2261034
TestB-3262034
Horizontal divisionTestA-226534
TestC-126568
TestB-2261034
TestC-2261068
1 The number of layers. 2 The number of vertical divisions. 3 The number of horizontal divisions.
Table 2. Lateral loading modes.
Modelp 1q 2
TestA-233
TestA-655
TestA-7317
TestA-8335
1 The number of vertical loading points. 2 The number of horizontal loading points.
Table 3. Displacement ductility of models.
PositionModelΔy 1 (mm)Fy 2 (kN)Δp 3 (mm)Fp 4 (kN)Δu 5 (mm)Fu 6 (kN)Ductility
Node8TestA-23.631495.947.901672.6027.251421.717.50
TestA-65.782185.5914.902665.4057.792265.5910.01
TestA-75.341325.379.101533.0912.651303.122.37
TestA-85.031308.528.101448.1511.931230.922.37
Node18TestA-24.311399.769.901664.0941.741414.479.67
TestA-62.43939.296.101124.5411.00955.854.53
TestA-74.831254.928.101429.9712.051215.472.50
TestA-84.811236.318.101409.4011.661197.992.42
1 The yield displacement. 2 The yield force. 3 The peak displacement. 4 The peak force. 5 The ultimate displacement. 6 The ultimate force.
Publisher’s Note: MDPI stays neutral with regard to jurisdictional claims in published maps and institutional affiliations.

