Abstract
The invasion of clay fines can change the water retention properties of base layers significantly. There is no soil–water retention curve prediction equation that is capable of considering the effects of fines. In this study, the soil–water retention curves (SWRC) of road base aggregate with different fine contents (FC) were measured. The variations in inter-aggregate pores (formed by coarse grains) and intra-aggregate pores (formed by fines) with FC were deduced from the SWRC at different FCs. It was found that the inclusion of fines shifted and scaled the inter-aggregate pore distribution curves and scaled the intra-aggregate pore distribution curves. Based on this finding, a prediction equation for SWRC with consideration of the effects of FC was proposed. The feasibility of this equation was verified by comparing the predicted and measured results. The proposed model can be used to predict the SWRC of soil with different FCs.
1. Introduction
Interlayers are created by the interpenetration of a base layer and subgrade layer, of which fine content (FC) varies with depth [1,2,3,4]. Variations in FC results in changes in water retention properties [5,6] and soil properties [7,8,9,10,11,12]. In addition, the soil water retention curve (SWRC) has been successfully used in the prediction of the mechanical properties of soil in the unsaturated state, i.e., shear behaviour [13,14,15] and resilient behaviour [16,17,18]. Therefore, it is necessary to study soil water retention properties in depth.
With an increase in FC, the microstructure and water retention properties change [19,20,21]. Generally, FC was found to increase along with the depth, and the interlayer is made up two parts: the upper part, characterized by a coarse-grain skeleton, and the lower part, characterized by a fine matrix [1,22]. In the case of soil characterized by a fine matrix, Su et al. [6] pointed out that the SWRC of the mixture is only dependent on the dry density of fines; the coarse-grain content has a limited effect on the water retention properties of the mixture. Therefore, to obtain the SWRC of the mixture with different FCs, the prediction curve built for fines grain soil at different dry densities can be adopted, as established by previous researchers [23,24,25,26,27]. In the case of coarse-grain, a limited SWRC prediction equation has been proposed, accounting for the effects of fine content. Previously established equations are focused on capturing the bimodal feature of SWRC, which is caused by the discontinuity of the pore size distribution (PSD) between inter-aggregate pores (formed by coarse grain) and intra-aggregate pores (formed by fines) [11,28,29,30,31]. Since the effects of matric suction on the mechanical behaviour of soils can be intensified by fines [2,4,11], it appears important to propose a prediction equation to address the fine content, which is essential for the prediction of the dynamic behaviour as well as shear behaviour of the base layer soils.
In the study, the water retention properties of soils with different FCs were tested by a large-scale SWRC test apparatus which was designed by the authors. Then, the evolution of the pore size distribution (PSD) with the increase in FC was emphatically analysed. After this, the SWRC prediction equation, which is able to consider the effect of FC, was proposed and validated by comparing the measured and predicted SWRCs.
2. Materials and Methods
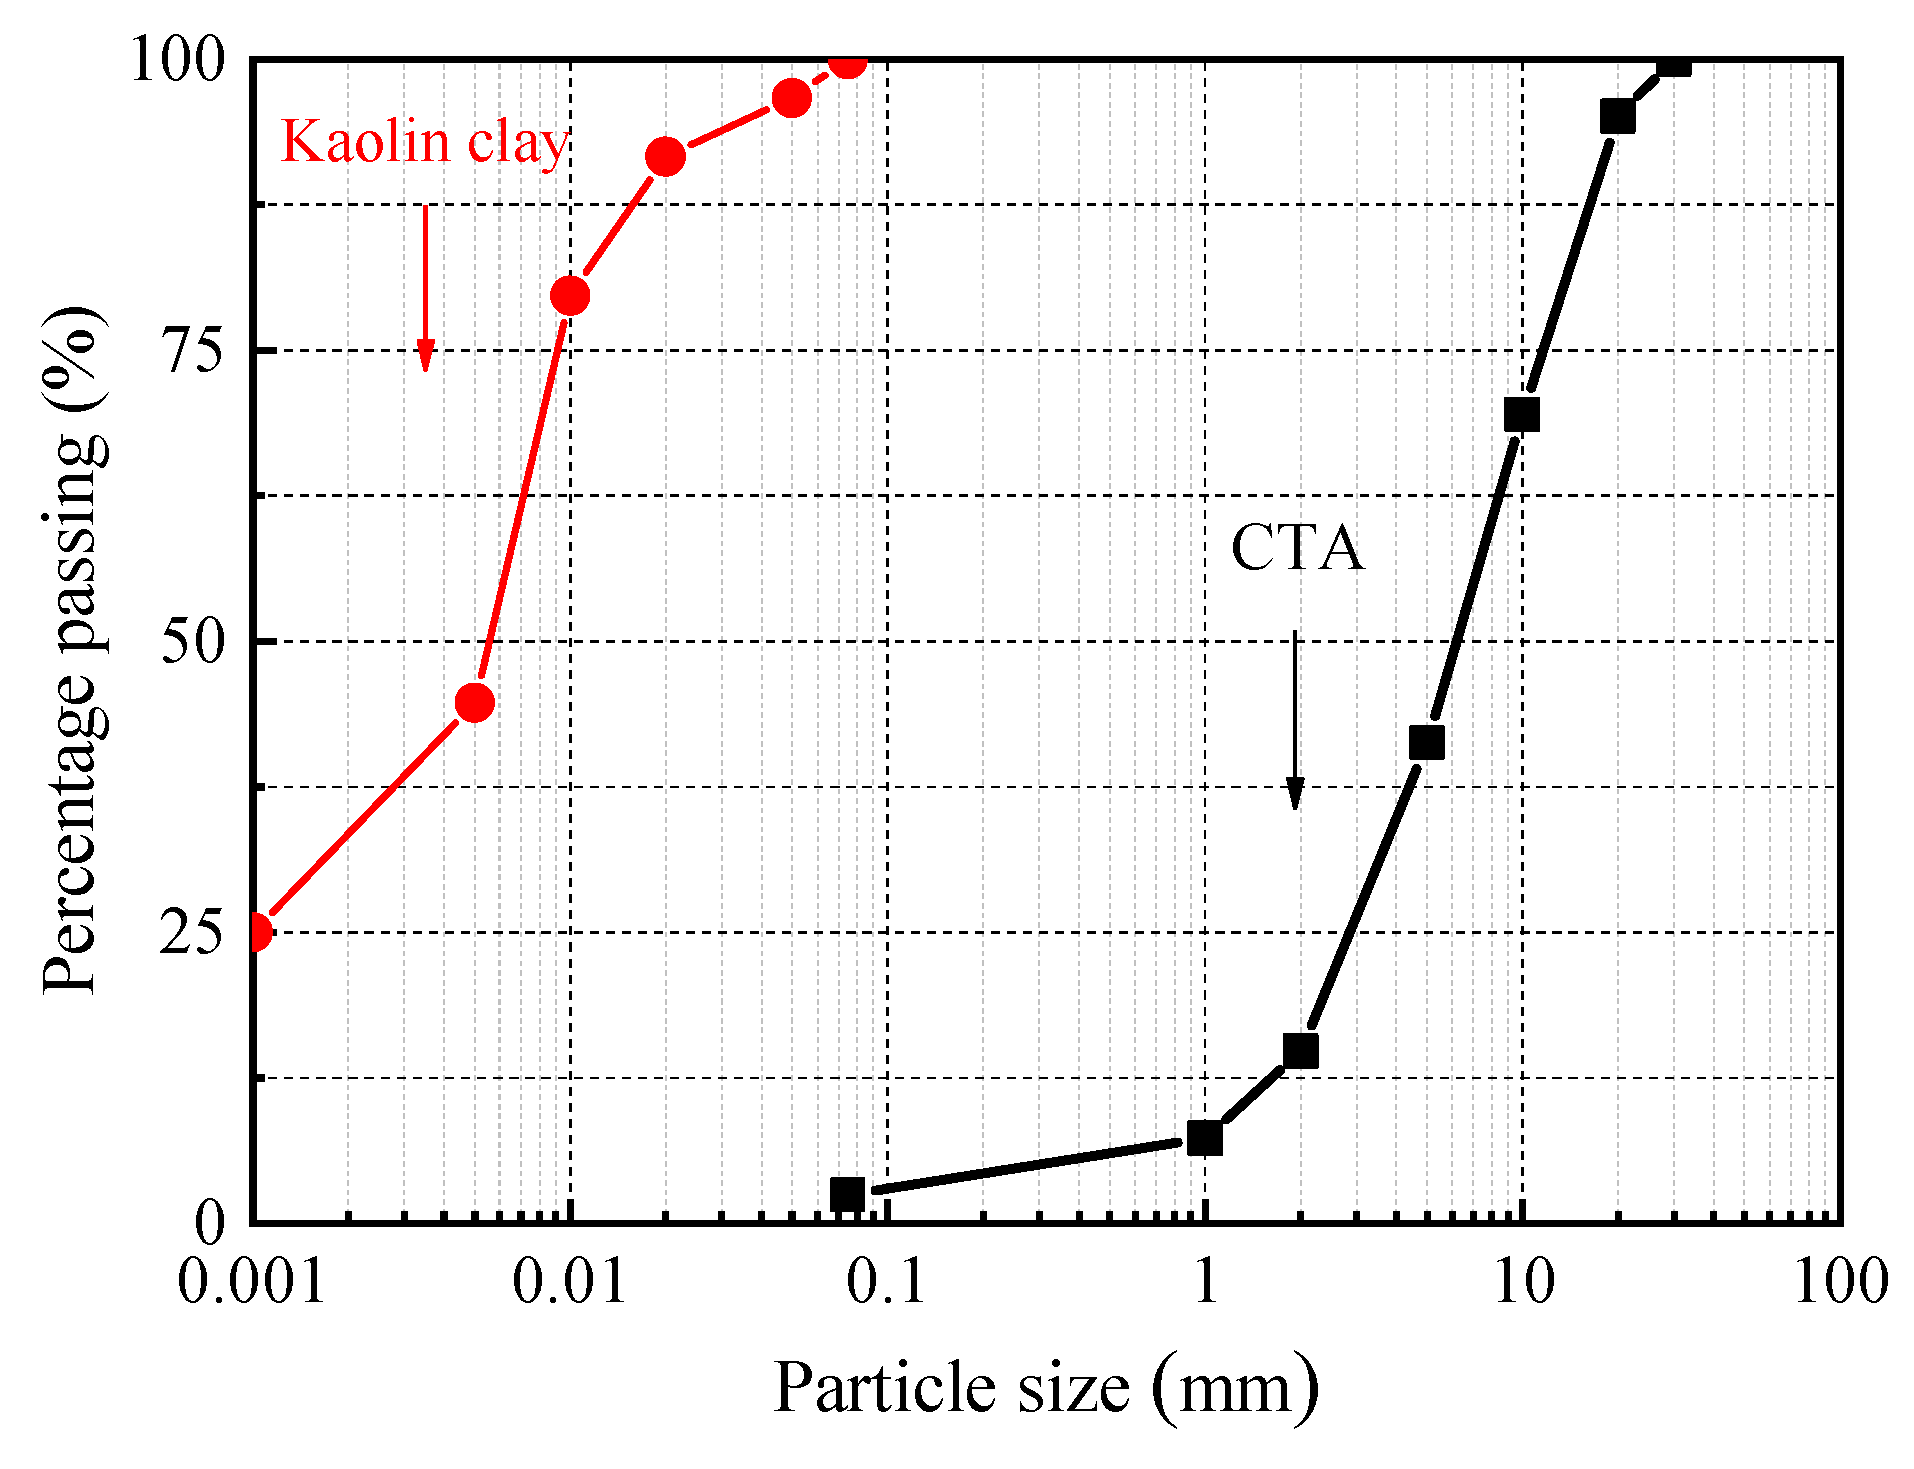
The studied material is a kind of well-graded gravel (crushed tuff material, CTA), with a minimum void ratio (emin) of 0.220 and maximum void ratio (emax) of 0.386 [32]. The commercial Kaolin was used to mix the coarse-grain soil at different FCs (FC = mf/mc, where mf and mc are the dry mass of fines and coarse-grain soil) to mimic the coarse grain fouled by subgrade soil. The gradation curves of CTA and Kaolin clay are shown in Figure 1. The specimens with various FCs were prepared, having the identical dry densities of , with a compaction degree Dc = 95.1% for the specimen with FC = 0%.

Figure 1.
The gradation curve of CTA and Kaolin clay.
This study aims to reveal the effects of FC on SWRC when soil is the coarse grain type. Therefore, the threshold fine content (FCth), which distinguishes the ranges for the soil characterized by being coarse grain and fines, needed to be determined first. According to the method proposed by Thevanayagam [33], (where refers to the maximum void ratio of the CTA; refers to the specific density of CTA; and refers to the total dry density of the specimen). For the tested soil, FCth is 8%. In the tests, the CTA was mixed with fine contents of 0%, 2%, 4%, 6%, and 8%. For specimens with FC = 0%, 4% and 8%, the test results were used to study the evolution of PSD (including pores formed by coarse-grain soil and fines) when FC increases. Using three FCs allowed us to see the evolution of PSD with FC, since we include the minimum amount of fines (FC = 0%), medium amount of fines (FC = 4%) and maximum amount of fines (FC = 8%). In addition, the specimens with FCs of 2% and 6% were used to manifest the validation of the proposed SWRC model.
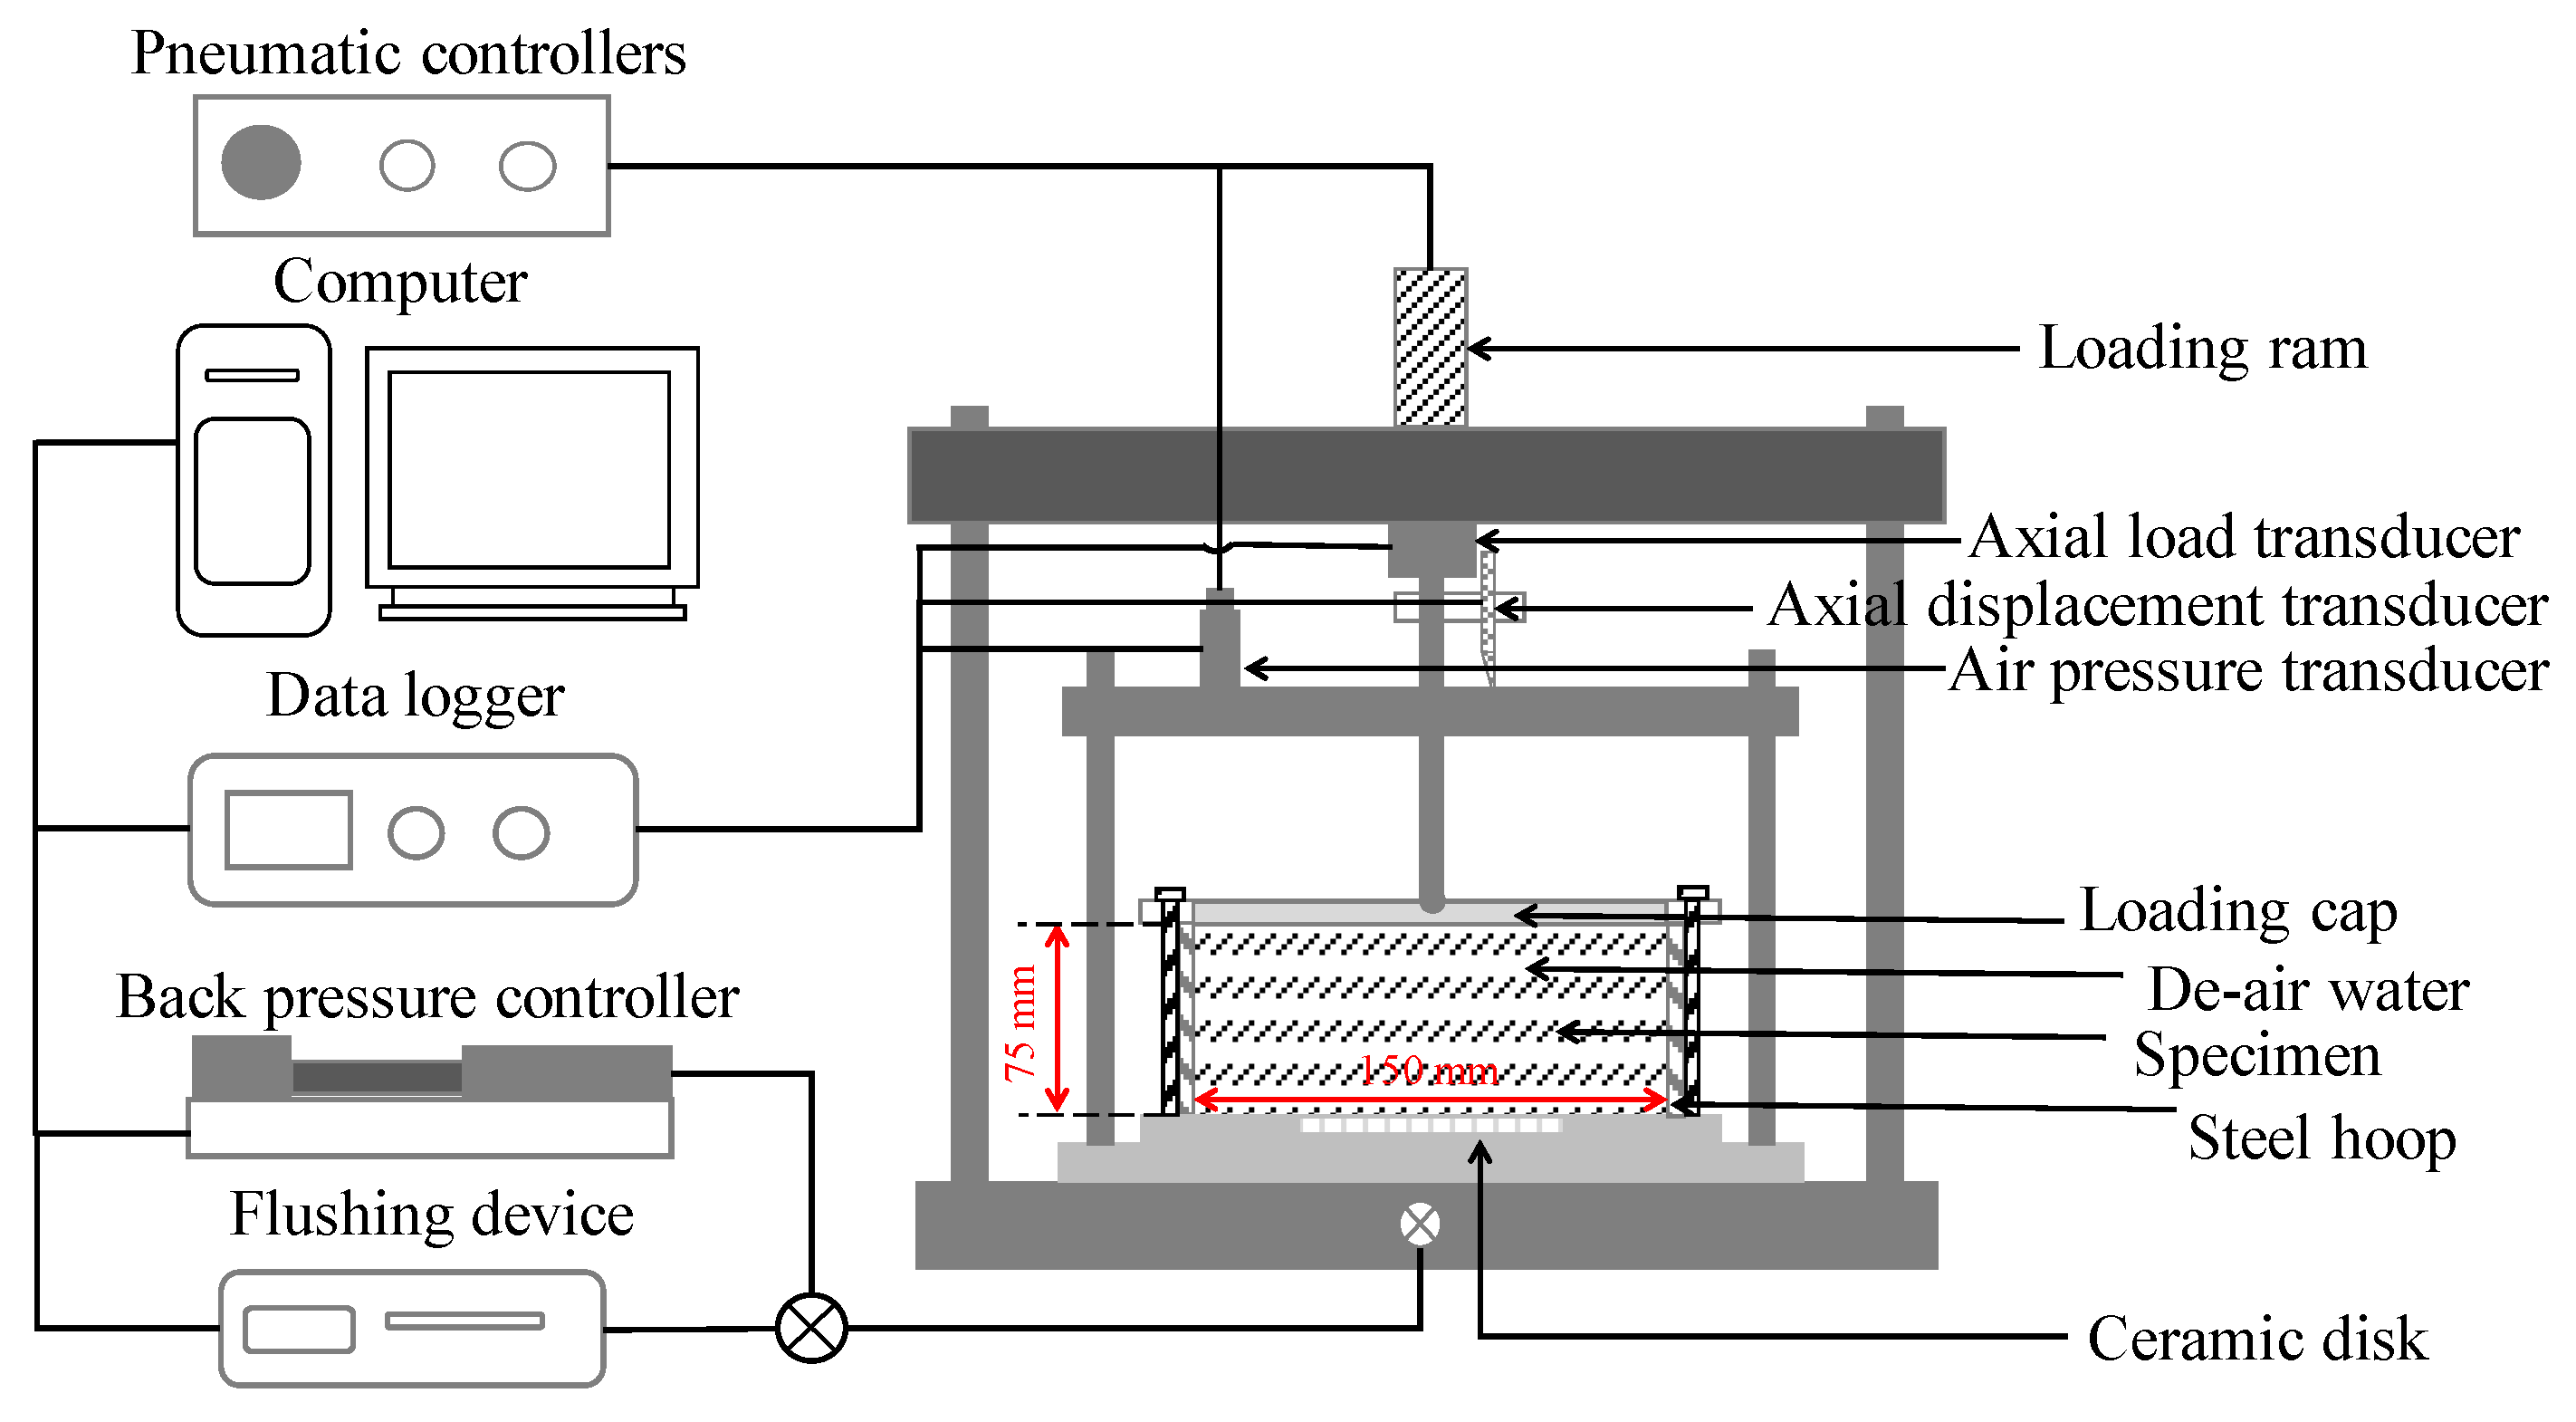
In the water retention tests, a large-scale SWRC test apparatus (LSSTA), which was designed especially for coarse-grain soils, was employed to test the SWRC of soils with different FCs. A sketch diagram of the LSSTA is shown in Figure 2. The LSSTA is composed of the following parts: pneumatic controllers, a back pressure controller and a ceramic plate (with an air entry value of 300 kPa), which are used to initialize the matric suction in specimens; an axial displacement transducer, axial stress transducer and air pressure transducer, used to measure the variation of volumetric strain, air pressure and axial stress during the test; an air flushing device, used to flush the pore air generated during the test and improve the accuracy of the measurements of the water volume variation in soil; and a data logger and computer, used to record the data generated during the test. Detailed descriptions of the LSSTA can be found in the work of Cao et al. [34].
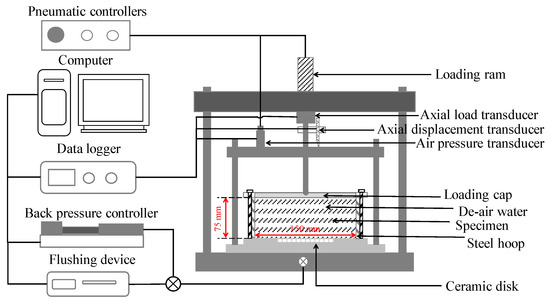
Figure 2.
A schematic view of the LSSTA.
The cylindrical specimen for water retention tests was 150 mm in diameter and 75 mm in height, prepared by the moisture tamping method in three layers. For specimens with different fine contents, the dry density of the soil was kept constant, . After transferring the specimens into the LSSTA, the specimens were submerged in de-air water for 48 h to achieve a saturated state (s = 0 kPa). A net axial stress of 3 kPa was applied to the top of the specimen to ensure a good contact between the loading cap and specimen. This was carried out to accurately measure the volumetric strain in the test. The net axial stress was kept constant during the test. Then, we increased the matric suction to the prescribed value based on the axis-translation method, s = ua − uw. ua is the pore air pressure which is initialized by the pneumatic controller; uw is the pore water pressure which is initialized by the back pressure controller. After the water volume change rate Δv < 50 mm3/h, the specimen was deemed to have achieved its suction equilibrium state [34], and then the water volume variation and the axial displacement were recorded. After this, flushing the air pores generated during the test to improve the accurate measurement of the water volume variation in soil. The tests ended after s = 300 kPa (the air entry values of the ceramic disk used in the present test), and then the moisture content was measured by the direct heating method [35].
3. Effect of Fine Content on Soil Water Retention Curve and Pore Size Distribution
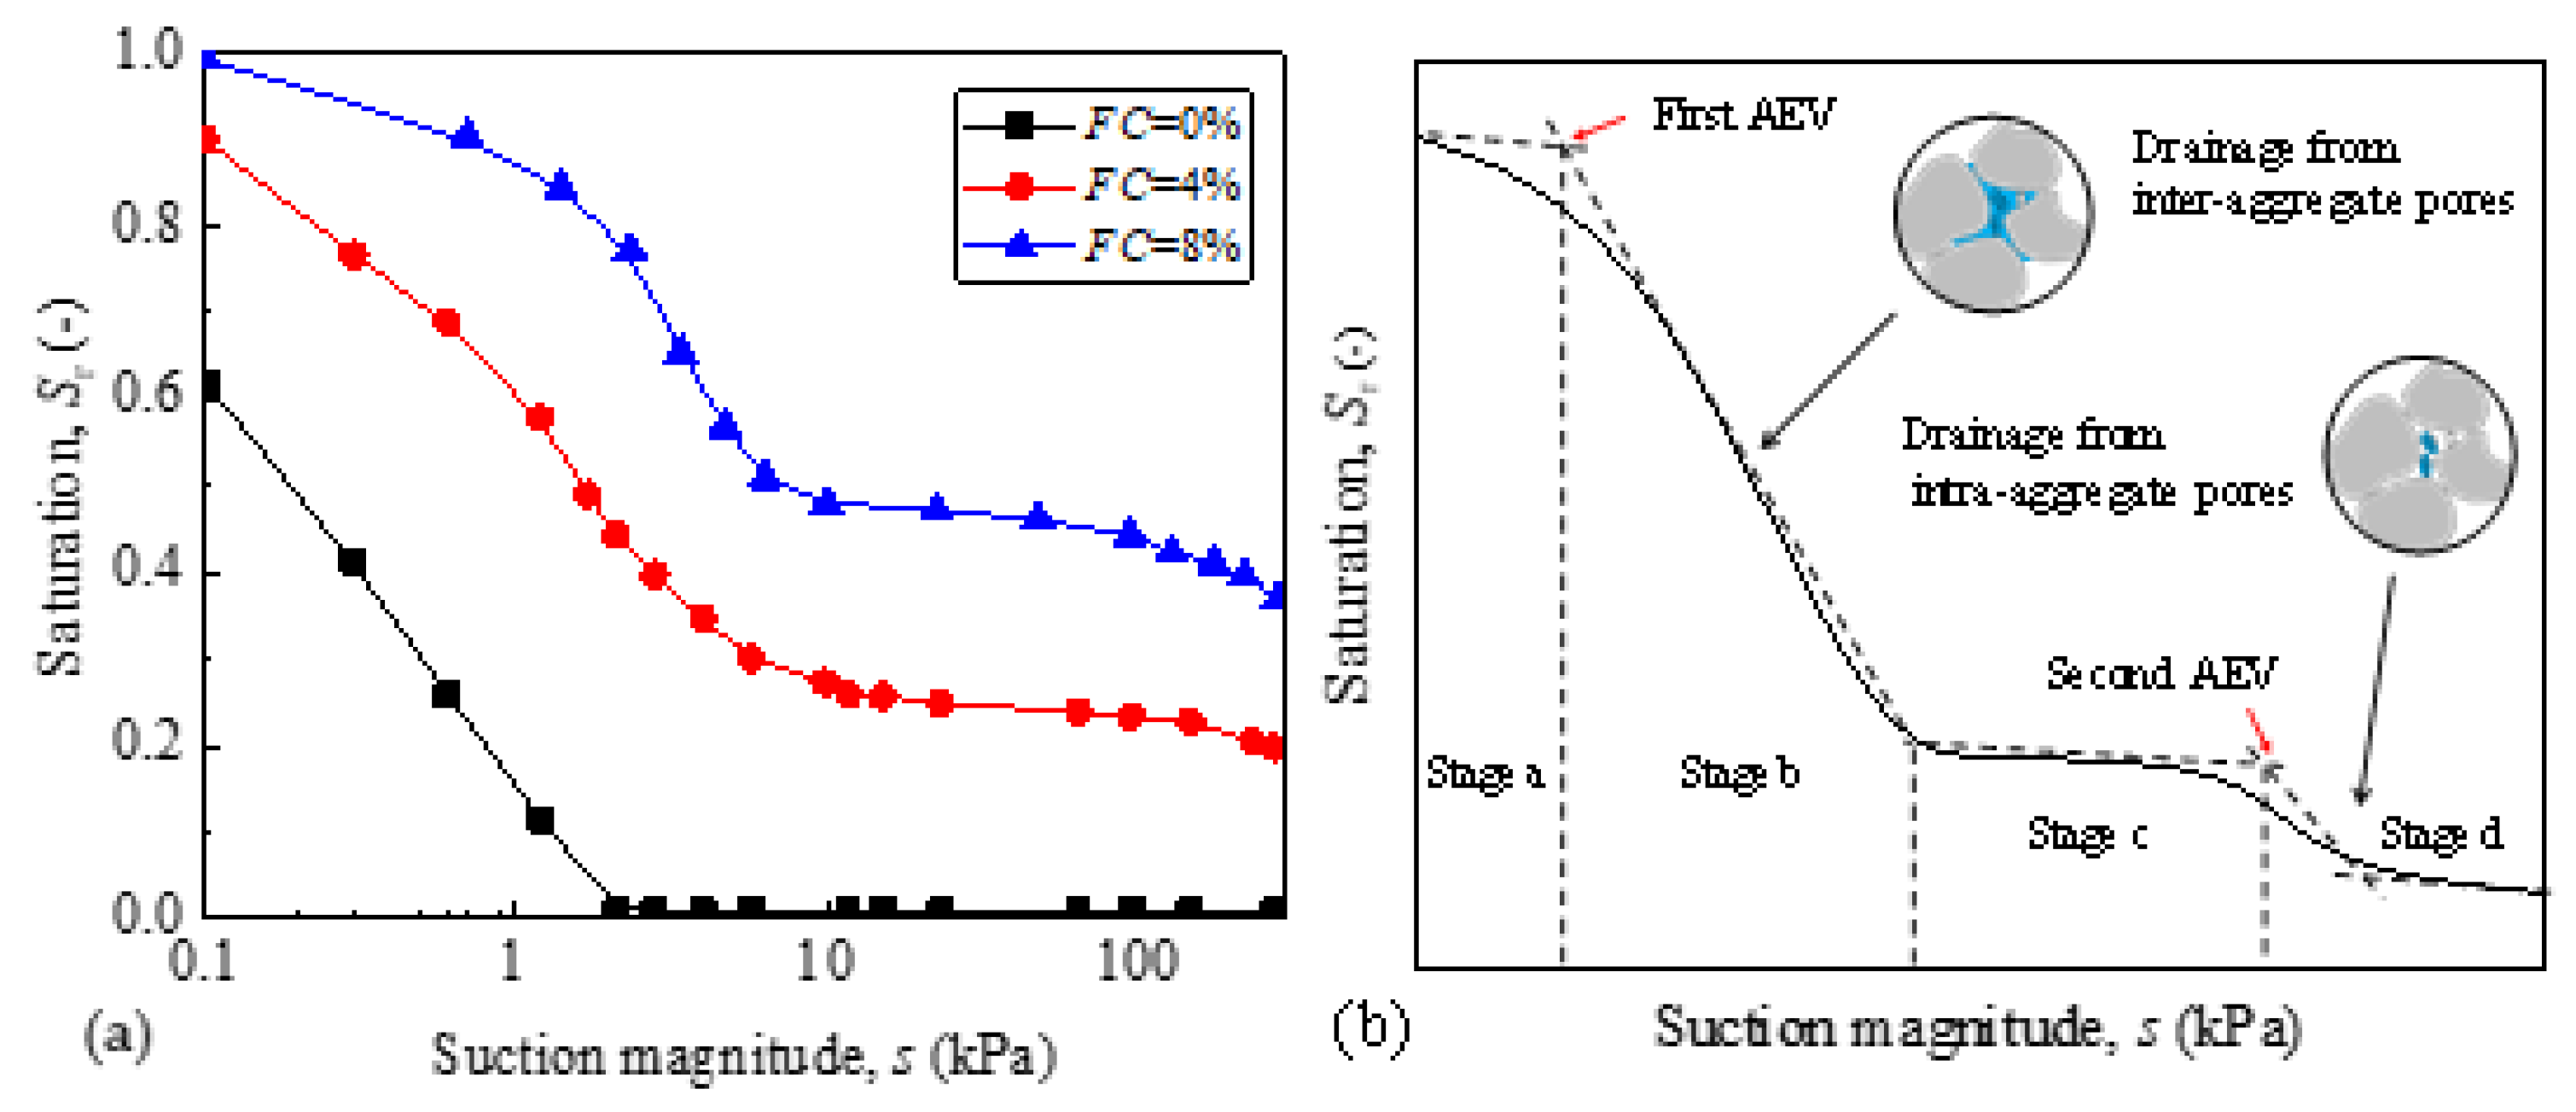
Figure 3a presents the SWRCs with different FCs. The SWRC shifts upward with the increase in FC, indicating that the water retention properties increase with the increase in FC. Additionally, the increase in FC results in SWRC changing from unimodal (FC = 0%) to bimodal (FC = 4% and 8%). Bimodal SWRCs are caused by the discontinuity of pore size distribution (PSD) between inter-aggregate pores (due to coarse grain) and intra-aggregate pores (formed by fines) [11,29]. Furthermore, the bimodal SWRC can be divided into four stages (Figure 3b), which are “stage a”, “stage b”, “stage c”, and “stage d”. In stage a, the pores stay saturated, with no water exchange; in stage b, the bulk water is drained from the inter-aggregate pores; in stage c, the meniscus water is drained from the intra-aggregate pores, and a large increase in matric suction leads to minor variations in Sr; in “stage d”, the water is drained from the intra-aggregate pores [27,29].

Figure 3.
(a) The SWRCs at different fine contents; (b) physical model for bimodal SWRC.
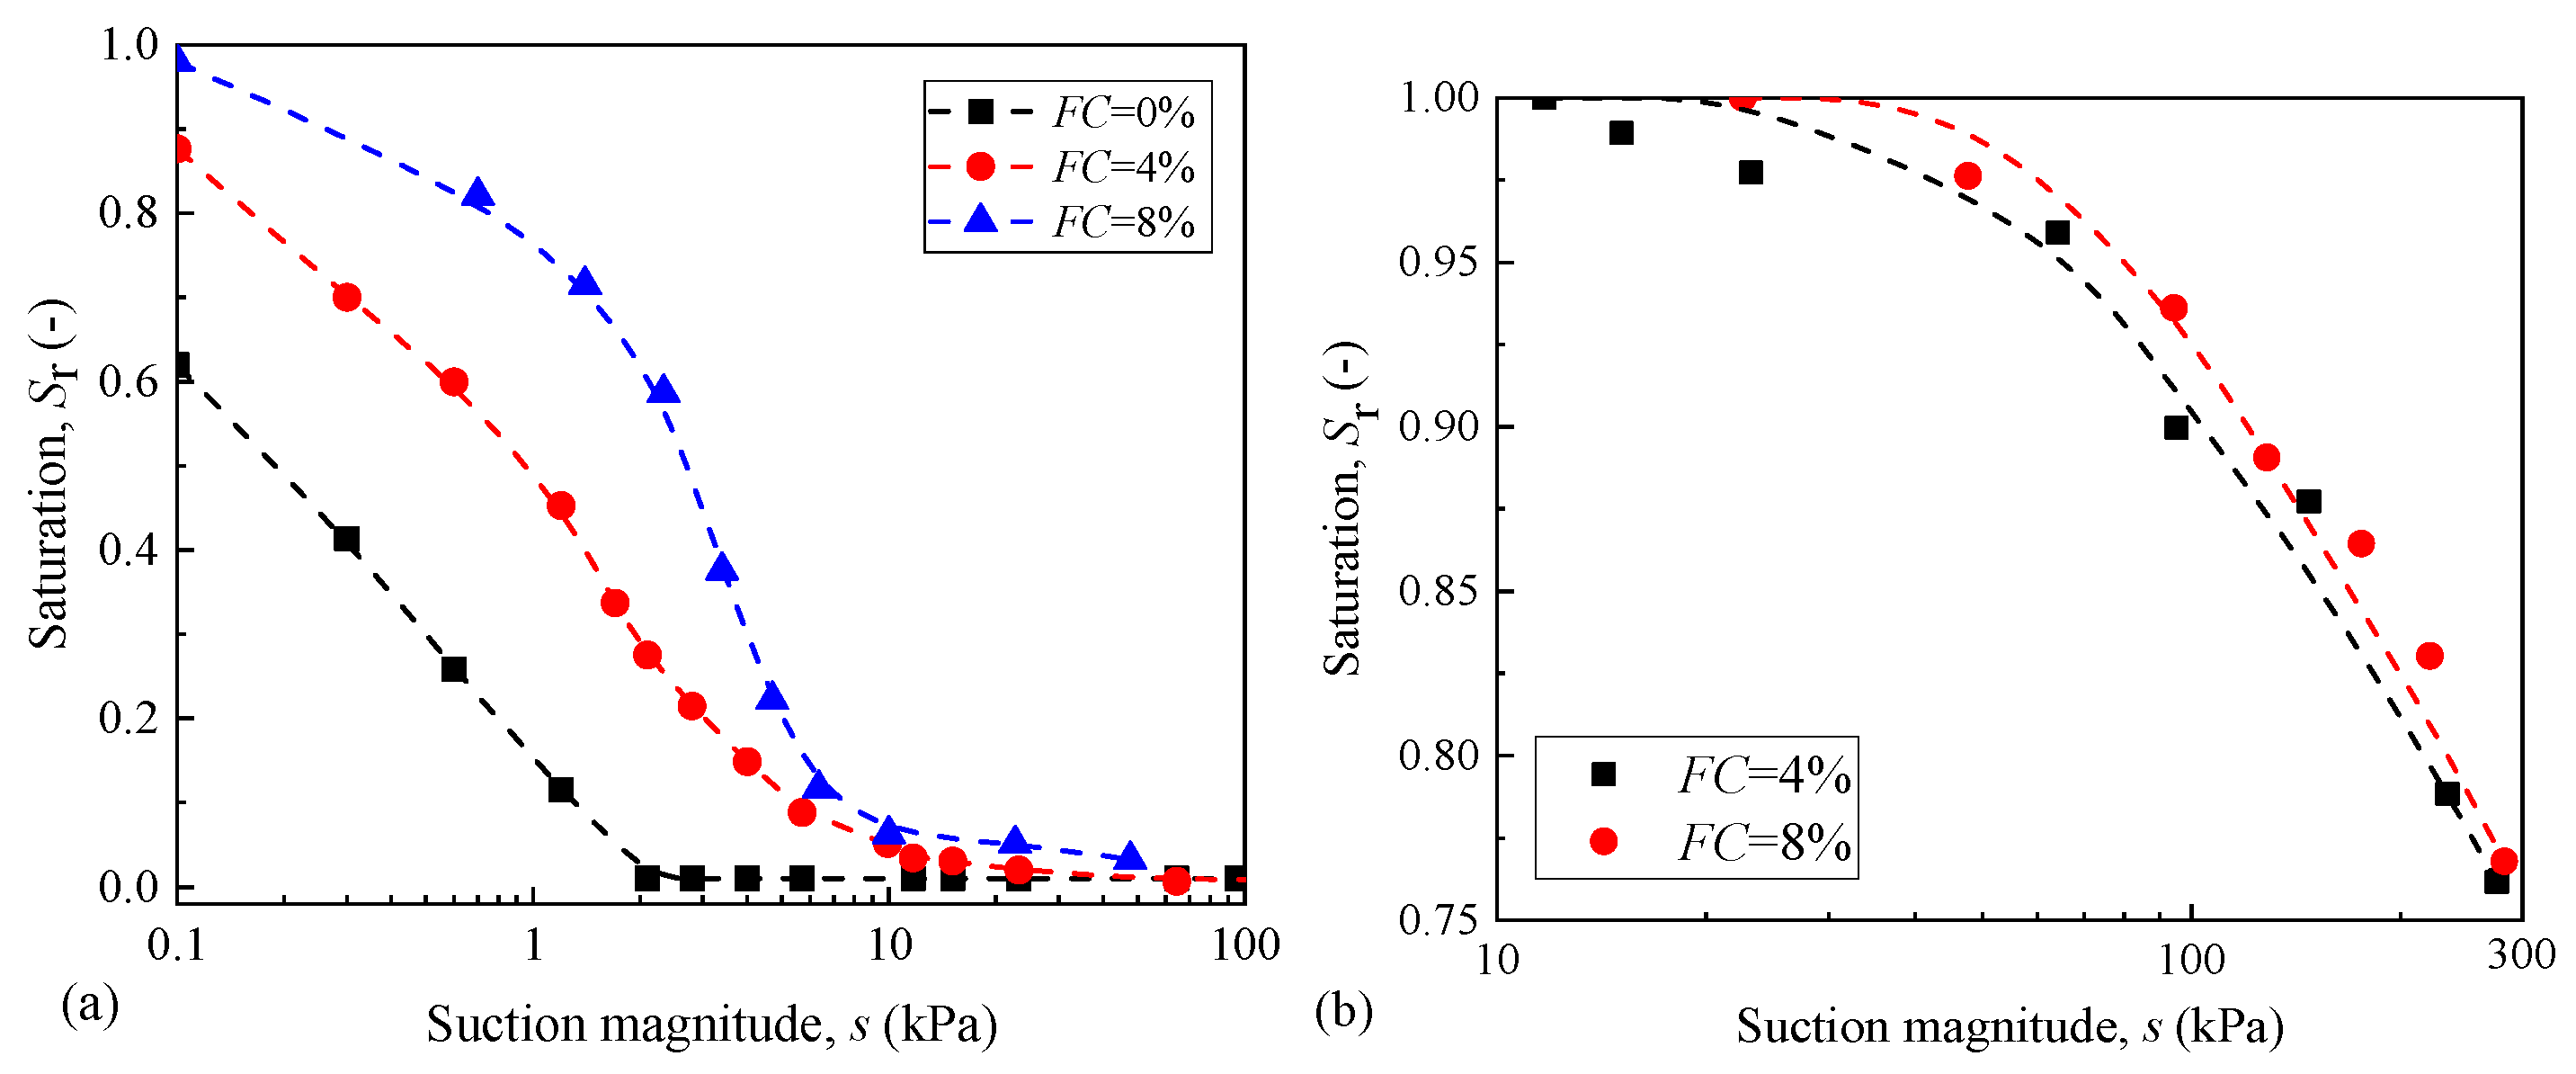
To investigate the effects of FC on the SWRCs formed by inter-aggregate pores and intra-aggregate pores, the SWRCs formed by coarse-grain and fine-grain soil need to be distinguished first. This separation is based on the characteristics of “stage c”, in which a large increase in matric suction results in a minor variation in Sr; the average value of the Sr at the start and end points of “stage c” is deemed as the end point of the SWRC formed by inter-aggregate pores and the start point of the SWRC formed by intra-aggregate pores [27,29]. The SWRCs formed by the coarse-grain soil and fine-grain soil are presented in Figure 4a,b, respectively. It can be observed that an increase in FC leads to the water retention properties of the SWRC formed by inter-aggregate pores increased and the increase in the air entry values (the boundary between “stage a” and “stage b”). Moreover, the SWRC formed by intra-aggregate pores seemed to be affected by the addition of fines.
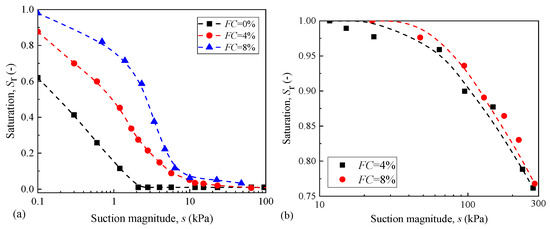
Figure 4.
(a) SWRCs of inter-aggregate pores at different FCs; (b) SWRCs of intra-aggregate pores at different FCs.
Before analysing the evolution of PSD with the increase in FC, two basic assumptions should be made. The first one is that the pores in soils are a bunch of connecting tubes that are randomly distributed with different diameters and heights [27,36,37]; thus, the relationship between matric suction and the radius of the pore tube can be established by the Laplace equation:
where Ts is the surface tension of water and soil and is the contact angle.
The second assumption is for a given soil, the pores with a radius smaller than are potentially occupied by water and the rest by air, which is termed as the local equilibrium assumption [23,36,38]. The volumetric water content of soil can be obtained:
where represents the PSD function.
For the evolution of PSD, a shifting value and a scaling factor were employed [23]. The scaling factor is unable to change the feature of the SWRC, due to Vv and Vw scales at identical times. In comparison, the shifting factor can change the feature of SWRC. The shifting value and scaling factor at a given FC can be calculated from:
where and are the mean pore radius at a target FC and FC = 0%, respectively.
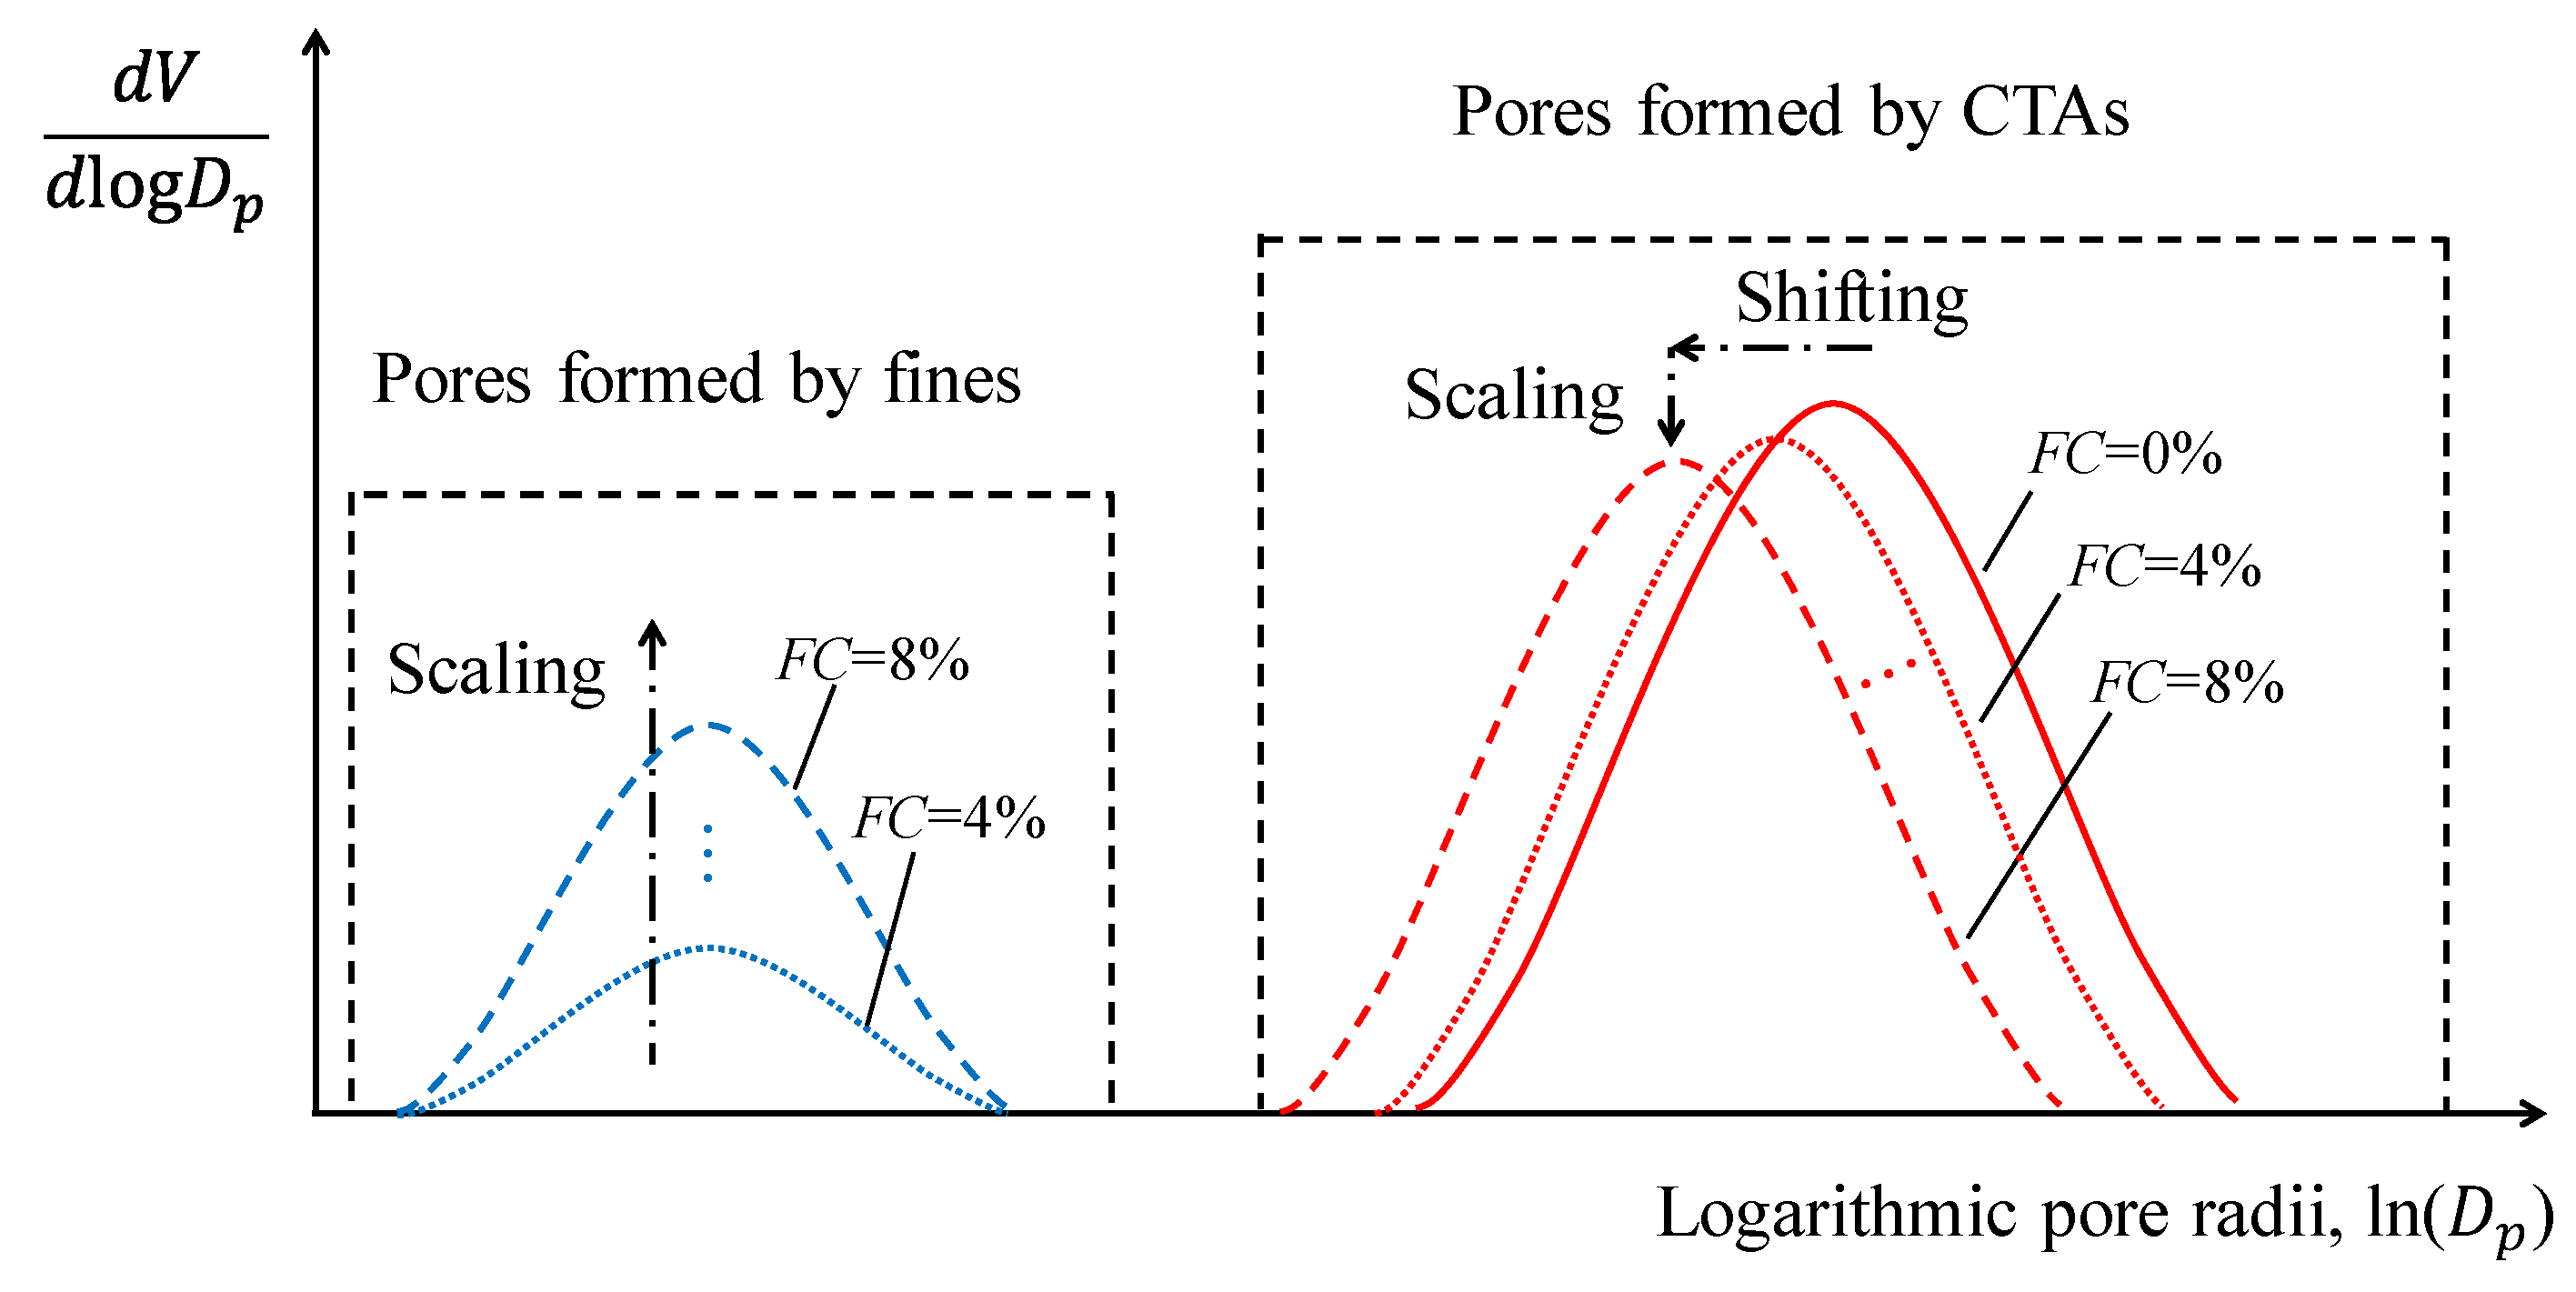
For inter-aggregate pores, the increase in FC leads to a reduction in AEV and an increase in water retention properties. This implies that the PSD of inter-aggregate pores was shifted and scaled with the addition of fines. For intra-aggregate pores, the PSD was unaffected by the increase in fine contents, indicating that the PSD was only scaled. In doing this, a conceptual model accounting for the effects of FC on the evolution of inter-aggregate pores and intra-aggregate is presented in Figure 5.
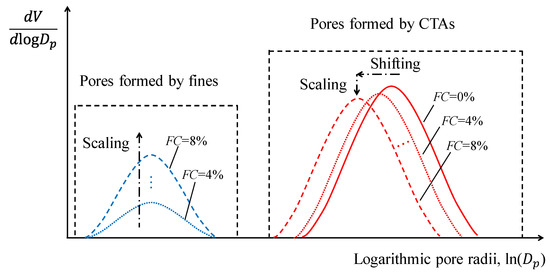
Figure 5.
A conceptual model considering the change in PSD as FC increases.
There may be some concerns raised about the PSD of intra-aggregate pores being unaffected by the addition of fines. With the increase in FC, the dry density of fines () indeed increases, from 0.97 Mg/m3 to 0.98 Mg/m3, when FC increases from 4% to 8%. The variation in seems minor. Furthermore, this investigation seeks a simpler approach that accounts for the effects of FC on the evolution of SWRC, and therefore the effect of on the SWRC formed by intra-aggregate pore was not considered; in other words, with the addition of fines, the shifting effect on PSD was omitted and only the scaling effect was considered.
4. SWRC Model
Since the inclusion of fines leads to the different evolution patterns of inter-aggregate pores and intra-aggregate pores, two PSD functions were employed to account for the change in PSD. This method was adopted to capture the bimodal feature of the SWRC [27,28,31]:
where represents the PSD of inter-aggregate pores and represents the PSD of intra-aggregate pores.
For inter-aggregate pores, the PSD function considering the variation of FC can be expressed as:
For intra-aggregate pores, the PSD function considering the variation of FC can be expressed as:
By incorporating Equations (5) and (6) into Equation (4), the PSD function changes to:
where and refer to the scaling and shifting factor for inter-aggregate pores; refers to the scaling factor for intra-aggregate pores.
By putting Equation (7) into Equation (2), the volumetric water content of soil can be rewritten as:
where refers to the effective saturation of inter-aggregate pore and refers to the effective saturation of intra-aggregate pore; and refers to the saturated volumetric water content of the inter-aggregate pores and intra-aggregate pores.
The effective saturation is calculated by , where is the volumetric water content at the saturated state and is the volumetric water content at the residual state, which is assumed to be zero [28,31]. Thus, can be rewritten as:
Furthermore, the saturation of the bimodal SWRC at a given pore radius/suction can be obtained as:
where is the saturated volumetric water content of the soils; .
For the SWRC with the bimodal feature, affects the volumetric water content in the saturated state. For a given suction located in “stage c”, is assumed to be zero and is assumed to be one; thus, the saturation of the bimodal SWRC is equal to .
Since the increases linearly with the increase in FC (the saturation at “Stage c” is 24% for FC = 4% and 47% for FC = 8%), is assumed, where k is a fitting parameter. Furthermore, if r approaches infinity (s approaches zero), , and approaches one, then .
By putting and into Equation (9), can be rewritten as:
In the present study, the van Genuchten model [39] was adopted to express the relationship between effective saturation, Se and matric suction, s:
By introducing Equation (12) into Equation (11), turns into:
where , nf and mf are the fitting parameters of the SWRC formed by intra-aggregate pores.
For the SWRC of inter-aggregate pores, the formation of the SWRC is much more complicated, due to the PSD of inter-aggregate pores being shifted by the addition of fines. The SWRC considering the shifting factor needs to be determined from the integration of PSD function as Equation (2), due to the change in PSD. The PSD function is defined as follows [23,36,37]:
By introducing the van Genuchten model [39] (Equation (12)) and Laplace equation (Equation (1)) into Equation (14), the PSD function can be obtained as:
By putting Equation (5) into Equation (15), the PSD function of the inter-aggregate pores accounting for the variation of FC can be expressed as:
where mc, nc, and are the fitting parameters for the inter-aggregate pores and and are the shifting parameter and scaling parameter for inter-aggregate pores. is the saturated volumetric water content of inter-aggregate pores.
It can be observed from Figure 3a that AEV increases with the increase in FC, which implies that increases with the increase in FC. An exponential relationship was assumed to exist between and FC as:
where is a fitting parameter.
By incorporating Equation (17) into (16), can be rewritten as:
Thus, at a given matric suction, the saturation of the SWRC formed by inter-aggregate pores is:
By introducing Equation (19) into Equation (13), the function between Se and FC that can account for the variation of FC is:
5. Validation of the Proposed SWRC Model
To verify the validation of the proposed model, SWRC with FC = 0%, 4%, and 8% were used to calculate the fitting parameters in Equation (20). The values of the fitting parameters are shown in Table 1.

Table 1.
The fitting parameters for the model.
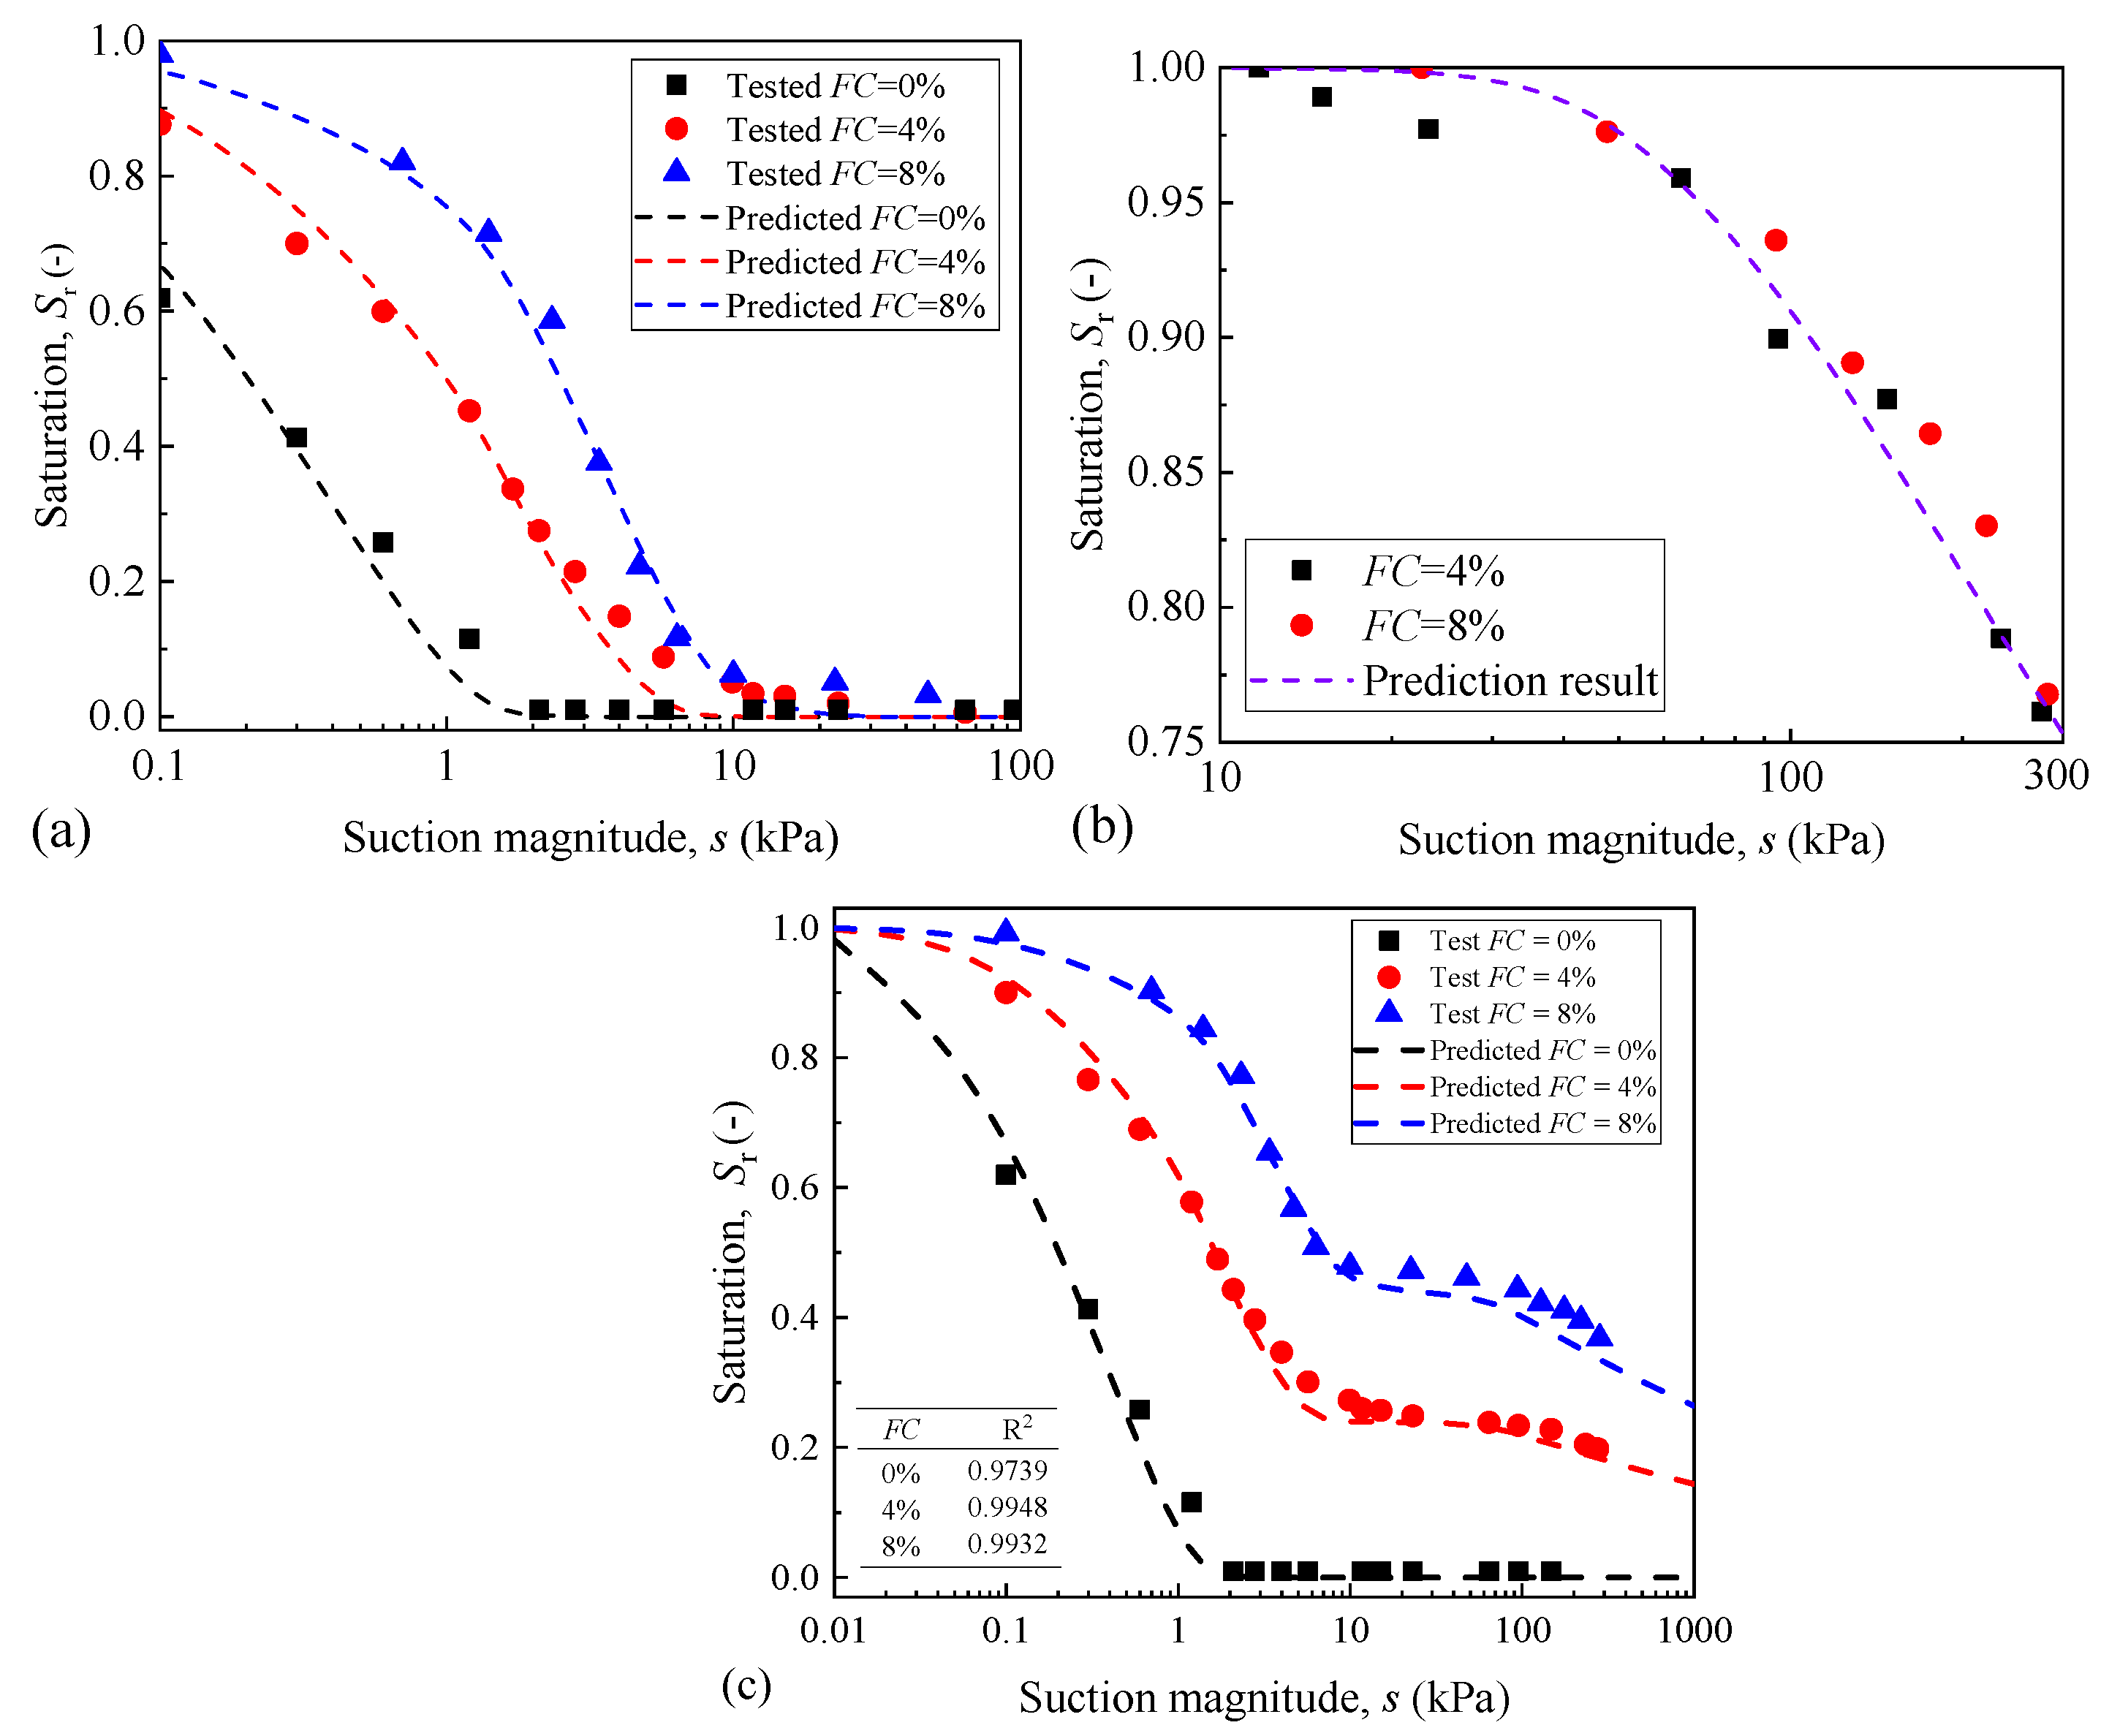
Figure 6 shows the comparison between the measured SWRC and predicted SWRC. It can be observed from Figure 6c that there is good agreement between the measured and predicted SWRCs, since the correlation coefficient (R2) is 0.9869 for FC = 0%, 0.9974 for FC = 4% and 0.9966 for FC = 8%, respectively. The large R2 implies that the values of the fitting parameters are reasonable.
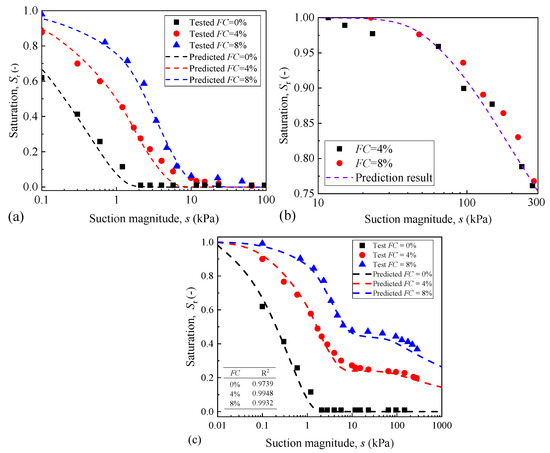
Figure 6.
The tested and predicted data for (a) the SWRCs of inter-aggregate pores and (b) the SWRCs of intra-aggregate pores; (c) FC = 4% and 8%.
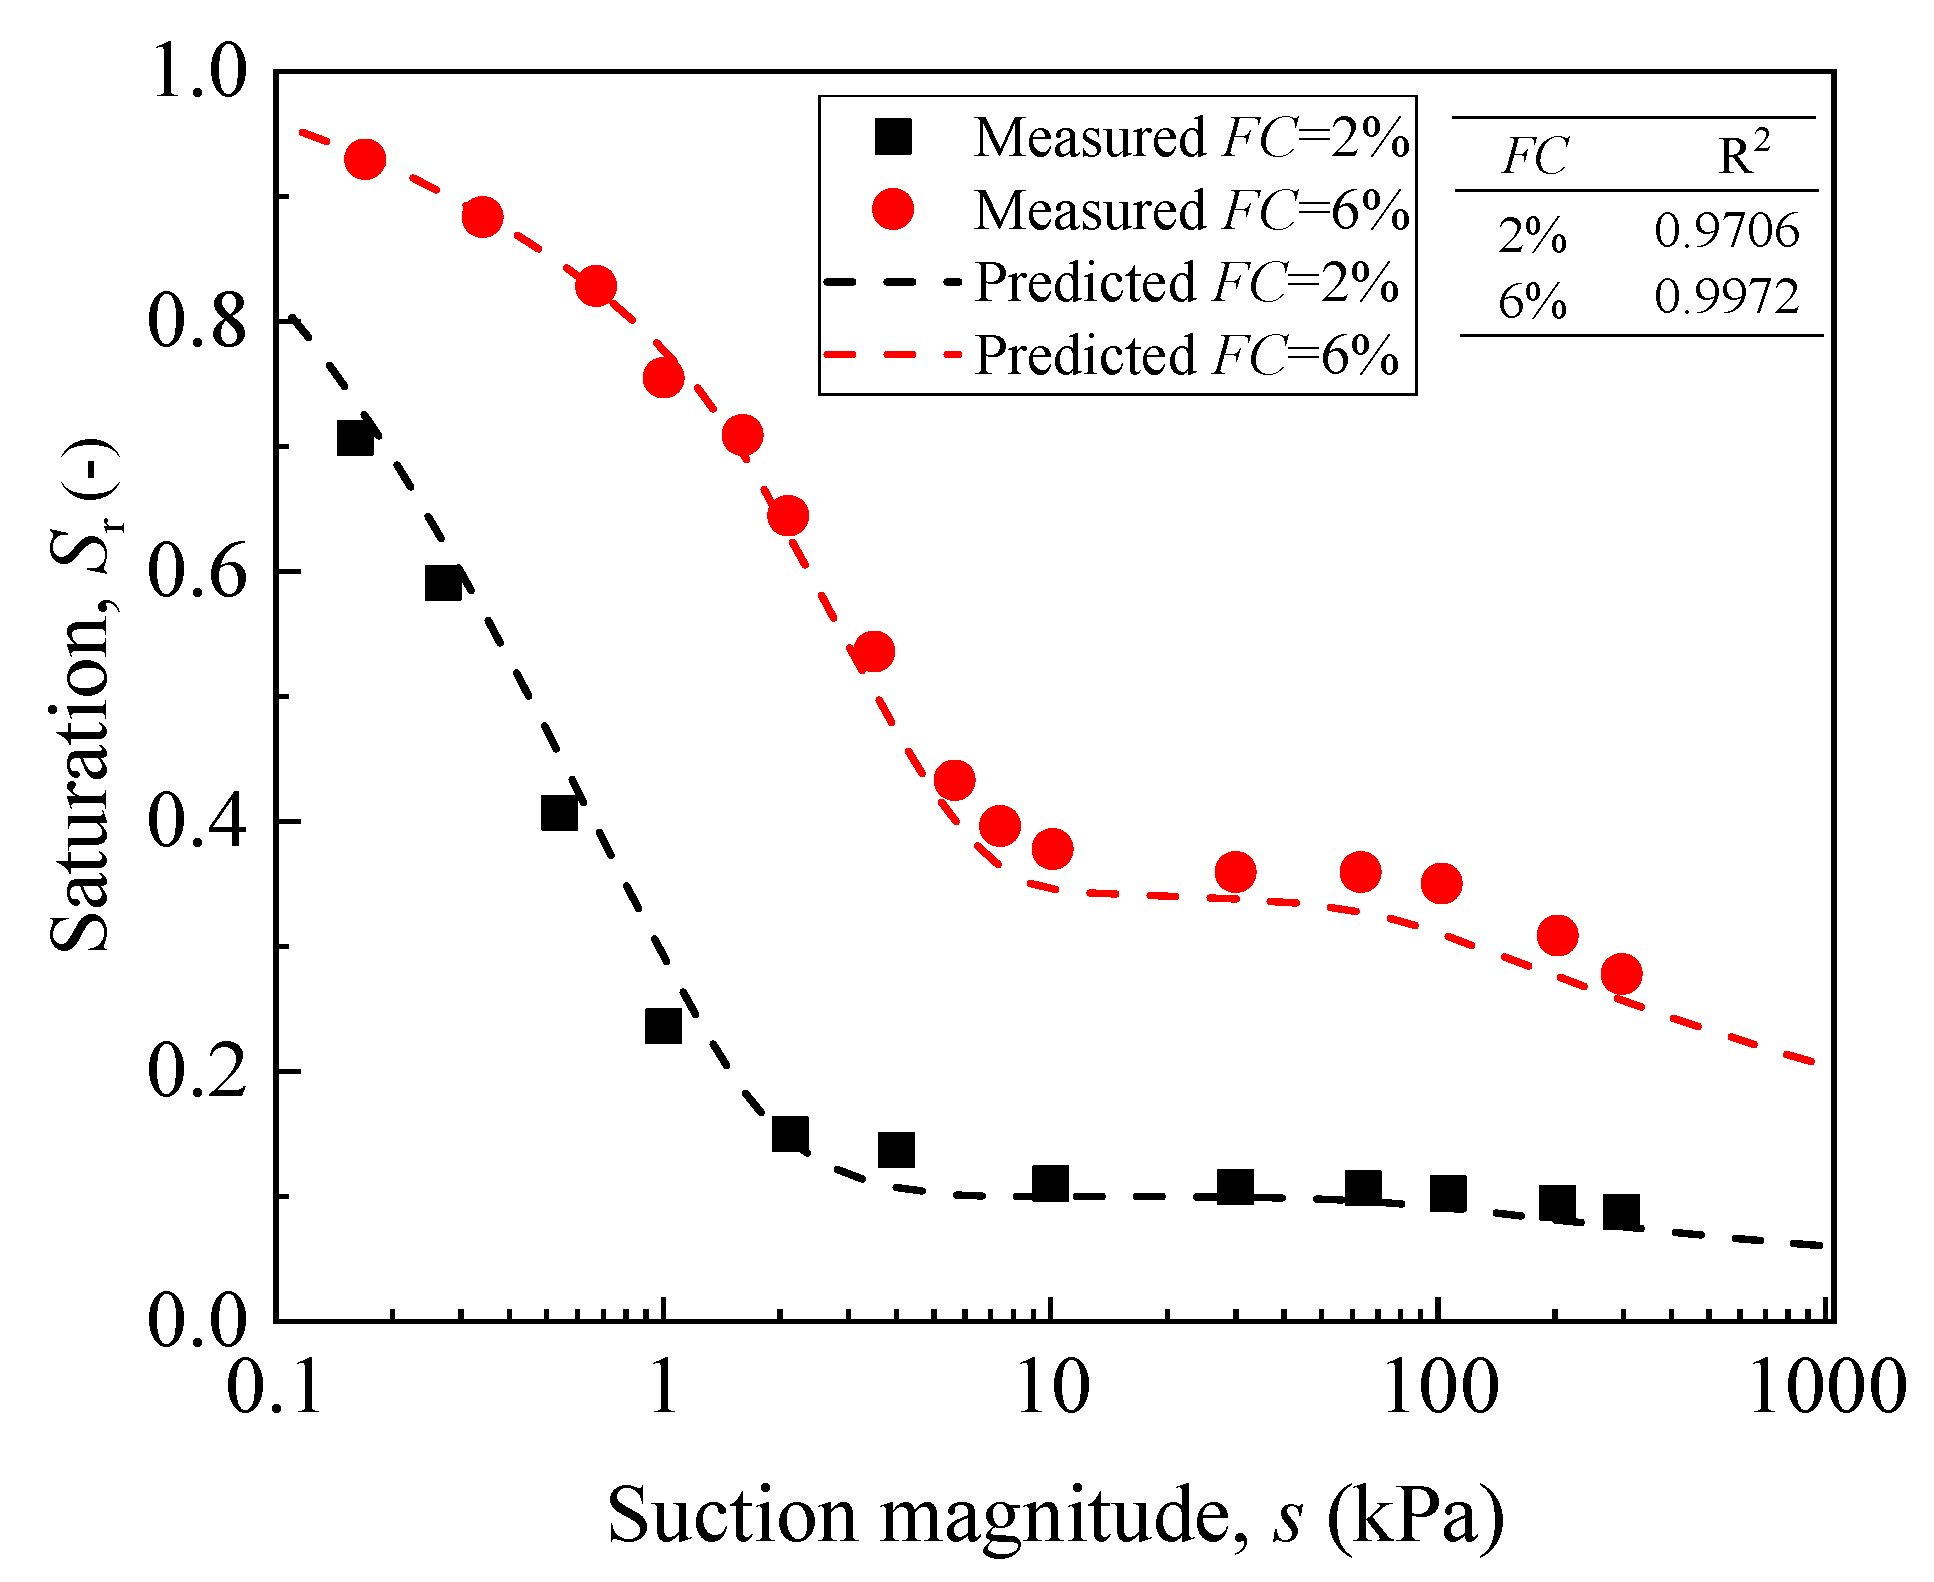
Figure 7 shows the predicted and measured SWRCs at FC = 2% and 6% by using the fitting parameters in Table 1. The correlation coefficient is 0.9926 for FC = 2% and 0.9986 for FC = 6%, respectively. The reasonably good agreement between the predicted and measured SWRCs indicates that the proposed model can predict SWRC satisfactorily at different FCs.

Figure 7.
The predicted SWRCs versus the measured data for FC = 2% and 6%.
6. Conclusions
The SWRCs of soils with different FCs (0%, 2%, 4%, 6% and 8%) were measured using a large-scale SWRC testing apparatus. Based on the test results, the evolution of the PSD of the inter-aggregate pores and the intra-aggregate pores were deduced: with the addition of fine content, the PSD of the inter-aggregate pores was shifted and scaled, and the PSD of the intra-aggregate pores was only scaled. Then, an SWRC model was formulated considering the effect of fine content on the PSD of the inter-aggregate pores and intra-aggregate pores. The values of the fitting parameters were obtained from the SWRCs of FC = 0%, 4% and 8%, and then verified with two other FCs (2% and 6%). In the verification, the relatively large R2 indicates that the agreement between the proposed model and testing results is satisfactory. The proposed model can predict the SWRC at different fine contents of the soil characterized by the coarse-grain skeleton.
Author Contributions
Conceptualization, Q.Z.; methodology, Q.Z. and Z.C.; validation, Q.Z. and C.G.; resources, Y.C.; writing—original draft preparation, Q.Z., Z.C. and C.G.; funding acquisition, Z.C. and C.G. All authors have read and agreed to the published version of the manuscript.
Funding
This research was funded by National Science Foundation for outstanding scholar in Zhejiang Province (No.LR21E08004), National Natural Science Foundation of China (Nos. 51978611, 51878513) and Chinese Scholarship Council (No. 202006320250).
Institutional Review Board Statement
Not applicable.
Informed Consent Statement
Not applicable.
Data Availability Statement
Some or all data, models, or codes generated or used during the study are available from the corresponding author by request.
Conflicts of Interest
The authors declare no conflict of interest.
Notation
| FC | fine content |
| s | matric suction |
| r | pore radius |
| Ts | surface tension of water and soil |
| contact angle | |
| volumetric water content | |
| pore size distribution (PSD) function | |
| shifting value | |
| scaling factor | |
| PSD of inter-aggregate pores | |
| PSD of intra-aggregate pores | |
| effective saturation of inter-aggregate pore | |
| effective saturation of intra-aggregate pore | |
| saturated volumetric water content of the inter-aggregate pores | |
| saturated volumetric water content of the intra-aggregate pores | |
| saturated volumetric water content of the soils | |
| k | fitting parameter |
| ; nf; mf | fitting parameter of the SWRC formed by intra-aggregate pores |
| ; nc; mc | fitting parameter of the SWRC formed by inter-aggregate pores |
| shifting parameter of the inter-aggregate pores | |
| scaling parameter of the intra-aggregate pores | |
| fitting parameter |
References
- Wang, H.-L.; Cui, Y.-J.; Lamas-Lopez, F.; Dupla, J.-C.; Canou, J.; Calon, N.; Saussine, G.; Aimedieu, P.; Chen, R. Effects of inclusion contents on resilient modulus and damping ratio of unsaturated track-bed materials. Can. Geotech. J. 2017, 54, 1672–1681. [Google Scholar] [CrossRef]
- Su, Y.; Cui, Y.-J.; Dupla, J.-C.; Canou, J. Investigation of the effect of water content on the mechanical behavior of track-bed materials under various coarse grain contents. Constr. Build. Mater. 2020, 263, 120206. [Google Scholar] [CrossRef]
- Su, Y.; Cui, Y.-J.; Dupla, J.-C.; Canou, J.; Qi, S. Developing a Sample Preparation Approach to Study the Mechanical Behavior of Unsaturated Fine/Coarse Soil Mixture. Geotech. Test. J. 2020, 44, 912–928. [Google Scholar] [CrossRef]
- Su, Y.; Cui, Y.-J.; Dupla, J.-C.; Canou, J. Effect of water content on resilient modulus and damping ratio of fine/coarse soil mixtures with varying coarse grain contents. Transp. Geotech. 2021, 26, 100452. [Google Scholar] [CrossRef]
- Duong, T.V.; Trinh, V.N.; Cui, Y.J.; Tang, A.M.; Calon, N. Development of a Large-Scale Infiltration Column for Studying the Hydraulic Conductivity of Unsaturated Fouled Ballast. Geotech. Test. J. 2013, 36, 54–63. [Google Scholar] [CrossRef]
- Su, Y.; Cui, Y.-J.; Dupla, J.-C.; Canou, J. Soil-water retention behaviour of fine/coarse soil mixture with varying coarse grain contents and fine soil dry densities. Can. Geotech. J. 2022, 59, 291–299. [Google Scholar] [CrossRef]
- Trinh, V.N.; Tang, A.M.; Cui, Y.-J.; Dupla, J.-C.; Canou, J.; Calon, N.; Lambert, L.; Robinet, A.; Schoen, O. Mechanical characterisation of the fouled ballast in ancient railway track substructure by large-scale triaxial tests. Soils Found. 2012, 52, 511–523. [Google Scholar] [CrossRef]
- Duong, T.V.; Tang, A.M.; Cui, Y.-J.; Trinh, V.N.; Dupla, J.-C.; Calon, N.; Canou, J.; Robinet, A. Effects of fines and water contents on the mechanical behavior of interlayer soil in ancient railway sub-structure. Soils Found. 2013, 53, 868–878. [Google Scholar] [CrossRef] [Green Version]
- Duong, T.V.; Cui, Y.-J.; Tang, A.M.; Dupla, J.-C.; Canou, J.; Calon, N.; Robinet, A. Effects of water and fines contents on the resilient modulus of the interlayer soil of railway substructure. Acta Geotech. 2016, 11, 51–59. [Google Scholar] [CrossRef]
- Cao, Z.; Chen, J.; Cai, Y.; Gu, C.; Wang, J. Effects of moisture content on the cyclic behavior of crushed tuff aggregates by large-scale tri-axial test. Soil Dyn. Earthq. Eng. 2017, 95, 1–8. [Google Scholar] [CrossRef]
- Zhao, H.; Zhang, L. Effect of coarse content on shear behavior of unsaturated coarse granular soils. Can. Geotech. J. 2014, 51, 1371–1383. [Google Scholar] [CrossRef]
- Gu, C.; Ye, X.; Cao, Z.; Cai, Y.; Wang, J.; Zhang, T. Resilient behavior of coarse granular materials in three dimensional anisotropic stress state. Eng. Geol. 2020, 279, 105848. [Google Scholar] [CrossRef]
- Vanapalli, S.K.; Fredlund, D.G.; Pufahl, D.E.; Clifton, A.W. Model for the prediction of shear strength with respect to soil suction. Can. Geotech. J. 1996, 33, 379–392. [Google Scholar] [CrossRef]
- Fredlund, D.G.; Xing, A.; Fredlund, M.; Barbour, S.L. The relationship of the unsaturated soil shear strength to the soil-water characteristic curve. Can. Geotech. J. 1996, 33, 440–448. [Google Scholar] [CrossRef]
- Chaney, R.; Demars, K.; Oberg, A.; Sällfors, G. Determination of Shear Strength Parameters of Unsaturated Silts and Sands Based on the Water Retention Curve. Geotech. Test. J. 1997, 20, 40. [Google Scholar] [CrossRef]
- Vanapalli, S.K.; Han, Z. Prediction of the resilient modulus of unsaturated fine-grained soils. In Proceedings of the International Conference on Advances in Civil Engineering, AETACE, New Delhi, India, 13–14 December 2013. [Google Scholar]
- Han, Z.; Vanapalli, S.K. Model for predicting resilient modulus of unsaturated subgrade soil using soil-water characteristic curve. Can. Geotech. J. 2015, 52, 1605–1619. [Google Scholar] [CrossRef]
- Han, Z.; Vanapalli, S.K. Relationship between resilient modulus and suction for compacted subgrade soils. Eng. Geol. 2016, 211, 85–97. [Google Scholar] [CrossRef]
- Baetens, J.M.; Verbist, K.; Cornelis, W.M.; Gabriels, D.; Soto, G. On the influence of coarse fragments on soil water retention. Water Resour. Res. 2009, 45, W07408. [Google Scholar] [CrossRef]
- Bicalho, K.V.; Gonçalves, F.V.; Favero, L.S. Evaluation of the Soil-Water Retention Curves of Different Unsaturated Silt-Sand Soil Mixtures. In PanAm Unsaturated Soils; American Society of Civil Engineers: Dallas, TX, USA, 2017; pp. 95–103. [Google Scholar] [CrossRef]
- Duong, T.V.; Cui, Y.-J.; Tang, A.M.; Dupla, J.-C.; Calon, N. Effect of fine particles on the hydraulic behavior of interlayer soil in railway substructure. Can. Geotech. J. 2014, 51, 735–746. [Google Scholar] [CrossRef]
- Trinh, V.N. Comportement Hydromécanique de Matériaux Constitutifs de Plateformes Ferroviaires Anciennes. Ph.D. Thesis, Université Paris-Est, Champs-sur-Marne, France, 2011. [Google Scholar]
- Hu, R.; Chen, Y.-F.; Liu, H.-H.; Zhou, C. A water retention curve and unsaturated hydraulic conductivity model for deformable soils: Consideration of the change in pore-size distribution. Géotechnique 2013, 63, 1389–1405. [Google Scholar] [CrossRef]
- Zhou, C.; Ng, C. A new and simple stress-dependent water retention model for unsaturated soil. Comput. Geotech. 2014, 62, 216–222. [Google Scholar] [CrossRef]
- Khoshghalb, A.; Pasha, A.; Khalili, N. A fractal model for volume change dependency of the water retention curve. Géotechnique 2015, 65, 141–146. [Google Scholar] [CrossRef]
- Tan, F.; Zhou, W.-H.; Yuen, K.-V. Modeling the soil water retention properties of same-textured soils with different initial void ratios. J. Hydrol. 2016, 542, 731–743. [Google Scholar] [CrossRef]
- Chen, R.-P.; Liu, P.; Liu, X.-M.; Wang, P.-F.; Kang, X. Pore-scale model for estimating the bimodal soil–water characteristic curve and hydraulic conductivity of compacted soils with different initial densities. Eng. Geol. 2019, 260, 105199. [Google Scholar] [CrossRef]
- Zhang, L.; Chen, Q. Predicting bimodal soil–water characteristic curves. J. Geotech. Geoenviron. Eng. 2005, 131, 666–670. [Google Scholar] [CrossRef]
- Zhao, H.F.; Zhang, L.M.; Fredlund, D.G. Bimodal Shear-Strength Behavior of Unsaturated Coarse-Grained Soils. J. Geotech. Geoenviron. Eng. 2013, 139, 2070–2081. [Google Scholar] [CrossRef]
- Li, X.; Li, J.; Zhang, L. Predicting bimodal soil–water characteristic curves and permeability functions using physically based parameters. Comput. Geotech. 2014, 57, 85–96. [Google Scholar] [CrossRef]
- Wijaya, M.; Leong, E. Equation for unimodal and bimodal soil–water characteristic curves. Soils Found. 2016, 56, 291–300. [Google Scholar] [CrossRef]
- 56000 Ft-Lbf/Ft3 (2700 KN-M/M3); Standard Test Methods for Laboratory Compaction Characteristics of Soil Using Modified Effort. ASTM STANDARDS: West Conshohocken, PA, USA, 2009.
- Thevanayagam, S. Effect of Fines and Confining Stress on Undrained Shear Strength of Silty Sands. J. Geotech. Geoenvironmental Eng. 1998, 124, 479–491. [Google Scholar] [CrossRef]
- Cao, Z.; Zhang, Q.; Cai, Y.; Chen, J.; Gu, C.; Wang, J. The effects of suction history on the cyclic behavior of unsaturated road base filling materials. Eng. Geol. 2020, 276, 105775. [Google Scholar] [CrossRef]
- ASTM D4959-16; Standard Test Method for Determination of Water Content of Soil by Direct Heating. ASTM International: West Conshohocken, PA, USA, 2016.
- Fredlund, D.; Xing, A. Equations for the soil-water characteristic curve. Can. Geotech. J. 1994, 31, 521–532. [Google Scholar] [CrossRef]
- Cheng, Q.; Ng, C.W.W.; Zhou, C.; Tang, C.S. A new water retention model that considers pore non-uniformity and evolution of pore size distribution. Bull. Eng. Geol. Environ. 2019, 78, 5055–5065. [Google Scholar] [CrossRef]
- Mualem, Y. A new model for predicting the hydraulic conductivity of unsaturated porous media. Water Resour. Res. 1976, 12, 513–522. [Google Scholar] [CrossRef] [Green Version]
- Van Genuchten, M.T. A Closed-form Equation for Predicting the Hydraulic Conductivity of Unsaturated Soils. Soil Sci. Soc. Am. J. 1980, 44, 892–898. [Google Scholar] [CrossRef] [Green Version]
Publisher’s Note: MDPI stays neutral with regard to jurisdictional claims in published maps and institutional affiliations. |
© 2022 by the authors. Licensee MDPI, Basel, Switzerland. This article is an open access article distributed under the terms and conditions of the Creative Commons Attribution (CC BY) license (https://creativecommons.org/licenses/by/4.0/).