Article

Raman Spectroscopic Investigation of Osteoclastic Activity under the Influence of Bisphosphonate

1
Ceramic Physics Laboratory, Kyoto Institute of Technology, Kyoto 606-8585, Japan
2
Department of Dental Medicine, Graduate School of Medical Science, Kyoto Prefectural University of Medicine, Kyoto 602-8566, Japan
3
Department Polytechnic of Engineering and Architecture, University of Udine, 33100 Udine, Italy
4
Department of Immunology, Graduate School of Medical Science, Kyoto Prefectural University of Medicine, Kyoto 602-0841, Japan
5
The Center for Advanced Medical Engineering and Informatics, Osaka University, Osaka 565-0871, Japan
6
Department of Orthopedic Surgery, Tokyo Medical University, Tokyo 565-0871, Japan
*
Authors to whom correspondence should be addressed.
Appl. Sci. 2022, 12(8), 3757; https://doi.org/10.3390/app12083757
Submission received: 8 March 2022 / Revised: 30 March 2022 / Accepted: 4 April 2022 / Published: 8 April 2022

Abstract

:
The bone resorption inhibitor bisphosphonate (BP) is used to prevent fractures in patients with osteoporosis and bone metastases caused by cancer. However, BP induces apoptosis of osteoclasts and excessively suppresses bone turnover, so that side effects such as jawbone necrosis have become a problem. In the super-aging society that Japan is facing, it is expected that jawbone necrosis (Medication-related osteonecrosis of the jaw: MRONJ) will increase as the number of osteoporosis patients increases. There are many unclear points about the pathophysiology of jawbone necrosis, and there have been attempts to clarify it. Most of the research on osteoclasts so far has comprised destructive and invasive analyses, such as TRAP staining and PCR by culturing osteoclasts on a plastic plate, which is the original physiological function of osteoclasts. “Bone resorption” cannot be analyzed in real time. In this study, Raman spectroscopy is used to show the state of bone resorption of osteoclasts cultured on ivory sections or octacalcium phosphate plates noninvasively and without the need for colorimetric assays. This makes it possible to clarify the effect of BP on osteoclast metabolism in an environment closer to that of a living body. If this method is established, then we aim to elucidate the pathophysiology of bone pathologies and medical treatments that directly affect osteoclasts, such as medication-related osteonecrosis, and establish a diagnostic method.

1. Introduction

RANKL/RANK signaling regulates osteoclast formation, activation and survival both during normal bone tissue remodeling and in various pathogenic conditions in which the pace of bone turnover increases [1]. The acronym RANK stands for “Receptor activator of nuclear factor κ B”, a member of the tumor necrosis factor receptor (TNFR) molecular subfamily. RANKL, the “Receptor activator of nuclear factor kappa-Β ligand”, is a protein that binds to RANK on cells of the myeloid lineage and functions as a key factor for osteoclast differentiation and activation. In normal conditions, osteoprotegerin would protect the bone tissue from excessive resorption by binding to RANKL and preventing it from binding to RANK [2].
Pathogenic overproduction of RANKL can be caused by various pathologic conditions, including postmenopausal osteoporosis [3], hyperparathyroidism [4] and rheumatoid arthritis [5], while targeted disruption of the related gene in mice leads to severe osteopetrosis and a lack of osteoclasts [6].
When primary tumors metastasize into the bone, in particular in the case of breast and prostate cancers, RANKL activity is greatly increased. RANKL is considered to be a key signal regulator for cancer-induced bone loss [7]. The excess of RANKL results not only in faster bone loss, but also stimulates cancer growth [8]. For these reasons, inhibition of RANKL is a common treatment in the presence of metastatic cancer [9].
Bisphosphonates are a family of organic molecules that have the P-C-P structure in common, which is similar to the P-O-P structure of native pyrophosphate [10]. Bisphosphonates differ from each other only at the “R1” and “R2” groups, connected to the central carbon atom, while the “R” groups can vary greatly in size and complexity, going from simple hydrogen atoms to the planar, five-membered ring of imidazole [11]. Alendronate, neridronate, ibandronate, pamidronate, risedronate and zoledronic acid have a nitrogen group and are called nitrogen-containing bisphosphonates, in contrast with etidronate and tiludronate, which do not have a nitrogen group [12].
The main mechanism of action of bisphosphonates in inhibiting the osteoclastic bone resorption differs from most other antiresorptive agents [13]: bisphosphonate molecules have the ability to bind to hydroxyapatite’s phosphate groups, but their interaction is controlled by the size and hydrophobicity of the R groups [14], resulting in slightly different binding mechanisms and energies. When osteoclasts try to resorb bone tissue that is bond to bisphosphonates, the latter are released, impairing the capability of osteoclasts to adhere to bone and to produce protons that are necessary for the process of bone resorption to continue [15]. Bisphosphonates also directly affect the capability of progenitor cells to differentiate into osteoblasts [16] while promoting their apoptosis [17], thus reducing the overall osteoclastic activity.
Due to their ability to control bone resorption, bisphosphonate molecules have been successfully used in the treatment of bone osteoporosis, leading to a significant decrease in morbidity and an increase in survival rates [18], but their use has also been associated with longer healing processes in the case of bone fractures [19]. Bisphosphonates have been used successfully for many years to reduce the skeletal complications related with the benign and malignant bone diseases that are characterized by enhanced osteoclastic bone resorption [20]. Nitrogen-containing bisphosphonates have also been demonstrated to exhibit direct antitumor effects [21].
In this research, summarized in Figure 1, we used Raman spectroscopy, Raman imaging and principal components analysis to identify the fingerprints for cellular differentiation in osteoclasts, bone remodeling and bisphosphonate-inhibiting action.

2. Materials and Methods

2.1. Samples Preparation

In this study, two different types of substrates were used: ivory dentine (FUJIFILM Wako Pure Chemical Corporation, Osaka, Japan) disks and Octacalcium phosphate (OCP) disks (Cosmo Bio Co., Ltd., Tokyo, Japan). The samples had a diameter of 8 mm and a thickness of 1 mm. The surface finishing varied between the samples, with the dentine samples still showing clear machining marks.

2.2. Sample Characterization

Raman imaging was performed using a confocal laser Raman microscope (RAMANtouch, Nanophoton Co., Ltd., Osaka, Japan). The excitation source was 532 nm, at a nominal power of 200 mW. In order to prevent samples from burning, the power output was controlled by adjusting a dedicated ND filter. The microprobe used lenses ranging from 5× to 100× magnifications with numerical apertures from to 0.5 to 0.15. At the lowest magnification, the Raman spot size was 1.8 μm, according to the “half intensity” definition. For Raman imaging, a linear detector was used to simultaneously acquire 400 spectra on a 415.47 μm line in the x direction (lateral resolution in x, 1.03μm). In the y direction, the linear scans were repeated 233 times on a 241.41 μm interval to have a comparable lateral resolution in y (1.03 μm). Two maps have been acquired on 5 different specimens for each type of samples.
Optical and topographical maps of the surface of the samples were taken using a 3D laser scanning microscope (VKX200K series, Keyence, Osaka, Japan) with lenses magnifications ranging from 10× to 150× and a numerical aperture between 0.30 and 0.95. Map acquisition was automated by using a motorized xy stage and a z-axis autofocus.
X-ray diffraction (XRD) analyses of the samples were performed on a Rigaku Miniflex 600 system (Rigaku Corporation, Tokyo, Japan), using CuKα radiation at 40 kV and 15 mA. The diffraction pattern was collected in the region between 22° and 57°.

2.3. Cell Culture

Murine macrophage cell line RAW264.7 cells were obtained from RIKEN BRC CELL BANK (Ibaraki, Japan). RAW264.7 cells were seeded onto the substrates and cultured for 7 days at 37 °C in an atmosphere containing 5% CO2. Cells were cultured in DMEM (Nacalai tesque, Inc., Kyoto, Japan) supplemented with 10% FBS, 100 mM nonessential amino acids, 100 U/mL penicillin and 100 μg/mL streptomycin (Complete Medium). For osteoclast differentiation, 100 ng/mL RANKL (Oriental Yeast Co., Ltd., Osaka, Japan) was added to the complete medium to induce differentiation of RAW264.7 cells into osteoclast cells, with or without 2 ng/mL bisphosphonate alendronate sodium salt trihydrate (FUJIFILM Wako Pure Chemical Corporation, Mie, Japan).

2.4. Biological Testing

A histochemical method was used to detect the presence of osteoclasts. The histochemical TRAP staining results in a red color precipitate that can be easily detected under light microscope. For the TRAP staining, the cells were fixed with 4% paraformaldehyde followed by membrane permeabilization with Ethanol/Acetone (50:50 v/v) for 1 min at −20 °C. Cells were washed in PBS at 2 times and stained with tartaric acid solution (FUJIFILM Wako Pure Chemical Corporation, Mie, Japan) for 60 min 37 °C.

2.5. Statistical Analysis

For statistical purposes, all spectra have been acquired in 50 different locations and all biological tests were repeated on 5 specimens for each sample. Statistical significance has been addressed by two-way ANOVA analysis of variance. Statistically significant results (p < 0.05) have been marked with an “*”.
The experimental settings have been illustrated in Figure 1.

3. Results

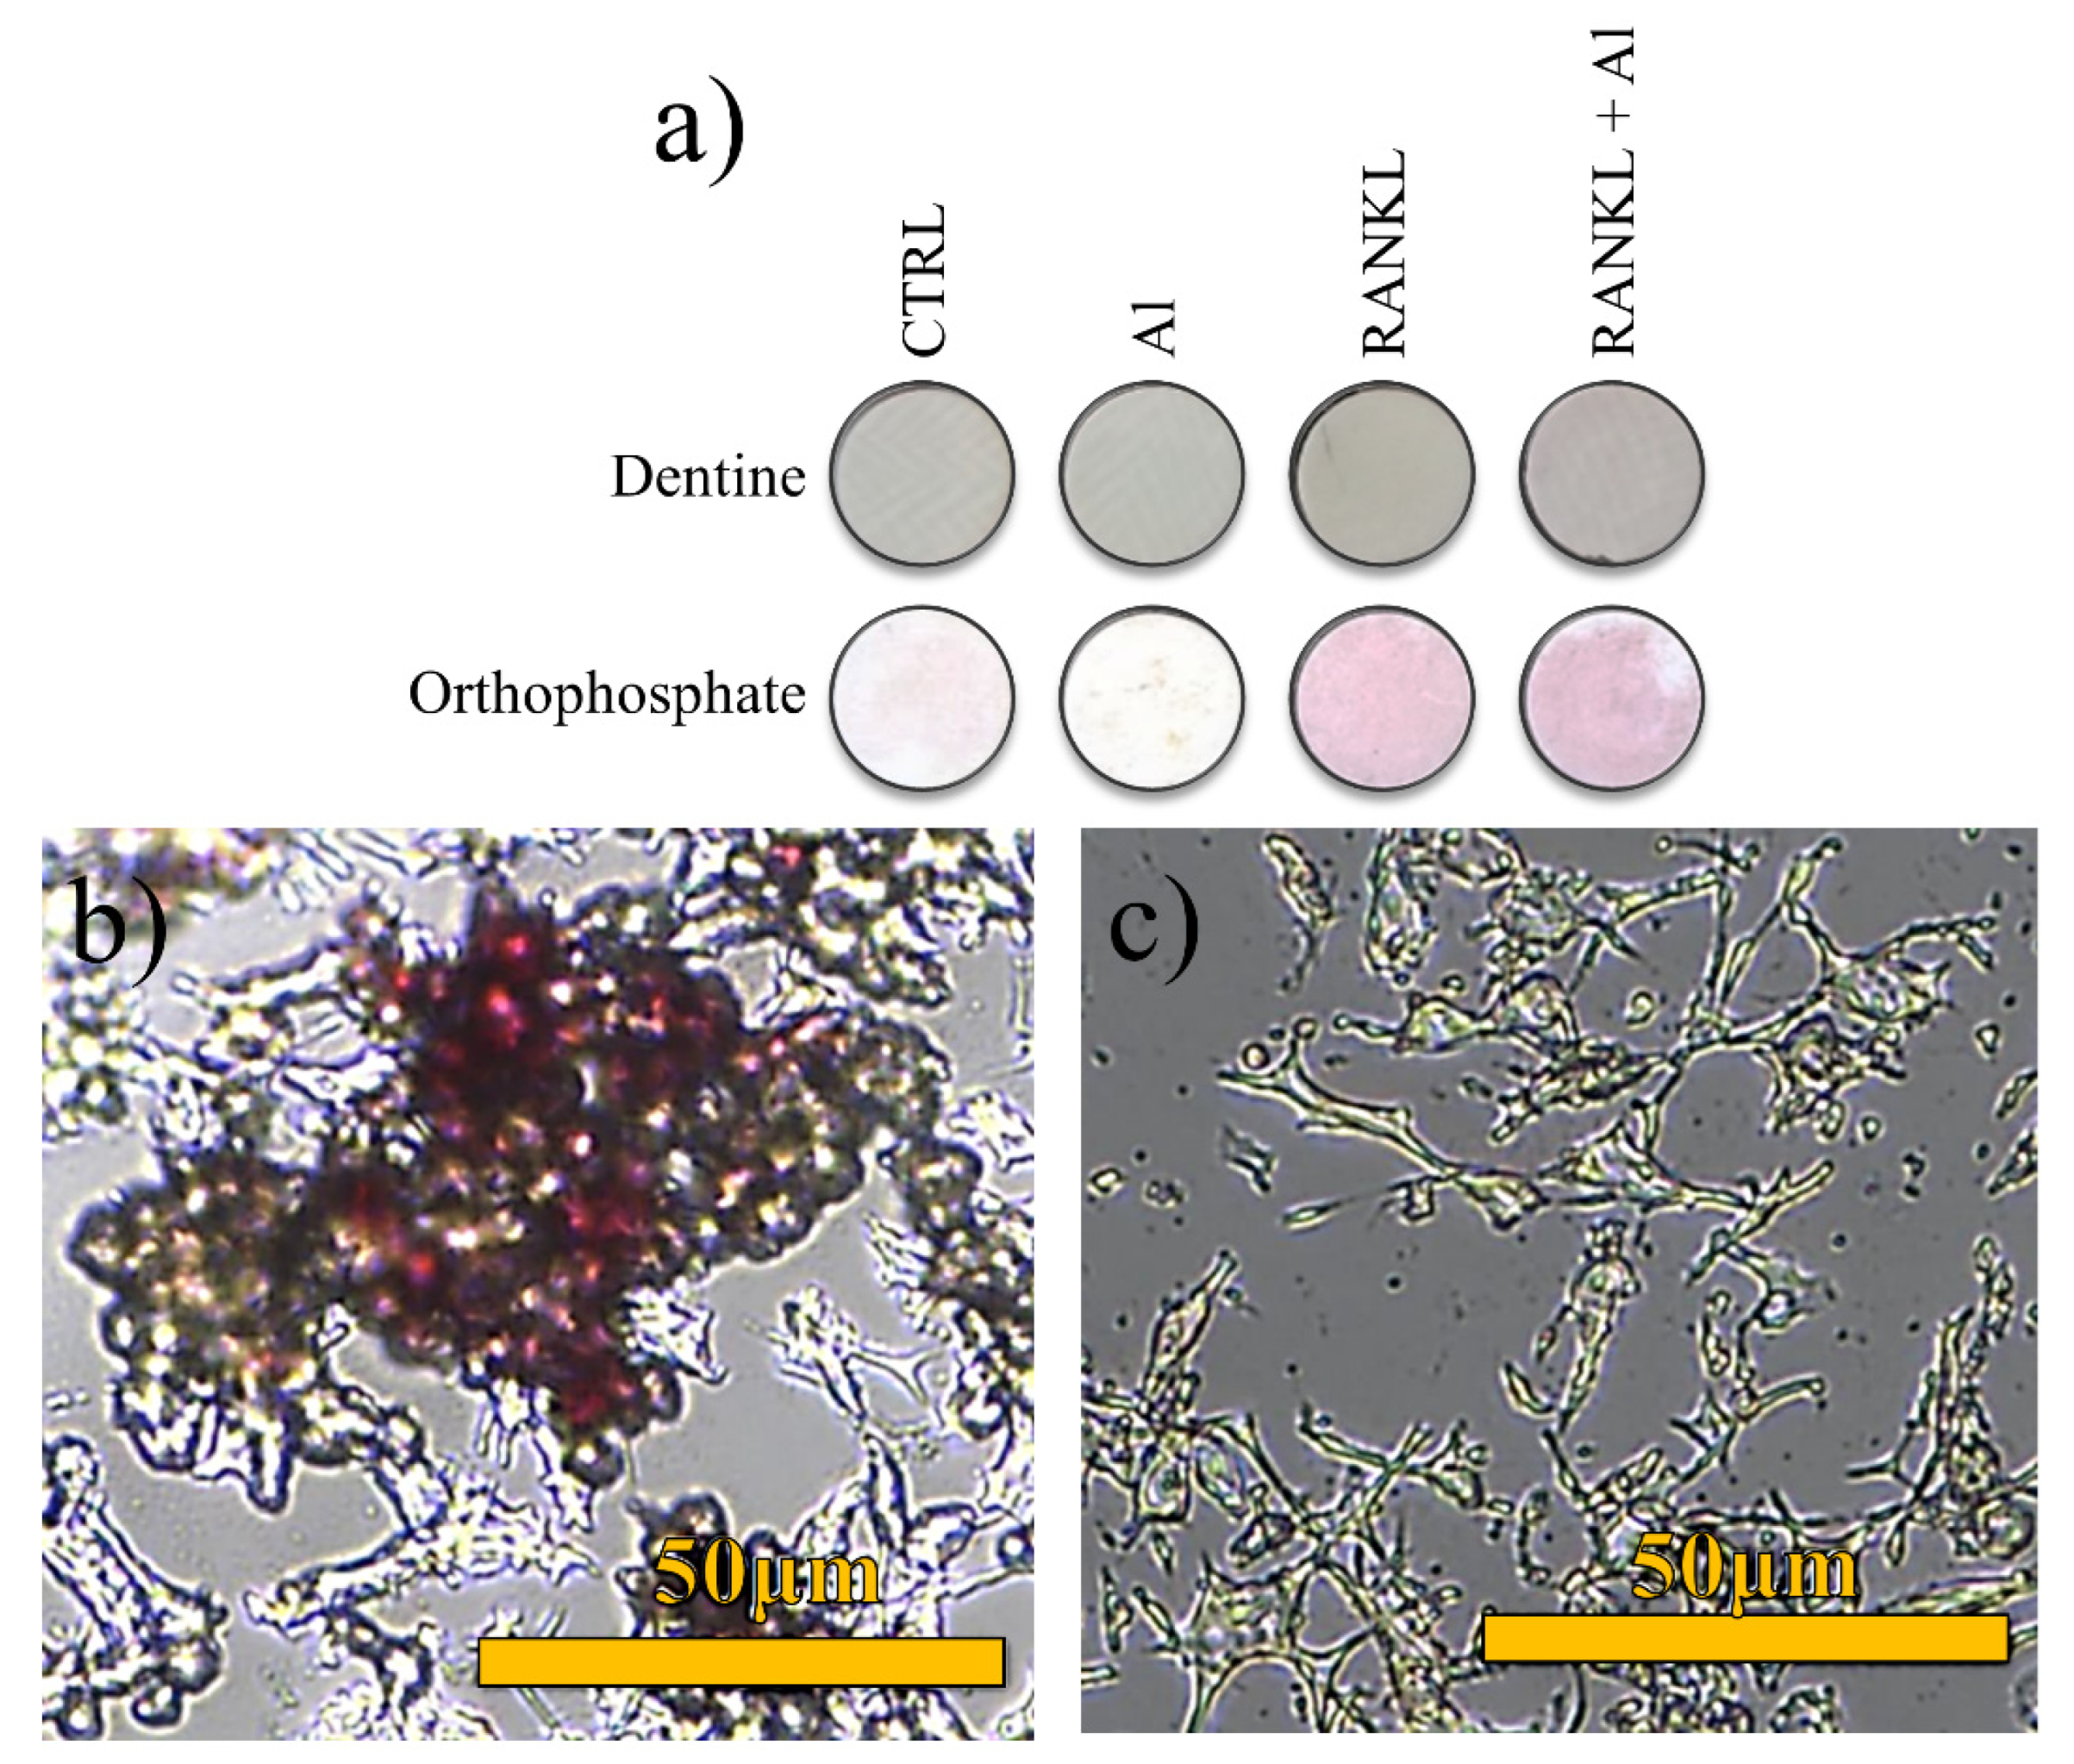
Figure 2 shows the results of the TRAP staining. Figure 2a shows the macroscopic images of representative samples after testing, while Figure 2b,c show cells that were collected from a dentine substrate with Figure 2a and without Figure 2b RANKL. Both the samples with only RANKL and with RANKL and alendronate were affected by the TRAP staining, with a complete coverage of the substrate in the case of RANKL. Staining also affected the octacalcium phosphate control samples with undifferentiated RAW-264.7 cells, which shows a pale pink tint on about 50% of the overall surface. As expected, the samples treated with bisphosphonate do not show any pigmentation, due to its ability to reduce osteoclast activity by decreasing progenitor development and recruitment and by promoting osteoclast apoptosis [17]. Figure 2a,b show the presence of osteoclasts and macrophage RAW-264.7 cells on the sample with RANKL and the control, respectively.
Another clear effect of the bone remodeling activity is the change of morphology of the surfaces after in vitro testing. Figure 3 shows laser microscopy scans of the full surfaces by stitching together 30 single images acquired at 5 magnifications, for each sample. On the surface of the control sample (Figure 3a), the machining marks are still clearly visible (almost vertical lines), but the surface appears to be coarse due to the presence of small, uniformly distributed porosities. Adding bisphosphonates to the medium strongly reduces the osteoclastic activity, as visible in Figure 3b. The machining marks are clear and regular, and no other porosities can be observed on the surface. When the medium contains RANKL, the amount of osteoclastic activity increases, as is clearly observable in Figure 3c: the surface appears to be coarser, and the machining marks are barely visible. In Figure 3d, where RANKL and bisphosphonates are combined together, the machine marks are visible, but at the same time the osteoclastic remodeling of the surface is more marked compared with Figure 3a. Moreover, the distribution of porosities appears to be dependent on the position, suggesting an uninform cell distribution.
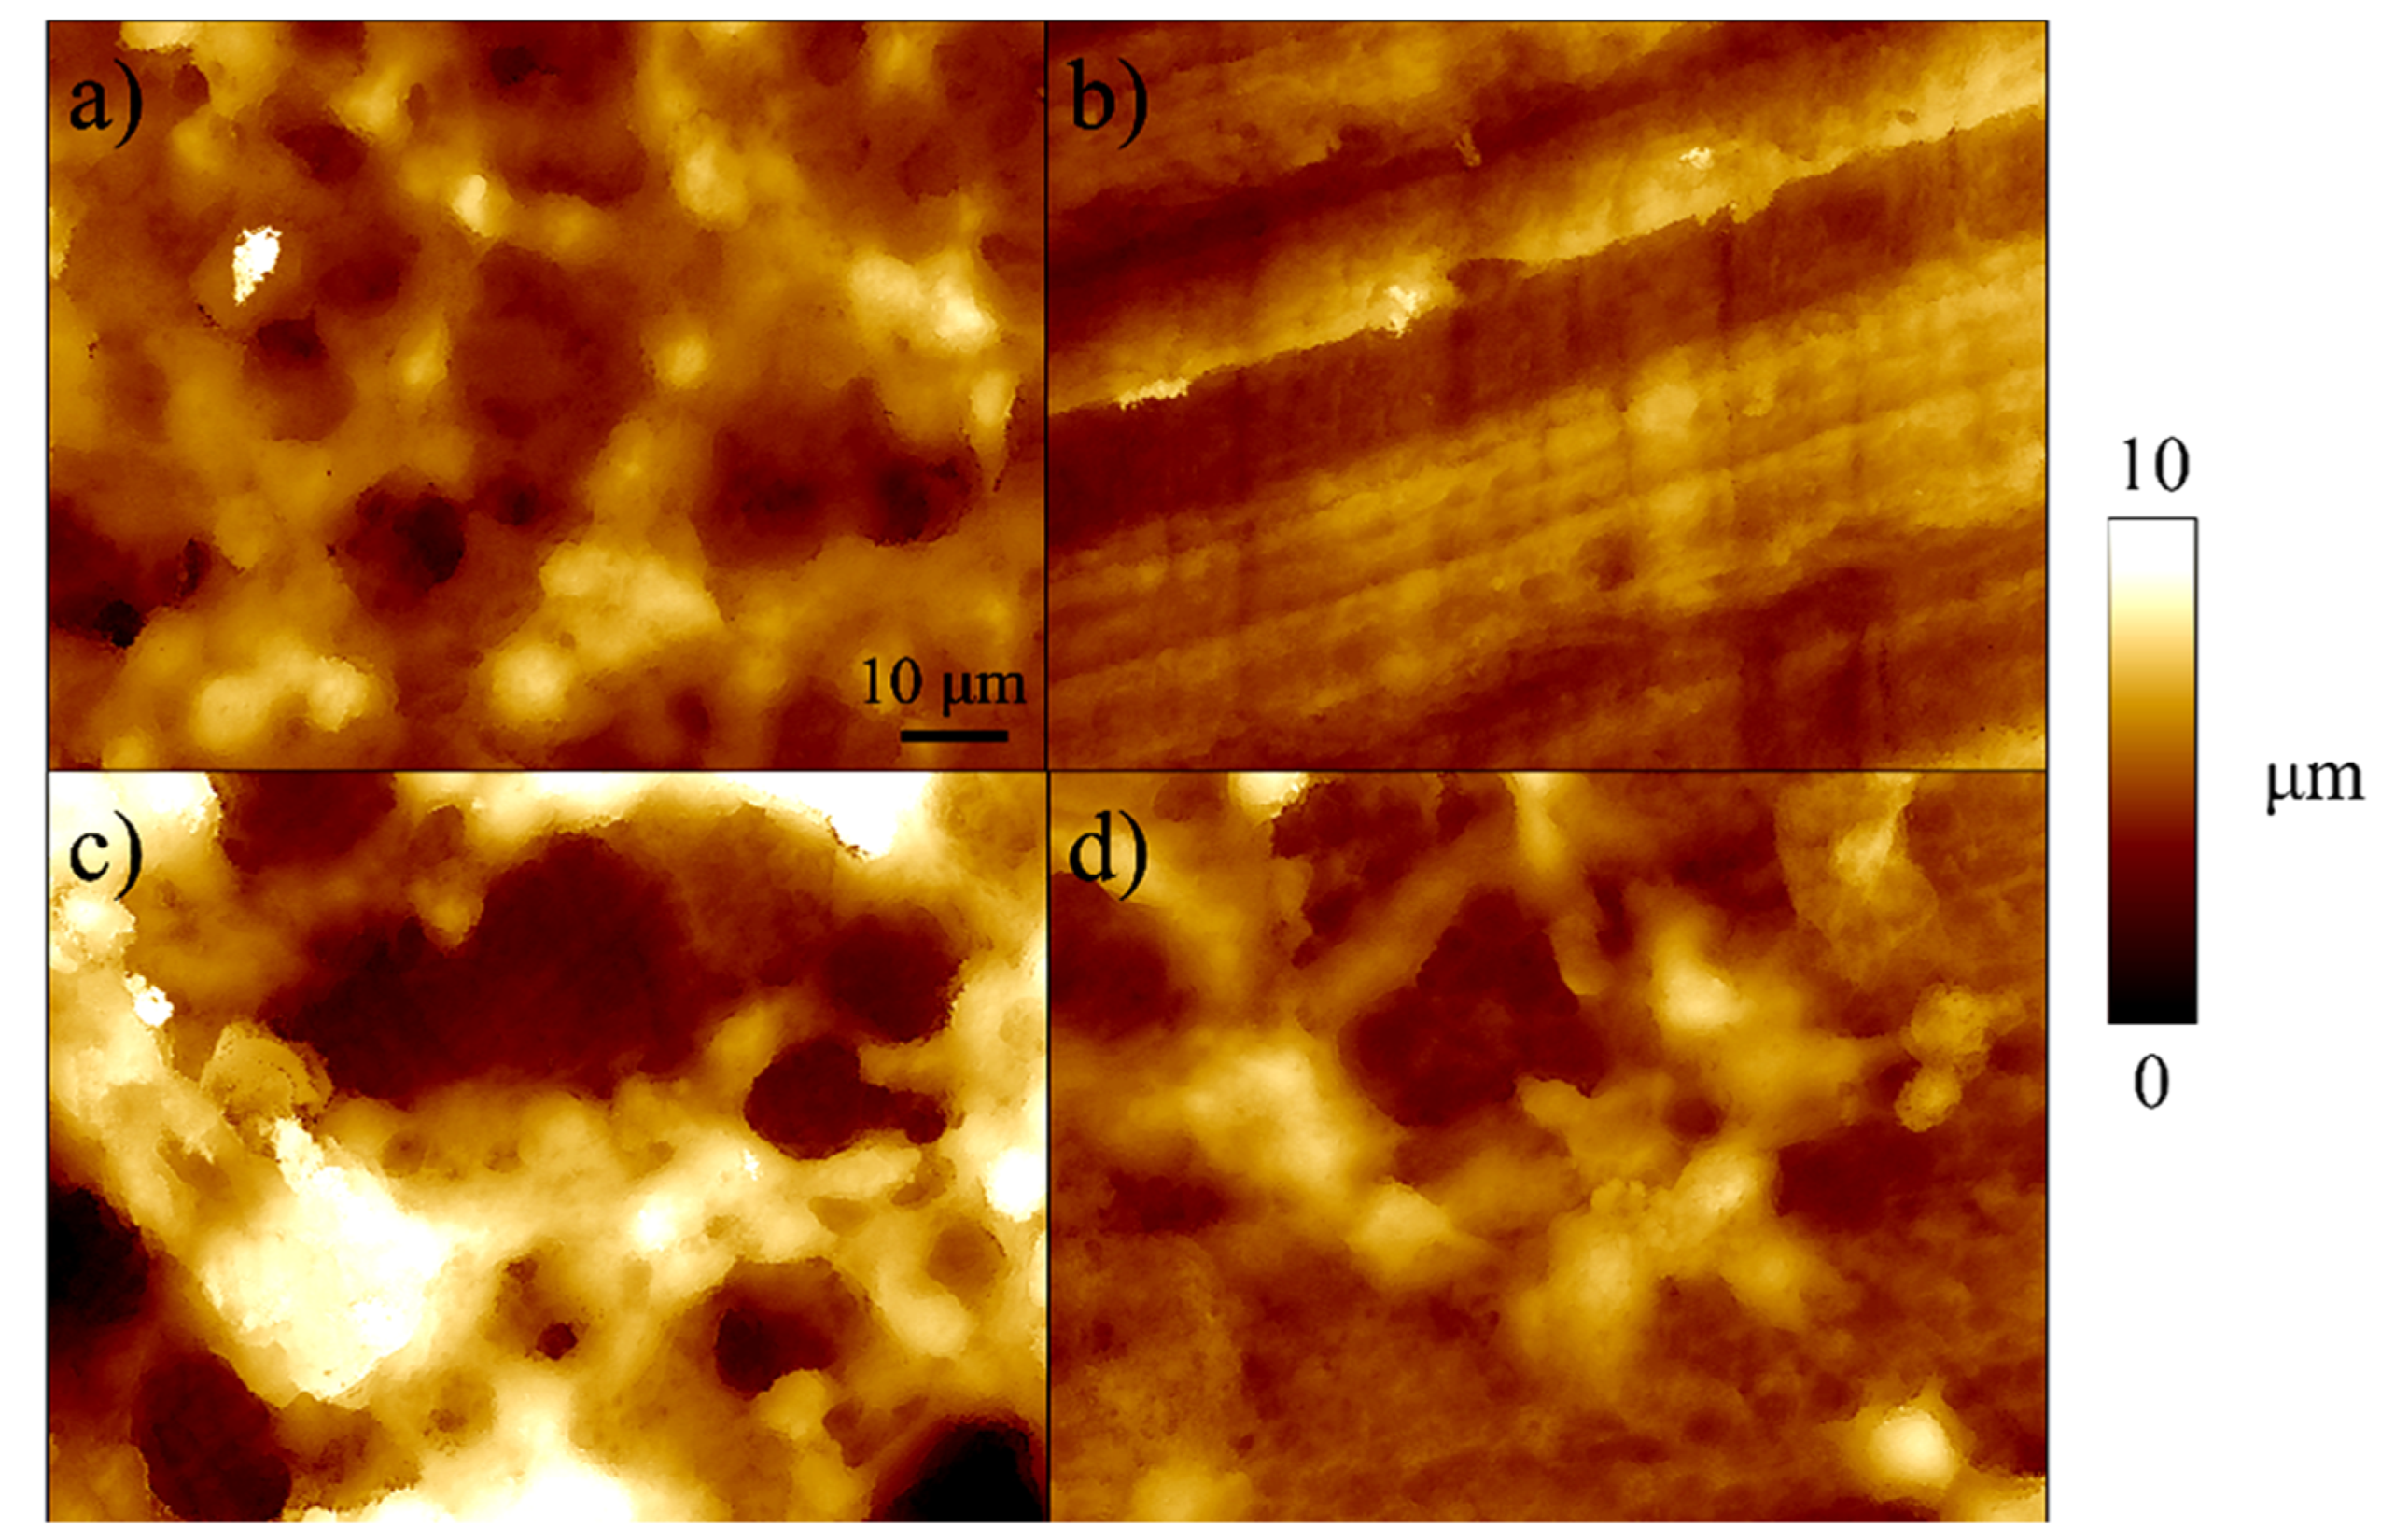
Figure 4 shows higher magnification images of the sample’s surfaces after in vitro testing. On three of the four surfaces (with the exception of the sample treated with just bisphosphonates in Figure 4b), there are clear morphological marks of the osteoclastic remodeling activity: the surface appears to be coarse and globular, with porosities of depth up to 10 microns, in particular in the case of the samples treated with RANKL, in Figure 4c. In Figure 4b, on the other hand, in presence of bisphosphonates, only the original marks caused by the sample machining are visible, and are still partially visible in Figure 4d when both bisphosphonates and RANKL are present at the same time.
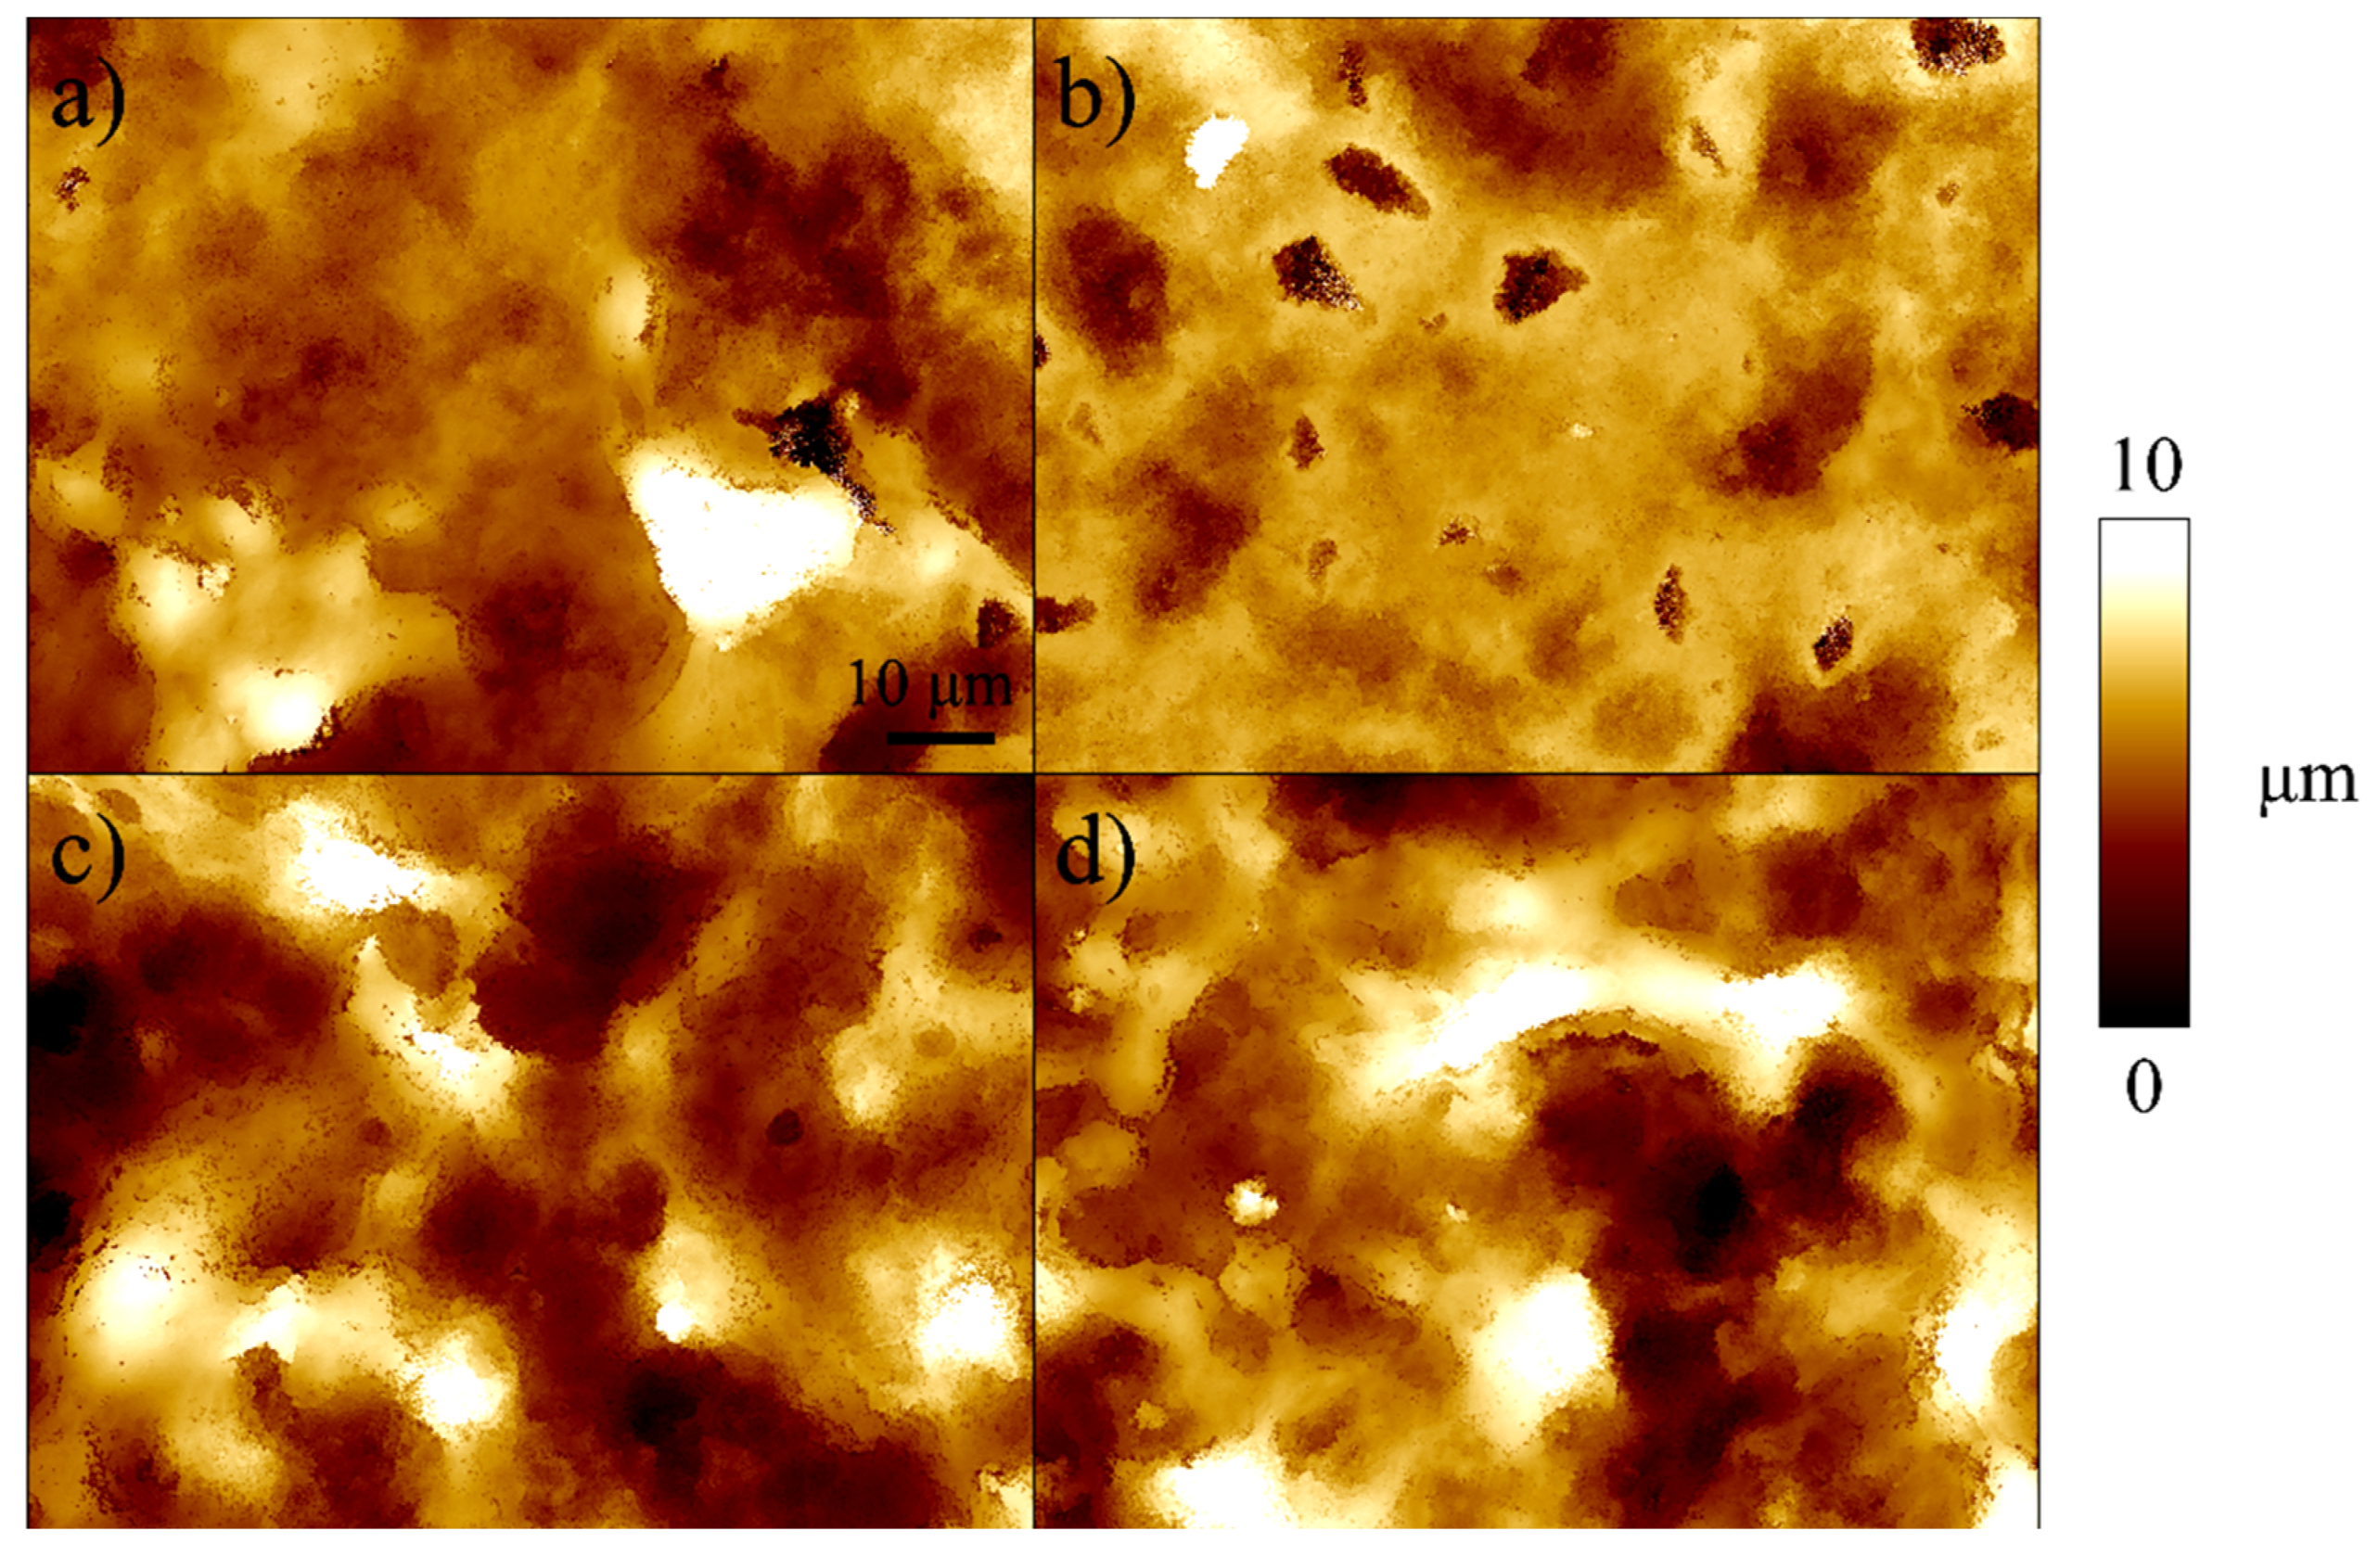
Figure 5 shows the higher magnification images acquired on the surface of the octacalcium phosphate samples after in vitro testing. Unlike dentine, octacalcium phosphate substrates were porous and coarse. The control sample of Figure 5a shows a limited increase in surface roughness when compared with the sample exposed to bisphosphonates in Figure 5b. The surface roughness further increases moving to the sample treated with RANKL, in Figure 5c, and with RANKL and bisphosphonates, in Figure 5d. The small, distributed porosities visible in Figure 5b are still partially observable on the control sample, but completely disappear due to the osteoclastic remodeling in presence of RANKL. As previously observed for dentine, the action of bisphosphonates decreases the amount of remodeling occurring in presence of RANKL, as clearly observable by comparing the roughness of Figure 4c,d.
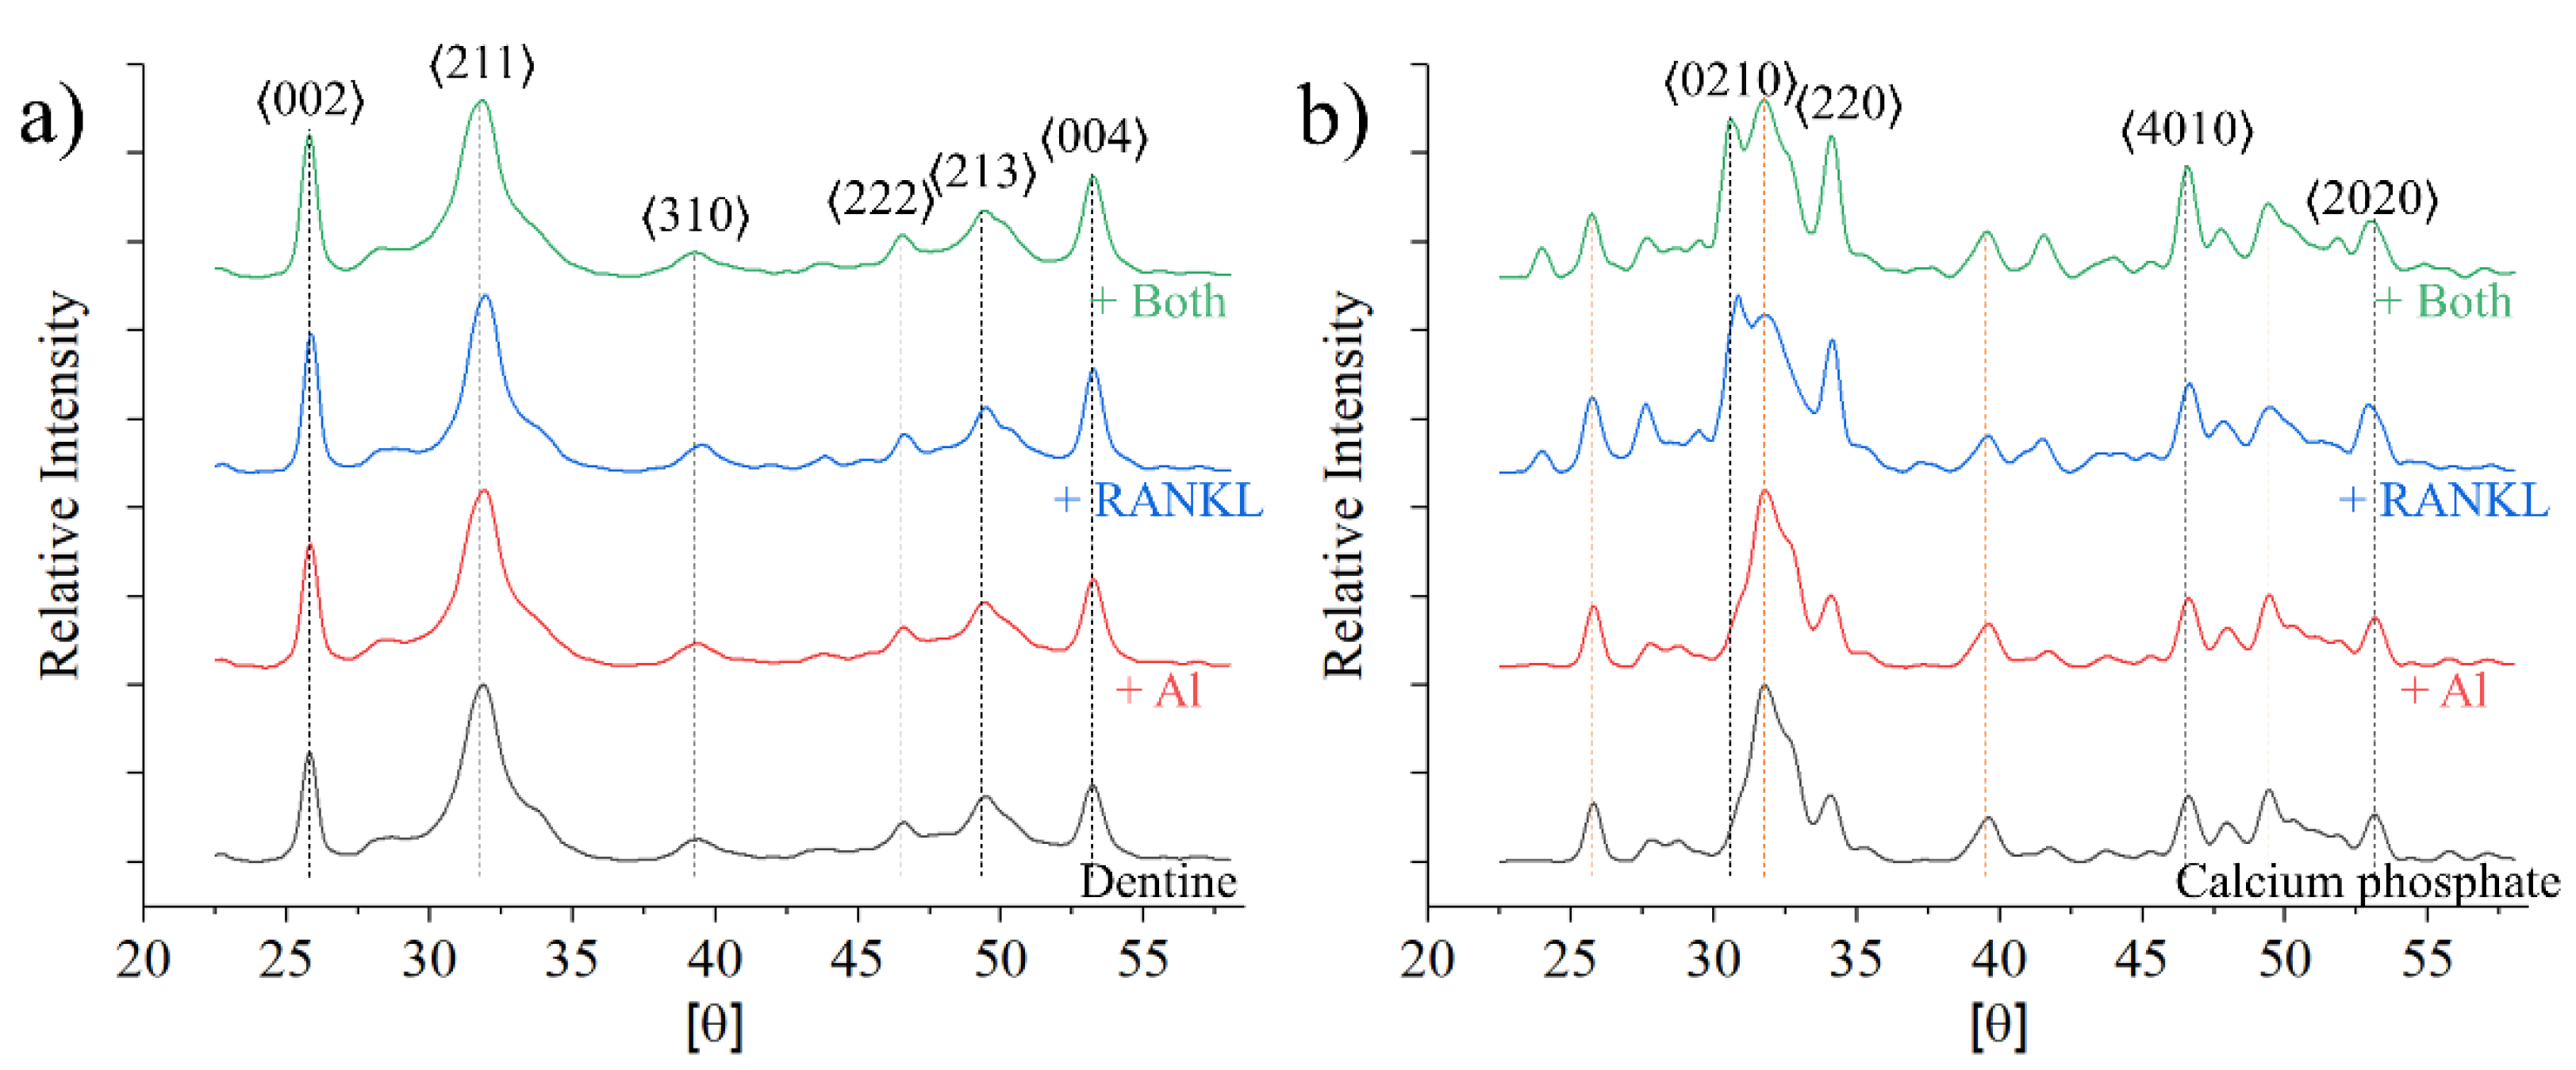
Figure 6 shows the diffraction patterns obtained on the dentine and octacalcium phosphate substrate as a function of the experimental conditions. It can be observed that the four spectra of Figure 6a, related to dentine, are similar to each other and feature the bands conventionally associated with hydroxyapatite crystals [22], the more intense being the band related to the 〈211〉 orientation, followed by the 〈002〉 and then the 〈004〉. Between the four spectra, the main differences appear to be the relative intensities of these three bands. For the octacalcium phosphate substrates of Figure 6b, another set of bands is clearly visible, resulting in a slightly different XRD pattern when compared with Figure 6a. Bands at 31, 34, 46 and 52° and related to tri-calcium phosphate [23,24] show a maximum intensity for the sample tested with RANKL, indicating that the hydroxyapatite phase was completely dissolved by the osteoclastic activity. Interestingly, the further addiction of bisphosphonate reduces the intensity of the bands, but only by about 10%.
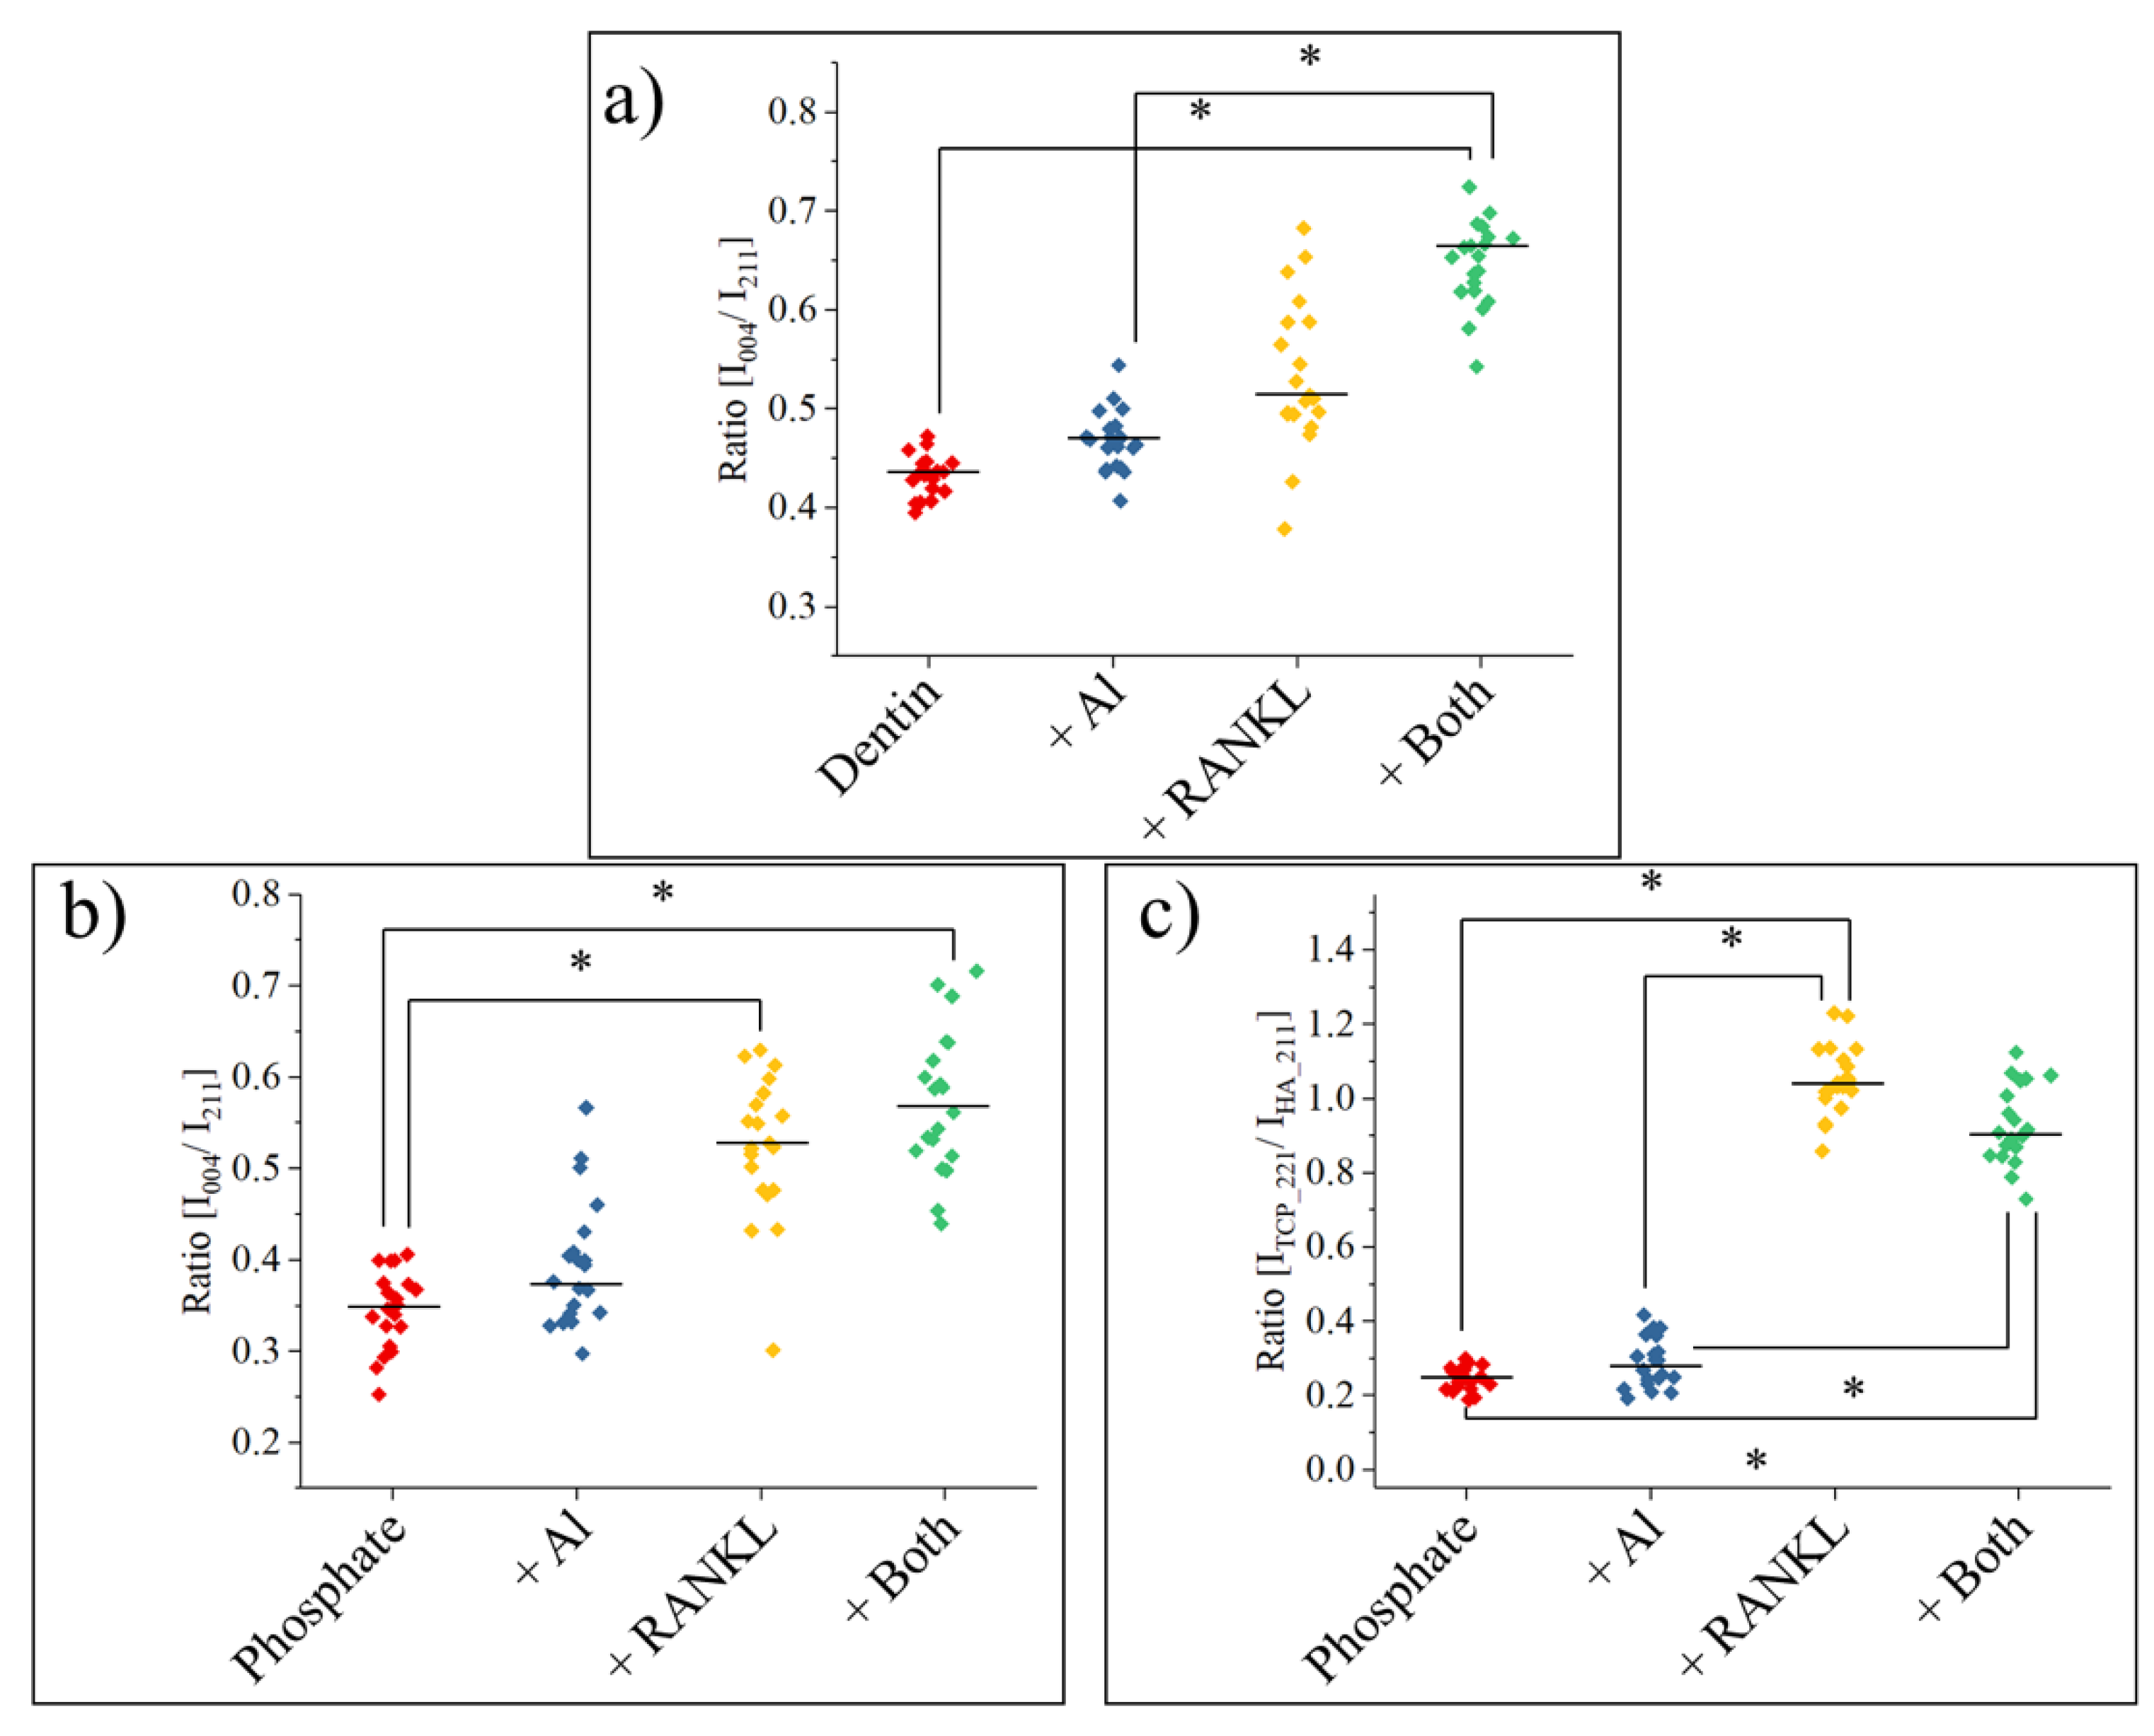
Figure 7 shows the main spectroscopic information that could be extracted from the X-ray diffraction patterns of Figure 6, in particular, concerning the preferential orientation of the hydroxyapatite crystals and the phase ratio between hydroxyapatite and tri-calcium phosphate. On both the dentine (Figure 7a) and phosphate (Figure 7b) substrates, the ratio between the intensity of the 〈004〉 and 〈211〉 orientation peaks appears to be mainly influenced by the presence of RANKL, growing from ~0.4 to ~0.5 or even to ~0.6 for dentine and from ~0.3 to ~0.5 for octacalcium phosphate. No statistically significant difference could be observed in samples containing bisphosphonate. These results suggest that the osteoclastic activity is strongly promoted by RANKL and manifests with a preferential erosion of the 〈211〉-oriented crystals when compared with the 〈004〉-oriented crystals.
Further evidence for the role of RANKL in enhancing the erosion rate of hydroxyapatite can be deducted from Figure 7c: the relative intensity of the diffraction bands related to octacalcium phosphate increase by 5-fold in the presence of RANKL. Bisphosphonate also plays a statistically relevant role, reducing the dissolution activity of osteoclasts by about 20%, when in presence of RANKL.
The average Raman spectra collected on the surface of the various samples are presented in Figure 8. For dentine substrates (Figure 8a,b), both the hydroxyapatite region (Figure 8a) and the amide region (Figure 8b) are in line with previous literature references, in particular showing the presence of PO43− [25], proline and hydroxyproline [25], tyrosine [26], HPO4 [27] and various amide-related vibrations confirming the presence of a well-developed collagenous matrix [28]. Due to the overlapping between vibration frequencies from cells and collagenous tissue of the substrate, no clear spectroscopic confirmation of the presence of osteoclasts can be obtained from these spectral windows.
When compared to dentine, the spectra of the hydroxyapatite region for the octacalcium phosphate samples are simpler, with one main peak between 950 and 1000 cm−1 and a few, barely observable smaller bands at higher Raman shifts (Figure 8c). The vibration band related to PO43− appears to be more complex, with a clear shoulder at about 1000 cm−1 that intensifies on the samples treated with RANKL. This intensity variation is caused by the preferential dissolution action of osteoclasts towards hydroxyapatite than towards octacalcium phosphates, as previously observed in Figure 6b.
The amides region of Figure 8d features numerous bands that were barely visible or even completely absent in Figure 8b, due to the simultaneous presence of both collagen and osteoclasts. A few distinctive spectroscopic features appear only in the control sample and in the samples treated with RANKL, in particular between 1240 cm−1 and 1280 cm−1, between 1350 cm−1 and 1380 cm−1 around 1450 cm−1 and again at about 1630 cm−1. Some of these features were previously reported in the literature for osteoclasts observed by Raman spectroscopy [29] and represent possible spectroscopic markers for cell differentiation into fully grown osteoclasts [30]. The intense band at about 1370 cm−1 has been previously associated with the presence of tryptophan [31], which is also known for playing a role in bone remodeling and osteoclastic differentiation; however, considering the band position and relative intensity, it is most likely due to the presence of thymidine [32], produced by cell precursors.
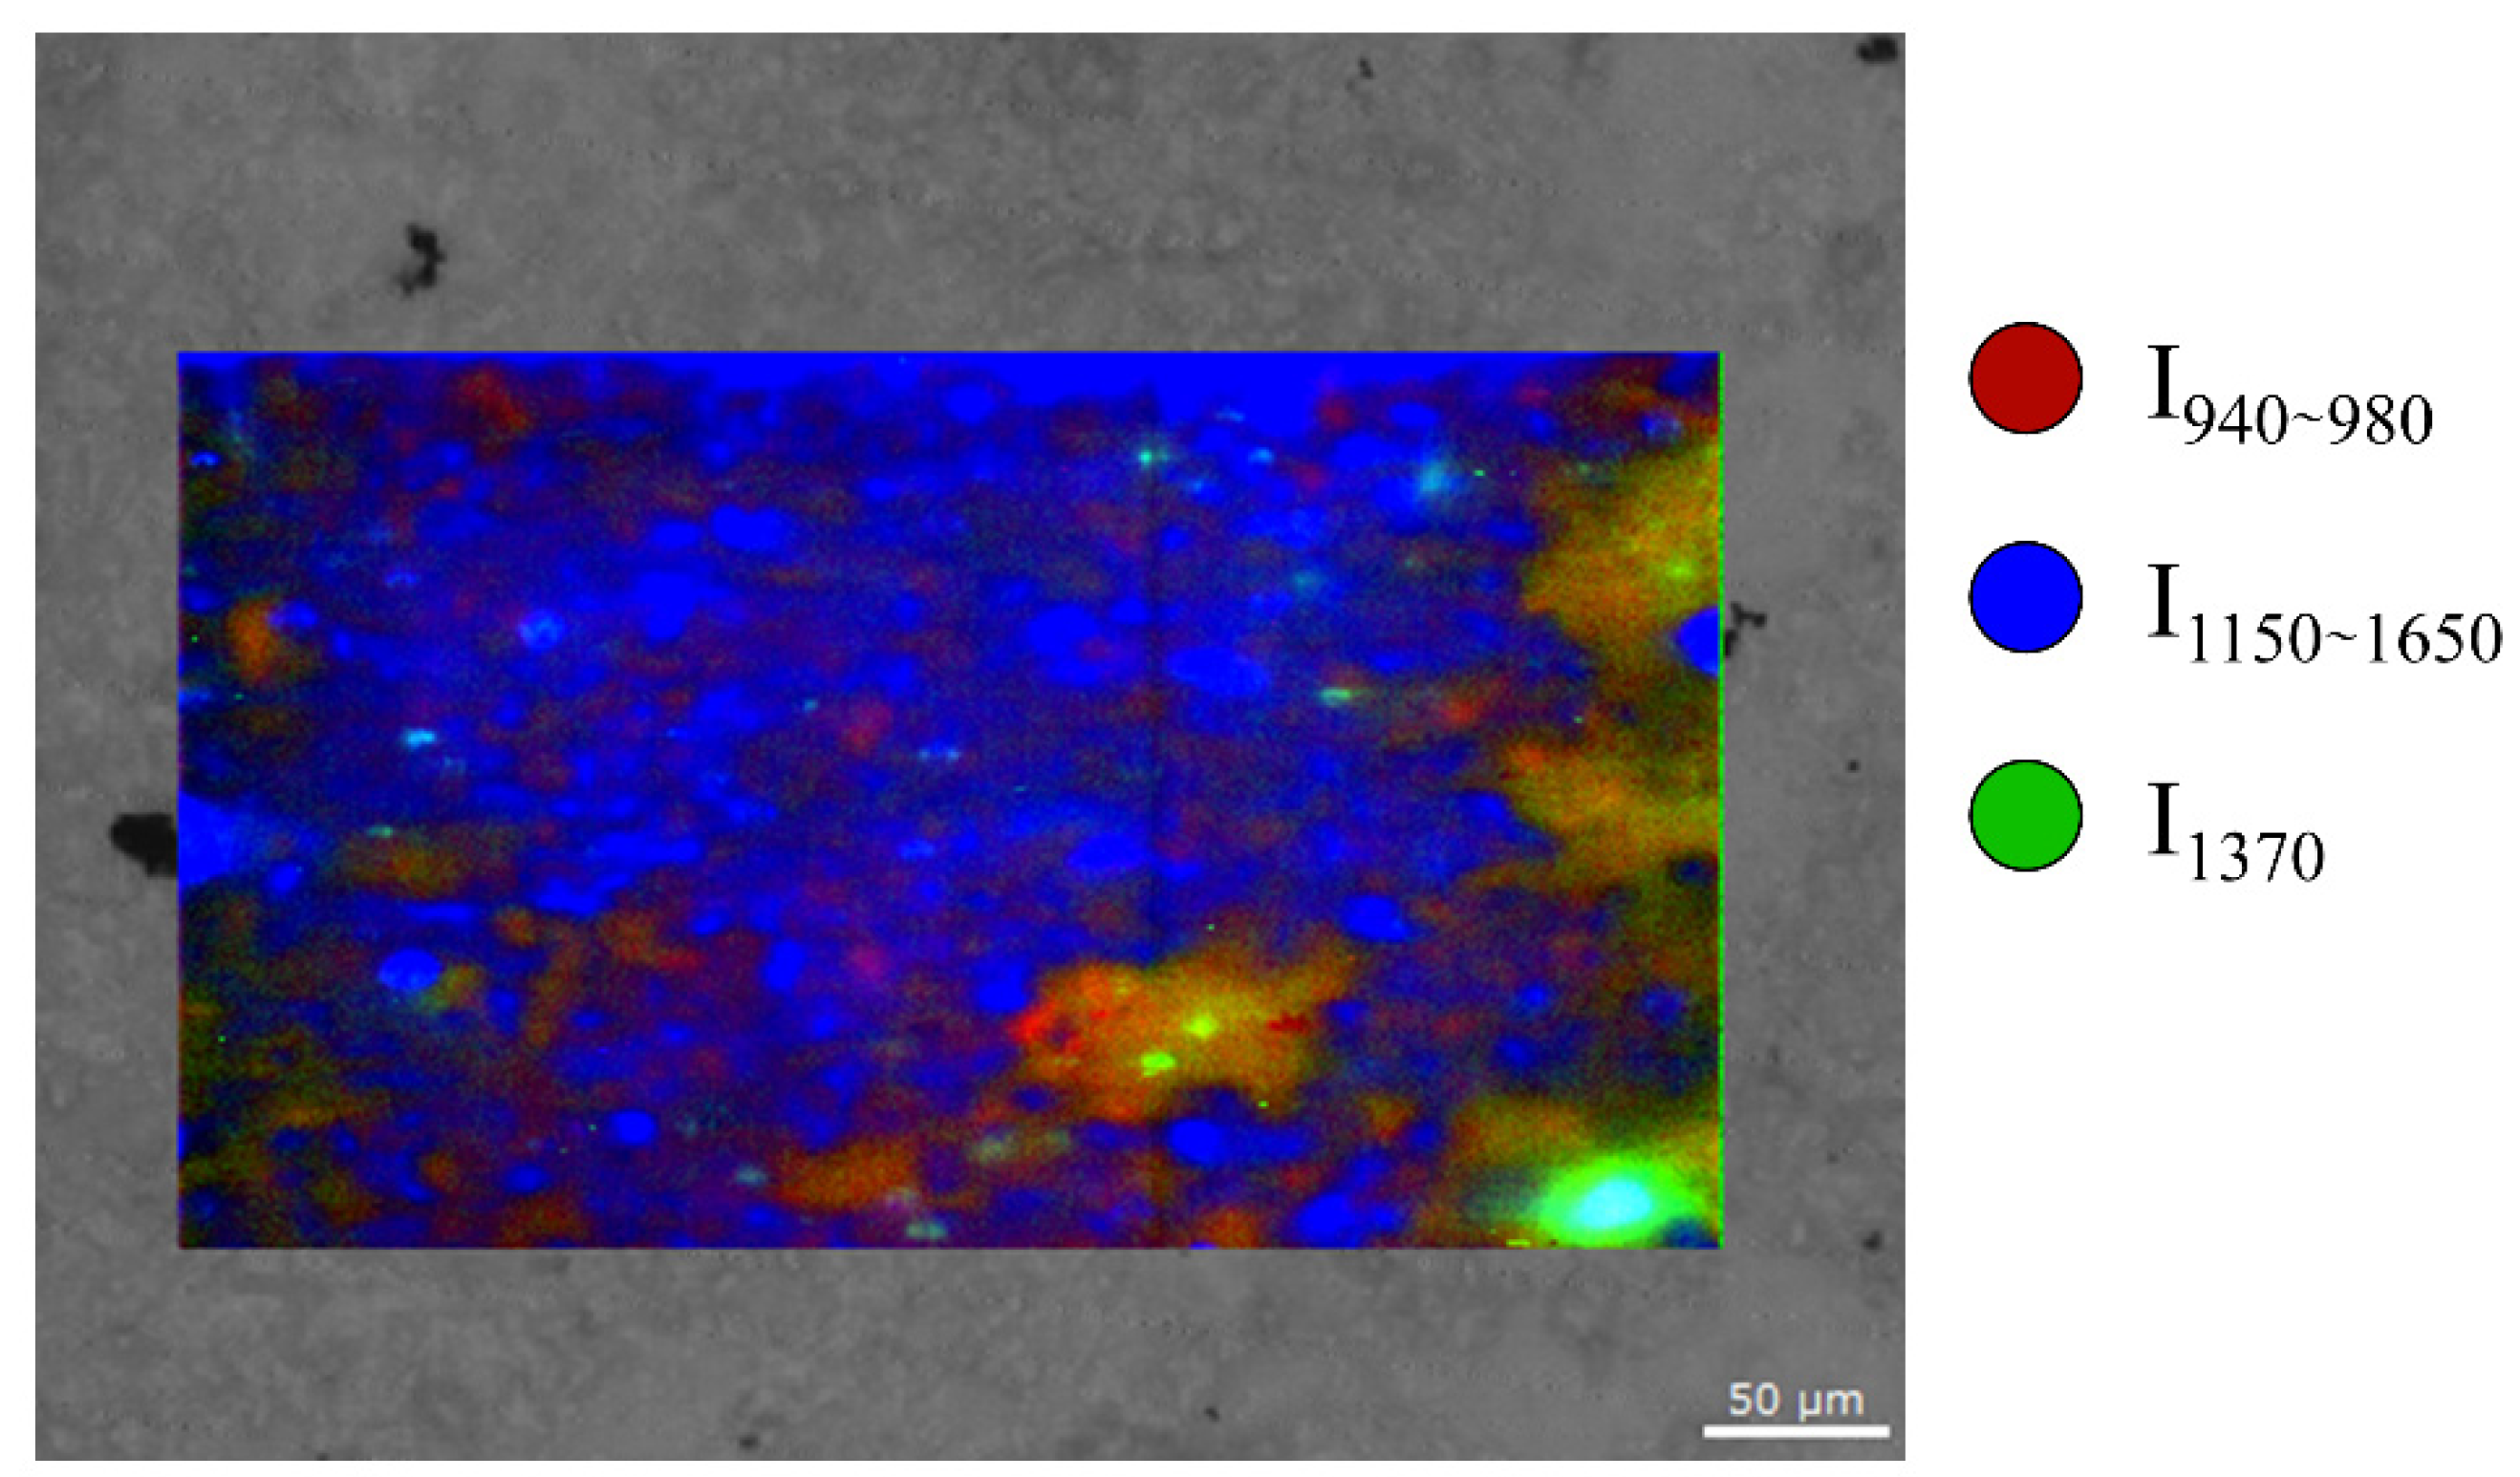
Figure 9 shows the Raman imaging map acquired on the octacalcium phosphate substrate in presence of both RANKL and bisphosphonates. The blue color, associated with the presence of amides, marks the locations of not differentiated RAW cells. Green, associated with the intensity of the band located at 1370 cm−1, marks the location of the differentiated osteoclasts. Red marks the presence of the octacalcium phosphate substrate by showing the distribution of the intensity of the band at about 960 cm−1 due to PO43− vibrations.
It can be observed that green areas are always overlapping to blue (due to the presence of amides in both differentiated and not differentiated cells), but blue areas cover most of the surface. This result suggests that most of the RAW cells were differentiated but with an uneven coverage of the substrate.
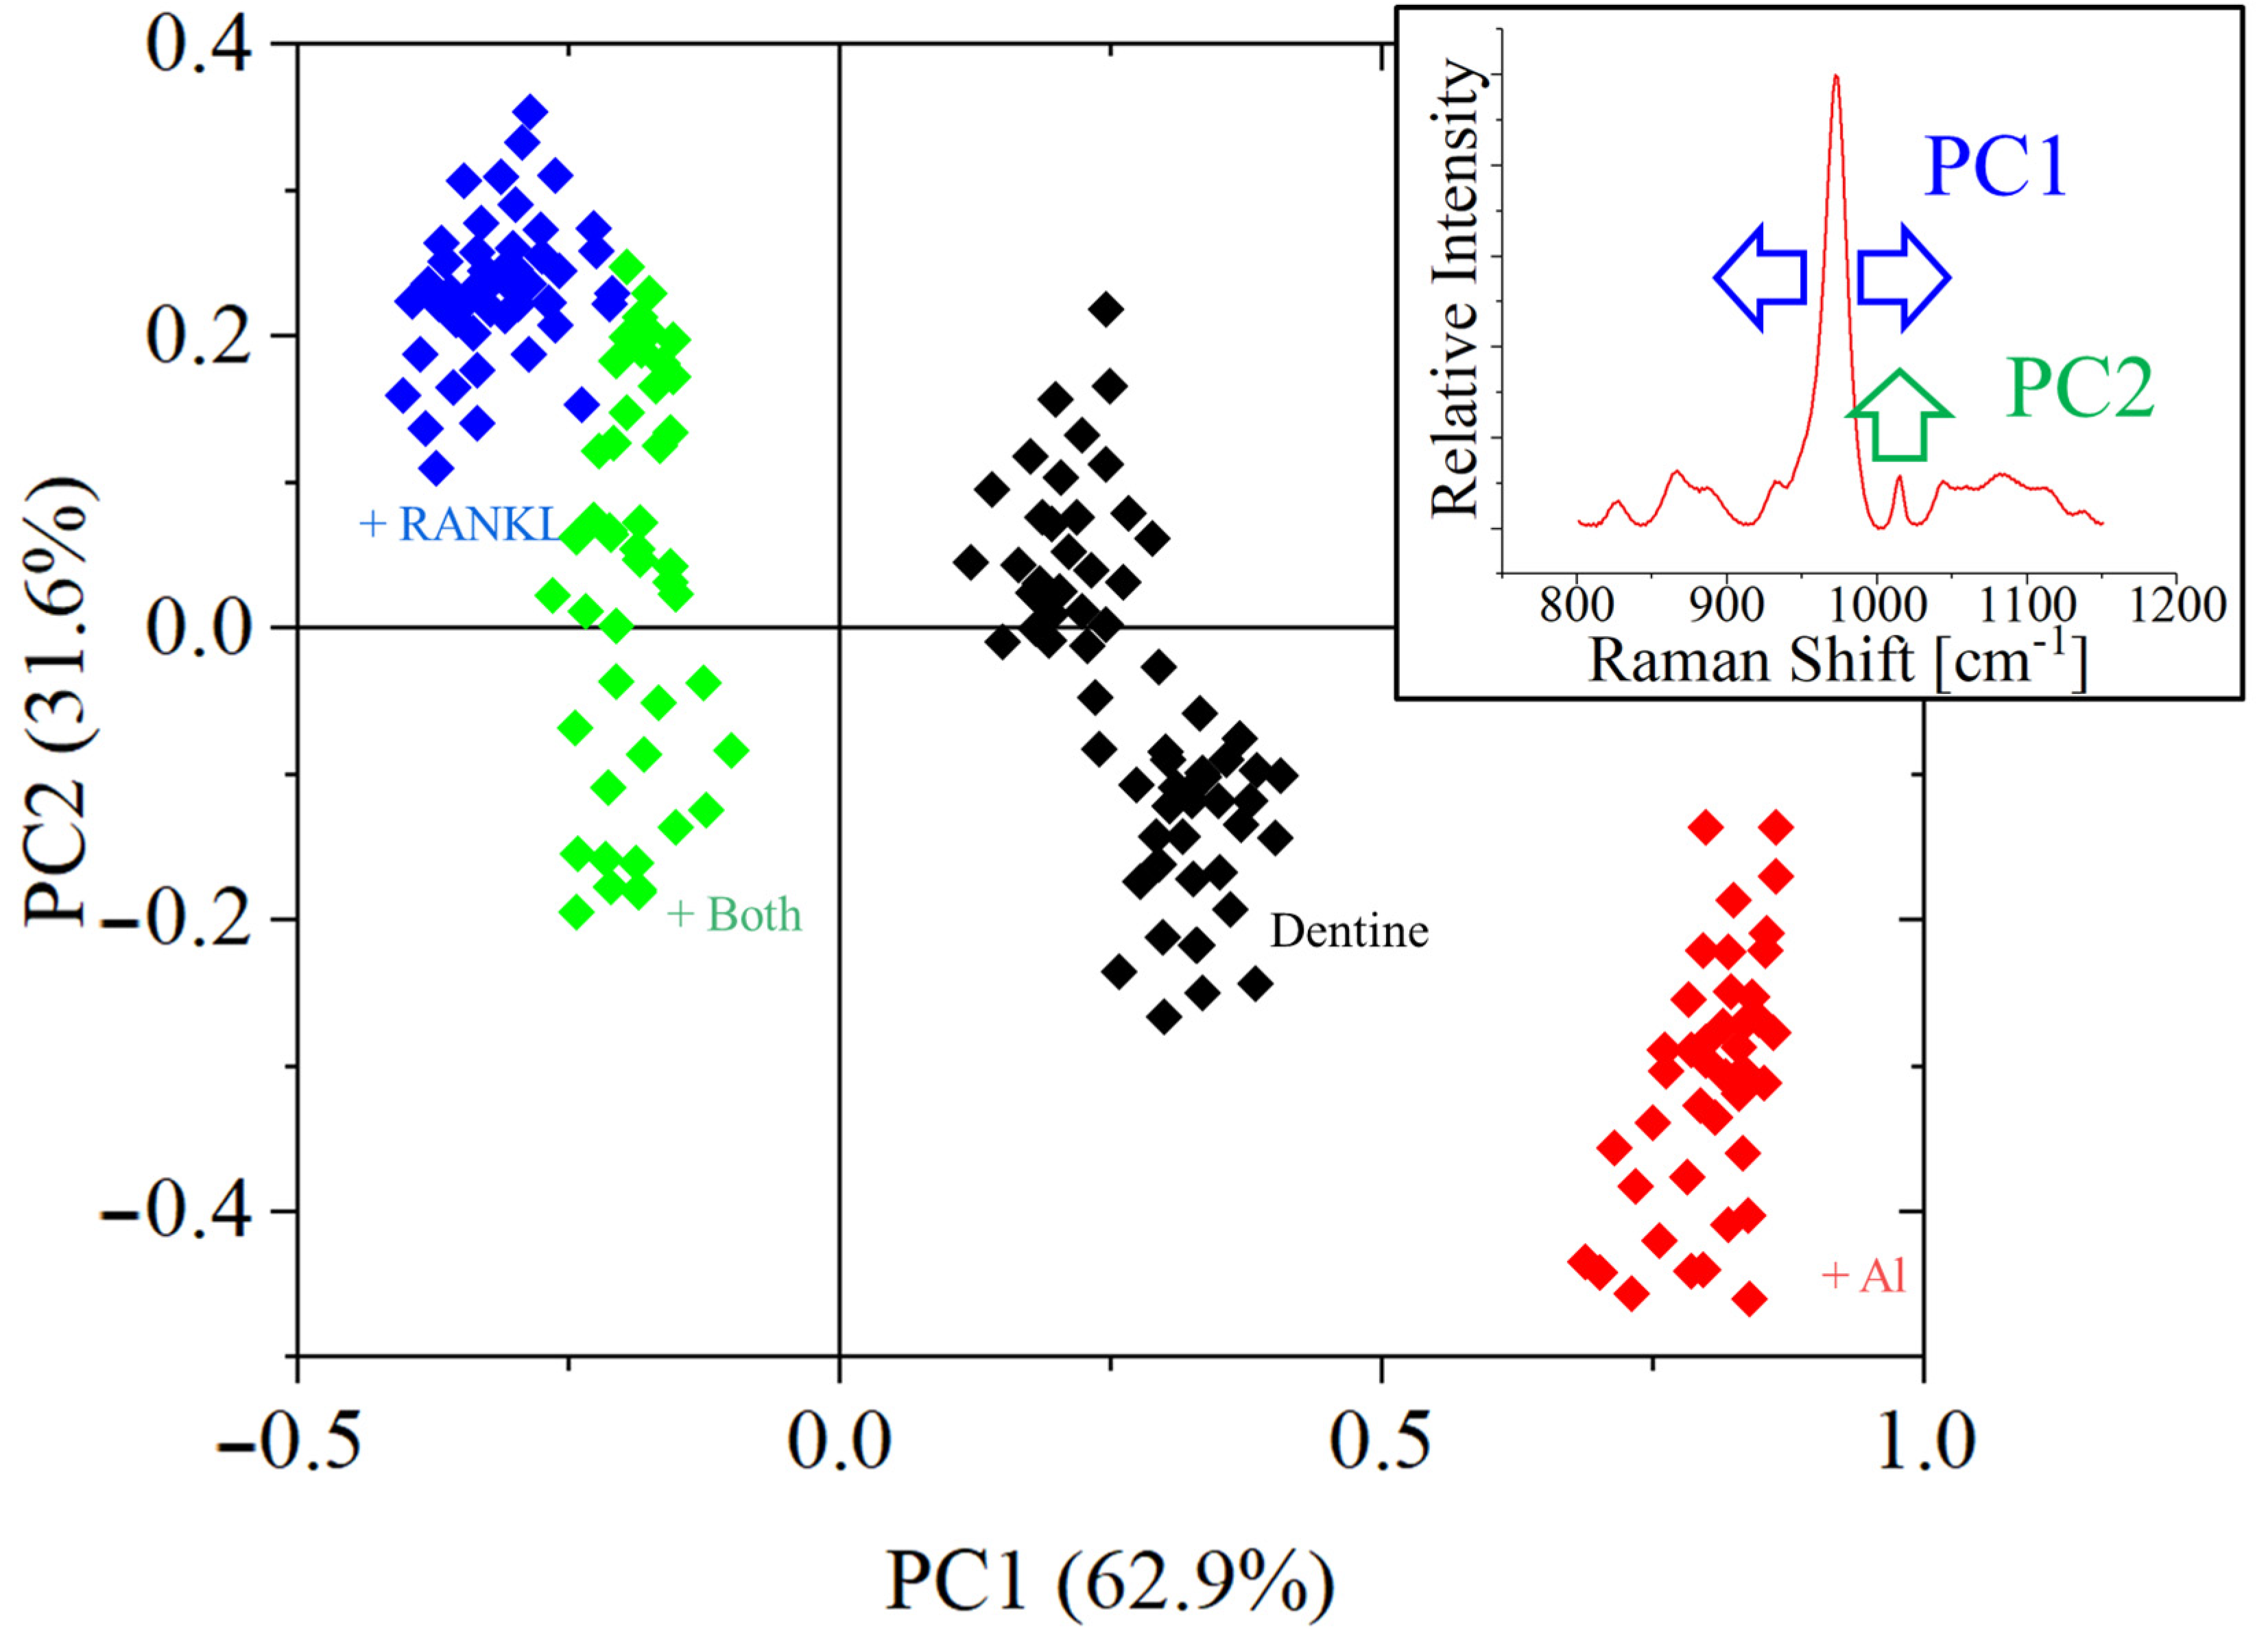
Raman imaging results were limited by the low signal-to-noise ratio and by the overlapping between signals originating from different molecular species. Principal component analysis was applied to the imaging after dividing them into 100 subregions. Results for dentine substrates, in the spectral region around 1000 cm−1, are shown in Figure 10.
Figure 10 shows the principal component analysis for the dentine samples in the apatite region. The first two principal components that were identified by the software resulted to be due to the full-width half-maximum (FWHM) of the octacalcium phosphate band located at about 960 cm−1 and due to the presence of the phenylalanine band at about 1004 cm−1. It can be observed that, in the presence of osteoclastic activity, the width of the band reduces, reaching the minimum value for the samples exposed only to RANKL. This is due to the preferential osteoclastic erosion of the most defective apatite crystals, which exposes underlying material with higher degrees of crystallinity, which takes a longer time to be remodeled by osteoblasts [33].
The band width is the maximum for the samples exposed to bisphosphonates, and both the control and the samples exposed to both RANKL and bisphosphonate have an intermediate behavior, with a larger distribution on the PC1 axis. For PC2, as the remodeling proceeds, higher amounts of collagen tissues are exposed to the Raman probe, resulting in a higher intensity of the 1004 cm−1 band. It is worth noticing that both the control and the sample exposed to RANKL and bisphosphonates appear to have a preferentially bi-modal scattering distribution on the PC2 axis.
Figure 11 shows the results obtained on the same spectral region for the octacalcium phosphate substrates. While the width of the phosphate band seems to follow a similar trend for PC1, the distribution is more scattered due to the presence of two different phases which are eroded at different rates but have similar vibration profiles for PO43− around 960 cm−1. For the phenylalanine band at about 1004 cm−1, as the only source for this signal is the cells (either undifferentiated RAW-264.7 or osteoclasts) on the surface of the samples, as there is no collagen in the octacalcium phosphate samples, the intensity of the band is scattered, and the contribution of the PC2 is limited to just 4.6%, making the variations in PC1 (crystallinity) the predominant effect.
Figure 12 shows the results of the principal component analysis performed on the dentine substrates, in the spectral window for amides. The PC1 component is associated with the intensity of the amide III bands located at about 1250 cm−1 (δ(NH)) and 1280 cm−1 (α-helix), amide I bands at about 1615 cm−1 (C=C) and 1660 cm−1 (C=O), as well as δ(CH)-specific vibrations, located at about 1460 cm−1 and 1320 cm−1. Meanwhile, PC2 is related to the osteoclast differentiation fingerprint band located at about 1375 cm−1. Due to the presence of amides for both the substrate and the cells, the contribution of PC1 is somehow limited, and the scattering is high in both PCs. In the case of PC2, in particular, the signal produced by the substrate is intense enough to cover most of the band, making the results less reliable.
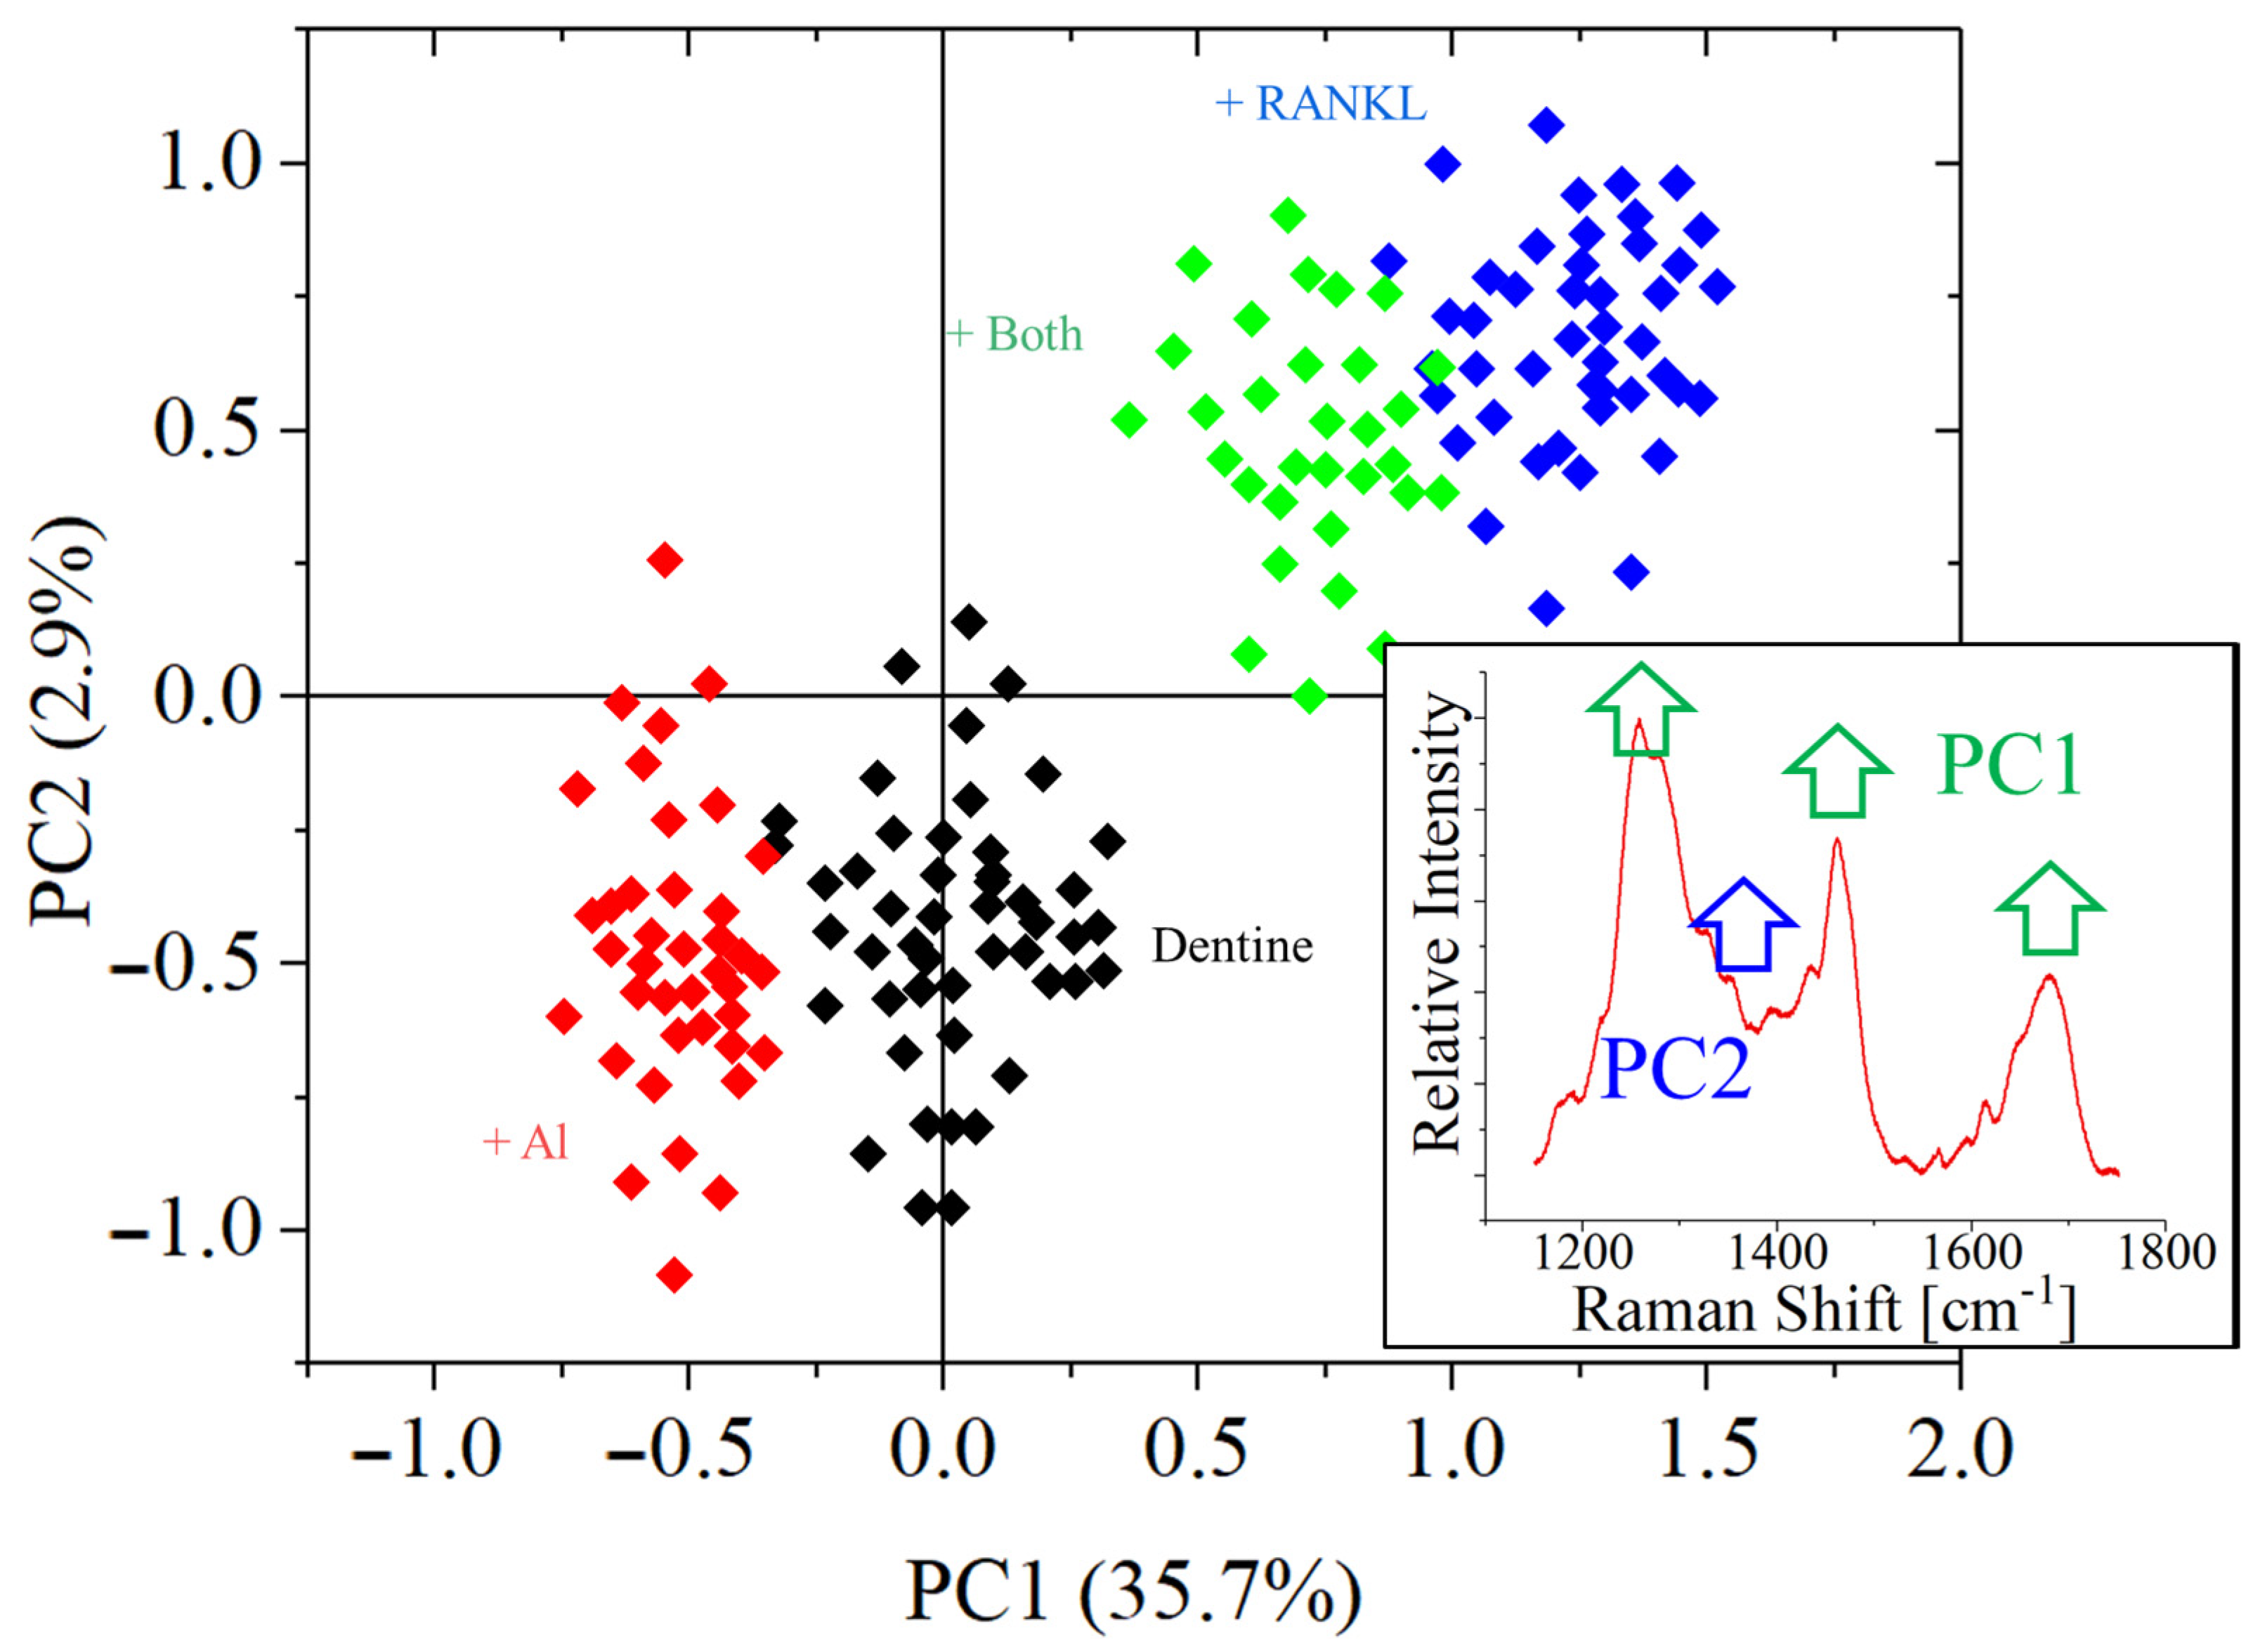
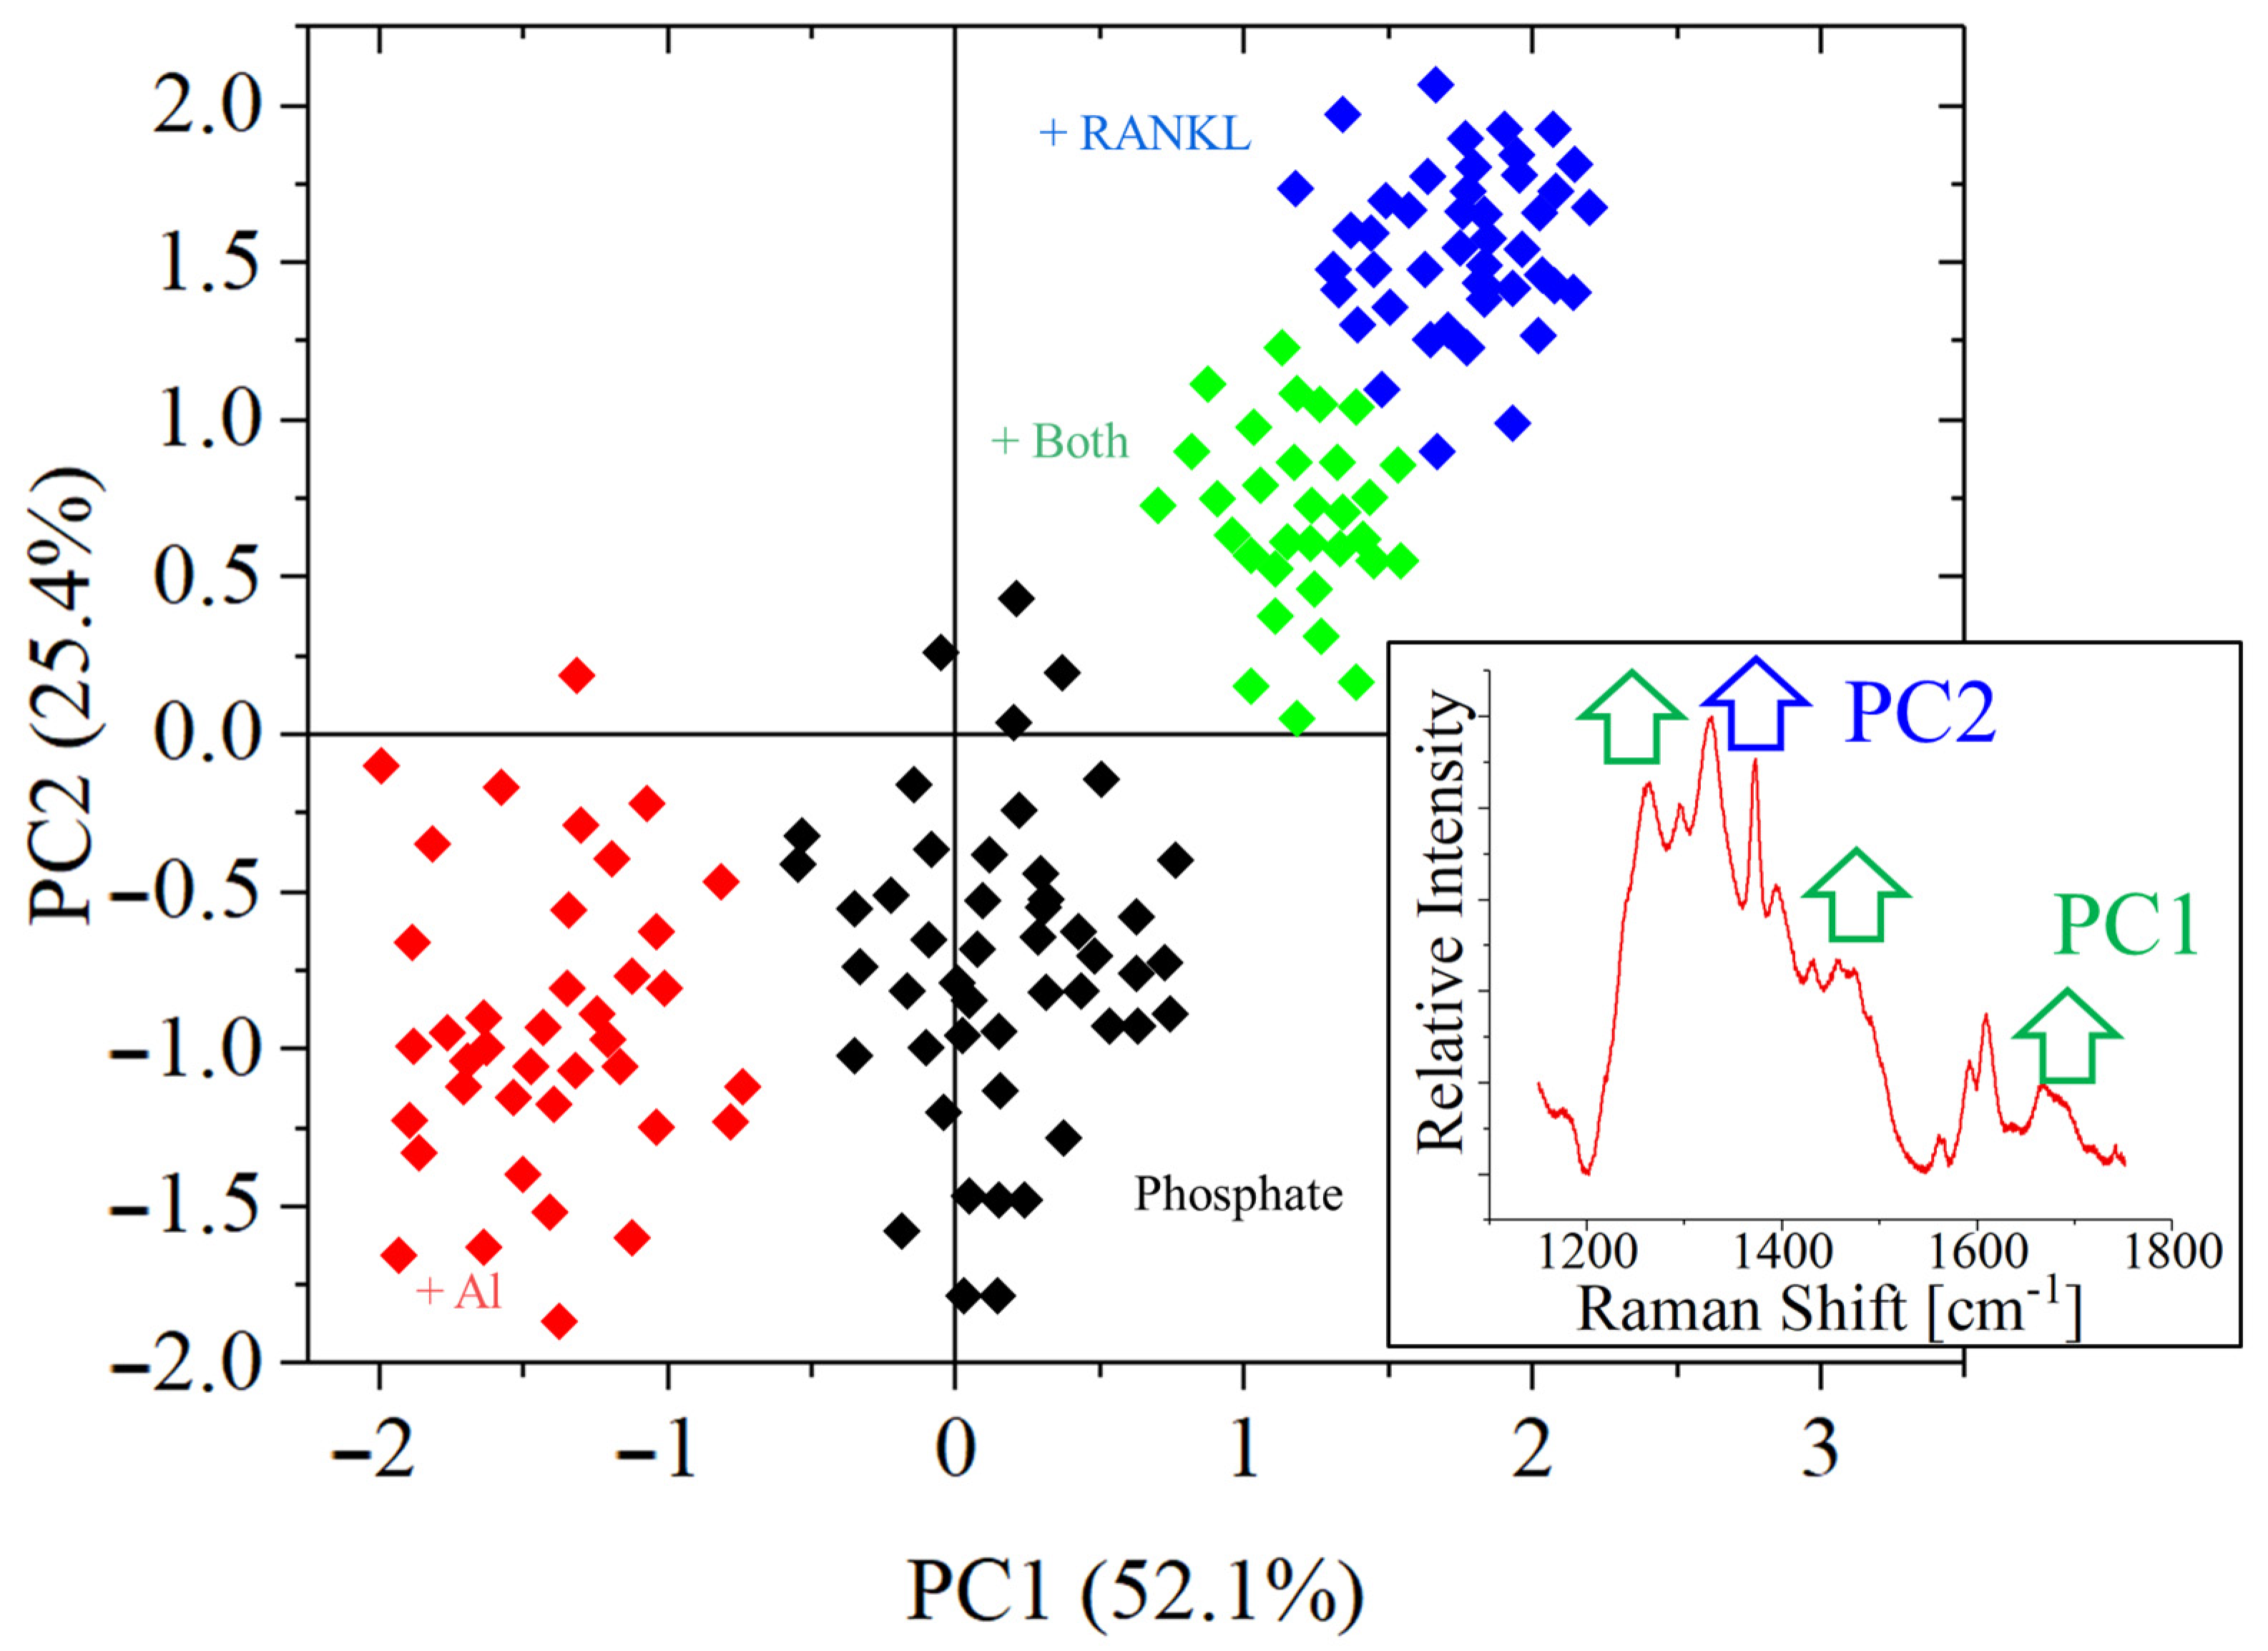
Figure 13 shows the results of the PCA analysis in the amide region of the octacalcium phosphate samples. Unlike the dentine substrates, in octacalcium phosphate, the only contribution for the amides is due to the presence of the osteoclasts. For this reason, the intensity of the PC2 band associated with differentiated cells is higher and the band itself is clearly observable on the spectra. The PC1 results on the intensity of the amide bands suggest that the osteoclasts have grown more on samples containing RANKL when compared with samples containing bisphosphonates and the control. This is in line with the size of the osteoclast cells, which are often referred to as “giant cells”. PC2 confirms that the same trend is followed for the differentiation.

4. Discussion

In this study, we explored the spectroscopic fingerprints of osteoclastic differentiation and activity in presence of RANKL and bisphosphonates.
Results from microscopic investigations indicated that remodeling have happened on five of the eight different substrates, while only four of the eight samples showed signs of osteoclastic differentiation by TRAP (Figure 2) and by the presence of the Raman fingerprint band at about 1375 cm−1 (Figure 8).
The limited remodeling observed on the dentine and octacalcium phosphate controls can be associated with the action of the macrophage RAW-264.7 cells [34]. In vivo, this specific remodeling action is usually associated with bone tissue inflammation [35]. It has been previously suggested that macrophages can in particular degrade the organic bone matrix [34], which would explain why the octacalcium phosphate controls did not show clear signs of remodeling.
Bone remodeling caused by macrophages can also be a result of various foreign body reactions [36], even if the in vitro simplified culture environment does not reflect the complexity of a real in vivo situation [37].
The remarkable difference between the Raman spectra of Figure 8b and Figure 8d constitutes a spectroscopic clue for cellular differentiation: when the spectra are dominated by the relatively strong amides signals from the substrate (dentine), spectroscopic differences between the four substrates are limited to the intensity of the signal. This suggests that RANKL and bi-phosphonate do not affect the substrates directly. Clear differences rise when the octacalcium phosphate substrates are exposed to RANKL: new bands appear at various Raman shifts, in particular an intense and sharp band at about 1375 cm−1.
As the Raman signals in these regions for octacalcium phosphates substrates are generated only by the cells on their surface, we can label these intense bands as spectroscopic fingerprints for cellular differentiation into osteoclasts.
Various biomolecules would feature bands at similar Raman shifts, but between them, thymine and thymidine are the most consistent. Thanks to their double-ring structure [38], all purines have a relatively strong Raman intensity. Nevertheless, the signal rising at about 1375 cm−1 is a specific marker for thymine, thymidine and their complexes [39,40], associated with the δCH3 vibrational mode [41]. Between all the possible complexes, thymidine phosphorylase is associated with the production and proliferation of osteoclasts in in vitro models [42]. Previous authors suggested that thymidine phosphorylase induces the production of significant numbers of osteoclasts [43], and its relationship with RANKL has already been explored in the previous literature [44]: when osteoclasts resorb bone matrix, thymidine phosphorylase is released [45].

5. Conclusions

In this research, we were able to correlate the presence of bone remodeling on dentine and octacalcium phosphate substrates to the differentiation of osteoclasts from progenitor RAW-264.7 cells.
We also observed that the differentiation induced by RANKL is impaired but not inhibited by the addition of 2 ng/mL of alendronate.
Furthermore, we could find a spectroscopic fingerprint for osteoclastic differentiation in the form of a specific thymidine-related intense band located at about 1375 cm−1. The band was expressed in presence of RANKL-differentiated osteoclasts, but absent for both bi-phosphonate-inhibited RAW-264.7 and control RAW-264.7 cells.
When analyzed with the support of PCA, three main spectroscopic markers emerged, as follows:
-
The width of the phosphate band at about 960 cm−1 reduces due to osteoclast bone remodeling;
-
The relative intensity of the amide bands increases due to bone remodeling, for dentine substrates;
-
The bands related to thymidine phosphorylase appeared after differentiation on both substrates.

Author Contributions

Conceptualization, T.A. and G.P.; methodology, T.A.; software, E.M.; validation, W.Z., N.K. and T.Y.; formal analysis, E.M.; investigation, T.A., F.B. and K.A.; resources, T.A., T.Y., N.K. and K.A.; data curation, E.M.; writing—original draft preparation, E.M.; writing—review and editing, G.P. and F.B.; supervision, G.P., T.Y. and N.K.; project administration, E.M. and K.A.; funding acquisition, E.M. and K.A. All authors have read and agreed to the published version of the manuscript.

Funding

This research was funded by JSPS KAKENHI, grant number 18K17175 and 17H07017.

Data Availability Statement

Data available on request.

Conflicts of Interest

The authors declare no conflict of interest.

References

  1. Silva, I.; Branco, J.C. Rank/Rankl/opg: Literature review. Acta Reumatol. Port. 2011, 36, 209–218. [Google Scholar] [PubMed]
  2. Boyce, B.F.; Xing, L. Functions of RANKL/RANK/OPG in bone modeling and remodeling. Arch. Biochem. Biophys. 2008, 473, 139–146. [Google Scholar] [CrossRef] [PubMed] [Green Version]
  3. Jabbar, S.; Drury, J.; Fordham, J.N.; Datta, H.K.; Francis, R.M.; Tuck, S.P. Osteoprotegerin, RANKL and bone turnover in postmenopausal osteoporosis. J. Clin. Pathol. 2011, 64, 354–357. [Google Scholar] [CrossRef] [PubMed]
  4. Fukagawa, M.; Kurokawa, K. Renal osteodystrophy and secondary hyperparathyroidism. Clin. Calcium. 2002, 12, 707–710. [Google Scholar] [CrossRef] [Green Version]
  5. Geusens, P.P.; Landewé, R.B.M.; Garnero, P.; Chen, D.; Dunstan, C.R.; Lems, W.F.; Stinissen, P.; ven der Heijde, D.M.F.M.; van der Linder, S.; Boers, M. The ratio of circulating osteoprotegerin to RANKL in early rheumatoid arthritis predicts later joint destruction. Arthritis Rheum. 2006, 54, 1772–1777. [Google Scholar] [CrossRef]
  6. Bargman, R.; Posham, R.; Boskey, A.; Carter, E.; Dicarlo, E.; Verdelis, K.; Raggio, C.; Pleshko, N. High-and low-dose oPg-Fc cause osteopetrosis-like changes in infant mice. Pediatric Res. 2012, 72, 495–501. [Google Scholar] [CrossRef] [Green Version]
  7. Jones, D.H.; Nakashima, T.; Sanchez, O.H.; Kozieradzki, I.; Komarova, S.V.; Sarosi, I.; Morony, S.; Rubin, E.; Sarao, R.; Hojilla, C.V.; et al. Regulation of cancer cell migration and bone metastasis by RANKL. Nature 2006, 440, 692–696. [Google Scholar] [CrossRef] [Green Version]
  8. Chen, G.; Sircar, K.; Aprikian, A.; Potti, A.; Goltzman, D.; Rabbani, S.A. Expression of RANKL/RANK/OPG in primary and metastatic human prostate cancer as markers of disease stage and functional regulation. Cancer 2006, 107, 289–298. [Google Scholar] [CrossRef]
  9. Lipton, A.; Jun, S. RANKL inhibition in the treatment of bone metastases. Curr. Opin. Support. Palliat. Care 2008, 2, 197–203. [Google Scholar] [CrossRef]
  10. Russell, R.G.G. Bisphosphonates: The first 40 years. Bone 2011, 49, 2–19. [Google Scholar] [CrossRef]
  11. Fleisch, H. Bisphosphonates--history and experimental basis. Bone 1987, 8 (Suppl. S1), S23–S28. [Google Scholar] [PubMed]
  12. Ebetino, F.H.; Hogan, A.-M.L.; Sun, S.; Tsoumpra, M.K.; Duan, X.; Triffitt, J.T.; Kwaasi, A.A.; Dunford, J.E.; Barnett, B.L.; Oppermann, U.; et al. The relationship between the chemistry and biological activity of the bisphosphonates. Bone 2011, 49, 20–33. [Google Scholar] [CrossRef] [PubMed]
  13. Fleisch, H.; Reszka, A.; Rodan, G.; Rogers, M. Bisphosphonates: Mechanisms of Action. In Principles of Bone Biology, 2nd ed.; Bilezikian, J.P., Raisz, L.G., Rodan, G.A., Eds.; Academic Press: San Diego, CA, USA, 2002; Chapter 78; p. 1361-XLIII. [Google Scholar]
  14. Lin, T.-J. Using Molecular Dynamics to Model the Binding Affinities of Nitrogen-Containing Bisphosphonates on Hydroxyapatite Surface. arXiv 2018, arXiv:1810.13268. [Google Scholar]
  15. Baron, R. Molecular mechanisms of bone resorption by the osteoclast. Anat. Rec. 1989, 224, 317–324. [Google Scholar] [CrossRef] [PubMed]
  16. Sato, M.; Grasser, W. Effects of bisphosphonates on isolated rat osteoclasts as examined by reflected light microscopy. J. Bone Miner. Res. 1990, 5, 31–40. [Google Scholar] [CrossRef]
  17. Hughes, D.E.; Wright, K.R.; Uy, H.L.; Sasaki, A.; Yoneda, T.; Roodman, G.D.; Mundy, G.R.; Boyce, B.F. Bisphosphonates promote apoptosis in murine osteoclasts in vitro and in vivo. J. Bone Miner. Res. 1995, 10, 1478–1487. [Google Scholar] [CrossRef]
  18. McClung, M.; Harris, S.T.; Miller, P.D.; Bauer, D.C.; Davison, K.S.; Dian, L.; Hanley, D.A.; Kandler, D.L.; Yuen, C.K.; Lewiecki, E.M. Bisphosphonate therapy for osteoporosis: Benefits, risks, and drug holiday. Am. J. Med. 2013, 126, 13–20. [Google Scholar] [CrossRef]
  19. Molvik, H.; Khan, W. Bisphosphonates and their influence on fracture healing: A systematic review. Osteoporos. Int. 2015, 26, 1251–1260. [Google Scholar] [CrossRef]
  20. Singh, T.; Kaur, V.; Kumar, M.; Kaur, P.; Murthy, R.S.R.; Rawal, R.K. The critical role of bisphosphonates to target bone cancer metastasis: An overview. J. Drug Target. 2015, 23, 1–15. [Google Scholar] [CrossRef]
  21. Clézardin, P. Insights into the antitumor effects of bisphosphonates from preclinical models and potential clinical implications. IBMS BoneKEy 2009, 6, 210–217. [Google Scholar] [CrossRef]
  22. Hanlie, H.; Liyun, T.; Tao, J. The crystal characteristics of enamel and dentin by XRD method. J. Wuhan Univ. Technol. (Mater. Sci. Ed.) 2006, 21, 9–12. [Google Scholar] [CrossRef]
  23. Tavares D dos, S.; Castro L de, O.; Soares GD de, A.; Alves, G.G.; Granjeiro, J.M. Synthesis and cytotoxicity evaluation of granular magnesium substituted β-tricalcium phosphate. J. Appl. Oral. Sci. 2013, 21, 37–42. [Google Scholar] [CrossRef] [PubMed] [Green Version]
  24. Arsad, M.S.M.; Lee, P.M.; Hung, L.K. Synthesis and Characterization of Hydroxyapatite Nanoparticles and β-TCP Particles. In 2011 2nd International Conference on Biotechnology and Food Science; IACSIT Press: Singapore, 2011. [Google Scholar]
  25. Kekkonen, J.; Finnilä, M.A.J.; Heikkilä, J.; Anttonen, V.; Nissinen, I. Chemical imaging of human teeth by a time-resolved Raman spectrometer based on a CMOS single-photon avalanche diode line sensor. Analyst 2019, 144, 6089–6097. [Google Scholar] [CrossRef] [PubMed] [Green Version]
  26. Mizuno, A.; Ozaki, Y.; Itoh, K.; Matsushima, S.; Iriyama, K. Raman spectroscopic evidence for the microenvironmental change of some tyrosine residues of lens proteins in cold cataract. Biochem. Biophys. Res. Commun. 1984, 119, 989–994. [Google Scholar] [CrossRef]
  27. Farlay, D.; Panczer, G.; Rey, C.; Delmas, P.D.; Boivin, G. Mineral maturity and crystallinity index are distinct characteristics of bone mineral. J. Bone Miner. Metab. 2010, 28, 433–445. [Google Scholar] [CrossRef] [Green Version]
  28. Rivas-Arancibia, S.; Rodríguez-Martínez, E.; Badillo-Ramírez, I.; López-González, U.; Saniger, J.M. Structural changes of amyloid beta in hippocampus of rats exposed to ozone: A Raman spectroscopy study. Front Mol. Neurosci. 2017, 10, 137. [Google Scholar] [CrossRef]
  29. Jung, G.B.; Kang, I.S.; Lee, Y.J.; Kim, D.; Park, H.K.; Lee, G.J.; Kim, C. Label-free Noninvasive Characterization of Osteoclast Differentiation Using Raman Spectroscopy Coupled with Multivariate Analysis. Curr. Opt. Photon. 2017, 1, 412–420. [Google Scholar]
  30. Rosiek, E. Metabolic Characterization of Cellular Health Using a Multimodal Spectroscopy Technique [Internet]. 2019. Available online: https://deepblue.lib.umich.edu/handle/2027.42/148875 (accessed on 30 March 2022).
  31. Michalowska, M.; Znorko, B.; Kaminski, T.; Oksztulska-Kolanek, E.; Pawlak, D. New insights into tryptophan and its metabolites in the regulation of bone metabolism. J. Physiol. Pharmacol. 2015, 66, 779–791. [Google Scholar]
  32. Otto, C.; van den Tweel, T.J.J.; de Mul, F.F.M.; Greve, J. Surface-enhanced Raman spectroscopy of DNA bases. J. Raman Spectrosc. 1986, 17, 289–298. [Google Scholar] [CrossRef] [Green Version]
  33. Uskoković, V.; Janković-Častvan, I.; Wu, V.M. Bone mineral crystallinity governs the orchestration of ossification and resorption during bone remodeling. ACS Biomater. Sci. Eng. 2019, 5, 3483–3498. [Google Scholar] [CrossRef]
  34. Lassus, J.; Salo, J.; Jiranek, W.A.; Santavirta, S.; Nevalainen, J.; Matucci-Cerinic, M.; Horák, P.; Konttinen, Y. Macrophage activation results in bone resorption. Clin. Orthop. Relat. Res. 1998, 352, 7–15. [Google Scholar] [CrossRef]
  35. Gu, Q.; Yang, H.; Shi, Q. Macrophages and bone inflammation. J. Orthop. Translat. 2017, 10, 86–93. [Google Scholar] [CrossRef] [PubMed]
  36. Zambuzzi, W.F.; Oliveira RC de Pereira, F.L.; Cestari, T.M.; Taga, R.; Granjeiro, J.M. Rat subcutaneous tissue response to macrogranular porous anorganic bovine bone graft. Braz. Dent. J. 2006, 17, 274–278. [Google Scholar] [CrossRef] [PubMed] [Green Version]
  37. Sheikh, Z.; Brooks, P.J.; Barzilay, O.; Fine, N.; Glogauer, M. Macrophages, foreign body giant cells and their response to implantable biomaterials. Materials 2015, 8, 5671–5701. [Google Scholar] [CrossRef] [PubMed] [Green Version]
  38. Snyder, S. Adenosine as a Neuromodulator. Annu. Rev. Neurosci. 1985, 8, 103–124. [Google Scholar] [CrossRef] [PubMed]
  39. Mathlouthi, M.; Seuvre, A.-M.; Koenig, J.L. FT-IR and laser-Raman spectra of thymine and thymidine. Carbohydr. Res. 1984, 134, 23–38. [Google Scholar] [CrossRef]
  40. Liu, R.; Zhang, D.; Cai, C.; Xiong, Y.; Li, S.; Su, Y.; Si, M. NIR-SERS studies of DNA and DNA bases attached on polyvinyl alcohol (PVA) protected silver grass-like nanostructures. Vib. Spectrosc. 2013, 67, 71–79. [Google Scholar] [CrossRef]
  41. Tripon, C.; Muntean, C.M.; Bratu, I.; Nalpantidis, K.; Deckert, V. (Sub)picosecond processes in DNA and RNA constituents: A Raman spectroscopic assessment. Polym. Bull 2017, 74, 4087–4100. [Google Scholar] [CrossRef]
  42. Matsumae, G.; Shimizu, T.; Tian, Y.; Takahashi, D.; Ebata, T.; Alhasan, H.; Yokota, S.; Kadoya, K.; Terkawi, M.A.; Iwasaki, N. Identification of thymidine phosphorylase as a potential therapeutic target for bone loss associated periprosthetic osteolysis. SSRN Electron J. 2021. [Google Scholar] [CrossRef]
  43. Matsumae, G.; Shimizu, T.; Tian, Y.; Takahashi, D.; Ebata, T.; Alhasan, H.; Yokota, S.; Kadoya, K.; Terkawi, M.A.; Iwasaki, N. Targeting thymidine phosphorylase as a potential therapy for bone loss associated with periprosthetic osteolysis. Bioeng. Transl. Med. 2021, 6, e10232. [Google Scholar] [CrossRef]
  44. Liu, H.; Liu, Z.; Du, J.; He, J.; Lin, P.; Amini, B.; Starbuck, M.W.; Novane, N.; Shah, J.J.; Davis, R.E.; et al. Thymidine phosphorylase exerts complex effects on bone resorption and formation in myeloma. Sci. Transl. Med. 2016, 8, 353ra113. [Google Scholar] [CrossRef] [PubMed] [Green Version]
  45. Salduz, A.; Eralp, L. The local management of bone metastases. In Breast Disease; Springer International Publishing: Cham, Switzerland, 2019; pp. 619–633. [Google Scholar]
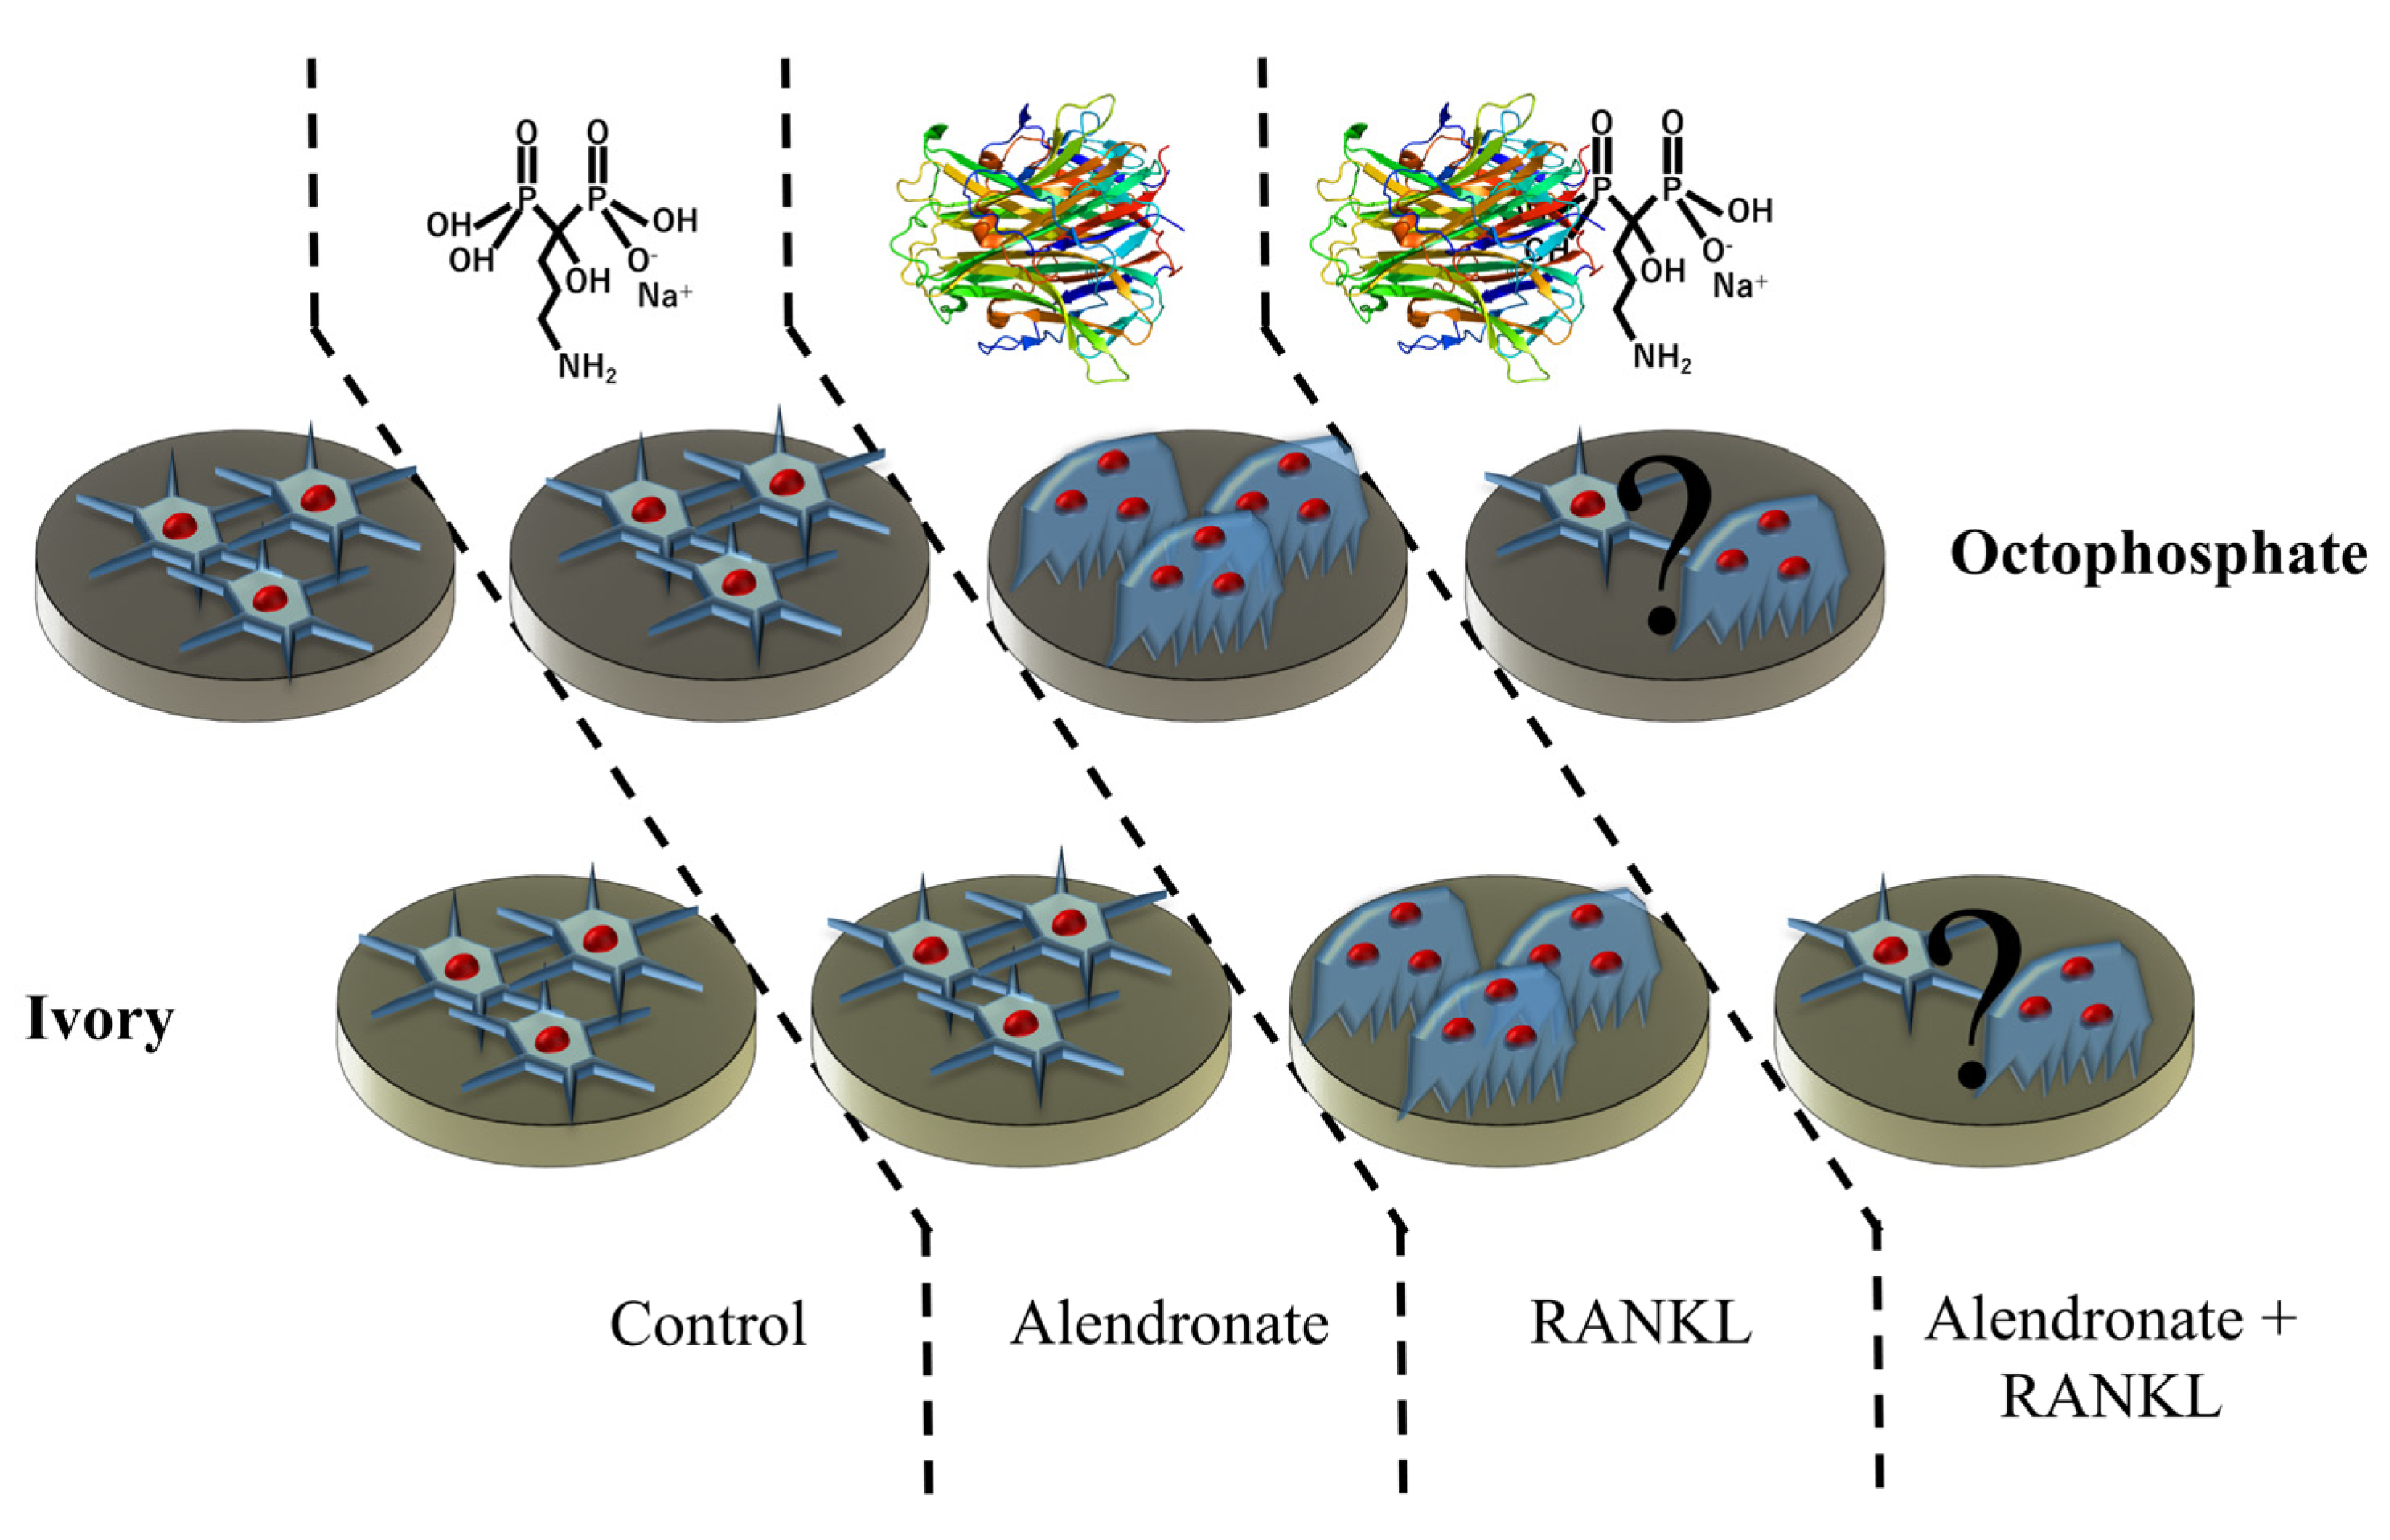
Figure 1. Experimental setting showing the different substrates and treatments.
Applsci 12 03757 g001
Figure 2. TRAP staining results on the different samples, as observed by optical microscopy. Color contrast has been digitally enhanced using ImageJ software: (a) macro images of representative samples for the eight sample groups; (b) optical microscope of cells differentiated by RANKL; (c) optical microscope of cells from a control dentine sample without RANKL. Both (b,c) show cells collected from samples and deposited on glass substrate for optical analysis.
Applsci 12 03757 g002
Figure 3. Low-magnification laser microscopy images of the surface of the samples. (a) dentine control, (b) dentine with bisphosphonate, (c) dentine with RANKL, (d) dentine with both phosphonate and RANKL, (e) octalcium phosphate, (f) octalcium phosphate with bisphosphonate, (g) octacalcium phosphate with RANKL and (h) octacalcium phosphate with both bisphosphonate and RANKL.
Applsci 12 03757 g003
Figure 4. Images of the surface of the dentine substrates after in vitro testing. (a) dentine control, (b) dentine with bisphosphonate, (c) dentine with RANKL, (d) dentine with both phosphonate and RANKL.
Applsci 12 03757 g004
Figure 5. Images of the surface of the octacalcium phosphate substrates after in vitro testing. (a) octalcium phosphate, (b) octalcium phosphate with bisphosphonate, (c) octacalcium phosphate with RANKL and (d) octacalcium phosphate with both bisphosphonate and RANKL.
Applsci 12 03757 g005
Figure 6. X-ray diffraction patterns for the two different materials, at different conditions. (a) Dentine and (b) octacalcium phosphate. Peaks related to hydroxyapatite are marked in (a), while only the peaks related to octacalcium phosphate are marked in (b).
Applsci 12 03757 g006
Figure 7. Spectroscopic information extracted from the X-ray diffraction patterns of Figure 7: I004/I211 intensity ratio for (a) dentine and (b) octacalcium phosphate and (c) ITCP/IHA ratio for octacalcium phosphate. * indicate p < 0.05.
Applsci 12 03757 g007
Figure 8. Average Raman spectra collected on the surface of the samples. (a) Dentine hydroxyapatite region, (b) dentine amides region, (c) octacalcium phosphate hydroxyapatite region and (d) octacalcium phosphate amides region.
Applsci 12 03757 g008
Figure 9. Raman imaging of the octacalcium phosphate substrate exposed to both RANKL and bisphosphonates. The red color identifies the phosphate groups, blue identifies the amides (I, II and III) and green identifies the band at 1370 cm−1 associated with differentiated osteoclasts.
Applsci 12 03757 g009
Figure 10. PCA analysis for the hydroxyapatite region of the dentine samples, PC1 related to the bandwidth of the 960 cm−1 octacalcium phosphate vibration and PC2 related to the intensity of the phenylalanine band at about 1004 cm−1.
Applsci 12 03757 g010
Figure 11. PCA analysis for the hydroxyapatite region of the octacalcium phosphate samples, PC1 related to the bandwidth of the 960 cm−1 phosphate vibration and PC2 related to the intensity of the phenylalanine band at about 1004 cm−1.
Applsci 12 03757 g011
Figure 12. PCA analysis for the amide region of the dentine samples, PC1 related to the bandwidth of the 960 cm−1 phosphate vibration and PC2 related to the intensity of the phenylalanine band at about 1004 cm−1.
Applsci 12 03757 g012
Figure 13. PCA analysis for the amide region of the octacalcium phosphate samples, PC1 related to the bandwidth of the 960 cm−1 phosphate vibration and PC2 related to the intensity of the phenylalanine band at about 1004 cm−1.
Applsci 12 03757 g013
Publisher’s Note: MDPI stays neutral with regard to jurisdictional claims in published maps and institutional affiliations.