Article

Discomfort Glare Perception by Drivers—Establishing a Link between Subjective and Psychophysiological Assessment

Department of Psychology, Faculty of Arts, Palacký University Olomouc, Křížkovského 10, 771 80 Olomouc, Czech Republic
*
Author to whom correspondence should be addressed.
Appl. Sci. 2022, 12(8), 3847; https://doi.org/10.3390/app12083847
Submission received: 14 March 2022 / Revised: 6 April 2022 / Accepted: 9 April 2022 / Published: 11 April 2022
(This article belongs to the Section Transportation and Future Mobility)

Abstract

:

Featured Application

The experimental methodology described in this work can be used by car headlamp manufacturers for the assessment of acceptable levels of glare for drivers as part of user experience research when developing new car headlamps.

Abstract

The broad application of LEDs for automotive lighting purposes, together with new discoveries in vision physiology, is creating new challenges in the field of glare perception. The purpose of this study was to link subjective and objective measures of driver-perceived glare following different light sources used in car headlamps. In order to achieve this, a combination of subjective evaluation using an adapted version of the de Boer scale and objective measures based on psychophysiological data was applied. Predominantly, skin conductance response (SCR), heart rate variability (HRV), and eye-blinking frequency (vertical electrooculography, vEOG) were recorded. Though there was some evidence suggesting lower discomfort with glare from light sources with a lower correlated color temperature, the results were generally inconclusive. This illustrates the urgent need to study the linkage between light source properties and subjective and objective glare measures in deeper detail, so that the technical norms governing car headlamps can reflect the needs of human physiology and psychophysiology.

1. Introduction

It is highly desirable to study and understand the glare effects of automotive headlamps, as they can directly influence a driver’s performance in night traffic situations therefore governing traffic safety [1]. Although disability glare should theoretically be avoided by complying with the regulations of photometric and colorimetric properties of car headlamps [2,3], discomfort glare may still be an issue. In this case, the light source is generally considered disturbing by drivers, causing them visual and mental discomfort that diverts their attention from the visual task, which can lead to reduced traffic safety [4]. Furthermore, inappropriate lighting conditions can elicit a stress response from the organism, manifested as increased heart rate variability (HRV) and skin conductance response (SCR) [5,6,7], as well as changes in the frequency of breathing and blinking [7,8,9]. Furthermore, visual performance in terms of visual acuity and contrast sensitivity was shown to be affected by glare from oncoming vehicles [10,11].
Since the development of new light sources such as high-intensity discharge lamps (HIDs) and, later, light-emitting diodes (LEDs), investigation into headlamp glare has increased [12]. This is in part due to complaints from drivers that they were being glared by the new headlamps [10]. The reason for this may be two-fold. First, HID lamps, as well as LEDs, have a different spectral power distribution than “traditional” halogen bulbs, with a peak in the blue part of the color spectrum (especially in LEDs). This makes them appear to be whiter, or even bluish, compared to the bulbs the drivers were used to [10,12,13]. Second, the LEDs are usually mounted within a lens projection module as opposed to a reflector, so that the light-emitting surface is much smaller and, due to the dispersion of light on the plastic optics that are used within the headlamp, produces unwanted effects such as blue color fringing when viewed from certain angles (as might be the case on uneven roads) [12,14,15]. At the same time, stimulation of the blue-sensitive S-cones of the retina has been found to be related to greater discomfort perception [16].
Taking these facts into account, efforts toward establishing a reliable methodology to assess discomfort glare by car headlamps have been made since the 1960s [17]. A common tool used in this context is the de Boer 9-point rating scale [18], which has been subjected to many revisions over the years regarding the verbal descriptors of the perceived glare intensity, as well as the directionality of the scale (in the original version, “1” was described as “unbearable” and “9” as “unnoticeable”, which was shown to be confusing for many research participants) [19]. However, the inclusion of physiological data in headlamp glare investigations in order to further validate subjective findings has not been as frequent as one would expect [20], given that these data have been widely used in research on driver fatigue [21] and glare in daylight/indoor conditions [8,22]. This might be due to the fact that many such studies have been done in the field rather than in a laboratory, but with the increased development of portable physiological signal acquisition devices, one could expect a change in the future.
Therefore, the aim of our study was to establish the links between the subjective glare rating (using a modified version of the de Boer scale [23]), changes in visual acuity and contrast sensitivity, and psychophysiological response (in terms of HRV, SCR, and blinking frequency) following glare from different headlamps used in currently available cars (LED modules of different photometric properties—color spectrum and cut-off line gradient—and a halogen bulb reflector) within one experimental setting. The proposed methodology can be used by researchers, car and headlamp manufacturers interested in the study of glare effects, and traffic safety, as well as in user experience studies. The methodology can be further modified by introducing other tasks for the participants to solve while they are being glared, as well as by the acquisition of other physiological signals (e.g., EEG, visual evoked potentials, etc.). As such, it can be seen as one further step towards understand glare mechanisms and establishing a link between subjective and objective glare measures, so that legislation governing headlamp manufacturing can truly reflect the needs of human physiology and psychophysiology.

2. Materials and Methods

2.1. Participants and Ethics

The participants were recruited using the snowball method and quota sampling. The aim was to recruit at least 100 participants in a way that the sample would reflect the age and gender distribution of Czech driving license holders and would include drivers with various eye disorders, as well as drivers with a healthy visual system (as both are present in the population of drivers). As this was not a clinical study, no specific health conditions were demanded or served as exclusion criteria; rather, we aimed to obtain a heterogeneous sample of drivers for the within-subject experimental design. However, due to the COVID-19 outbreak and restrictions at the time of data collection, only 46 participants were recruited and included in the sample.
Therefore, the final sample comprises 23 men and 23 women between 20 and 71 years of age (M = 35 years; SD = 14 years). The age and gender distribution of the participants are shown in Figure 1. Out of the 46 participants, 12 had healthy vision, 21 were myopic, four were hyperopic, and nine were presbyopic. For further impairments, six had astigmatism, one had glaucoma, and one was diagnosed with nyctalopia. In total, 29 participants wore glasses (23 of which had an anti-reflective surface coating and six of which had a filter for the blue part of the light spectrum). The final sample over-represented the younger age categories of drivers, but overall, the heterogeneity of the sample is satisfactory.
Upon entering the laboratory, the study procedure was explained to the participants, stressing that they can withdraw from the study at any moment; they signed an informed content (GDPR compliant) regarding the use of their data. Although the purpose of the study was presented to the participants in general (i.e., “The purpose is to study glare effects and color preferences of different light sources.”), specific hypotheses were not revealed to them in order not to bias their subjective responses. For the same reason, at no time during the experiment were the light samples used called by any specific name (such as LED or halogen). At the end of the study, during the debriefing, more detail was given, and the participants were reminded of their option to withdraw from the study. No participant opted to withdraw.

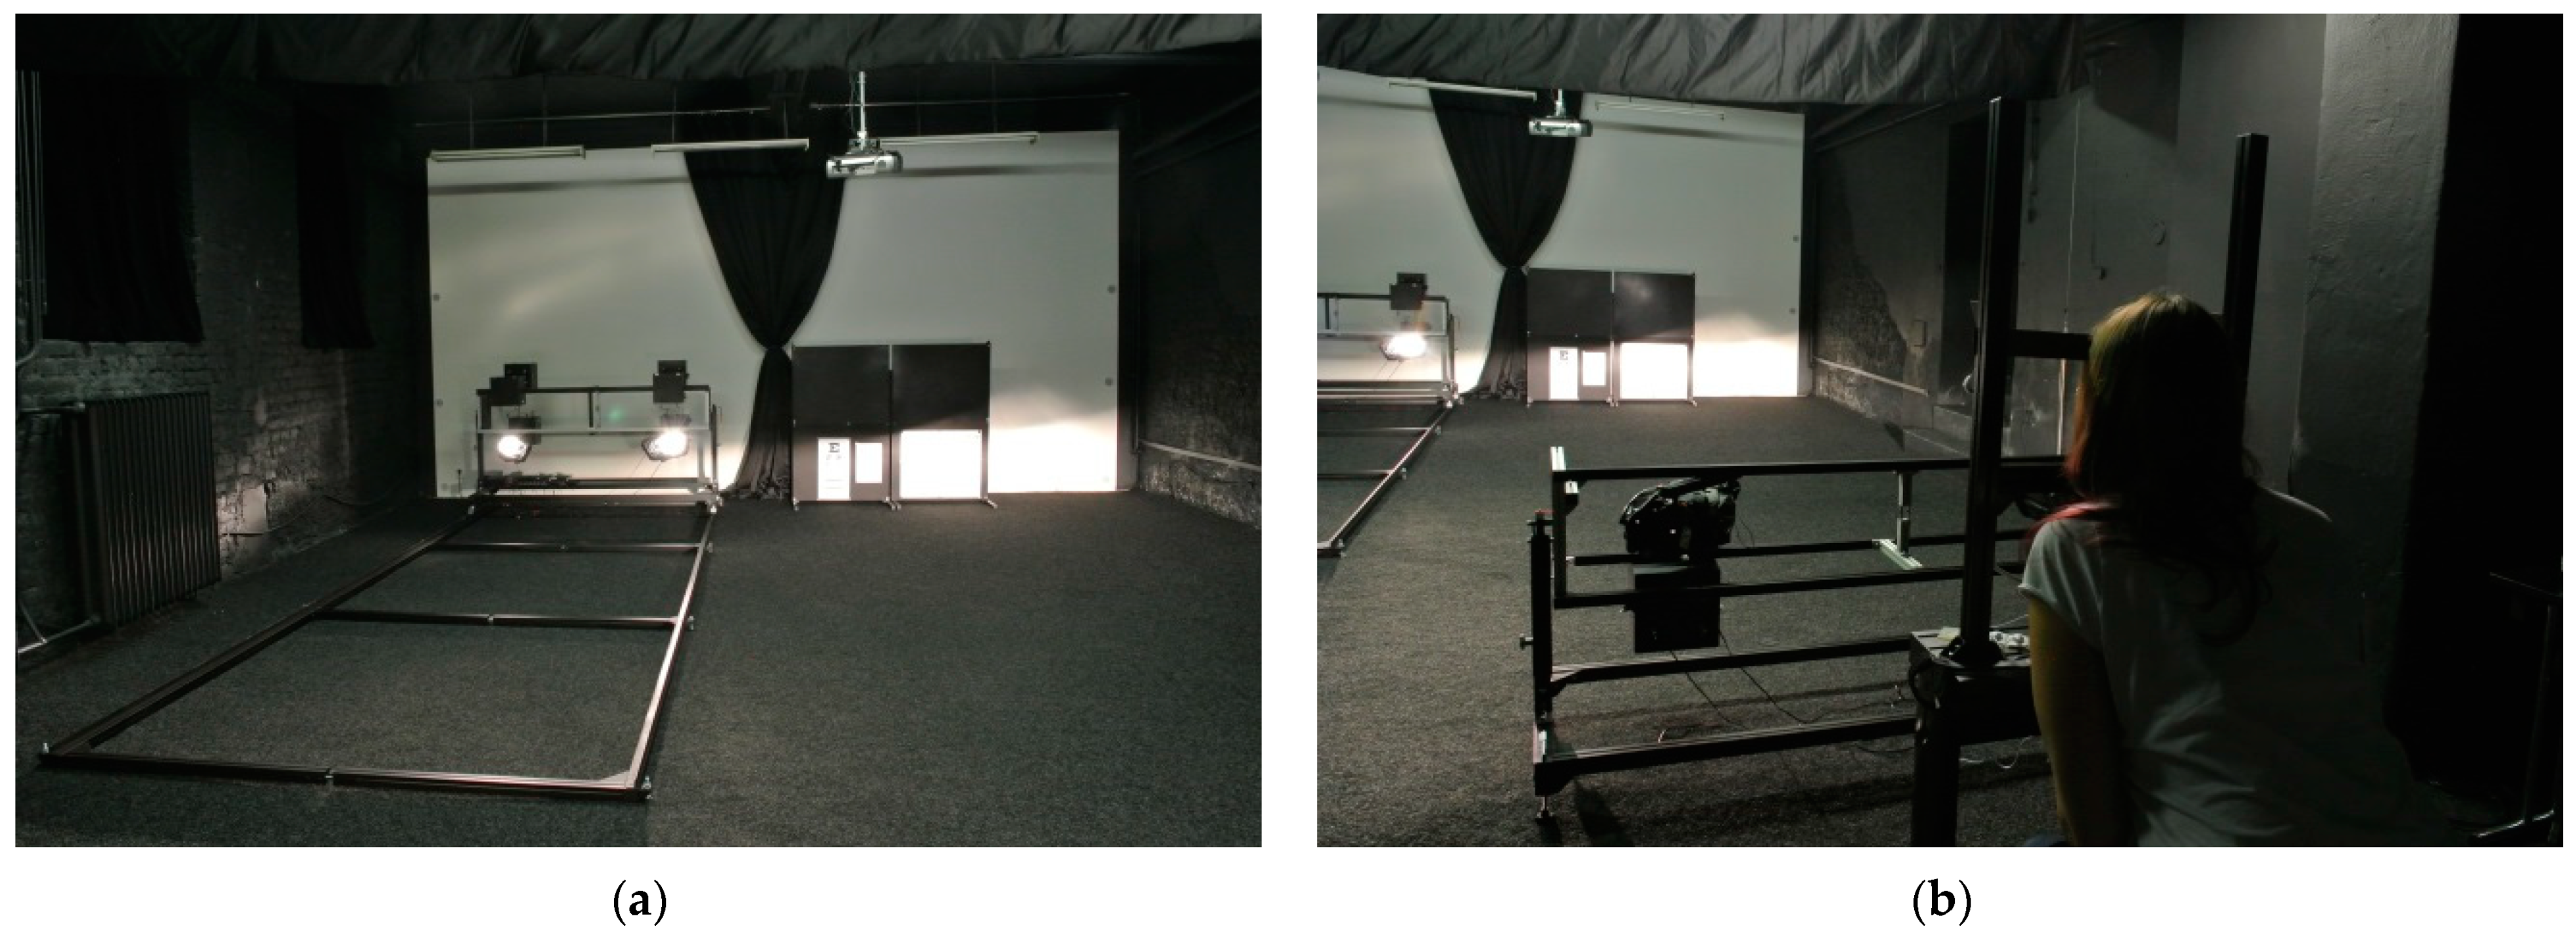
2.2. Laboratory Setting

In order to conduct research on glare and its underlying psychophysiological mechanisms, we used a laboratory setting with two separate rooms.
In the smaller room, an initial screening of the participant’s driving experience and vision characteristics was performed (see Section 2.3 below). After this initial examination, the participants were taken to the larger laboratory room simulating a two-lane night-traffic road scenario for the glare experiment itself. This room was 5 × 10 m, light-tight, and painted with matte black color. At each end of the room, a carousel with mounted light samples was placed to simulate the headlamps of the “driver” (in the right lane) and those of the “oncoming vehicle” in the left lane; see Figure 2. Although the carousel of the “oncoming vehicle” could, in principle, be moving forward, it was decided to keep it in place, approx. 10 m away from the driver’s position, for the whole experiment to simplify the procedure.
The participant (“driver”) was seated behind a stand with their head placed on a chin rest (110 cm above the ground and 150 cm behind the driver’s carousel) in order to fix the position of the head during the experiment. On both sides of the stand, approximately at the driver’s eye level, light meter sensors were placed to continually measure the amount of light coming to the driver’s eyes (sampling frequency of 50 ms) and to help pinpoint the exact moment of glare. Based on a pilot study with three drivers, the threshold for glare was set at 10 lux (counted as the average value from both sensors).

Light Samples

The light samples used in the experiment were prepared to be as close to the real headlamps used in the vehicles seen on the roads as possible (compact and subcompact cars). To be able to compare driver’s glare perception, a typical halogen reflector with an H7 bulb was used along with the newest LED projector modules. The LED projector modules were conventional in the sense that they did not contain any matrix capabilities to dim the beam while oncoming traffic is approaching. In the experiment, only low beams were tested. The aim was to determine whether there is a significant difference between observing a reflector and projector headlamp of the same car and whether any change towards the blue or yellow part of the LED color spectrum (i.e., closer to the color of a halogen bulb reflector headlamp) will cause the headlamps to impose more or less glare compared to the variant used in the series production (“white” LEDs).
To assess the impact of the light distribution’s color, the series LED projection modules needed to be adjusted. In order to be able to use the same electronics for each projector module (printed circuit boards—PCBs with the original driving circuits), automotive-grade LEDs from the same manufacturer were chosen rather than prototype full-spectrum LEDs. The limitation of this approach was that each of the tested LEDs had a peak in the blue part of the spectrum. Nevertheless, LEDs from the most yellowish and the most bluish color bins (that are not used in the series production) were chosen to be compared with the series white LEDs, and their correlated color temperatures (CCT) were approximated using McCamy’s formula [24].
Moreover, the projection optics in the experimental modules were refocused. Modules with the bluish color bin LEDs were focused so that the gradient of the light distribution was increased (the distribution was sharpened). Conversely, modules with the most yellowish color bin were defocused (the distribution was blurred). This allowed for the assessment of how extreme adjustments of the series LED projection modules can make glare perception nearer or further from the halogen reflector glare experience.
All of the samples were prepared with the goal of meeting the standard photometric limits described in the ECE norms (see Table 1). We focused mainly on the values measured in the B50L photometric test point, as this is the geometric point that corresponds to the oncoming driver’s eyes; therefore, it is used to assess the amount of glare.
The light samples used in the experiment were thus as follows:
  • series reflector containing regular H7 bulb (CCT of 3200 K);
  • series LED projector module (“white” LED, CCT of 5700 K);
  • “yellow” adjusted LED projector module—module containing a PCB with the most yellowish LED color bin and the lens defocused to create the most blurred cut-off line possible while maintaining the headlamp legality as much as possible (CCT of 4700 K);
  • “blue” adjusted LED projector module—module containing a PCB with the most bluish LED color bin and the lens focused to create the sharpest cut-off line possible while maintaining the headlamp legality as much as possible (CCT of 6200 K).
For the oncoming vehicle, all the samples were used as sources of glare (in a random order for each participant). For the driver’s own headlights “illuminating the road ahead”, only the series LED projector module and the H7 bulb reflector were used, in order to minimize the number of possible combinations with the oncoming vehicle’s headlamps. Table 2 and Table 3 show the photometric values and gradients for the left and right light samples, respectively. It needs to be stressed that the halogen bulb reflectors were measured directly as whole headlamps including the covering glass, whereas the LED modules were measured in special holders without the covering glass. This was due to the fact that they were built via a prototyping process and repeated mounting and dismantling of the whole headlamp would steadily damage the plastic parts of the headlamp. However, it can be approximated that the real values (that would be found in measurements with the covering glass) are around 10% lower than those measured.
Further, all of the LED modules were measured on the same level of driving current, as only two electronic control units (ECUs) were used to simplify the experimental procedure (i.e., the same for all three modules). This caused a different luminous intensity achieved in the B50L glare point of each module. Namely, the left yellowish LED module achieved higher values for the B50L photometric point than are imposed by the homologation requirements. Nevertheless, the value is still in the CoP (Conformity of Production) limit and, moreover, the real value is lower due to the Fresnel reflections on the covering glass. Therefore, the B50L photometric value would still be legal. The HV point value of this module would not be legal; however, in the experiment, the HV point is far from the observer’s eyes and probably does not influence the results.

2.3. Data Collection Procedure

2.3.1. Initial Participant Examination

Upon booking an appointment at the laboratory, the participants were asked to come well-rested and healthy, with no drugs, medicine, or coffee consumed in the 2 h prior to the experiment, as these could influence the psychophysiological measurements (see e.g., [25]). They were also asked not to wear any make-up or stockings, in order to allow the electrodes to be attached.
As part of the initial participant screening, the participants were asked about:
  • the car they usually drive and its type of headlamps;
  • the frequency of their driving and their average mileage per month;
  • the types of roads they usually drive on (in the city/outside of the city/on highways);
  • how often they drive at dusk/dawn/at night; and
  • about any eye defects (myopia, hyperopia, presbyopia, astigmatism, glaucoma, color blindness, etc.) that they might have, and the types of correction used for them (i.e., surgery, contact lenses/glasses, and whether these possess a blue-light filter or other types of tinting).
Furthermore, the color of their iris was noted using the Martin Schulz Scale [26], as some research suggests a link between the pigmentation of the iris and glare sensitivity [27,28], although these findings were not replicated in some of the newer studies [29]. Further, the color vision of each participant was examined (for both eyes at the same time) using Stilling–Velhagen plates [30] and, after a five-minute period of adaptation to darkness, contrast sensitivity was examined using the Oculus Mesotest II. Hereby, we wanted to establish any potential sources of bias when it comes to visual perception in general and the perception of lighting color specifically. Concerning lighting color perception, a tabletop experiment using white photo-shooting tents with Munsell Color Checker Charts illuminated by the same light sources that were used in the glare experiment (see below) was also performed, which is planned to be presented by the authors elsewhere. Finally, for each participant, tear film evaporation rate was measured and computed using a device of our own construction (consisting of swimming goggles with sensors for measuring temperature and humidity) based on previous research [31,32], as patients with dry eye syndrome might be more sensitive to glare [33,34].

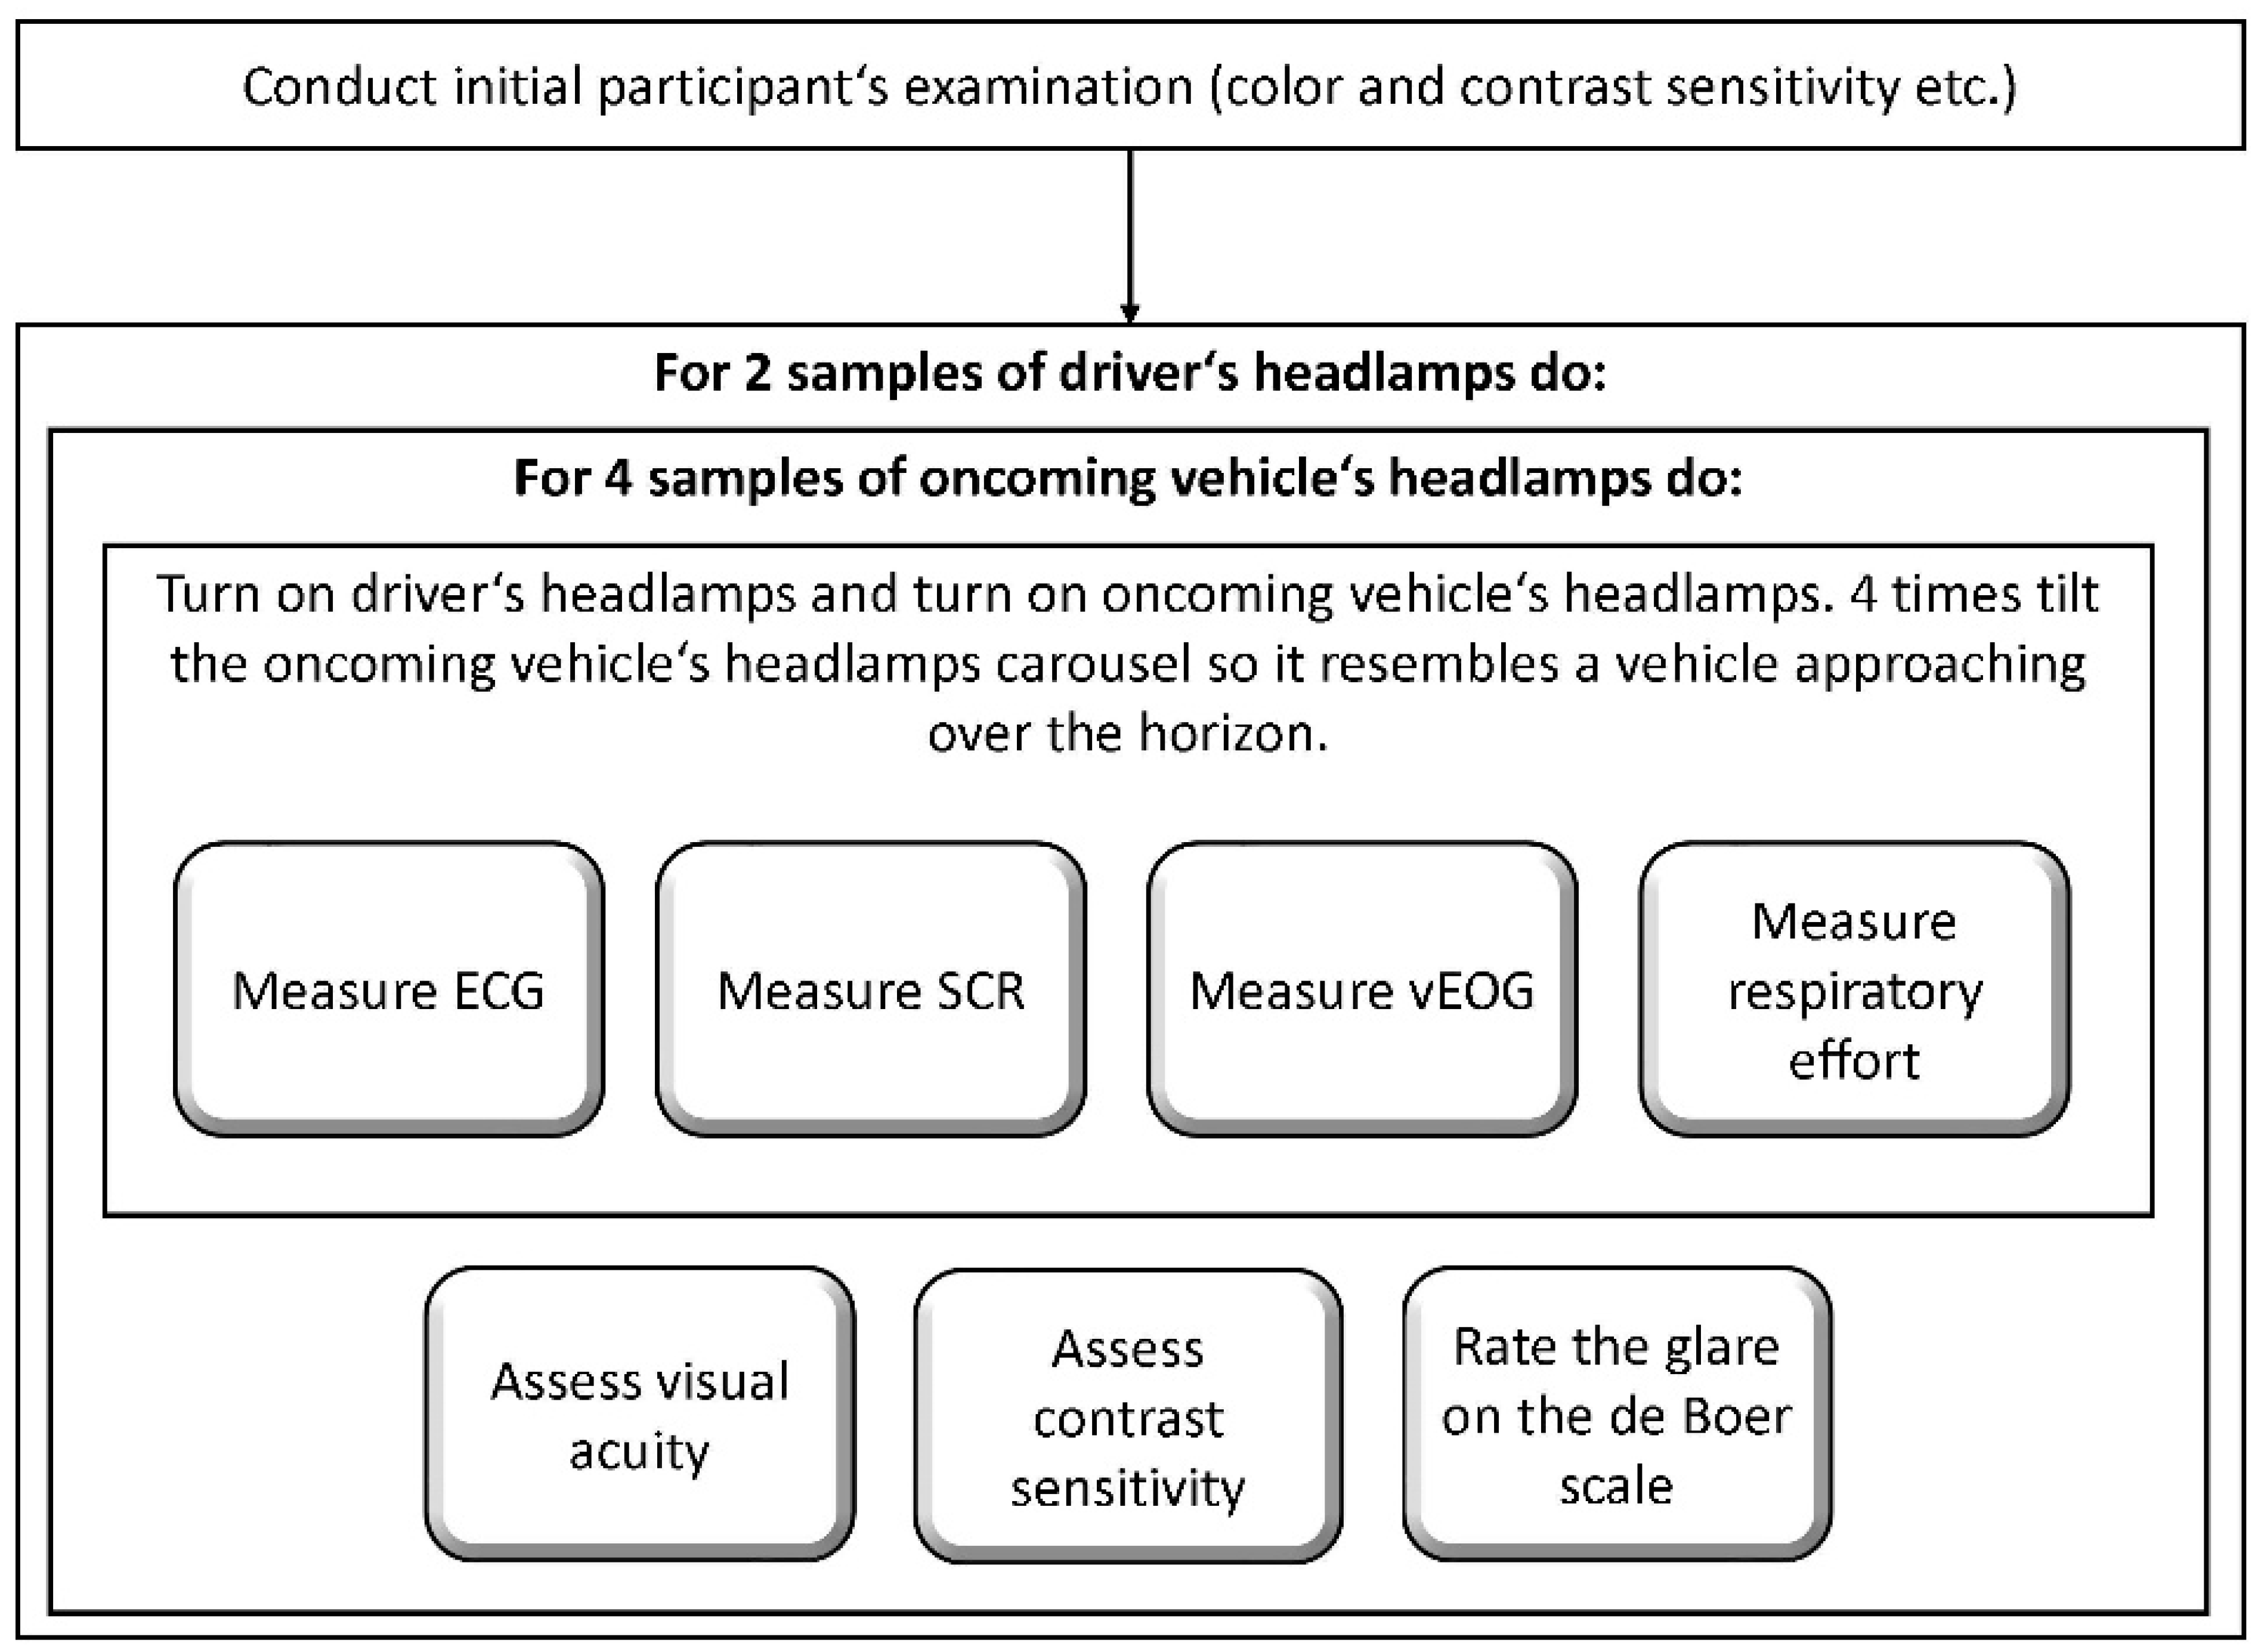
2.3.2. Experimental Procedure

Following the initial evaluation, the experiment itself began. A within-subject experimental design was used in order to account for inter-individual variability of psychophysiological reactions. The experiment consisted of repeatedly glaring the participants (“drivers”, who had their own headlamps on) by different oncoming vehicle’s light sources while monitoring their ECG, SCR, breathing, and blinking frequency, followed by an assessment of their discomfort glare rating (using the modified de Boer scale [23], which was explained to the participants) and changes in visual acuity and contrast sensitivity. In total, each participant went through eight different light source combinations (two different driver’s headlamps × four different light samples of the oncoming vehicle) and were glared four times by each of these combinations, totaling 32 glare events per participant (Due to technical errors while manually operating the carousel, some participants were glared more than four times by some combinations, in which case only four glare events for this particular combination were selected.) The order of the light source combination presentation was counterbalanced across participants so that the light samples were presented to each participant in a different order. This procedure is summarized in Figure 3.
More precisely, the participants were instructed to keep their head on the chin rest and look straight forward “as if they were driving”, and not to talk except when answering a question (in order to minimize bias in the psychophysiological data). They were also handed a button with the instruction to press it “as soon as the oncoming vehicle’s light hits their eyes” during each trial to validate their responses. Their psychophysiological responses were recorded using the BIOPAC MP 36 (BIOPAC Systems, Inc., Aero Camino, Goleta, CA, USA), a bio-signal acquisition device often used for psychophysiological studies [35,36].
First, the driver’s headlamps were turned on (either white LEDs or halogen bulb reflectors). Next, the researcher also turned on the headlamps of the “oncoming vehicle” (one of the four samples, varied randomly in order across the participants) mounted on a carousel and set in a position in which they do not glare the driver. At a variable interval from 1 to 10 s (so that the participants could not predict the situation and prepare for it), the researcher smoothly tilted the carousel to glare the driver for approximately 0.5 s. Due to the carousel not being motorized, this had to be done manually, so the length of each glare might have slightly varied. Upon inspection, no glare was shorter than 300 ms and longer than 1 s; within this range, we did not assume variations in reactions caused by this variable glare duration [37]. Following a 30 s interval when the lights were not shining into the driver’s eyes, the researcher tilted the carousel again and glared the driver, subsequently waiting for another 30 s. This procedure was repeated once more, so there were a total of four glares from one source of the oncoming vehicle, with 30 s intervals in between the glares. The length of the interval was chosen with respect to the typical onset and duration of the psychophysiological responses to the stimulus and stabilization back to baseline.
After the last 30 s interval, the headlamps were left on in their initial position where they did not glare the driver. The participants were asked to evaluate their overall glare impression from the four glare events on the de Boer scale (they were reminded of the verbal descriptors if needed), and then to read three eye charts placed 9 m in front of them on blackboards. These were the standard Snellen chart and Tumbling E chart for visual acuity assessment, and the Pelli–Robson chart to assess contrast sensitivity. It should be noted that none of these charts was used in a standard ophthalmic setting (i.e., under standard lighting and at the prescribed distance for which the charts had been made), but rather as visual targets to assess performance/possible changes in visual acuity and contrast sensitivity following glare. The participants were instructed to read the charts one by one, and the number of correctly identified symbols was noted for each chart. After that, the oncoming vehicle’s headlamps were switched off and replaced by another light sample, and the procedure was repeated. At the end, a debriefing took place, where the participants had the opportunity to share further impressions of the experiment. Altogether, the duration of each experimental session was about 1.5–2 h.

2.4. Data Analysis

Following the literature, we mainly wanted to establish whether:
  • participants react differently (in terms of SCR, HRV, blinking rate, and de Boer ratings) to glare by different light source combinations;
  • glare by specific light source combinations leads to short-term changes in visual acuity and contrast sensitivity;
  • preference for a specific light source (as measured by the tabletop experiment) plays a role in the reaction to glare (in terms of SCR, HRV, blinking rate, and de Boer ratings); and
  • whether there is a link between the subjective de Boer rating and the psychophysiological variables.
Therefore, the following dependent variables were examined:
  • skin conductance response (SCR);
  • eye-blinking rate, computed from the vertical electrooculography (vEOG) signal;
  • number of post-glare correctly identified characters from the Snellen, Tumbling E, and the Pelli–Robson chart, respectively; and
  • the de Boer ratings for each light source combination.
Originally, we aimed to study heart rate variability (HRV), computed from the ECG signal; however, due to the insufficient length of the post-glare interval, the LF band could not be analyzed, and therefore HRV analysis and results are not presented in this paper. Breathing frequency was also intended to be analyzed together with HRV, as these two measurements are known to correlate [7], but due to significant missing data (despite adjusting the respiration belt multiple times, the participants’ breathing signal was very weak overall), this variable was not included in the analyses.

2.4.1. Physiological Data Pre-Processing

To pre-process our data, we used AcqKnowledge software v4.4 (BIOPAC Systems, Inc., Aero Camino, Goleta, CA, USA). To use them as reference points for event-related analysis, we identified glare onsets based on the signal outputted by the light meter sensor. Occasionally, we identified more than the expected four glares per block due to errors in manually operating the carousel. In these cases, we disregarded the glares where the time until the next glare was shorter than 20 s, as these were clearly unintentional (with the experimental protocol demanding 30 s between glares). All blocks of Subject 3 and the first block of Subject 38 were excluded due to technical problems. The remaining 44 subjects produced 32 valid glares each (four glares in each of the eight blocks). Altogether we analyzed 1438 instances of glare.
As a proxy for sympathetic activation, we analyzed amplitudes of skin conductance responses (SCRs) to glares [38]. Because our original skin conductance recording exhibited gradual baseline shifts and contained a moderate amount of high-frequency noise, we filtered it using a 0.05–1 Hz band-pass filter. We located the SCRs in the first 8 s of each epoch (According to seminal literature, latency and rise time can altogether add up to 6 s after the stimulus presentation [39]; we opted for epochs 8 s long to conservatively account for possible inaccuracies in the process of stimuli presentation). In each epoch, we used the evaluation method B presented by [38] to analyze the amplitude of the first SCR following the stimulus presentation, which was larger than 0.1 microsiemens (µS; we conservatively chose half of what seminal literature considers minimal response [39]). We excluded 598 epochs due to the absence of any SCR larger than 0.1 µS and an additional six epochs due to visually identified artifacts. We extracted the SCR amplitude values from the remaining 834 epochs. Because the SCR amplitudes distribution notably deviated from the normal distribution, for the purposes of statistical analysis, we applied logarithmic transformation to the SCR amplitudes’ values.
We further analyzed the number of eye blinks recorded with vertical EOG in 20 s long epochs starting at the glare onset. Due to technical errors, eight epochs were shortened by 125 to 2930 ms. To identify individual blinks, we first suppressed EOG elements caused by eye movements by applying a 0.5 Hz high-pass filter. Subsequently, we identified blinks by visual inspection—assisted by a simple peak-detecting algorithm—and then assessed the relative frequency of blinks in the 20 s intervals. Since the relative frequency depends on the length of the epoch, in the epochs shorter than 20 s, we linearly extrapolated the number of blinks to estimate the expected number of blinks in 20 s. We excluded 61 epochs due to visually identified EOG artifacts.

2.4.2. Statistical Analyses

We used Tibco Statistica v13 (TIBCO Software Inc., Palo Alto, CA, USA) to perform statistical analyses of our data. To analyze changes in physiological responses (i.e., SCR amplitudes and number of blinks in 20 s) to glare, we used linear mixed-effect models. We constructed two such models, one for each physiological variable. Each model predicted the respective physiological variable by the following fixed effects: (1) the type of light shining towards the participant (type_opposite), (2) the type of light shining away from the participant (type_own), (3) the interaction of the previous two effects (type_opposite*type_own), (4) whether the participant preferred the current type of light shining towards them (preference_opposite), (5) whether the participant preferred the current type of light shining away from them (preference_own), and (6) the interaction of the previous two effects (preference_opposite*preference_own). We used Scheffé’s post-hoc test to further explore potential significant results. Besides the fixed effects, each model also included a random effect of participants to account for repeated measures. Additionally, we included two covariates in each model: the number of each trial in its respective session (trial_number, intended to account for habituation effects expected to diminish physiological responses over time) and the reported value of the de Boer scale (deBoer). Before constructing the models, we checked the normal distribution of residual and homoskedasticity by visually inspecting the histogram of residuals and the plot of predicted values by residual values, respectively. We found no violation of linear regression assumptions.
Further, to analyze the subjects’ self-reported data, we constructed four linear mixed effect models to analyze variability in the de Boer scale, visual acuity (Snellen, Tumbling E), and contrast sensitivity (Pelli–Robson) following blocks of glare. All four models included the random effect of participants and the following fixed factors: type_opposite, type_own, and the interaction type_opposite*type_own. In addition, the model predicting the reports on the de Boer scale included preference_opposite, preference_own, and preference_opposite*preference_own. Because these analyses were performed on the level of session blocks (each block consisted of four trials; i.e., there were eight blocks per subject), we also included a covariate block to account for a possible habituation effect. Again, we visually checked residual normality and homoskedasticity for each model with no assumption violation detected. Due to the relatively small number of participants and the random effect of participants being included in the analyses to account for repeated measures, no other participant-specific characteristics (such as gender, age, etc.) were included in the models separately.
Finally, we estimated the relationship between the psychophysiological variables and the de Boer ratings by using Pearson correlations.

3. Results

The following text describes the results of the respective linear mixed-effect models. Although all the models were statistically significant (p < 0.05), in all cases, the random effect of the participants accounted for most of the data variability, indicating a major role of inter-individual differences in glare perception.

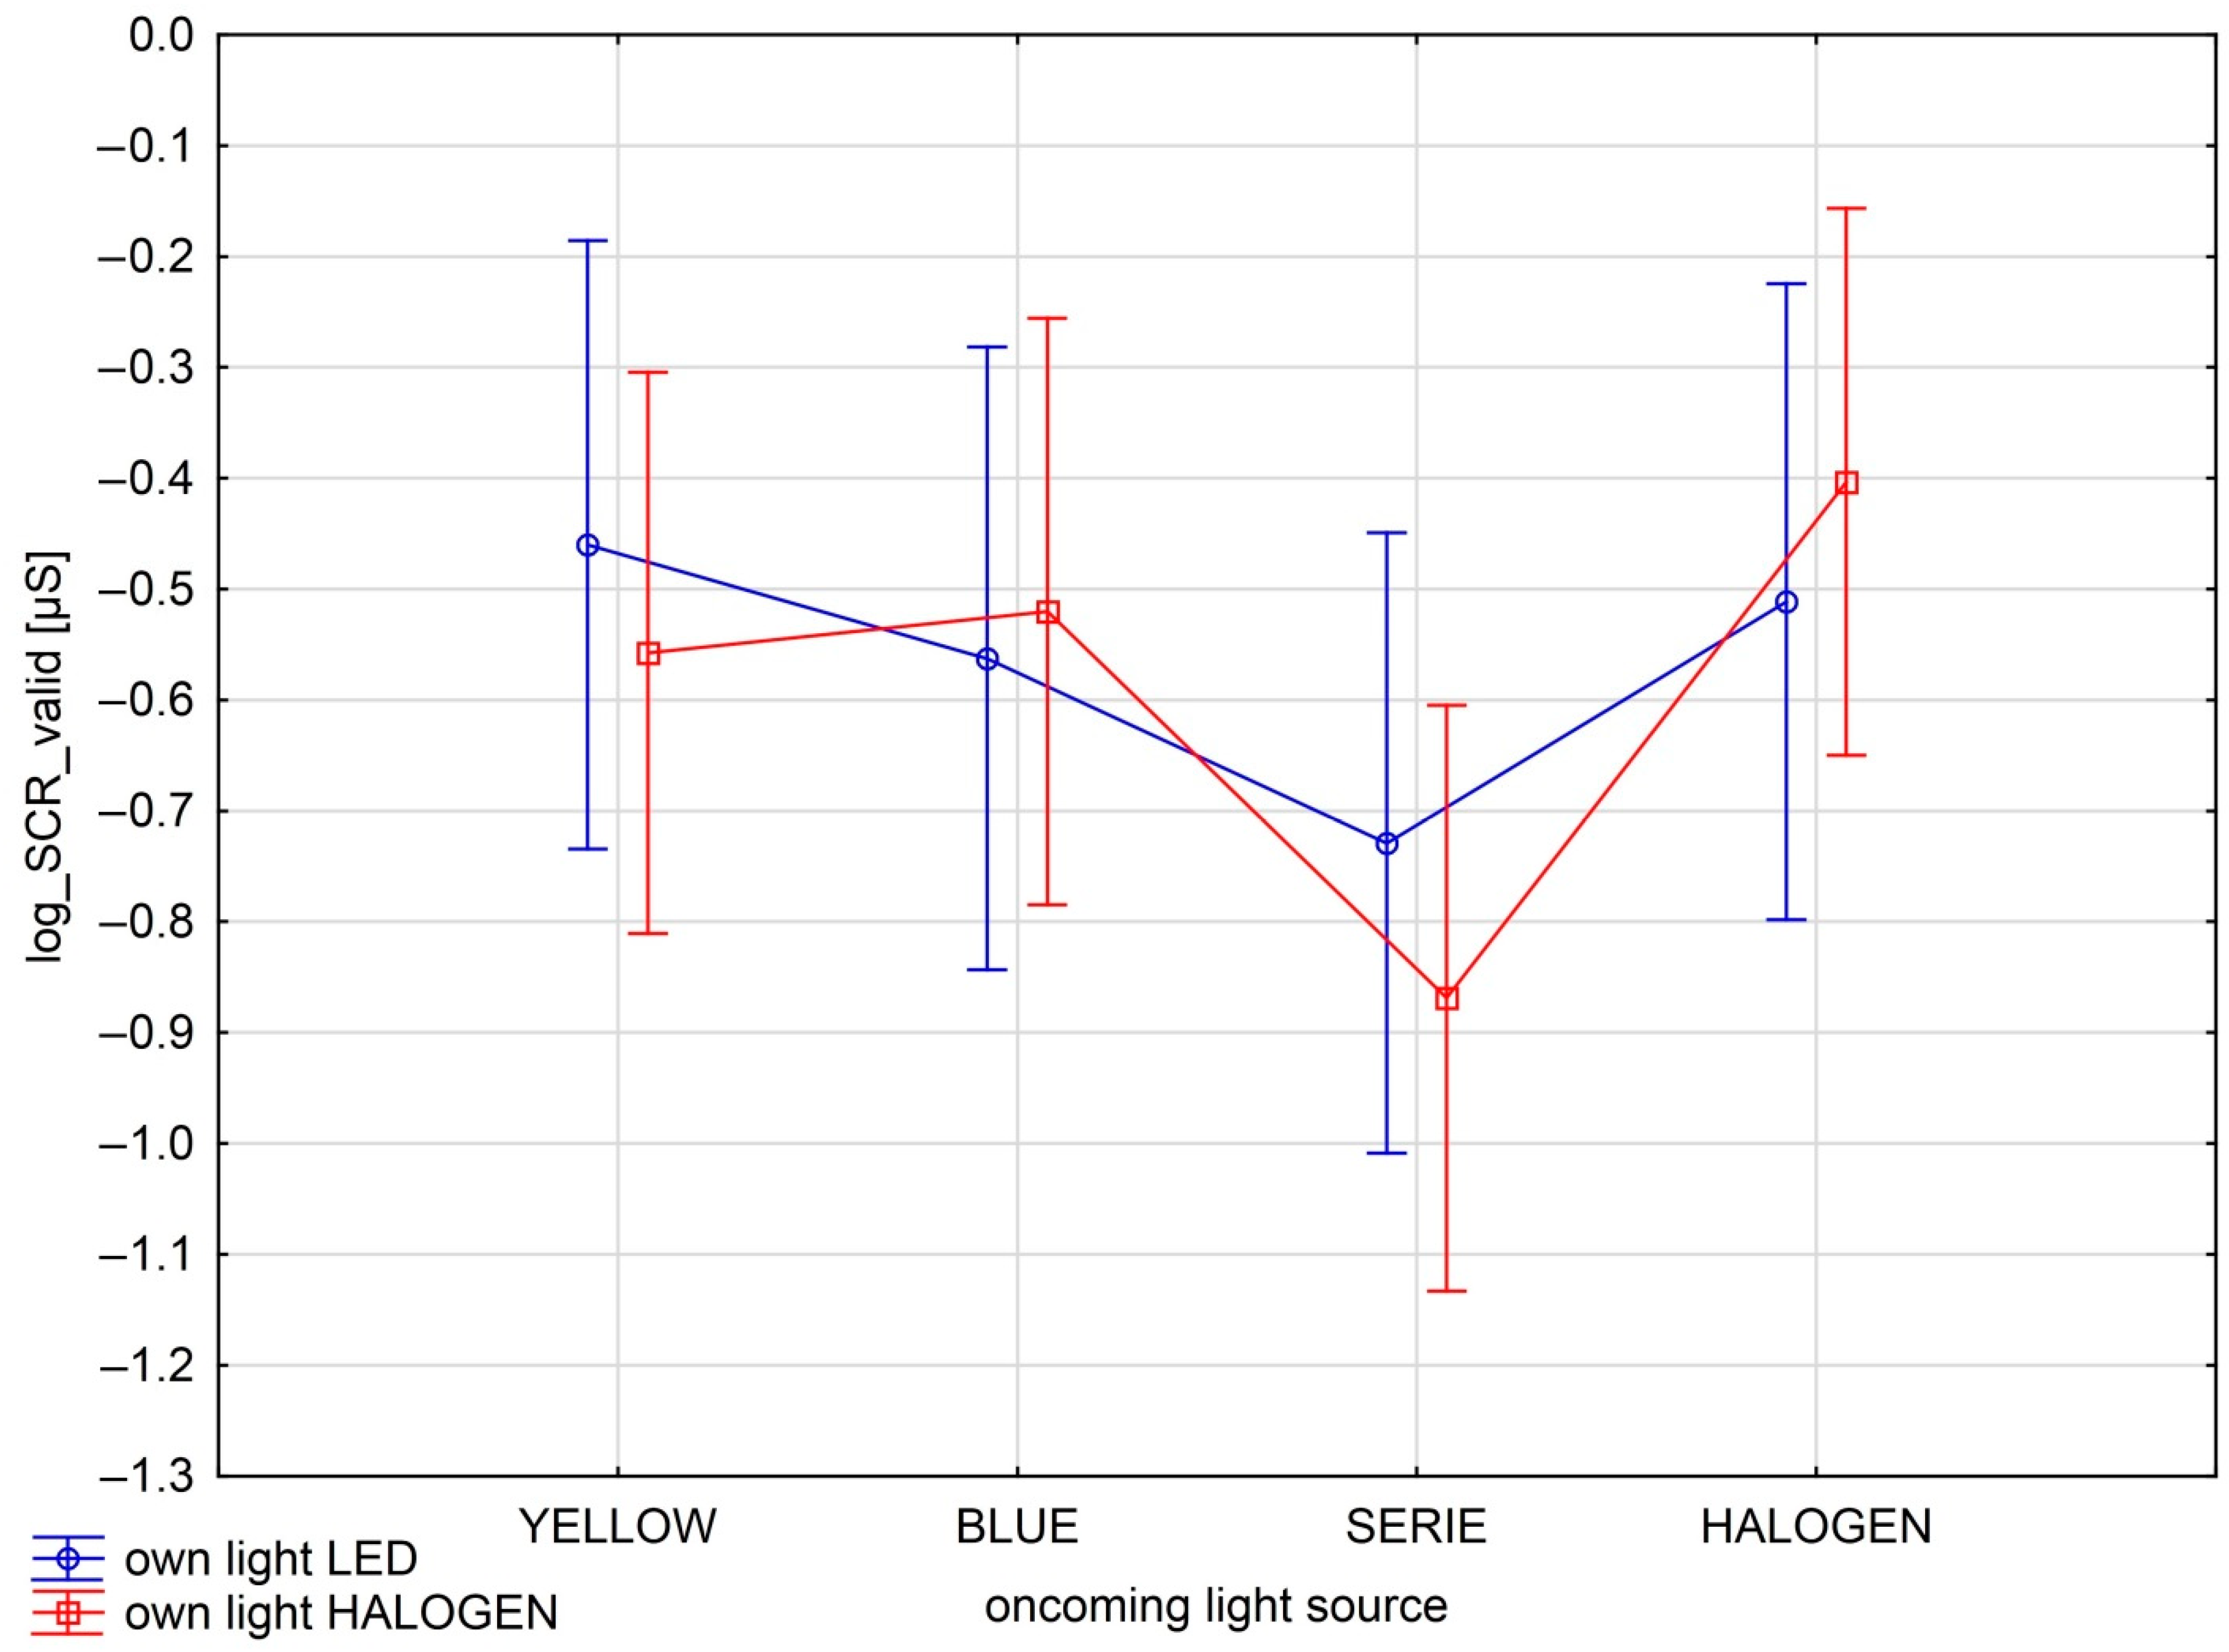
3.1. SCR and Different Light Combinations

Skin conductivity response changes depended significantly on the light of the oncoming vehicle only (F(3) = 5.829; p < 0.001). None of the other fixed effects (type_own; type_opposite*type_own; preference_opposite; preference_own; preference_opposite*preference_own) were statistically significant (p > 0.05). As for the covariates, trial_number reached statistical significance (F(1) = 101.376; p < 0.001), but not the deBoer scale rating (F(1) = 1.914; p = 0.167). The model explained 43% of data variability (Multiple R2 = 0.433; F(55;778) = 10.819; p < 0.001). The serial “white” LED module seems to produce lower SCR than other light sources or light source combinations (see Figure 4).

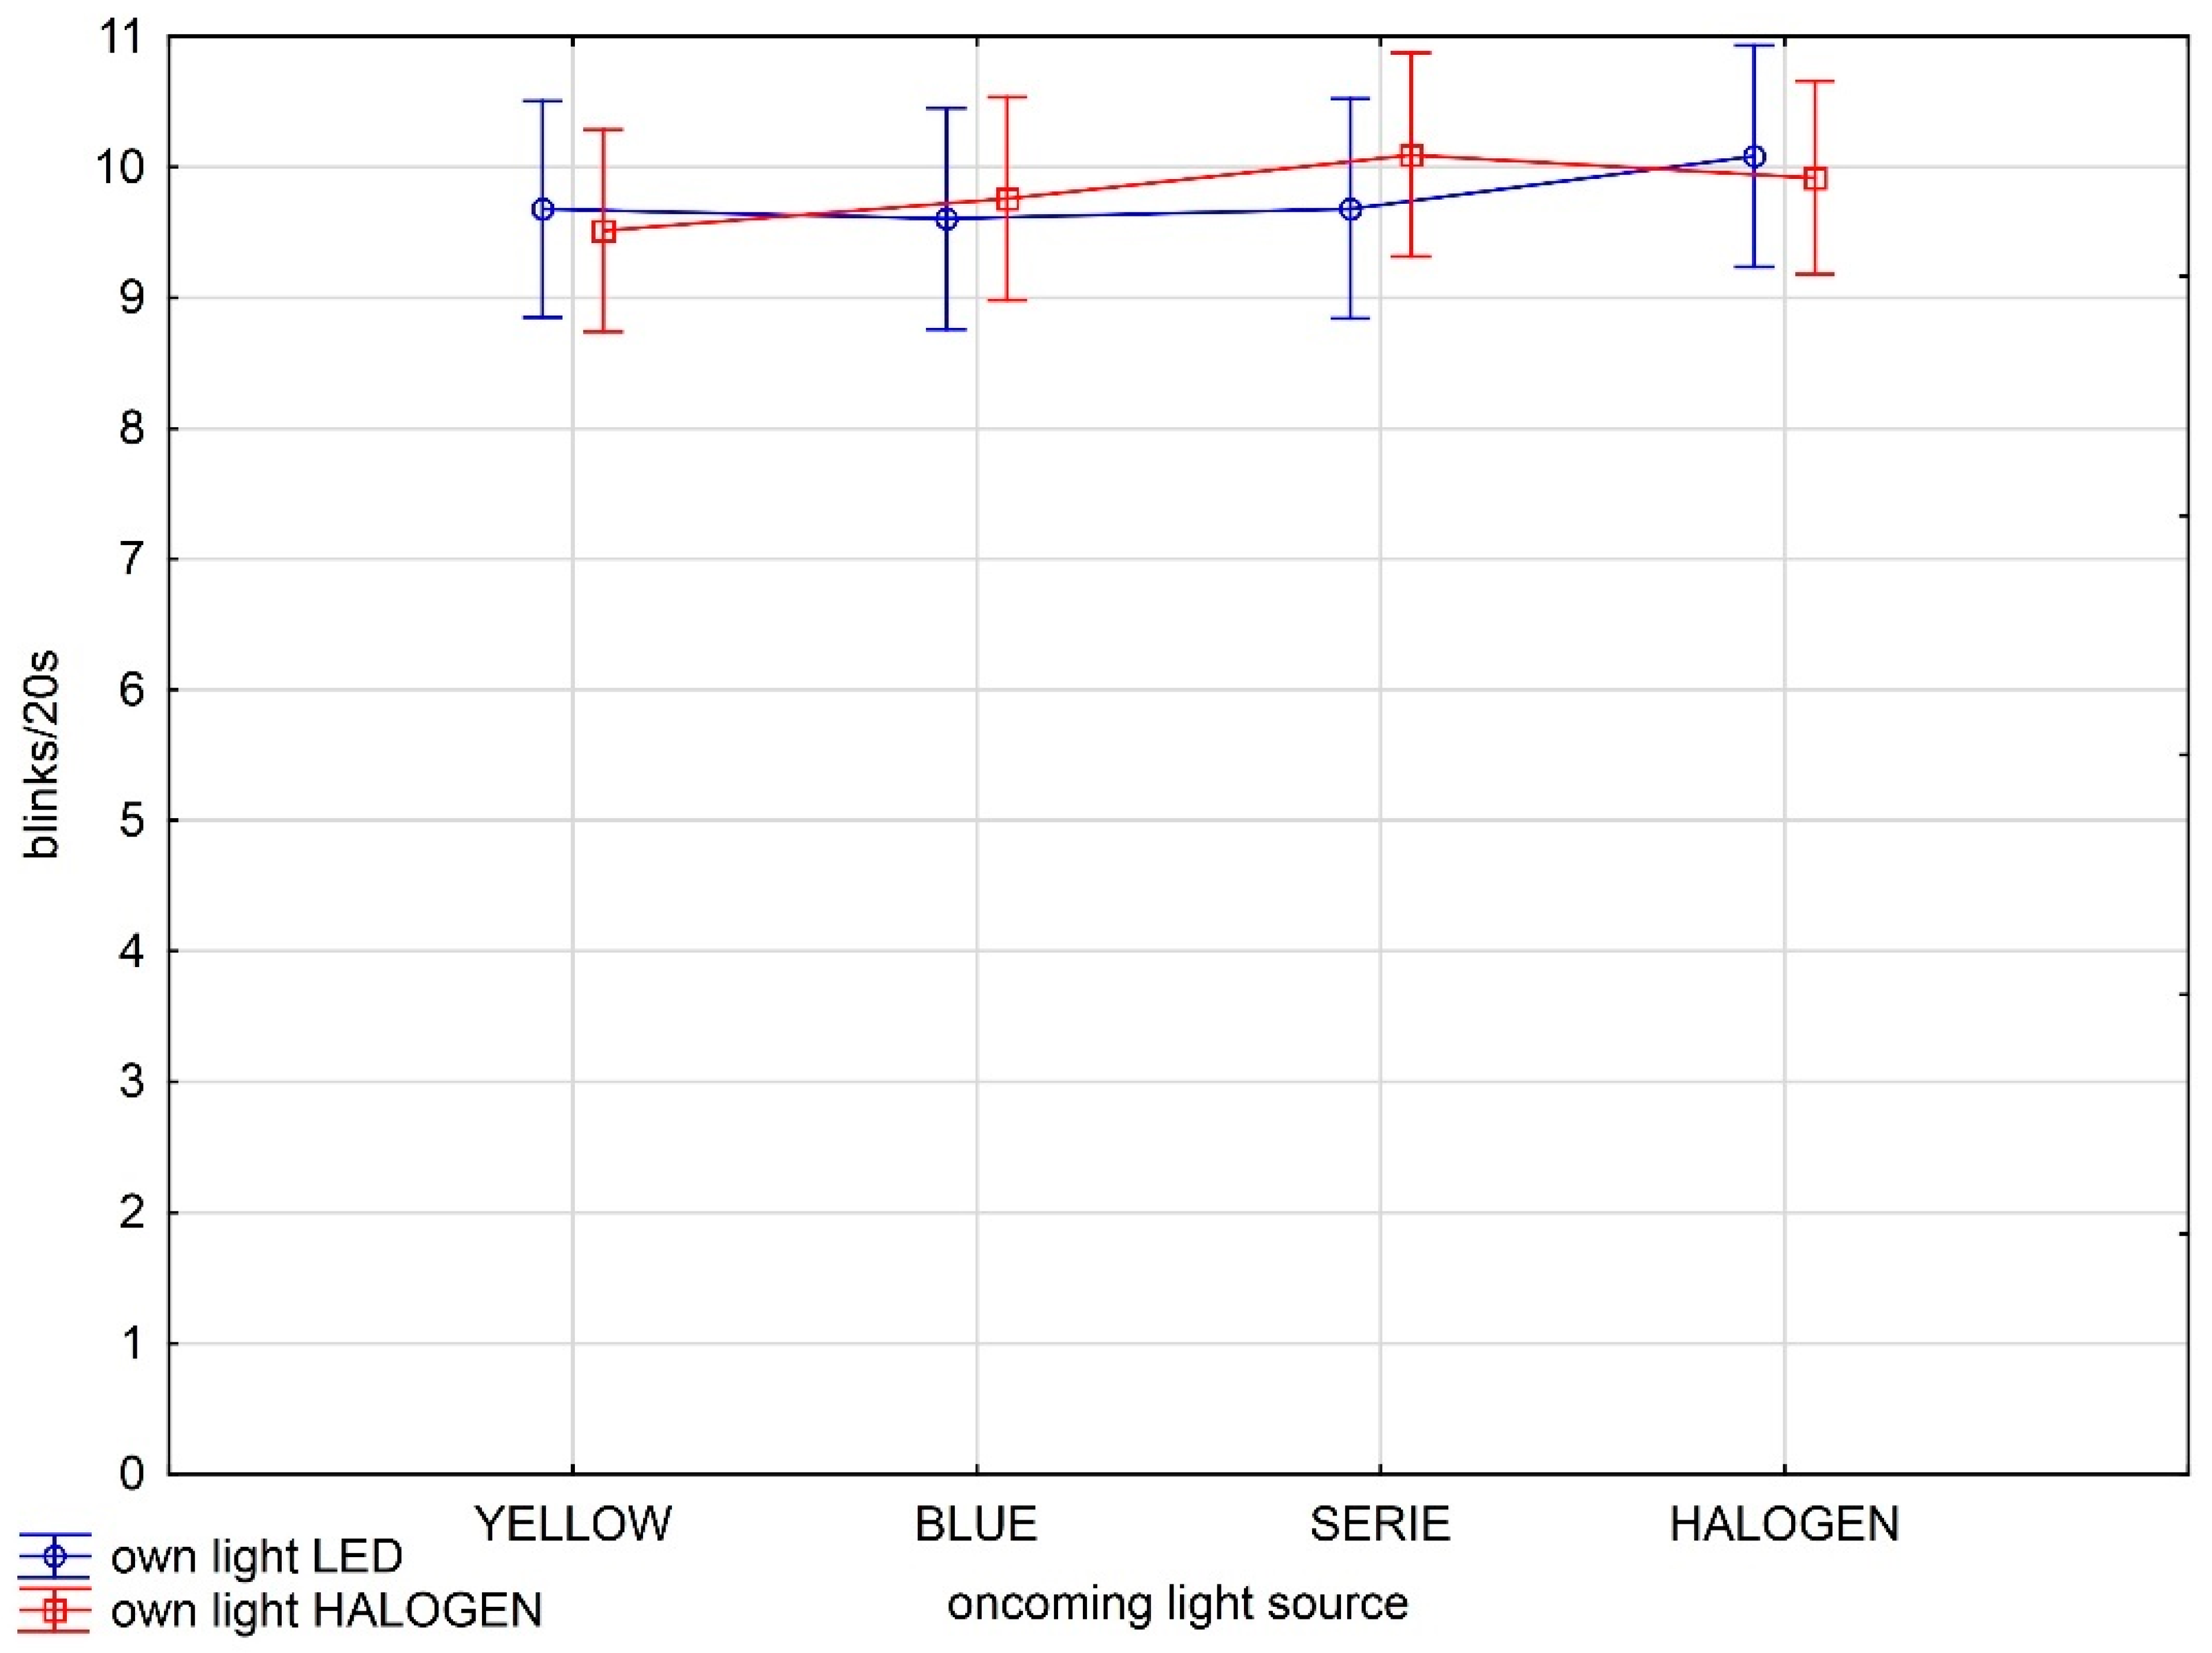
3.2. Blinking Frequency and Different Light Combinations

In blinking frequency post-glare, none of the fixed effects were statistically significant. The model explained 73% of data variability (Multiple R2 = 0.726; F(56;1322) = 62.545; p < 0.001). Neither the driver’s headlights themselves (F(1) = 0.106; p = 0.745), nor the lights of the oncoming vehicle alone (F(3) = 1.015; p = 0.385), nor their combination (F(3) = 0.669; p = 0.571) were found to affect the subsequent number of blinks (see Figure 5). The same was true for the preference of either the own light source only (F(1) = 0.043; p = 0.836), the oncoming light source only (F(1) = 0.402; p = 0.526), or their interaction (F(1) = 1.098; p = 0.295). From the covariates, again, the trial_number was statistically significant (F(1) = 53.332; p < 0.001), but not the deBoer scale rating (F(1) = 3.699; p = 0.055).

3.3. Visual Acuity and Contrast Sensitivity Post Glare

For predictions of visual acuity (Snellen chart, Tumbling E chart) and contrast sensitivity (Pelli–Robson chart), again, none of the fixed effects were statistically significant. We assume this was due to the number of repetitions (each participant read each chart a total of 10 times through the course of the experiment), where it was clearly visible that with each consequent trial, the participants were able to correctly identify more characters. For the Snellen chart, the results were as follows: type_own (F(1) = 3.763; p = 0.053); type_opposite (F(3) = 2.159; p = 0.093); type_opposite*type_own (F(3) = 1.123; p = 0.340). For the Tumbling E chart, the results were: type_own (F(1) = 1.998; p = 0.159); type_opposite (F(3) = 0.828; p = 0.479); type_opposite*type_own (F(3) = 0.130; p = 0.942). Finally, for the Pelli–Robson chart, the results obtained were: type_own (F(1) = 2.595; p = 0.108); type_opposite (F(3) = 0.398; p = 0.755); type_opposite*type_own (F(3) = 0.871; p = 0.457).

3.4. De Boer Scale Ratings

As for subjective glare ratings, apart from the participant factor, only the light of the oncoming vehicle (F(3) = 21.969; p < 0.001) was a statistically significant predictor. As shown in Figure 6, halogen bulb reflectors were consistently rated as less glaring (between 4 and 5, i.e., “weak” to “acceptable” in terms of the adapted de Boer scale [23]) than any of the LED modules (rated between “acceptable” and “disturbing”). Neither the driver’s lights themselves (F(1) = 0.244; p = 0.621), nor the interaction of the drivers’ lights and oncoming vehicle’s lights (F(3) = 0.582; p = 0.627) played a role in the subjective glare rating, suggesting that there is probably no preadaptation to glare thanks to the driver’s own headlights.

3.5. Simple Correlations between the Measures

We also wanted to determine whether there is a correlation between subjective glare perception and any of the psychophysiological measures. As the de Boer scale was not a significant predictor in any of the linear mixed-effect models, only a very weak positive correlation (r = 0.168; p = 0.002) was found between the de Boer ratings and the average skin conductance response after each block of glare, and for the blinking frequency, the correlation was near to zero (r = 0.036; p = 0.496). However, the de Boer ratings were found to be weakly negatively correlated with age (r = −0.241; p < 0.001), suggesting that older drivers tend to subjectively perceive glare as more disturbing than younger drivers. On the other hand, age was negatively correlated with average SCR (r = −0.325; p < 0.001) after each block of glare, and positively correlated with average blinking frequency (r = 0.213; p < 0.001), indicating that older drivers’ psychophysiological responses to glare are weaker than in younger drivers. Finally, blinking frequency was weakly negatively correlated with SCR (r = −0.160; p < 0.001), suggesting that blinking actually decreases with a higher stress response.

4. Discussion

The current research aimed to establish a link between subjective glare perception in nighttime road traffic following glare by different light sources and objective psychophysiological indicators of stress known from the literature, such as SCR or blinking rate [5,6,7,8,9], in a sample of Czech drivers. Therefore, a laboratory within-subject experimental design was used, employing physiological data collection and visual acuity and contrast sensitivity charts, as well as the de Boer scale for subjective rating of perceived discomfort glare [18,19,23].
We specifically aimed to test whether the complaints of drivers on the internet [10] about being glared by “modern car headlamps” would be replicable in a controlled laboratory setting. Among other factors, we have hypothesized that being used to either halogen bulb reflectors or LEDs as “own car lights” might influence the perception of glare by the oncoming vehicle. Based on our results, such a pre-adaptation effect does not take place. Subjectively, the light sources perceived as the least glaring were the halogen bulb reflectors (also having the lowest CCT of the sources used), which is consistent with previous research [10,14,16]. No difference in subjective glare rating was observed among the three LED modules (“white”, “yellowish”, and “bluish”). However, it is noteworthy to say that due to the way the LED modules were powered, sources of different CCTs used within the experiment did not have the same luminosity at the photometric point B50L. In fact, the luminosity of the LED source with the lowest CCT (“yellowish”) was twice the luminosity of the highest CCT LED source (“bluish”). In that context, it seems advantageous to use more yellow LED bins in car headlamps, as the subjective perception of the drivers’ glare might be comparable to other LED bins, but the effectivity in terms of luminosity might be higher.
As for psychophysiological reactions to glare, blinking frequency—seemingly one of the common-sense reactions to glare—did not differ between the light samples used. It did, however, correlate weakly with the SCR, indicating that blinking decreases with a higher stress response. This would be consistent with [9], although, in their research, blinking frequency was significantly lower in the condition of higher visual discomfort. We did not find such an association between blinking frequency and subjective discomfort glare rating. For further research, however, we recommend also employing some sort of a cognitive load task in the experimental procedure, as this was found to further influence blinking frequency [9] and also seems to better reflect the driving task itself, as we argue further below.
Skin conductivity response changes depended significantly only on the light of the oncoming vehicle, where the serial “white” LED module seemed to produce lower SCR than other light sources or light source combinations. Further, the SCR did not correlate with the subjective de Boer glare ratings. This might seem surprising, as we have expected a more pronounced stress reaction following glare [5,8,9,21] and at least some degree of correlation between the subjective glare perception and the objectively measurable reaction.
We originally intended to include sympathetic and parasympathetic activity measures derived from heart rate variability (specifically the LF/HF ratio), but our data turned out to be incompatible with this analysis. HRV is usually extracted from periods notably longer than 30 s (as used in our design), because the slowest LF wave (0.04 Hz) appears in the recording once per 25 s [6]. Therefore, our recording’s length is not sufficient to reliably derive the LF spectral density. In the case of such a short time period, other cardiac measurements of stress might be more suitable, such as the evoked cardiac responses [40]. Although some researchers suggest that physiological data stabilize after 40 s (with closed eyes, however) [5], we recommend using longer periods of time in between the glares for HRV analysis or using other indicators.
When collecting psychophysiological data, environmental factors such as temperature or humidity must also be controlled for, as these could also influence the data, especially the SCR [6,7]. Similarly, participant-related factors such as medicine or coffee consumption should be taken into account (see e.g., [25]), and regular check-ups of the equipment (such as the respiratory belt) should be performed during data collection, as extensive data loss is otherwise possible.
Furthermore, when assessing drivers’ physiological reactions and visual performance, the length and number of repetitions might play a role. We have observed a pronounced effect of block sequence on most of the physiological measures, with the reactions getting weaker with each block of glare, no matter from which light source, indicating a strong effect of habituation. Therefore, for further experiments, we would recommend testing a smaller number of light samples. Further, assessing visual acuity and contrast sensitivity with standard paper charts proved to be ineffective in the within-subjects experimental design, as the participants memorized the characters with repetition. In order to prevent such an effect, digital charts with variable characters for each trial could be used. In such a case, however, one should account for the light coming from the digital chart itself and adjust the brightness and color rendering of the monitor to non-disturbing levels.
As a limitation, we should emphasize that the current experiment was not a clinical study, where drivers with healthy vision and different eye defects would be compared. Rather, we aimed at obtaining a diverse group of drivers and testing their reactions to different light sources. Although younger drivers were more represented in the current sample, the overall heterogeneity of the sample can be deemed satisfactory. This is especially relevant because of the high significance of the “participant”-factor in the statistical analyses, where inter-individual variability accounted for most of the variability explained by the linear mixed-effect models. Therefore, when testing drivers’ glare perception, we recommend aiming at a heterogeneous sample of drivers (in terms of age, gender, as well as the characteristics of their visual system).
Due to the within-subject nature of the experiment, we were not able to statistically separate individual demographic characteristics (such as the aforementioned gender, age, etc.) from the “participant” factor in the linear models; however, simple correlations indicate a link between glare perception and the drivers’ age. Older drivers seem to subjectively perceive glare as more disturbing than younger drivers, although their psychophysiological responses to glare are weaker than in younger drivers. This finding might contribute to the present evidence on the influence of different driver characteristics on glare perception [22].
Finally, for future research, we recommend employing more behavioral measures and measures of visual performance in drivers’ glare evaluations, as suggested by [11], such as including at least a simple visual detection task in the experimental procedure. As visual detection takes place naturally while driving (but not necessarily in the laboratory setting where participants were instructed to sit still and look straight ahead), the cognitive load induced might also affect drivers’ responses to glare. This would allow better comparability of laboratory glare assessments with experiments in natural settings.
Other variables, as well as the experimental setting and instruction itself [19,22], might also influence results, so it is crucial to develop and follow a unified methodology for assessing glare perception by drivers [17]. For example, several of our participants spontaneously mentioned that “the glare events have been relatively short, so they weren’t so bad”, indicating that the duration of glare might have influenced the obtained results [13], though [37] did not find any significant changes in glare perception as a function of glare duration. This presents a point of interest for future research.

5. Conclusions

In terms of the influence of CCT and the gradient of the light distribution (cut-off line) of different light sources in car headlamps on drivers’ glare perception, these factors do seem to play a role [15,22], despite the headlamps being well within the legal photometric and colorimetric limits [2,3]. Therefore, we recommend testing new car headlamps on driver samples using subjective as well as at least some objective physiological methods, in addition to the traditional goniophotometer tests performed in the automotive industry. In concordance with other research [16,20], our findings suggest that the relationship between subjective glare perception and the underlying physiological mechanisms is probably more complex than what can be assessed with single/individual psychophysiological methods. Inter-individual differences also seem to play a greater role in glare perception than was previously thought; based on our results, assuming that something such as a “universal” or “average” observer exists is probably erroneous. Furthermore, variables pertaining to the testing situation might influence the results as well; therefore, developing and using a unified methodology for assessing the glare perception by drivers would be advantageous [17]. This paper proposes a variant of such a methodology suitable for laboratory experiments and discusses possible further developments.

Author Contributions

Conceptualization: L.V. and L.S.; methodology: L.S., L.V. and T.D.; analysis: T.D.; investigation: L.V.; resources: L.V. and L.S.; data curation: T.D.; writing—original draft preparation: L.S. and L.V.; data analysis section by T.D.; writing—review and editing: L.V., T.D. and L.S.; visualization: L.S. and L.V.; supervision, L.V.; project administration: L.V.; funding acquisition: L.V. and L.S. All authors have read and agreed to the published version of the manuscript.

Funding

This research was funded by the Technology Agency of the Czech Republic (TA ČR), program Éta 2, project number TL02000183, “Human and traffic safety in the development of lighting technologies“ [Člověk a bezpečnost v dopravě v souvislosti s rozvojem světelných technologií].

Institutional Review Board Statement

The study was conducted according to the guidelines of the Declaration of Helsinki and was approved by the Ethics Committee of the Department of Psychology, Faculty of Arts, Palacký University Olomouc, Czech Republic.

Informed Consent Statement

Informed consent was obtained from all subjects involved in the study.

Data Availability Statement

The data presented in this study are available on request from the corresponding author. The data are not publicly available due to the formulations in the informed consent that the participants signed.

Acknowledgments

The authors acknowledge the patience of all our participants during our experiments and their will to participate in the project despite the complicated pandemic situation at the time of data collection. The authors also acknowledge the support of the prototype workshop employees of the Hella Autotechnik Nova, s.r.o., Mohelnice, Czech Republic, which creatively co-designed and manufactured various laboratory equipment essential to conducting this experiment.

Conflicts of Interest

Ladislav Stanke was an employee of the automotive lighting company Hella Autotechnik Nova, s.r.o., Mohelnice, Czech Republic, in the position of Lead Lighting Engineer during the initial phase of the project, with the aim of increasing collaboration between academia and the private sector, which was conducted as a collaboration between the Palacký University Olomouc and the Hella Autotechnik Nova, s.r.o., Mohelnice, Czech Republic. Stanke was mainly involved in the preparation of light samples and the design of the laboratory environment, as well as its equipment. He was not directly involved in psychophysiological measurements or their interpretations, and the company employees, in general, did not affect data collection, analysis, interpretation, and/or publication in any way. Furthermore, the funders (TA ČR) had no role in the design of the study; in the collection, analyses, or interpretation of data; in the writing of the manuscript, or in the decision to publish the results.

References

  1. Babizhayev, M.A. Glare Disability and Driving Safety. Ophthalmic Res. 2003, 35, 19–25. [Google Scholar] [CrossRef] [PubMed]
  2. United Nations. Agreement Concerning the Adoption of Uniform Technical Prescriptions for Wheeled Vehicles, Equipment and Parts which can Be Fitted and/or Be Used on Wheeled Vehicles and the Conditions for Reciprocal Recognition of Approvals Granted on the Basis of These United Nations Regulations. (Revision 3, Including the Amendments Which Entered into Force on 14 September 2017), Addendum 47: UN Regulation No. 48, Revision 12, Amendment 8; United Nations: New York, NY, USA, 2019; Available online: https://unece.org/fileadmin/DAM/trans/main/wp29/wp29regs/2019/E-ECE-324-Rev.1-Add.47-Rev.12-Amend.8.pdf (accessed on 14 December 2019).
  3. SAE International. SAE J1383 (R) Performance Requirements for Motor Vehicle Headlamps; SAE International: Warrendale, PA, USA, 2018. [Google Scholar] [CrossRef]
  4. Kent, M.G.; Fotios, S.; Altomonte, S. Discomfort glare evaluation: The influence of anchor bias in luminance adjustments. Light. Res. Technol. 2019, 51, 131–146. [Google Scholar] [CrossRef]
  5. Shi, L.; Zhang, Y.; Wang, Z.; Cheng, X.; Yan, H. Luminance parameter thresholds for user visual comfort under daylight conditions from subjective responses and physiological measurements in a gymnasium. Build. Environ. 2021, 205, 108187. [Google Scholar] [CrossRef]
  6. Andreassi, J.L. Psychophysiology: Human Behavior and Physiological Response; Routledge: London, UK, 2006. [Google Scholar]
  7. Cacioppo, J.T.; Tassinary, L.G.; Berntson, G. (Eds.) Handbook of Psychophysiology, 3rd ed.; Cambridge University Press: Cambridge, UK, 2007. [Google Scholar]
  8. Hamedani, Z.; Solgi, E.; Skates, H.; Hine, T.; Fernando, R.; Lyons, J.; Dupre, K. Visual discomfort and glare assessment in office environments: A review of light-induced physiological and perceptual responses. Build. Environ. 2019, 153, 267–280. [Google Scholar] [CrossRef]
  9. Hamedani, Z.; Solgi, E.; Hine, T.; Skates, H.; Isoardi, G.; Fernando, R. Lighting for work: A study of the relationships among discomfort glare, physiological responses and visual performance. Build. Environ. 2020, 167, 106478. [Google Scholar] [CrossRef]
  10. Bullough, J.D.; Fu, Z.; Van Derlofske, J. Discomfort and Disability Glare from Halogen and HID Headlamp Systems (No. 2002-01-0010); SAE Technical Paper; SAE International: Warrendale, PA, USA, 2002; Available online: https://pdfs.semanticscholar.org/2ab1/db31c1587b4b150126278b0b282dccf82456.pdf (accessed on 15 April 2019).
  11. Theeuwes, J.; Alferdinck, J.W.; Perel, M. Relation between glare and driving performance. Hum. Factors 2002, 44, 95–107. [Google Scholar] [CrossRef] [Green Version]
  12. Bullough, J.D.; Van Derlofske, J.; Dee, P.; Chen, J.; Akashi, Y. An Investigation of Headlamp Glare: Intensity, Spectrum and Size (No. HS-809 672); National Highway Traffic Safety Administration: Washington, DC, USA, 2004. Available online: https://www.nhtsa.gov/sites/nhtsa.dot.gov/files/final-report_rpi_glare_spectrum.pdf (accessed on 24 May 2019).
  13. Skinner, N.P.; Bullough, J.D. Influence of Intensity, Duration and Spectral Characteristics on Glare Recovery for Peripheral Visibility; SAE Technical Paper; SAE International: Warrendale, PA, USA, 2020. [Google Scholar] [CrossRef]
  14. Fekete, J.; Sik-Lányi, C.; Schanda, J. Night-Time Driving–New Light Sources in Car Headlamps–Visibility and Glare; CIE Midterm Meeting and Congreso Internacional de Iluminación: Léon, Spain, 2005; Available online: https://www.researchgate.net/profile/Cecilia-Sik-Lanyi/publication/228630501_Night-time_driving-new_light_sources_in_car_headlamps-visibility_and_glare/links/09e415143318e23c5d000000/Night-time-driving-new-light-sources-in-car-headlamps-visibility-and-glare.pdf (accessed on 25 April 2019).
  15. Shim, J.Y.; Park, S.-C. Correction and Evaluation for Color Aberration on the Cut-off Line of a Vehicle Headlamp. Korean J. Opt. Photonics 2019, 30, 8–14. [Google Scholar] [CrossRef]
  16. Kooi, F.L.; Alferdinck, J.W.A.M. Yellow Lessens Discomfort Glare: Physiological Mechanism(s); F-WR-2003-0023-H Report; TNO Human Factors: Soesterberg, The Netherlands, 2004. [Google Scholar]
  17. Sivak, M.; Olson, P.L. Toward the development of a field methodology for evaluating discomfort glare from automobile headlamps. J. Saf. Res. 1988, 19, 135–143. [Google Scholar] [CrossRef] [Green Version]
  18. De Boer, J.B. (Ed.) Visual perception in road traffic and the field of vision of the motorist. In Public Lighting; Philips Technical Library: Eindhoven, The Netherlands, 1967; pp. 11–96. [Google Scholar]
  19. Gellatly, A.W.; Weintraub, D.J. User Reconfigurations of the de Boer Rating Scale for Discomfort Glare; Report No. UMTRI-90-20; The University of Michigan: Ann Arbor, MI, USA, 1990; Available online: https://deepblue.lib.umich.edu/bitstream/handle/2027.42/64065/79690.pdf?sequence=1&isAllowed=y (accessed on 25 April 2019).
  20. Iodice, M.; Jost, S.; Dumortier, D. Testing experimental methods for discomfort glare investigations. In Proceedings of the 29th CIE Session, Washington, DC, USA, 14–22 June 2019; International Commission on Illumination, CIE: Vienna, Austria, 2019; pp. 317–324. [Google Scholar]
  21. Lee, H.S.; Kim, J.Y.; Subramaniyam, M.; Park, S.; Min, S.N. Evaluation of quantitative glare technique based on the analysis of bio-signals. Ergonomics 2017, 60, 1376–1383. [Google Scholar] [CrossRef]
  22. Pierson, C.; Wienold, J.; Bodart, M. Review of factors influencing discomfort glare perception from daylight. Leukos 2018, 14, 111–148. [Google Scholar] [CrossRef]
  23. Viktorová, L.; Dominik, T.; Stanke, L.; Dostál, D. Člověk a světlo: (Re)konstrukce deBoerovy škály pro oslnění v českém jazyce. Jemná Mech. Opt. 2020, 3, 82–84. [Google Scholar]
  24. McCamy, C.S. Correlated color temperature as an explicit function of chromaticity coordinates. Color Res. Appl. 1992, 17, 142–144. [Google Scholar] [CrossRef]
  25. Hara, A.; Ohide, H.; Miyagawa, K.; Takeuchi, T.; Nakatani, Y.; Yokoyama, H.; Amano, T. Acute Effects of Caffeine on Blood Pressure and Heart Rate in Habitual and Non-Habitual Coffee Consumers: A Randomized, Double-Blind, Placebo-Controlled Study. Iryo Yakugaku (Jpn. J. Pharm. Health Care Sci.) 2014, 40, 383–388. [Google Scholar] [CrossRef] [Green Version]
  26. Piquet-Thepot, M.-M. Contribution à l’anthropologie des Corses: Anthropologie de la tête (suite). Bull. Mem. Soc. D’anthropol. Paris 1968, 3, 183–218. [Google Scholar] [CrossRef]
  27. Nischler, C.; Michael, R.; Wintersteller, C.; Marvan, P.; van Rijn, L.J.; Coppens, J.E.; van den Berg, T.J.T.P.; Emesz, M.; Grabner, G. Iris Color and Visual Functions. Arbeitsphysiologie 2013, 251, 195–202. [Google Scholar] [CrossRef] [PubMed]
  28. Stringham, J.M.; Garcia, P.V.; Smith, P.A.; McLin, L.N.; Foutch, B.K. Macular Pigment and Visual Performance in Glare: Benefits for Photostress Recovery, Disability Glare, and Visual Discomfort. Investig. Ophthalmol. Vis. Sci. 2011, 52, 7406–7415. [Google Scholar] [CrossRef] [Green Version]
  29. Marié, S.; Montés-Micó, R.; Martínez-Albert, N.; García-Marqués, J.V.; Cerviño, A. Evaluation of Physiological Parameters on Discomfort Glare Thresholds Using LUMIZ 100 Tool. Transl. Vis. Sci. Technol. 2021, 10, 28. [Google Scholar] [CrossRef]
  30. Broschmann, D.; Kuchenbecker, J. Plates for Color Vision Testing; Thieme Publishing Group: Stuttgart, Germany, 2013. [Google Scholar]
  31. Singh, G.; Bhinder, H.S. Closed Chamber Thermometry and Humidity Measurements in Normal and Dry Eye Patients: A Pilot Study. Eur. J. Ophthalmol. 2003, 13, 343–350. [Google Scholar] [CrossRef]
  32. Tsubota, K.; Yamada, M. Tear Evaporation from the Ocular Surface. Investig. Ophthalmol. Vis. Sci. 1992, 33, 2942–2950. [Google Scholar]
  33. Puell, M.C.; Benítez-del-Castillo, J.M.; Martínez-de-la-Casa, J.; Sánchez-Ramos, C.; Vico, E.; Pérez-Carrasco, M.J.; Pedraza, C.; del-Hierro, A. Contrast Sensitivity and Disability Glare in Patients with Dry Eye. Acta Ophthalmol. Scand. 2006, 84, 527–531. [Google Scholar] [CrossRef]
  34. Huang, F.-C.; Tseng, S.-H.; Shih, M.-H.; Chen, F.K. Effect of Artificial Tears on Corneal Surface Regularity, Contrast Sensitivity, and Glare Disability in Dry Eyes. Ophthalmology 2002, 109, 1934–1940. [Google Scholar] [CrossRef]
  35. Maheshkumar, K.; Dilara, K.; Maruthy, K.N.; Sundareswaren, L. Validation of PC-Based Sound Card with Biopac for Digitalization of ECG Recording in Short-Term HRV Analysis. N. Am. J. Med. Sci. 2016, 8, 307–311. [Google Scholar] [CrossRef] [PubMed] [Green Version]
  36. Silva Moreira, P.; Chaves, P.; Dias, R.; Dias, N.; Almeida, P.R. Validation of Wireless Sensors for Psychophysiological Studies. Sensors 2019, 19, 4824. [Google Scholar] [CrossRef] [PubMed] [Green Version]
  37. Westermann, H. Informal Document No. 30 (48th GRE, 9–12 April) 2002 (Agenda Items 1.2 and 4.2) History and Scientific Back-Up; United Nations: New York, NY, USA, 2002; Available online: https://unece.org/DAM/trans/doc/2011/wp29gre/GRE-48-30e.pdf (accessed on 17 May 2021).
  38. Boucsein, W. Electrodermal Activity; Springer: Boston, MA, USA, 2012. [Google Scholar]
  39. Stern, R.M.; Ray, W.J.; Quigley, K.S. Psychophysiological Recording, 2nd ed.; Oxford University Press: New York, NY, USA, 2001. [Google Scholar]
  40. Lawrence, C.A.; Barry, R.J. ERPs and the Evoked Cardiac Response to Auditory Stimuli: Intensity and Cognitive Load Effects. Acta Neurobiol. Exp. 2009, 69, 552–559. [Google Scholar]
Figure 1. Participant distribution by age and gender.
Applsci 12 03847 g001
Figure 2. Two-lane night-time traffic simulation laboratory. (a) Driver’s viewpoint of the laboratory—the left “opposing lane” with a carousel simulating an oncoming vehicle, and the right “driver’s lane” with the driver’s light sources and target eye charts placed at a distance; (b) driver’s placement in the laboratory. For the actual experiment, the black curtain completely covered the white wall.
Applsci 12 03847 g002
Figure 3. Experimental procedure.
Applsci 12 03847 g003
Figure 4. Relationship between SCR and the combination of the driver’s and the oncoming traffic’s headlights.
Applsci 12 03847 g004
Figure 5. Relationship between eye-blinking frequency and the combination of driver’s and oncoming traffic headlights.
Applsci 12 03847 g005
Figure 6. Relationship between the adapted de Boer scale ratings and the combination of the driver’s and the oncoming traffic’s headlights.
Applsci 12 03847 g006
Table 1. Homologation and Conformity of Production (CoP) photometry requirements in candelas for several photometry test points.
Photometry Test PointHomologation ValueCoP Value
HVmax. 625 cdmax. 880 cd
BRmax. 1750 cdmax. 2100 cd
B50L 1max. 350 cdmax. 520 cd
50Lmax. 18,480 cdmax. 15,840 cd
75Rmin. 10,100 cdmin. 8080 cd
1 Oncoming driver glare point. These photometric values are derived with the use of the standard V(λ) curve.
Table 2. Left light samples and their main photometric values as per ECE standards.
Photometry Test Point
and Gradient
Halogen Bulb ReflectorSeries LED
Module
Bluish LED
Module
Yellowish LED
Module
HV427 cd356 cd206 cd1323 cd
BR249 cd241 cd205 cd430 cd
B50L 1234 cd185 cd139 cd369 cd
50L8028 cd8517 cd7502 cd14,900 cd
75R13,598 cd18,440 cd13,340 cd28,360 cd
Gradient0.2990.2950.4130.212
1 Oncoming driver glare point.
Table 3. Right light samples and their main photometric values as per ECE standards.
Photometry Test Point
and Gradient
Halogen Bulb ReflectorSeries LED
Module
Bluish LED
Module
Yellowish LED
Module
HV475 cd436 cd248 cd558 cd
BR261 cd275 cd199 cd298 cd
B50L 1267 cd238 cd205 cd271 cd
50L5934 cd13,280 cd7732 cd7536 cd
75R15,256 cd25,730 cd12,260 cd22,150 cd
Gradient0.2330.2910.3770.198
1 Oncoming driver glare point.
Publisher’s Note: MDPI stays neutral with regard to jurisdictional claims in published maps and institutional affiliations.

