Article

An Analysis of Selected Technological Parameters’ Influences on the Tribological Properties of Products Manufactured Using the FFF Technique

Department of Technology, Materials and Computer Supported Production, Faculty of Mechanical Engineering, Technical University of Košice, Mäsiarska 74, 040 01 Košice, Slovakia
*
Author to whom correspondence should be addressed.
Appl. Sci. 2022, 12(8), 3853; https://doi.org/10.3390/app12083853
Submission received: 28 February 2022 / Revised: 1 April 2022 / Accepted: 5 April 2022 / Published: 11 April 2022
(This article belongs to the Special Issue Advanced Manufacturing Technologies: Development and Prospect)

Abstract

:
This study investigates how layer deposition in printing 3D models made of polyetherimide (PEI) using the fused filament fabrication (FFF) technique affects resistance of these models to abrasive wear. Samples made by additive manufacturing with different setting of build orientation and path generation strategy of extruded fibers were used in the experiment. The experiments were conducted on a tribometer according to the ASTM G65-16 standard. The friction force, normal force, and temperature in the contact area during the tribometer operation were measured using a strain gauge sensor. The tribometer allowed us to perform the tribological experiments using a rubber-coated or a metal disc without a lubricant in the so-called “dry” operation. Following the ASTM G65-16 standard, a rubber-coated disc and Fe3Al2 (SiO4)3 garnet abrasive were used for the wear resistance tests. The analysis of experimental data showed correlations among orientation selection, the strategy of layer deposition by the FFF technique, and the surface life in terms of abrasive wear. The results of this research also showed the suitability of the chosen building orientation and deposition strategy for part production by additive manufacturing, depending on the required tribological properties, such as the coefficient of friction (yield path) and wear behavior. Based on the results of the study, it is concluded that continuity of wear and friction force depends on the path traveled under the model production orientation. The size of wear (material loss) ranged from 0.451–0.809%. It was shown that the weight loss of the sample under loading was greater, on average, with the chosen fiber orientation strategy in the Z direction than in the X direction.

1. Introduction

One of the technologies for processing plastics is the 3D printing technology namely fused filament fabrication (FFF). In technical practice, it is a widely used technique due to its ease of use, low cost of input material, and minimal waste generated by the process. The FFF technique can reduce production costs of a product while maintaining high reliability of plastic parts [1,2]. In the field of 3D printing, a number of research activities have been carried out in order to examine the mechanical properties of components which have been produced using new technological processes. Strength, stiffness, weight, and other properties of components made by 3D printing depend on various conditions such as layer thickness and height, shell thickness, and fill density. The most common materials used in 3D printing are acrylonitrile butadiene styrene (ABS) and polylactic acid (PLA). Many studies have addressed the mechanical properties of 3D-printed parts; a study by Bellini et al. [3] was among the most notable studies, which investigated the tribology of 3D-printed parts and mainly focused on the mechanical properties of polymeric materials, in particular, PLA material [4,5,6,7]. However, research on the ULTEM 9085 material is lacking.
Research by Song et al. aimed to measure the mechanical wear of 3D-printed parts made of PLA [8]. Mechanical properties of colored PLA types were described by Wittbrodt et al. [9]. Research by Es-Said et al. addressed ABS plastic parts, the influence of orientation of the individual printed layers, and their mechanical properties, such as tensile strength and impact resistance [10]. Suitable orientation of a part in 3D printing can affect the structure of its surface (roughness), which affects the tribological properties of components manufactured in such a way [11]. Lack of information about the tribological properties of components produced by 3D printing can in practice lead to their excessive wear and subsequent failure of function. Dawoud et al. investigated tribological properties such as the coefficient of friction and wear behavior in samples produced by 3D printing from ABS material [12]. Panneerselvam et al. described the tribological behavior of ABS composites with added alumina [13]. Gurrala and Regalla et al. reported that tribological properties of 3D-printed polymer components could generally be improved by appropriate settings of the printing parameters [14,15]. These studies were followed by Hanon et al., who took temperature and the color of the fiber into consideration [16].
Gurrala and Regalla conducted research on the friction and wear of ABS polymer produced using the FFF technique. They took note of three parameters: (1) load, (2) speed, and (3) face-centered central composite design (FCCCD) orientation and their influences on the coefficient of friction as well as abrasive wear. It was shown that yield speed was affected by the friction of a firmer load [14,17]. Parts manufactured using the FFF technique show unevenness, but as the surface smoothens over time, the coefficient of friction decreases and becomes stable. Damage to contact surfaces is usually caused by wear and tear such as abrasion, fatigue, and surface undulation, or erosion and cavitation. Abrasive wear often leads to irreversible changes to the surface of a part which leads to a change between the bonds of the material particles. The friction coefficient usually rises sharply from low values to a peak value and stabilizes at slightly lower value following nearly linear curve [18].
Optimization of parameters from the point of view of tribology was addressed by Norani et al., who analyzed the coefficient of friction and wear rate of components made of ABS using the (Box–Behnken Design) methodology [18,19,20]. The study found that layer height significantly affected the coefficient of friction (COF) and the wear rate; a layer height of 0.10 mm, a temperature of 234 °C, and the use of an oblique print pattern were the most optimal parameters for minimizing the COF (0.2788) and the wear rate (2.1136 × 10⁻⁴ mm3/Nm).
Another study by Garg et al. compared the behavior of an ABS component in the course of wear with a component made of Nylon6-Fe composite prepared using the FFF technique. ABS was found to have a higher COF (0.35 μm) than the Nylon6-Fe composite (0.26 μm). Wear of the ABS (0.15 g) was much greater than wear of the composite (0.01 g). The Nylon6-Fe composite showed much lower weight loss, indicating that it had very high wear resistance. This could be attributed to the presence of Fe in the composite. The wear that occurred was caused by a combination of abrasion and adhesion. Therefore, higher wear occurred at higher feed rates. This was the case for both ABS and composite materials [15,21].
Tahir et al. concluded that the internal cavities between fibers were 100% due to the absence of material, which improved the absorption of fluids, because 3D-printed samples had two to four times higher absorption rate as compared with pressed ABS samples [22]. In a study by Elsner et al., it was suggested that this higher rate of absorption facilitated microelastohydrodynamic lubrication (EHL) and also increased lubricant capacity in the component. Nevertheless, the 3D-printed ABS had a higher COF (0.040 to 0.055) due to fractures or cracks, and thus, increased the actual contact area of the component. This led to an increase in temperature and a decrease in strength of the material, which resulted in increased friction [20,23,24]. The main mechanism causing the wear of polymers and their composites is abrasive wear. As wear increases, the surface roughness smoothens and the effect of wear decreases. At the same time, increasing the load smoothens the yield surfaces through plastic deformation and evens out irregularities. This is likely to increase lubricant wear and to reduce the rate of friction as the yield surfaces become smoother [25,26]. In addition to these studies, other authors have reached similar conclusions based on their research on the wear of 3D-printed polymer components [26,27,28].
The yield properties of ABS pins were also investigated by Abdollah et al. (2020). In their research, the pins were printed with different internal geometries, and then, were subjected to wear tests under varying normal loads and feed rates. The results showed that under the wear test conditions of 58.68 N and 800 rpm, the pins with an internal triangular structure had a minimum COF value of 0.27 and a wear rate of 2.7 × 10⁻⁵ mm3/Nm. This suggested that wear rates and COF values were relatively dependent on normal load, feed rates, and internal geometry. The internal triangular structure had lower maximum stresses distributed over the contact surface, and there was no statistically significant correlation between tribological and mechanical properties of the ABS pins, which had been 3D-printed with different internal geometries. Abrasion and lower fatigue wear were considered to be the main wear mechanisms that caused mild and severe wear [29].
It has been found that 3D-printed ABS pins with an internal triangular flip structure have the most favorable shortest run-in time and the lowest COF with high wear resistance [30].
The current state of scientific knowledge aimed at determining the tribological properties of componets produced using the FFF technique has mostly focused on the materials most frequently used in technical practice (PLA and ABS) [31]. Knowledge of the tribological properties of materials used in the FFF technique to a lesser extent, such as PEI, is currently lacking. In terms of their prospective use, as well as their use under demanding conditions, the application of high-performance materials in components manufactured using the FFF technique will be unavoidable, and this is associated with the need to know their tribological properties. The present study aims at determining the tribological properties of PEI (polyetherimide) production parts manufactured using the FFF technique.
The summary of research, in Table 1, shows that the polymers and binders have good tribological properties, and their application in technical practice is beginning to be justified [32,33,34,35].

2. Materials and Methods

2.1. Method of Sample Preparation

The samples were produced by Fortus 400mc (Stratasys®, Eden Prairie, MN, USA) 3D printer, with default melting temperature of 380 °C. ULTEM9085 (Stratasys®, Eden Prairie, MN, USA) was chosen as the test material, which is a highly effective thermoplastic material suitable for digital production and rapid prototyping. It is ideal for the transport industry due to its high strength-to-weight ratio and flame, smoke, and toxicity (FST) rating [35].
The sample preparation experiment was conducted using two types of thermoplastic layer extrusions, with five deposition strategies in terms of individual fibers’ orientations. Three identical samples were made for each fiber type and orientation, for a total of 30 samples. The samples were block shaped, each with a size of 70 × 20 × 6 mm (a × b × c) (Figure.1) and the contact surface in contact with the rotating disc was a 70 × 20 mm wall of the sample that was compatible with the tribometer sample holder. The extruded samples were all 6 mm thick. The samples marked with an X were printed in the horizontal direction, while samples marked with a Z were printed in the vertical direction (Figure 1).
After the sample preparation experiment, samples were cleaned with an ultrasonic cleaner for 30 min in a pure ethanol bath and their surfaces were observed under a Leica S9i microscope. Preprocessing was done using the INSIGHT software under default settings for the material used.

2.2. Measurements

The measurements were performed at the Technical University in Košice in the Tribological laboratory under constant ambient conditions.
The degree of wear of surface layers was monitored during the testing, depending on the yield path and load. At the same time, the different effects of abrasive particles on the wear of the samples were investigated. Depending on the requirements, it was possible to change the size of the load and the speed of the disc rotation (so-called yield speed). The magnitude of the load was based on the load unit [36]. The device could test samples with different physical and mechanical properties. The advantage of this technical solution was that it had the ability to record the friction force, normal force, and temperature of the sample during the testing process (Figure 2). The parameter settings during the testing process are shown in Table 2.
The tribometer ensured the creation of conditions for abrasive wear by the particles (Figure 2, 9) poured in from the hopper (Figure 2, 6). Prior to the testing process, it was possible to adjust the magnitude of the normal force by fixing and positioning the weight on the lever; the normal force was measured by means of a force sensor (Figure 2, 2) located in the arm (Figure 2, 7). The arm with the test sample holder was mounted with a pin enabling its rotation (Figure 2, 5). To measure the friction force between the sample (Figure 2, 1) and the rotating disc (Figure 2, 4), a friction force sensor (Figure 2, 3) was placed in the load (Figure 2, 8). Yield speed (rotation) was controlled to produce the required value of the time course of the motion or the number of cycles. The electric motor used in the experiment ensured stable operation and friction conditions.
The wheel consisted of a steel disk with an outer layer of neoprene rubber molded to its periphery The rubber was made of Elastomer-Neoprene GW. The durometer hardness of the rubber was A-60.

2.3. Experimental Parameters

The samples were weighed at 0.0001 g before and after testing to detect volume loss. Fifteen ASTM G65-16 tests with Fe3Al2 (SiO4)3 garnet abrasive for the orientation in the X direction (X-orientation) and 15 tests for the orientation in the Z direction (Z-orientation) were conducted to determine the weight loss arithmetic mean and the standard deviation.
The three-point abrasive process involved free particles that can move freely (the abrasive). The testing procedure used garnet abrasive (AFS 50–70) with a particle size of 200 micron, as specified in the norm ASTM G65-16. The composition of the abrasive used is given in Table 3. Figure 3 shows a snapshot of the structure of the abrasive used.
The samples used in the experiment were printed using ten different production strategies in which the orientation of the production changed (Figure 1) and, therefore, the angle of application of the fibers in the layers (Figure 4). Three samples were produced from each strategy, and the weight loss was determined as the average of the weight loss of individual samples of the same production strategy. The same rubber disc was used in all tests to eliminate any variations in rubber chemical composition or hardness.

2.4. Experimental Samples

The toolpath generated for sample production was done under default parameters (0.254 mm layer height and 0.5 mm fiber width) in the Stratasys INSIGHT 9.0™ software (Stratasys®, Eden Prairie, MN, USA). The fiber deposition strategies in the X- and Z-orientations are shown in Figure 4 and Table 3, respectively.
The first column of the two strategies (marked in red) corresponds to the odd layer deposited by the FFF technique, and the printing process also finished with this layer. Thus, the column on the right shows the evenly printed layers at the beginning of the printing process. As we can see, Samples 2, 3, 4, 7, 8, and 10 have the same fiber orientation in all deposited layers, whereas the fiber orientation of the layers in Samples 1, 5, 6, and 9 is alternating (Table 4). The samples used in the experiment are shown in Figure 5.
Subsequently, the prepared samples were used in the abrasive test, where their resistance to abrasive wear was evaluated based on the weight loss of the material and the coefficient of friction and wear rate.
Table 5 shows the values of the initial weight of the sample before the abrasive test, the values of the weight loss of the material, and the percentage of this loss. Weight loss ranged from 0.967% (Samples 3) to 0.451% (Sample 5) (Table 5). This number shows that more material was consumed for the Z-orientation samples and that there was also a greater loss of material because of the abrasive wear.

3. Evaluation of the Measured Values

Experiments were carried out to determine the influence of the samples building orientation and deposition strategy on the coefficient of friction course and wear behavior. Three samples were made with each type of fiber orientation. A total of 30 samples were tested with a tribometer according to ASTM G65-16 (dry sand).

3.1. Comparisons of Samples 1–5

From the measured values of the resistance of the material to abrasive wear, dependences of the weight of the material on the type of fiber deposition strategy in the FFF process were recorded. Table 6 shows the weight losses of the individual samples and the average weight losses under each strategy.
The plotted dependence of the samples with fiber deposition in the X-orientation (Figure 6) following the ASTM G65-16 tests shows the weight losses of the materials tested. Among these, Sample 3 showed the lowest resistance to abrasive wear and, thus, the greatest material loss (material loss was below 0.14 g), where the fiber deposition strategy was identical to the direction of wear (0°). The second largest weight loss was shown in Sample 2 (material loss was below 0.09 g), where the fiber deposition strategy was the same in both layers under a 45° angle and Sample 1 (material loss was below 0.08 g), with the fiber deposition strategy under a 45° angle (left) in the even layer and under a 45° angle (right) tilted in the opposite direction in the odd layer. Sample 5 showed the greatest resistance to abrasive wear according to weight loss, with the orientation alternating between 0° and 90° as well as Sample 4 with a 90° strategy in both layers with respect to direction of wear. The material loss in Samples 4 and 5 was below 0.06 g.
To determine the effect of the layer deposition strategy on the tribological properties of the surface, we subtracted weight losses between the samples similar in fiber orientation and different only by individual layers. This loss is expressed numerically in Table 7 and is represented graphically in Figure 7. Comparing the layers, it can be confirmed that the layers parallel to the direction of wear show a greater surface resistance to abrasion.
The graphs in Figure 6 and Figure 7 for the X-orientation clearly show that fiber orientation has a significant effect on the abrasive wear of Samples 1–5. If the fibers are laid in the same direction in all layers, this results in a greater loss of material, as shown in the graph in Figure 6. Sample 3, with the fiber deposition strategy under 0° and, thus, parallel to direction of wear in both the even and the odd layer, with a material loss of 0.134 g, showed the most significant wear. Due to a change in the fiber deposition strategy, a smaller weight loss was recorded in Sample 2 under a 45° fiber deposition strategy with the same tilt in the even and the odd layer with a material loss of 0.0847 g, and in Sample 1 under a 45° angle of fiber deposition strategy with opposite slope in the even and the odd layers, with a material loss of 0.0729 g. Sample 5 (with the strategy of fiber deposition parallel to the direction of wear in even layers and perpendicular to the direction of wear in odd layers) with a material loss of 0.0631 g and Sample 4 (with the strategy of fiber deposition perpendicular to direction of the fibers) with a material loss of 0.0641 g showed the highest resistance of the material to abrasive wear in terms of orientation of fibers in even and odd layers.
The difference in weight between the largest and smallest weight loss, i.e., between Samples 3 and 5, is 0.0709 g.

3.2. Comparisons of Samples 6–10

Table 8 shows the weight loss of the individual samples and the average weight loss under each strategy.
The plotted dependence of the samples with Z-orientation fiber deposition (Figure 8) after the ASTM G65-16 tests shows the weight loss of the materials tested. Among these, Sample 8 (material loss was more than 0.11 g) showed the lowest resistance to abrasive wear and, thus, the largest weight loss of the material, where the fiber deposition strategy was in the horizontal plane (90°) in both layers with respect to direction of wear. The second largest weight loss was shown in Sample 7 (material loss was just over 0.11 g) with the fiber deposition strategy under 45° in both the even and the odd layers in the same direction. Sample 9 followed (material loss exceeded 0.10 g), where the fiber deposition strategy in the even layer was under the 90° angle in the direction of wear and, in the odd layer, the orientation was perpendicular to direction of wear. This was followed by Sample 10 with a strategy of fiber deposition parallel to the direction of wear in both layers with a weight loss just below 0.10 g. Sample 6 showed the greatest resistance to abrasive wear due to weight loss, with alternating strategies under a 45° angle in the layers. The loss of material in Sample 6 was just over 0.09 g.
To determine the effect of the layer deposition strategy on the tribological properties of the surface, we subtracted weight losses between the samples similar in fiber orientation and different only by individual layers. This loss is expressed numerically in Table 9 and represented graphically in Figure 9.
From the comparison of the layers, we can see higher abrasion resistance of the surface layers perpendicular to the direction of wear. However, the greatest abrasion resistance, in this case, is shown in Sample 6, with the fiber orientation under a 45° angle, but with the opposite tilt in the individual layers.
In samples extruded vertically (with Z-orientation of fiber extrusion, Samples 6–10), the values of the variance of weight loss are not as large as in the samples with the X-orientation (Figure 9).
In Samples 6–10, the layering strategy is not significant in nature. When the fibers are laid in the same direction in all layers, this results in a greater loss of material, as shown graphically in Figure 9. Sample 8 (with the fiber deposition strategy under a 90° angle with respect to the direction of wear in both the even and the odd layers) which had a material loss of 0.1177 g, and Sample 7 (with fibers deposition strategy under the same 45° angle in both layers) which had a material loss of 0.1143 g, showed the greatest wear. Due to a change in fiber deposition orientation, smaller weight losses were recorded for Sample 9 (with the fiber deposition strategy under the 90° angle with respect to the direction of wear in the even layer and perpendicular to the wear in the odd layer), with a material loss of 0.1074 g, Sample 10 (with fibers deposition strategy perpendicular to direction of wear in the even and the odd layers), with a material loss of 0.0988 g, and Sample 6 (with the fibers oriented under a 45° angle with respect to the direction of wear in even layers and the opposite strategy under a 45° angle in odd layers) with a material loss of 0.0933 g, and therefore, these samples showed the greatest resistance of the material to abrasive wear in terms of the fiber deposition strategy.

3.3. Monitoring of Friction Force

Another monitored parameter was friction force, which was directly measured and read from the tribometer. The course of friction force depends on many parameters such as the material’s mechanical properties, contact pressure value, the coefficient of friction, contact surface roughness, mutual dissolution of materials, contact time, tribosystem elasticity, and the presence of foreign bodies in the contact zone. The results of the friction forces as a function of the path traveled for the X and Z-orientations are shown in Figure 10 and Figure 11.
The graph in Figure 10 shows that the friction force increases from the initial value at the beginning of the experiment and stabilizes over a 50–60 m long path, where it then oscillates around a certain value until the end of the experiment. The friction force was lower at the beginning of the testing procedure than at the end of the testing procedure. The lowest friction force at the beginning of the experiment can be observed in Sample 5, which remains the lowest at the end, together with the friction force in Sample 4.
The highest friction force in samples with X-orientation (Samples 1–5) was recorded in Sample 3, where the fiber deposition orientation was parallel to the direction of wear (under 0° angle with respect to tested sample wall) and Sample 2, where the fiber orientation was under 45° angle and in both layers. Samples with a lower friction force followed, such as Sample 1, with a 45° orientation but the opposite tilt in the even and the odd layer.
The graph in Figure 11 shows a similar course of friction as in the X-oriented samples, i.e., that the friction force increases from the initial value at the beginning of the experiment and stabilizes along a 40–50 m long path, where it then oscillates around a certain value until the end of the experiment. The lowest friction force at the beginning of the experiment can be observed in Sample 10, which remains the lowest at the end, together with the friction force in Sample 6. The X-oriented samples show greater variance in values, i.e., more pronounced jumping as compared with the Z-oriented samples. In addition, we also found lower coefficients of friction as compared with the Z-oriented samples.
In terms of achieving the optimal parameters for the tribological properties of surfaces of models produced by the FFF technique from ULTEM 9085 material, it is advisable to use the layer deposition strategy, such as in the case of the X-oriented Samples 4 and 5 and the Z-oriented Samples 6 and 10. Using these strategies, a lower friction force (or its course) was found, as well as less weight loss.

3.4. Microscopic Observation of Material Failure

Table 10 shows microscopic images of the sample surfaces after the testing procedure with a transition area between the worn and non-worn surface. In these images, we can see how the surface wore off at different orientations of the fibers laid. The images confirm that the worn surface shows no signs of adhesive or cohesive failure and, thus, the coherence between the individual layers has been maintained in both types of samples produced. With the X- and Z-orientations of the fibers deposition, exclusively abrasive wear (abrasion) of the material was noted.

4. Evaluation of the Measured Values

The experimental results evaluated weight loss and the course of the coefficient of friction depending on the path traveled.
When evaluating weight loss and its dependence on the chosen fiber-laying strategy, it can be stated that the largest weight loss in the X-oriented samples occurred in Sample 3, where the fibers were oriented parallel (0°) to the tested sample wall in both layers. In Samples 1 and 2, where the fibers formed a 45° angle, the weight loss was 36.79–45.6% lower than in Sample 3. In Sample 4, where the deposition strategy of all layers was the same (90°), the weight loss decreased by 52.16% as compared with Sample 3. Sample 5 (90° and 0°), where the layers with perpendicular fibers and fibers parallel to the tested sample wall alternated, showed the lowest weight loss as compared with Sample 3, by up to 52.91%. It can be concluded from the results of measuring the weight losses that by using the same strategy in both layers (Sample 2, 45°) or a strategy parallel to the direction of wear in both layers (Sample 3) greater weight loss occurred. With the same strategy in both layers (Sample 4, 0°) or with the combined strategy the weight loss in the layers decreases (Sample 5, 0° and 90°) (Figure 12).
When evaluating weight loss and its dependence on the chosen fiber-laying strategy, it can be stated that the largest weight loss occurred in the Z-oriented samples of the deposited fibers in Sample 8, where the fibers were oriented perpendicular to the tested sample wall. In Samples 6 and 7, where the fibers formed a 45° angle, the reduction was 2.89–20.73% lower as compared with Sample 8. In Sample 9, where the layers with perpendicular fibers and fibers parallel to the tested wall alternate, the weight loss was 8.75% smaller as compared with Sample 8. In Sample 10, the weight loss decreased by up to 16.06% as compared with Sample 8. The results of the measured weight losses lead to the conclusion that when using the strategy of 45° in the even and the opposite 45° in the odd layer direction, the smallest weight loss occurs. Using the same strategy in both the even and odd layers, the wear increases (Samples 7 and 8) or when using a combined strategy, the weight loss in the layers decreases in the opposite way (Samples 6 and 9) (Figure 12).
Table 11 shows the weight losses in individual samples with an overall indication of the orientation for each type of loss (X- or Z-orientation). This table shows that, although Sample 3 shows the highest wear from among the whole group of samples, this type of fiber deposition orientation is more suitable in terms of abrasive wear because smaller overall weight losses are recorded. The X-orientation shows 21.2% less weight loss than the Z-orientation.

5. Conclusions

Nowadays, 3D-printed products are increasingly being used in various areas of industry. One of these technologies is the production technique that uses fused filament fabrication (FFF). With increasing applications and a demand for this technology, there is a need to expand our knowledge about the mechanical properties of materials and about their surface resistance or resistance to various types of wear. Currently, the available studies have addressed the most widespread materials used in experimental investigations of the friction and wear behavior of acrylonitrile butadiene styrene (ABS) specimens. The research on specimens made using the FFF technique has been conducted by considering the normal load, yield speed, and part orientation as parameters in the face-centered central composite design (FCCCD) setup of experiments on a pin-on-disc machine [34] or by studying the friction and wear behavior of parts made of newly developed Nylon6-Fe as compared with the existing acrylonitrile butadiene styrene (ABS) filament of the FFF machine [35].
The PEI material allows the printed products to be used in more demanding applications and this is the reason why we decided to perform experimental measurements of the resistance of this material to abrasive wear.
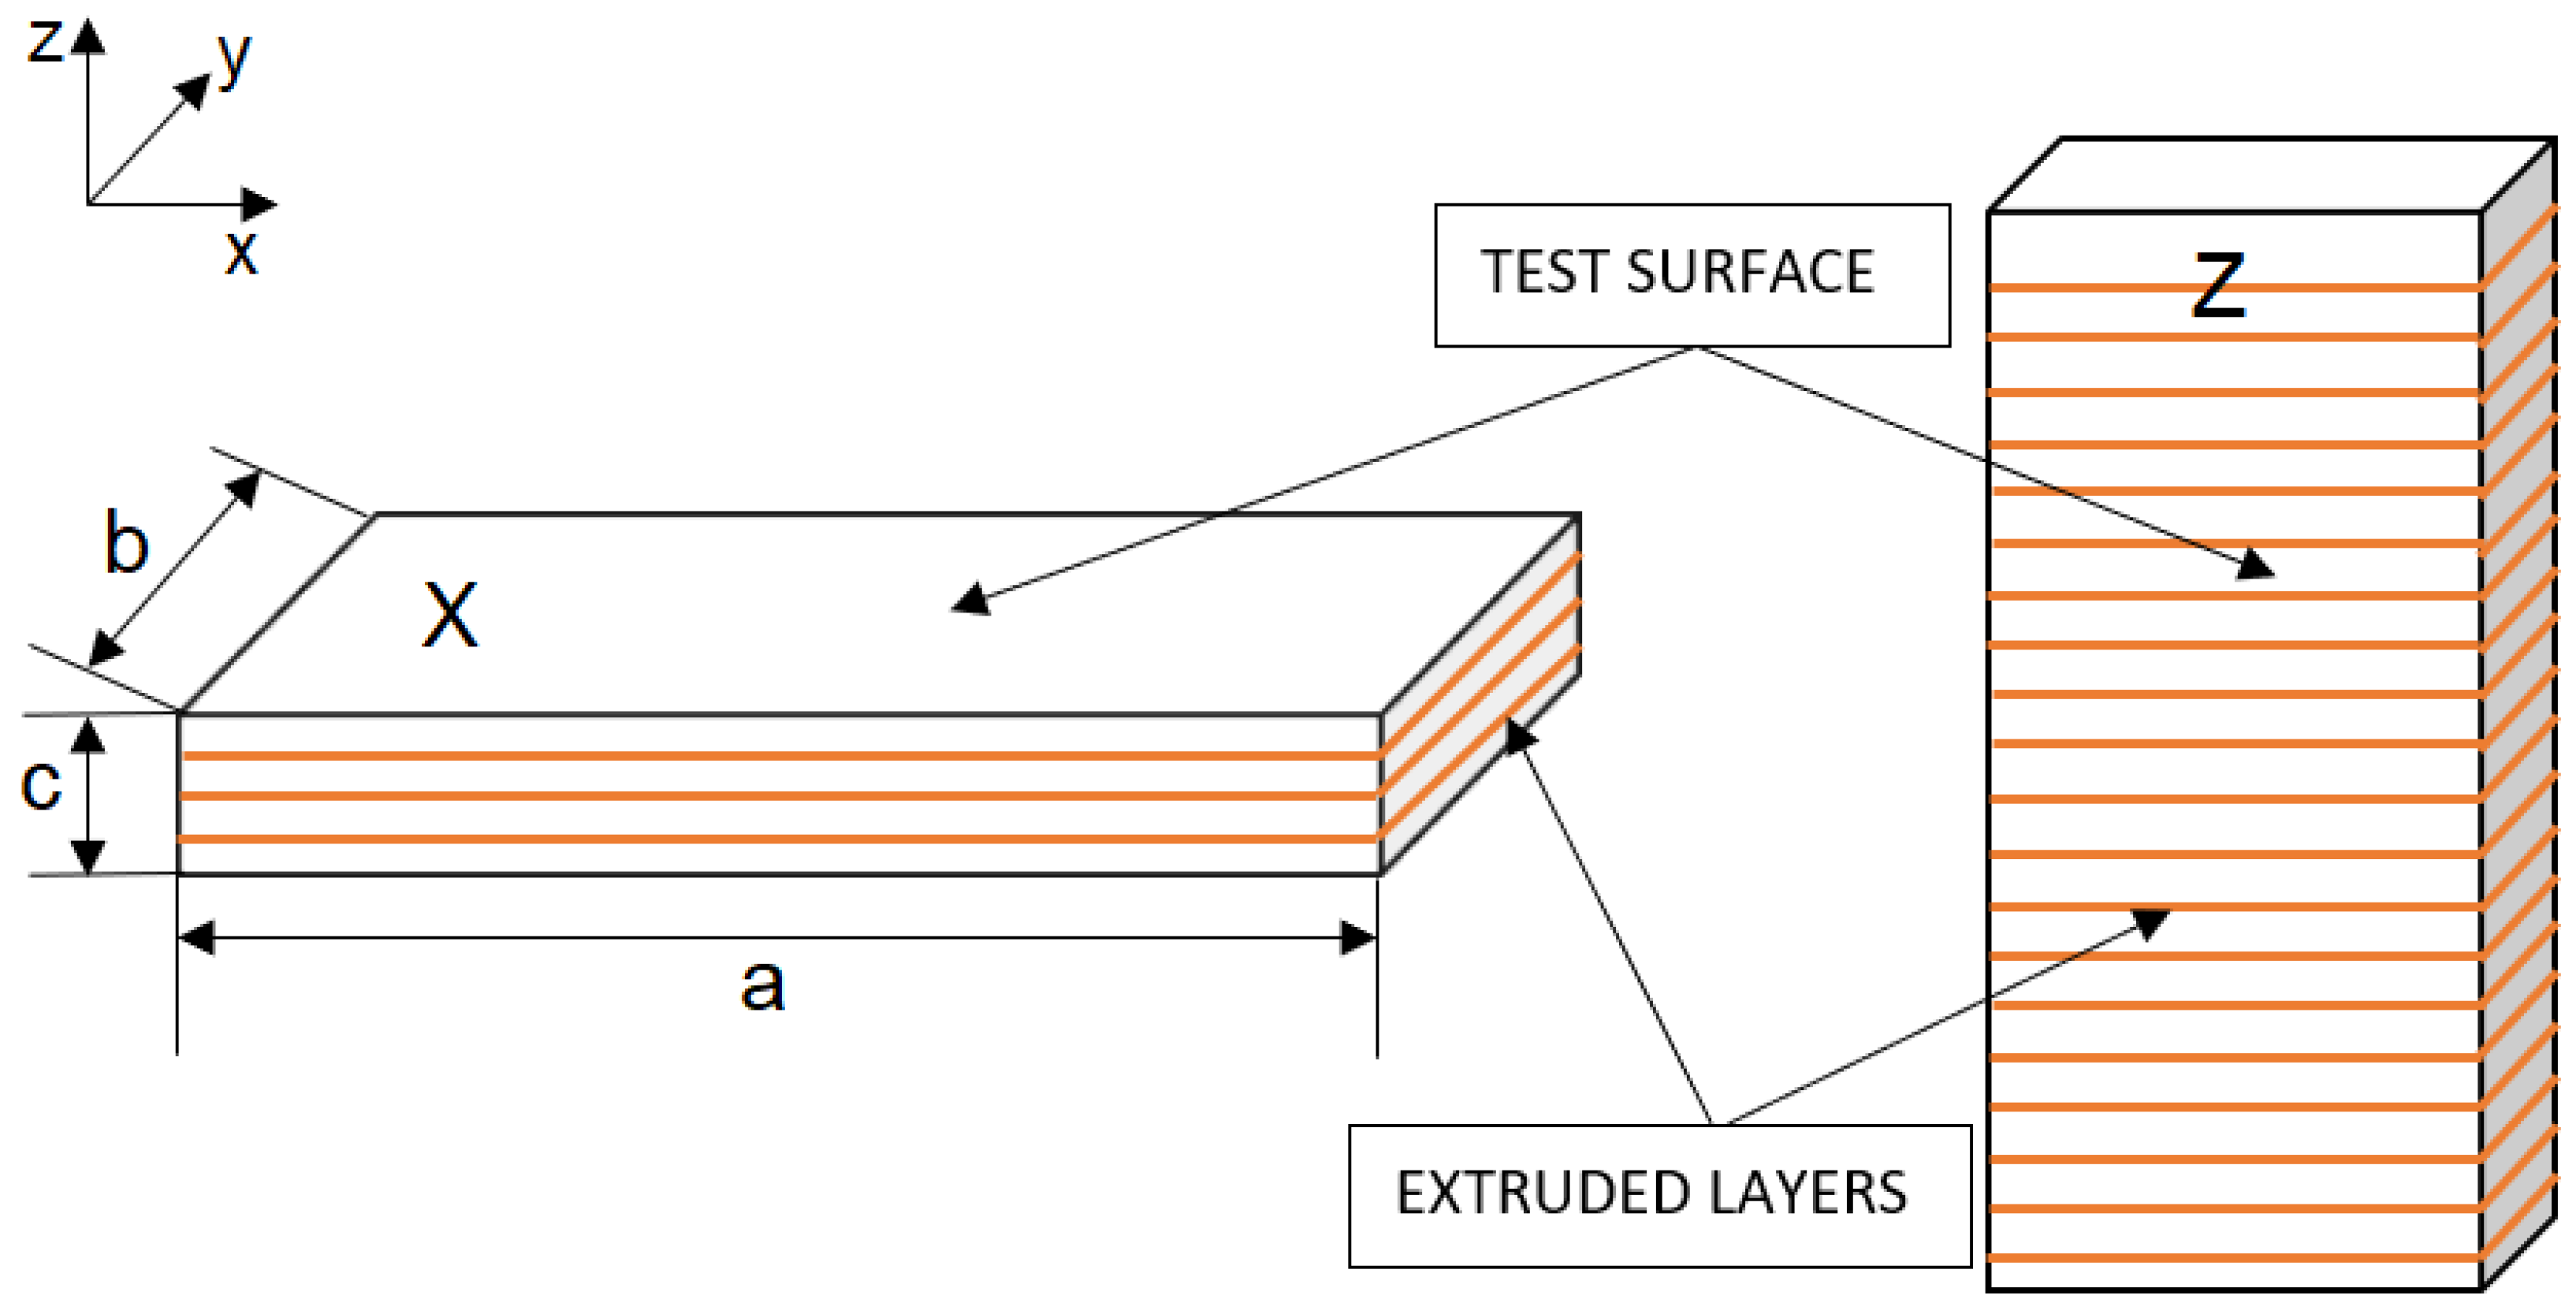
This study is focused on analysis of building orientation and deposition strategy the influence of the FFF additive manufacturing technique on the course of the coefficient of friction and wear of samples (tribological properties of surface and subsurface layers) of ULTEM9085™ thermoplastic, as demonstrated by the material weight loss, in compliance with the ASTM G65-16 standard.
A total of 10 samples prepared under two different model production orientations were used in the experiment with respect to the orientation of the layers during the testing procedure; five samples were prepared under each orientation, and according to different fiber-laying strategies. The weight loss of the material as a function of the path traveled and the coefficient of friction and wear behavior were observed as the main factors of the experiment. The experimental results show that fiber orientation and the fiber-laying strategy during a model‘s printing affect its tribological properties.
The results show that the influences of different orientations cause differences in weight loss and fluctuations in the coefficient of friction. With respect to the total material losses, the X-orientation appears to be more suitable, where the total material loss is 0.4188 g; with the Z-orientation, the material loss is 0.5315 g, which represents an increase in weight loss of 26.91%.
The findings from the comparison of individual deposition strategies show that the strategy of Sample 5 (X-orientation) is the most resistant, where it is a question of alternating the deposition strategy of fibers between 0° in the even and 90° in the odd layer with respect to the tested sample wall. Sample 3 (X-orientation) shows the greatest weight loss, where the fiber deposition strategy was parallel to wear direction of 0° in both the even and the odd layers. The study’s findings suggest that printing in a horizontal orientation (X) and a 0° and 90° strategy (Sample 5) of layers deposition helps to reduce material wear. In conclusion, it can be stated that if we require higher abrasion resistance from a model made of the ULTEM 9085 material, it is suitable to choose the X-orientation and the strategy of Sample 5.

Author Contributions

Conceptualization, G.M. and I.G.; methodology, I.G.; software, E.S. and T.J.; validation, E.S.; formal analysis, J.M.; investigation, G.M.; resources, T.J.; data curation, G.M.; writing—original draft preparation, J.M. and T.J.; writing—review and editing, G.M. and I.G.; visualization, I.G.; supervision, E.S. and G.M. All authors have read and agreed to the published version of the manuscript.

Funding

This research was funded by VEGA/1/0384/20 and KEGA: 036TUKE-4/2021.

Institutional Review Board Statement

Not applicable.

Informed Consent Statement

Not applicable.

Data Availability Statement

Not applicable.

Acknowledgments

This work was supported by the Slovak Research and Development Agency under the contract no. VEGA/1/0384/20. The autors would like to thank the KEGA grant agency for supporting research work and co-financing the project KEGA: 036TUKE-4/2021.

Conflicts of Interest

The authors declare no conflict of interest.

References

  1. Galeta, T.; Raos, P.; Stojši_c, J.; Pakši, I. Influence of structure on mechanical properties of 3Dprinted objects. Procedia Eng. 2016, 149, 100–104. [Google Scholar] [CrossRef] [Green Version]
  2. Wang, J.; Xie, H.; Weng, Z.; Senthil, T.; Wu, L. A novel approach to improve mechanical properties of parts fabricated by fused deposition modeling. Mater. Des. 2016, 105, 152–159. [Google Scholar] [CrossRef]
  3. Bellini, A.; Güçeri, S. Mechanical characterization of parts fabricated using fused deposition modeling. Rapid Prototyp. J. 2003, 9, 252–264. [Google Scholar] [CrossRef]
  4. Cifuentes, S.C.; Frutos, E.; Benavente, R.; Lorenzo, V.; Gonzalez-Carrasco, J.L. Assessment of mechanical behav-ior of PLA composites reinforced with Mg microparticles through depth-sensing indentations analysis. J. Mech. Behav. Biomed. Mater. 2017, 65, 781–790. [Google Scholar] [CrossRef] [PubMed]
  5. Farah, S.; Anderson, D.G.; Langer, R. Physical and mechanical properties of PLA, and their functions in wide-spread applications–a comprehensive review. Adv. Drug Deliv. Rev. 2016, 107, 367–392. [Google Scholar] [CrossRef] [PubMed] [Green Version]
  6. Murariu, M.; Dubois, P. PLA composites: From production to properties. Adv. Drug Deliv. Rev. 2016, 107, 17–46. [Google Scholar] [CrossRef] [PubMed]
  7. Revati, R.; Majid, M.S.A.; Ridzuan, M.J.M.; Basaruddin, K.S.; Rahman Y., M.N.; Cheng, E.; Gibson, A. In vitro degradation of a 3D porous Pennisetum purpureum/PLA biocomposite scaffold. J. Mech. Behav. Biomed. Mater. 2017, 74, 383–391. [Google Scholar] [CrossRef]
  8. RSong, Y.; Li, Y.; Song, W.; Yee, K.; Lee, K.-Y.; Tagarielli, V. Measurements of the mechanical response of unidirectional 3D-printed PLA. Mater. Des. 2017, 123, 154–164. [Google Scholar] [CrossRef]
  9. Wittbrodt, B.; Pearce, J.M. The effects of PLA color on material properties of 3-D printed components. Addit. Manuf. 2015, 8, 110–116. [Google Scholar] [CrossRef] [Green Version]
  10. Es-Said, O.S.; Foyos, J.; Noorani, R.; Mendelson, M.; Marloth, R.; Pregger, B.A. Effect of Layer Orientation on Mechanical Properties of Rapid Prototyped Samples. Mater. Manuf. Process. 2000, 15, 107–122. [Google Scholar] [CrossRef]
  11. Pham, D.T.; Gault, R.S. A comparison of rapid prototyping technologies. Int. J. Mach. Tools Manuf. 1998, 38, 1257–1287. [Google Scholar] [CrossRef]
  12. Dawoud, M.; Taha, I.; Ebeid, S.J. Effect of processing parameters and graphite content on the tribological behaviour of 3D printed acrylonitrile butadiene styrene. Mater. Werkst. 2015, 46, 1185–1195. [Google Scholar] [CrossRef]
  13. Panneerselvam, T.; Kandavel, T.K.; Raghuraman, S. Experimental investigations on tribological behaviour of alumina added Acrylonitrile butadiene styrene (ABS) composites. Tribol. Ind. 2016, 8, 338–346. [Google Scholar]
  14. Gurrala, P.K.; Regalla, S.P. Friction and wear behavior of abs polymer parts made by fused deposition modeling (FDM). Technol. Lett. 2014, 1, 13–17. [Google Scholar]
  15. Garg, H.K.; Singh, R. Comparison of wear behavior of ABS and Nylon6—Fe powder composite parts prepared with fused deposition modelling. J. Central South Univ. 2015, 22, 3705–3711. [Google Scholar] [CrossRef]
  16. Hanon, M.; Kovács, M.; Zsidai, L. Tribology behaviour investigation of 3D printed polymers. Int. Rev. Appl. Sci. Eng. 2019, 10, 173–181. [Google Scholar] [CrossRef] [Green Version]
  17. Norani, M.N.M.; Abdollah, M.F.B.; Abdullah, M.I.H.C.; Amiruddin, H.; Ramli, F.R.; Tamaldin, N. Correlation of tribo-mechanical properties of internal geometry structures of fused filament fabrication 3D-printed acrylonitrile butadiene styrene. Ind. Lubr. Tribol. 2020, 72, 1259–1265. [Google Scholar] [CrossRef]
  18. Norani, M.N.M.; Bin Abdollah, M.F.; Abdullah, M.I.H.C.; Amiruddin, H.; Ramli, F.R.; Tamaldin, N. 3D printing parameters of acrylonitrile butadiene styrene polymer for friction and wear analysis using response surface methodology. Proc. Inst. Mech. Eng. Part J J. Eng. Tribol. 2021, 235, 468–477. [Google Scholar] [CrossRef]
  19. Amiruddin, H.; Bin Abdollah, M.F.; Norashid, N.A. Comparative study of the tribological behaviour of 3D-printed and moulded ABS under lubricated condition. Mater. Res. Express 2019, 6, 085328. [Google Scholar] [CrossRef]
  20. Hesselbach, J.; Raatz, A.; Wrege, J.; Herrmann, H.; Weule, H.; Buchholz, C.; Tritschler, H.; Knoll, M.; Elsner, J.; Klocke, F.; et al. mikroPro-Untersuchungen zum internationalen Stand der Mikroproduktionstechnik. wt Werkstattstech. Online Bd. 2003, 93, 119–128. [Google Scholar]
  21. Maeda, H.; Okubo, H.; Sasaki, S. Frictional property of a 3D-capillary-structured surface fabricated by selective laser melting. J. Tribol. 2019, 20, 87–96. [Google Scholar]
  22. Tahir, N.A.M.; Azmi, M.S.; Abdollah, M.F.B.; Ramli, F.R.; Amiruddin, H.; Tokoroyama, T.; Umehara, N. Tribo-logical properties of 3D-printed pin with internal structure formation under dry sliding conditions. Proc. Mech.-Cal Eng. Res. Day 2018, 2018, 260–261. [Google Scholar]
  23. Murashima, M.; Kawaguchi, M.; Tanaka, M.; Umehara, N. The effect of inner structures created by 3D-additive manufacturing on wear reduction of 3D printed material. In Proceedings of the SAKURA Symposium on Mechanical Science and Engineering, Nagoya, Japan, 12 September 2017; pp. 39–41. [Google Scholar]
  24. Abdollah, M.F.B.; Norani, M.N.M.; Abdullah, M.I.H.C.; Amiruddin, H.; Ramli, F.R.; Tamaldin, N. Synergistic effect of loads and speeds on the dry sliding behaviour of fused filament fabrication 3D-printed acrylonitrile butadiene sty-rene pins with different internal geometries. Int. J. Adv. Manuf. Technol. 2020, 108, 2525–2539. [Google Scholar] [CrossRef]
  25. Grytsenko, O.; Dulebova, L.; Suberlyak, O.; Skorokhoda, V.; Spišák, E.; Gajdoš, I. Features of Structure and Properties of pHEMA-gr-PVP Block Copolymers, Obtained in the Presence of Fe2+. Materials 2020, 13, 4580. [Google Scholar] [CrossRef]
  26. Gajdoš, I.; Spišák, E.; Kaščák, L.; Krasinskyi, V. Surface Finish Techniques for FDM Parts. Mater. Sci. Forum 2015, 818, 45–48. [Google Scholar] [CrossRef]
  27. Pande, A.-D.; Jozef, J.; Marek, P.; Kačalová, I.M. Advantages and effectiveness of the pow-der metallurgy in manufacturing technologies. In Metalurgija = Metallurgy.–Záhreb (Chorvátsko): Hrvatsko Meta-Lurško Društvo; Croatia Metallurgical Society: Zagreb, Croatia, 2018; Volume 57, pp. 353–356. [Google Scholar]
  28. Olejarova, S.; Krenicky, T. Water Jet Technology: Experimental Verification of the Input Factors Variation Influence on the Generated Vibration Levels and Frequency Spectra. Materials 2021, 14, 4281. [Google Scholar] [CrossRef]
  29. Krenicky, T.; Servatka, M.; Gaspar, S.; Mascenik, J. Abrasive Water Jet Cutting of Hardox Steels—Quality Investigation. Processes 2020, 8, 1652. [Google Scholar] [CrossRef]
  30. Kováč, I.; Žarnovský, J.; Drlička, R.; Ružbarský, J. An improvement of tribological properties of boron alloyed layers. Manuf. Technol. J. Sci. Reserch Prod. 2010, 10, 78–80. [Google Scholar] [CrossRef]
  31. Konovalenko, I.; Maruschak, P.; Brezinová, J.; Brezina, J. Morphological Characteristics of Dimples of Ductile Fracture of VT23M Titanium Alloy and Identification of Dimples on Fractograms of Different Scale. Materials 2019, 12, 2051. [Google Scholar] [CrossRef] [Green Version]
  32. Dangnan, F.; Espejo, C.; Liskiewicz, T.; Gester, M.; Neville, A. Friction and wear of additive manufactured polymers in dry contact. J. Manuf. Process. 2020, 59, 238–247. [Google Scholar] [CrossRef]
  33. Rathaur, A.S.; Patel, V.K.; Katiyar, J.K. Tribo-mechanical properties of graphite/talc modified polymer composite bearing balls. Mater. Res. Express 2019, 7, 015305. [Google Scholar] [CrossRef]
  34. Marathe, U.N.; Bijwe, J. High performance polymer composites–Influence of processing technique on the fiber length and performance properties. Wear 2020, 446–447, 203189. [Google Scholar] [CrossRef]
  35. Sable, P.A.; Neel, C.H.; Borg, J.P. Dynamic strength and friction behavior of thermosetting polyurethane and epoxy. Shock compression of condensed matter–2019. In Proceedings of the Conference of the American Physical Society Topical Group on Shock Compression of Condensed Matter, Portland, OR, USA, 16–21 June 2019; Volume 2272, p. 040010. [Google Scholar] [CrossRef]
  36. GAMIN. Available online: https://www.gamin.sk/fileadmin/user_upload/Airblast_Garnet_SK_01.pdf (accessed on 6 April 2022).
Figure 1. Dimensions and designation of sample types X and Z according to building orientation (xy–reference plane parallel to building platform).
Applsci 12 03853 g001
Figure 2. Real tribological laboratory equipment (left) and schematic representation (right).
Applsci 12 03853 g002
Figure 3. Garnet abrasive.
Applsci 12 03853 g003
Figure 4. Samples 1–5 diagram and Samples 6–10 diagrams (building orientation). Dimension a, b and c according to Figure 1.
Applsci 12 03853 g004
Figure 5. The series of samples used in the experiment.
Applsci 12 03853 g005
Figure 6. Weight loss in individual Samples 1–5 (X-orientation).
Applsci 12 03853 g006
Figure 7. The differences in weight losses for Samples 1–6, represented graphically.
Applsci 12 03853 g007
Figure 8. Weight differences among similar Samples 6–10 (g).
Applsci 12 03853 g008
Figure 9. Difference in weight loss in Samples 6–10, represented graphically.
Applsci 12 03853 g009
Figure 10. Plotted coefficient of friction depending on the path of Samples 1–5.
Applsci 12 03853 g010
Figure 11. Plotted coefficient of friction depending on the path of Samples 6–10.
Applsci 12 03853 g011
Figure 12. Summary of weight loss in all samples (Samples 1–5 X-orientation and Samples 6–10 Z-orientation).
Applsci 12 03853 g012
Table 1. A summary of studies on the tribological properties of polymers, testing methods, and findings.
Authors Research Objective Materials MethodologyFindings
Dangnan et al., 2020 Effect of varying contact loads on friction and wear ABS and VeroGray™ (Stratasys®, Eden Prairie, USA) polymers Loads of 1. 5 and 10 N were applied under dry sliding contact with a 52,100-steel counter face at room temperature Loads of 1. 5 and 10 N were applied under dry sliding contact with a 52,100-steel counter face at room temperature.
Rathaur et al., 2019 Mechanical and tribological characterization Epoxy resin blended with graphite/talc micro fillers Epoxy resin blended with graphite/talc micro fillers for 15 min at a constant speed of 1200 rpm and an applied load of 100 N as per the ASTM D4172 under dry conditions Graphite (10 wt%)/talc (10 wt%)/epoxy demonstrated a significant reduction by ~63% (from 0.103 to 0.276) in COF and a moderate increment by ~34% in wear resistance as compared with pure epoxy bearing balls under dry conditions. Hardness improved by ~5% in the graphite (10 wt%)/talc (10 wt%)/epoxy composite bearing ball.
Marathe et al., 2020 Performance and tribological properties 50 wt% PEEK, 30 wt% 3 mm (GF), and 20 wt% synthetic graphite Injection moulding (I) and compression moulding (C) Final fiber length of 200–300 μm and 1.5 mm were observed for I and C composites, respectively, based on thermal degradation of composites at 600 °C. Low specific wear rate (K0) (~10–16 m3/Nm) and friction coefficient (μ) (~0.03–0.05) were observed in both composites. Similarly, ~10–10 m3/Nm and ~0.5–0.7, correspondingly, were observed for abrasive wear. For K0 and μ, in both cases, the μ of the I composite was smaller. The C composite was superior to the I composite in adhesive wear efficiency, but not in abrasive wear.
Sable et al., 2020 Yield strength and friction phenomena at high strain rate using uniaxial and oblique impact configurations PU and epoxy Impact velocities: 50 to 120 m/s for oblique, up to 1200 m/s for uniaxialAt a high strain rate, the COF values for both polymers were found to be inversely proportional to pressure. For PU and epoxy, respectively, minimum values of 0.11 and 0.26 were measured under maximum pressure. Pressure dependency of shear strength persisted at high strain rate for both PU and epoxy.
Table 2. ASTM G65-16 parameter settings during the testing process.
Disc diameter(mm)229
Rotations per minute(RPM)278
Sample size(mm)70 × 20 × 6
Load(N)30
Path(m)200
Table 3. Chemical composition of the garnet abrasive [36].
Garnet abrasive
Fe3Al2(SiO4)3
SiO2FeOFe2O3Al2O3CaOMgOMnO
(%) (%) (%) (%) (%) (%) (%)
41.34 9.72 12.55 20.36 2.97 12.35 0.85
Table 4. Description of the strategies used with respect to the angle of rotation toward the tested sample wall.
Sample TypeStrategySample TypeStrategy
145° R, 45° L645° R, 45° L
245°745°
3890°
490°990°, 0°
590°,0°10
Table 5. Summary of samples’ initial weights and weight losses.
Building OrientationSample TypeInitial Weight (g)Weight Loss (g)Weight Loss (%)
X113.99030.07290.520
214.00280.08470.605
313.86030.1340.967
413.86830.06410.462
513.98220.06310.451
Z613.94390.09330.669
714.54010.11430.786
814.55580.11770.809
914.43430.10740.744
1014.51000.09880.681
Table 6. Weight loss results for Samples 1–5 (g).
Sample Type123Average Loss (g)
10.06320.07970.07590.0729
20.08450.08350.08600.0847
30.13080.13980.13140.1340
40.06560.05430.07240.0641
50.07050.05990.05580.0631
Table 7. Weight differences among similar Samples 1–5 (g).
Compared SamplesSame Fiber OrientationDifferent Fiber OrientationCompared Samples
2 vs. 10.08470.07290.0117
3 vs. 50.13400.06310.0709
4 vs. 50.06410.06310.001
Table 8. Weight losses for Samples 6–10 (g).
Sample Type123Average Loss (g)
60.09810.09060.09110.0933
70.11020.12000.11270.1143
80.10030.12580.12690.1177
90.10870.11140.10220.1074
100.09310.09980.10450.0988
Table 9. Weight differences in samples 6–11 (g).
Compared SamplesSame Fiber OrientationDifferent Fiber OrientationCompared Samples
7 vs. 60.11430.09330.0210
8 vs. 90.11770.10740.0102
10 vs. 90.09880.10740.0086
Table 10. Microscopic images of the sample surfaces of Samples 1–10.
Applsci 12 03853 i001 Applsci 12 03853 i002
12
Applsci 12 03853 i003 Applsci 12 03853 i004
34
Applsci 12 03853 i005 Applsci 12 03853 i006
56
Applsci 12 03853 i007 Applsci 12 03853 i008
78
Applsci 12 03853 i009 Applsci 12 03853 i010
910
Table 11. Comparison of weight loss in the X- and Z-orientations.
Numbers of Compared Samples of Type X and ZX (g)Z (g)Compared Quantity
1 vs. 60.07290.0933Weight loss
2 vs. 70.08470.1143
3 vs. 100.13400.0988
4 vs. 80.06410.1177
5 vs. 90.06310.1074
Total loss in all samples0.41880.5315Overall difference
Publisher’s Note: MDPI stays neutral with regard to jurisdictional claims in published maps and institutional affiliations.

