Article

Artificial Intelligence Mortality Prediction Model for Gastric Cancer Surgery Based on Body Morphometry, Nutritional, and Surgical Information: Feasibility Study

1
Biomedical Research Center, Asan Institute for Life Sciences, Asan Medical Center, Seoul 05505, Korea
2
Department of Systems Management Engineering, Sengkyunkwan University, Suwon 16419, Korea
3
Department of Surgery, Ajou University School of Medicine, Suwon 16499, Korea
4
Department of Radiology, Ajou University School of Medicine, Suwon 16499, Korea
5
Department of Radiology and Research Institute of Radiology, Asan Medical Center, University of Ulsan College of Medicine, Seoul 05505, Korea
6
Department of Surgery, Asan Medical Center, University of Ulsan College of Medicine, Seoul 05505, Korea
*
Authors to whom correspondence should be addressed.
These authors contributed equally to this work.
Appl. Sci. 2022, 12(8), 3873; https://doi.org/10.3390/app12083873
Submission received: 7 March 2022 / Revised: 8 April 2022 / Accepted: 10 April 2022 / Published: 12 April 2022
(This article belongs to the Special Issue Recent Advances in Deep Learning for Image Analysis)

Abstract

:
The objective of this study is to develop a mortality prediction model for patients undergoing gastric cancer surgery based on body morphometry, nutritional, and surgical information. Using a prospectively built gastric surgery registry from the Asan Medical Center (AMC), 621 gastric cancer patients, who were treated with surgery with no recurrence of cancer, were selected for the development of the prediction model. Input features (i.e., body morphometry, nutritional, surgical, and clinicopathologic information) were selected in the collected data based on the XGBoost analysis results and experts’ opinions. A convolutional neural network (CNN) framework was developed to predict the mortality of patients undergoing gastric cancer surgery. Internal validation was performed in split datasets of the AMC, whereas external validation was performed in patients in the Ajou University Hospital. Fifteen features were selected for the prediction of survival probability based on the XGBoost analysis results and experts’ suggestions. Accuracy, F1 score, and area under the curve of our CNN model were 0.900, 0.909, and 0.900 in the internal validation set and 0.879, 0.882, and 0.881 in the external validation set, respectively. Our developed CNN model was published on a website where anyone could predict mortality using individual patients’ data. Our CNN model provides substantially good performance in predicting mortality in patients undergoing surgery for gastric cancer, mainly based on body morphometry, nutritional, and surgical information. Using the web application, clinicians and gastric cancer patients will be able to efficiently manage mortality risk factors.

1. Introduction

Gastric cancer is the second most common cancer and the leading cause of cancer-related deaths worldwide [1]. The etiologies of gastric cancer are diverse, including helicobacter pylori infection, environmental factors such as an unhealthy diet, lifestyle choices such as smoking and alcohol consumption, and genetic mutations [2]. Surgery is the only curative treatment for gastric cancer, but sarcopenia is highly prevalent in gastric cancer surgery patients [3]. Most patients experience postgastrectomy side effects, including worsened nutritional status, weight loss, and a decline in physical activity [4].
In general, a variety of prognostic factors have been revealed including age, primary tumor extent, lymph node metastasis, surgical methods, comorbidities such as metabolic syndrome, lifestyle choices such as smoking or alcohol consumption, nutritional status, and sarcopenia [5,6,7]. In our prior study, nutritional variables and skeletal muscle mass were observed to decrease after gastrectomy, leading to a loss of 8–15% of the initial body weight and 3–5% of the muscle area [8]. Additionally, it is established that surgical information, such as the type of operation (i.e., total gastrectomy vs. distal gastrectomy) and the type of anastomosis (Billroth-1[gastroduodenostomy], Billroth-2[gastrojejunostomy], Roux-en-Y gastrojejunostomy, etc.), influence the body’s morphometry and nutrition after gastrectomy [8]. In addition, the prognostic effects of body morphometry and nutrition in patients treated with gastrectomy have been reported in many works [9,10,11]. Furthermore, several prior studies have reported that surgical methods can also affect the patient’s survival outcome [12]. Based on prior study results, we believe that a mortality prediction model should include body morphometry, nutritional, and surgical information, as well as clinicopathologic information.
Recently, artificial intelligence (AI) has been applied to the prognosis of gastric cancer patients treated with gastrectomy [13,14,15]. The majority of studies used clinicopathologic information, including tumor staging, tumor extent, lymph node metastasis status, and distant metastasis. However, up to now, these AI prediction models studies have not assessed other crucial information, such as body morphometry, nutritional factors, and surgical information.
Based on the above, our goal was to develop an AI mortality prediction model for patients undergoing gastric cancer surgery based on body morphometry and nutritional factors. We aimed to make the prediction model available online so that clinicians and gastric cancer patients could predict mortality using the information of individual patients.

2. Materials and Methods

This study was approved by the institutional review board of Asan Medical Center (AMC) and Ajou University Hospital (AUH) in Korea. Data for this study were collected retrospectively and did not require informed consent. The reporting in this study was based on the methods and terms in the published literature guidance on machine learning for medical applications [16].

2.1. Data Source and Datasets

The present study was conducted using a prospectively built gastric cancer surgery registry in the AMC. The registry has comprehensively recorded the demographic characteristics of patients, preoperative evaluation results, surgery-related and postoperative outcomes, pathologic information, and follow-up data. The characteristics of patients included in this study are summarized in Table 1 and Supplementary Figure S1.
We collected data from 621 patients (388 men and 233 women; mean age, 55.7 ± 11.6 years) who underwent surgery for primary gastric adenocarcinoma that did not recur from 2007 to 2012 at AMC. The data were randomly separated using an 8:2 ratio of a development set and validation set, respectively. A training set was used for algorithm training and hyperparameter tuning, while the validation set (i.e., internal validation set) was used only for an independent test of developed models, and never used for training.
We also collected data including body morphometry analysis results from 33 patients (20 men and 13 women; mean age, 60.0 ± 12.0 years) who underwent surgery for primary gastric adenocarcinoma from 2010 to 2012 in the AUH. These data were used as an external validation set to evaluate the performance of the developed models.

2.2. Clinical Information

From the surgery registries in both hospitals and computer tomography (CT) body morphometry analysis, clinical information and body morphometry information with 59 variables were collected (Supplementary Table S1). With respect to demographic information, patients’ age, sex, body weight, and height were collected. Clinical information about the type of surgery (open vs. laparoscopic approach), type of operation (distal vs. total gastrectomy), type of anastomosis, and pathologic data, including Lauren’s classification [17] and pathologic tumor stage, were also included in the analysis.
Laboratory test results, such as serum albumin and cholesterol at pre- and postoperative periods, were also collected. The nutritional risk index (NRI) was calculated based on the formula (1.519 × serum albumin g/L) + 0.417 × (present weight/usual weight) × 100 [18].
Body morphometry information was obtained from CT images. CT scans obtained at pre- and postoperative periods (i.e., one year after surgery) were selected for body morphometric analysis. Preoperative CT was evaluated on average within one month prior to the surgery. Body composition was assessed with abdominopelvic CT using automated artificial intelligence software (AID-UTM, iAID Inc., Seoul, Korea), which was developed using a fully convolutional network segmentation technique [19] (Figure 1). Skeletal muscle area (SMA), including all muscles (i.e., psoas, paraspinal, transversus abdominis, rectus abdominis, quadratus lumborum, and internal and external obliques) on the selected axial images at the inferior endplate level of the third lumbar vertebra (L3) were demarcated using predetermined thresholds (−29 to +150 Hounsfield units (HU)). The subcutaneous fat area (SFA) and visceral fat area (VFA) were also assessed using fat tissue thresholds (−190 to −30 HU). The SMA was adjusted using the square of the height (SMA/height2) and BMI (SMA/BMI).

2.3. Feature Selection and Preprocessing

A flowchart of feature selection and preprocessing is presented in Figure 2. The standardization of the time-dependent continuous variables was performed using the below formula:
Value standard = measured   value   one   year   after   surgery   measured   value   before   surgery measured   value   before   surgery
The standardization of all the included variables, which is a common requirement for machine learning algorithms, was then performed. Standardization adjusts the data distribution of each feature with a mean of zero and a standard deviation of one:
Data   standard = Data X ¯ SD ,
where X ¯ and SD are the mean and standard deviation values, respectively, for each feature from the training dataset. The standardization was applied to both training and validation datasets.
Through the standardization process, 47 features were generated from 59 variables, as presented in Supplementary Table S1.
In order to select critical features which significantly influence overall survival rates, we initially investigated the contribution of each of the 47 features to the overall survival rates with feature importance analysis using eXtreme Gradient Boosting (XGBoost) algorithms [20]. Two expert clinicians also selected important features based on their clinical expertise. Based on feature importance analysis and experts’ opinions, we finally selected the features for AI training.

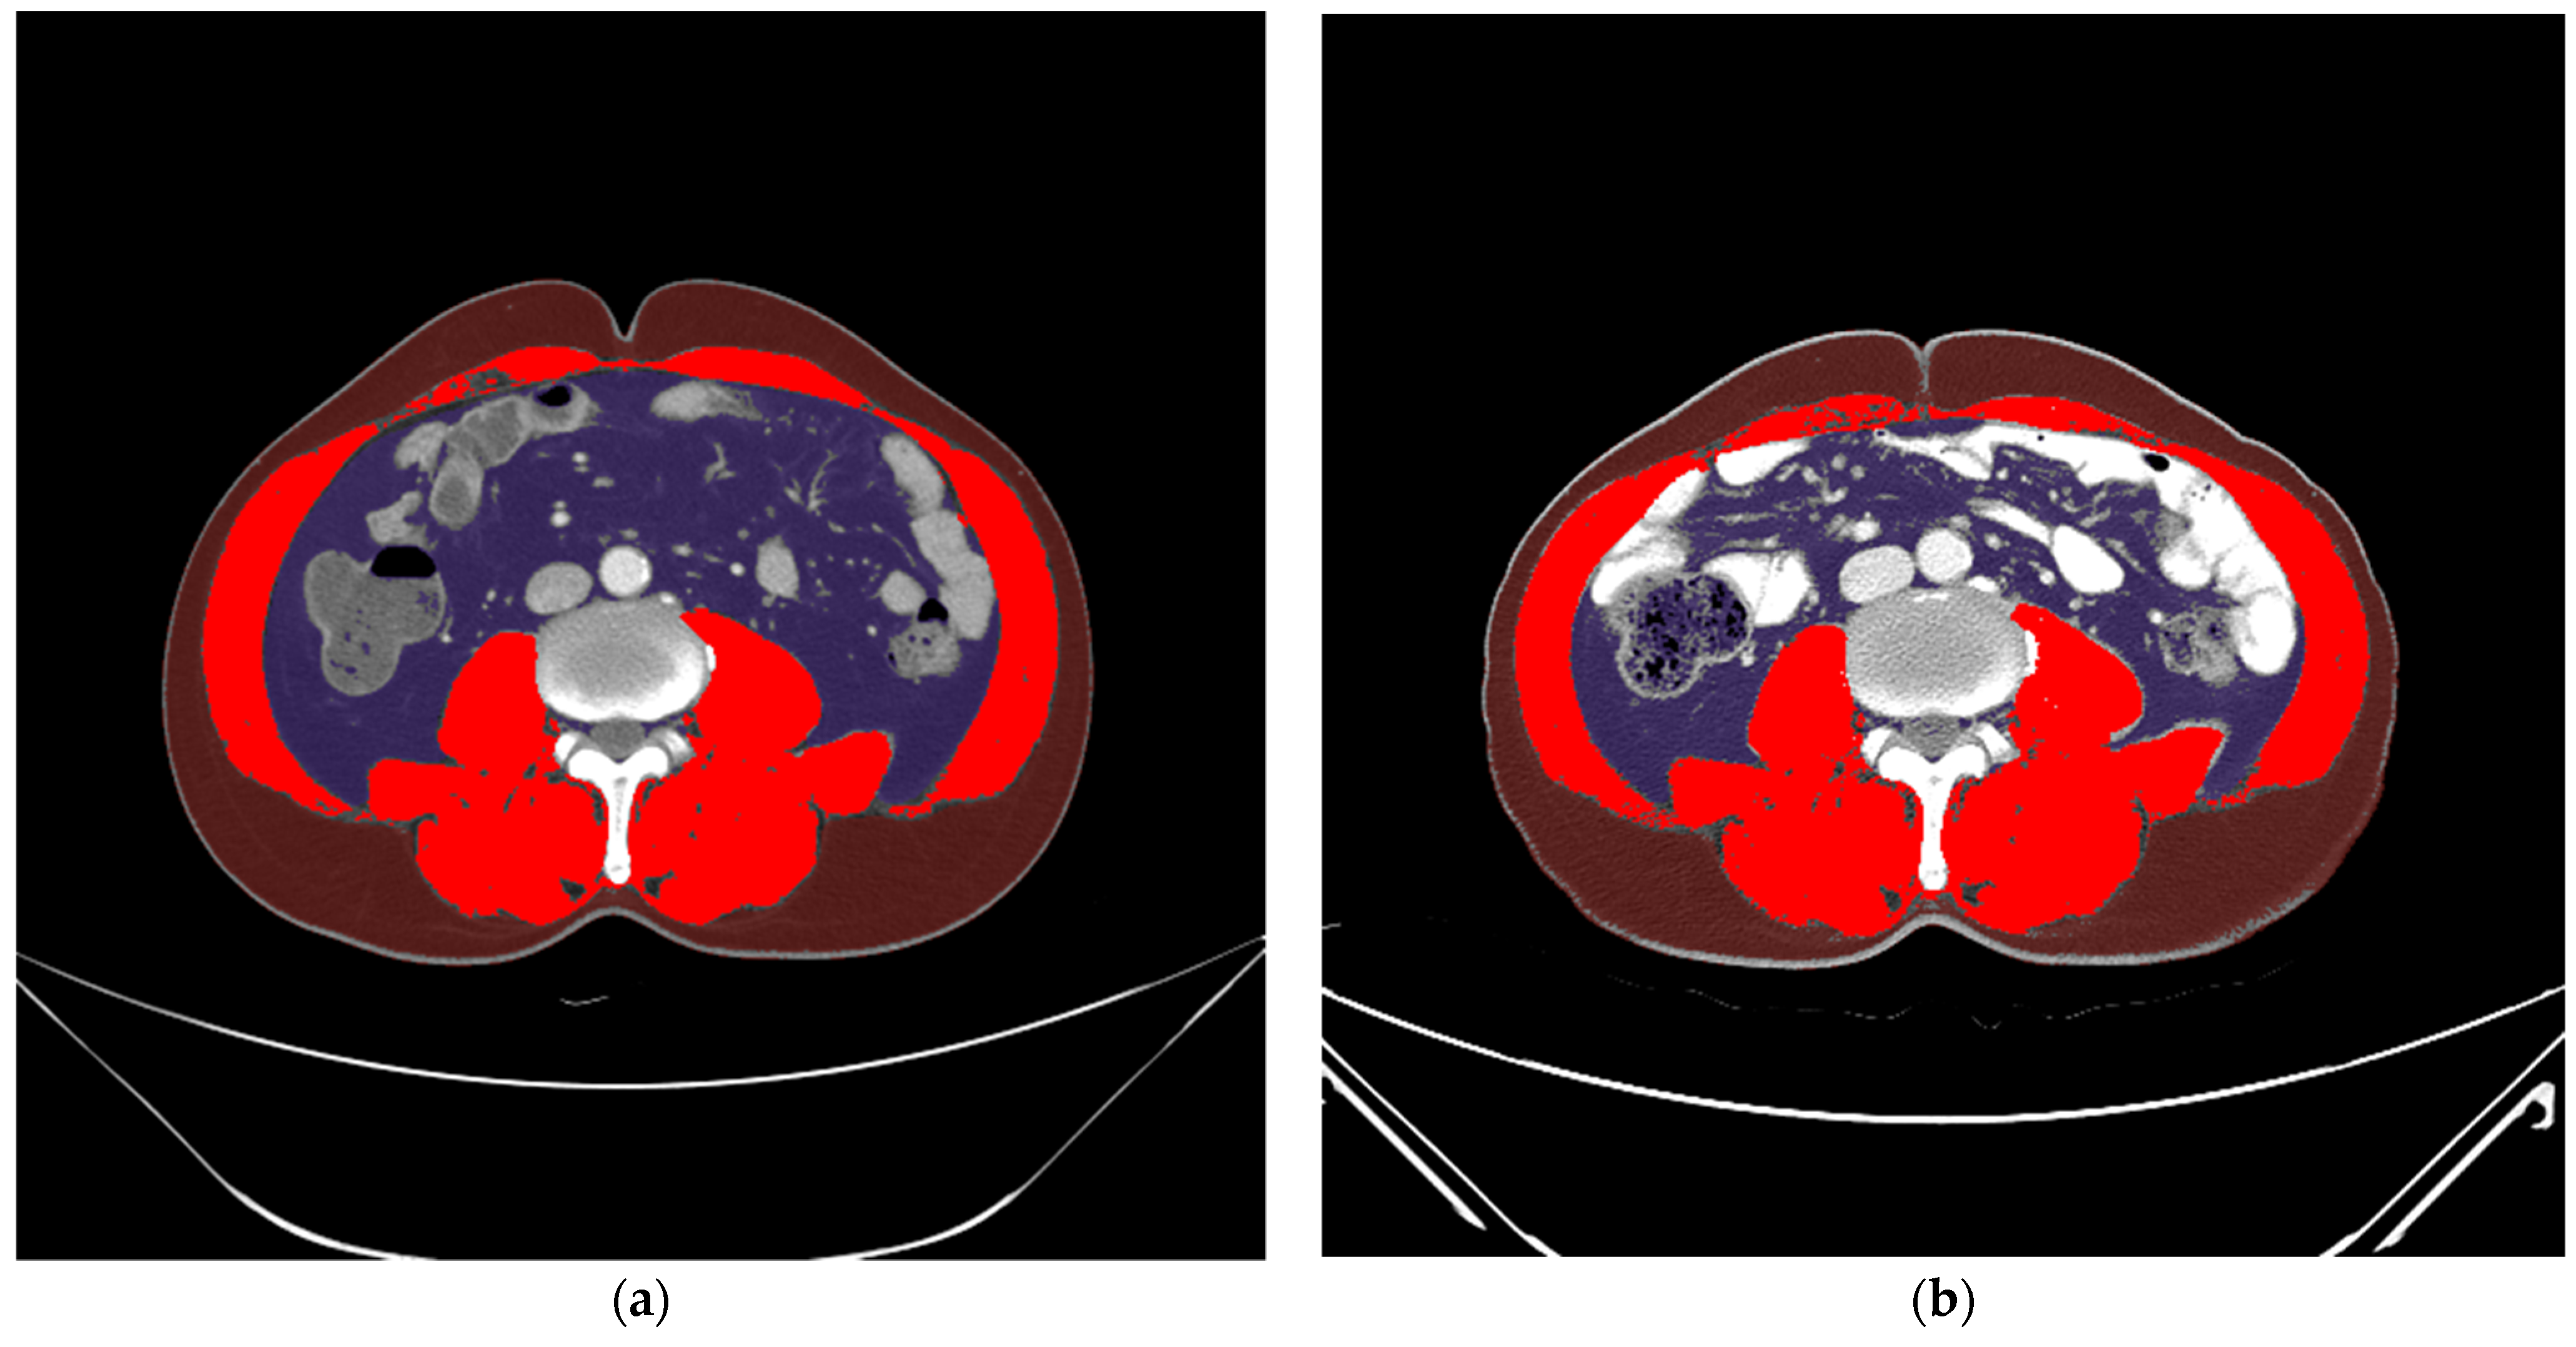
2.4. Processing of Data

The data collected from the 621 cases of the AMC included the data of 93 deceased and 528 surviving patients. In order to evaluate the potential data imbalance, k-means clustering was used [21]. The 528 survival datasets were categorized into 93 clusters and extracted one representative dataset from each cluster. One hundred eighty-six balanced datasets with outliers were obtained, including ninety-three survivals and ninety-three deaths. To remove possible outliers, cosine similarity between survival and death was calculated, and then the data with high cosine similarity were removed. Among the 186 datasets, 100 balanced datasets without outliers were obtained and randomly divided as follows: 80 for the development set and 20 for the internal validation set. On the other hand, the 33 datasets from the AUH that were used as the external validation set consisted of 16 surviving patients and 17 deaths.

2.5. Development of a CNN Model

Through the feature selection process mentioned above, 15 features were selected as the input for the proposed CNN model. Thus, the input size was determined to be 15. The proposed model included 13 convolution layers, 2 max-pooling layers, a flatten layer, and a dense layer. All convolution layers used padding to preserve the input and output size and included Rectified Linear Unit (ReLu) as the activation function. The pooling size of the max-pool layers was two. Since the role of pooling layers was to extract valuable information, padding was not adopted for the max pool. The dense layer was a fully connected network, so the output of the last convolution layer needed to be flattened. The sigmoid function was applied to the output of the dense layer so that the binary classification (i.e., survival or death) could be performed. The random normal initialization was applied for layer initialization. The detailed information of our proposed model is shown in Figure 3.

2.6. Implementation

The CNN model in R software (version 3.5) used the Keras Deep Learning Library (kerasR) [22]. The kerasR package is an interface designed to provide direct access to the Keras Deep Learning Library from R software. Keras is a high-level neural network library including CNN and runs on top of TensorFlow. We trained the model using the ADAM optimizer [23] and a binary cross-entropy loss function with a learning rate of 0.0001. The learning rate was decreased by a factor of 0.93 when the accuracy was not increased during five consecutive epochs. The lower limit of the learning rate was set to 0.000001. The conducted training process lasted 100 epochs, and the batch size was 50. Class weight was adjusted (survival:death = 1:1.1) to increase the accuracy of death classification.
In the development set, five-fold cross-validation was performed to assess the generalization ability of the model, while a randomized grid search was also applied for hyperparameter tuning. The development set was randomly shuffled and partitioned into equal subgroups in a stratified manner. Among the five subgroups, a single subgroup was retained as the test data for evaluating the model, while the remaining four subgroups were used as the training data.

2.7. Performance Evaluation of the CNN Model

The performance of the CNN to predict survival was then evaluated. To evaluate the performance of the developed CNN model in predicting mortality, accuracy, F1 score, and area under the curve (AUC) were used.
The accuracy and F1 score were defined as
Accuracy = TP + FP TP + TN + FN + FP   ,
F 1   score = 2 × precision   × recall precision + recall   ( precision = TP TP + FP ,   recall = TP TP + FN ) ,
where TP, TN, FP, and FN represent the true positive, true negative, false positive, and false negative, respectively.
In both internal and external datasets, independent testing of the finally implemented CNN algorithm was performed.

3. Results

3.1. Feature Importance and Preprocessing Results

Figure 4 shows the results of the ranked feature importance from the XGBoost analysis. Hemoglobin had the highest importance value, followed by age, SFA, NRI, etc. Based on the XGBoost feature importance analysis, 20 features were selected (Table 2).
Two expert clinicians (I.S.L. and K.W.K.) selected 13 clinically significant features from the 47 features. All 13 clinically significant features selected by the two expert clinicians were included in the 20 features selected based on XGBoost.
Of the 20 features selected from XGBoost, 5 features (i.e., protein, distal resection margin, proximal resection margin, number of metastatic lymph nodes, and number of retrieved lymph nodes) were excluded, because there were missing data in the external validation datasets. The following 15 features for predicting survival probability were finally selected:
-
Continuous features: age (year), height (cm), ΔBMIstandard, Δcholesterolstandard, Δhemoglobinstandard, Δalbuminstandard, ΔNRIstandard, ΔSFAstandard, ΔVFAstandard, ΔSMA/height2standard, and ΔSMA/BMIstandard;
-
Categorical features: sex, type of operation, type of anastomosis, tumor, nodes, and metastases (TNM) stage.
The preprocessing results for the time-dependent continuous variables are shown in Supplementary Table S2. No statistically significant difference was observed among the development and validation sets.

3.2. Learning Curves

The training and validation losses during the training of the CNN algorithm are indicated by blue and green lines, respectively, in the learning curve (Figure 5). The learning curve was plotted to monitor the model performance over the epochs, representing the algorithm runs through the development set. The 21st epoch showed the lowest validation loss (0.291) and was then increased.

3.3. Performance

In the five-fold cross-validation analysis using the development set, the mean values of accuracy, F1 score, and AUC were 0.925, 0.927, and 0.925, respectively.
Finally, the AI prediction model demonstrated that the accuracy, F1 score, and AUC were 0.900, 0.909, and 0.900 in the internal validation set and 0.879, 0.882, and 0.881 in the external validation set, respectively (Table 3). In all validation sets (i.e., a combination of internal and external validation sets), accuracy, F1 score, and AUC were 0.887, 0.889, and 0.887, respectively.

3.4. Web Application of the AI Model

The developed AI model was then successfully uploaded to a public website (http://wonmoai.org/prediction, accessed on 11 April 2022) to provide mortality predictions using individual patient data publicly. The web application provides predicted mortality probability, as presented in Figure 6, without storing any information entered by users.

4. Discussion

In the present study, a mortality prediction model of patients undergoing gastric cancer surgery mainly based on body morphometry, nutritional, and surgical information using CNN was developed. The presented model was constructed using 15 selected features that can be divided into four categories: clinicopathologic (age, sex, height, BMI, and TNM stage), body morphometry (SFA, VFA, SMA/height2, and SMA/BMI), nutritional (hemoglobin, albumin, cholesterol, and NRI), and surgical information (type of operation and type of anastomosis). This AI model based on the abovementioned information presented a substantial performance in predicting mortality (accuracy 0.887, F1 score 0.889, and AUC 0.887 in all validation sets).
The AI method is known to be better than the Cox proportional hazard (CPH) model, which is the conventional method to calculate the risk factors for prognosis, due to the fact that AIs can process and analyze large amounts of data and can learn linear as well as nonlinear associations between prognostic clinical characteristics and an individual’s risk of death [24]. Zhu et al. [25] and Biglarian et al. [26] showed that the Artificial Neural Network (ANN) is a more powerful tool in determining the significant prognostic variables for gastric cancer patients compared to the CPH model in both accuracy and AUC. Among deep learning methods, as shown in Suo et al. [27] and Zhu et al. [28], the CNN is better than other deep learning approaches, including recurrent neural networks (RNNs), autoencoders, and others for predicting diseases based on patient similarity. Considering these findings, we employed a CNN.
Compared with other prior studies that developed AI models to predict overall survival in gastric cancer patients treated with gastrectomy (accuracy, ranging from 0.826 to 0.891), our CNN model showed analogous accuracy (0.900 in the internal validation set and 0.879 in the external validation set) for predicting overall survival rates [25,29,30]. The risk factors used in these AI models differed across studies. For example, Zhu et al. developed a prediction model (accuracy 85.3%) using an ANN with risk factors of disease stage, radical surgery, serum CA19-9 level, peritoneal dissemination, and BMI [25]. Rahman et al. developed a prediction model (AUC 0.80) using random survival forests with risk factors of age, cT stage, cN stage, WHO performance status, ASA grade, pT/ypT, lymph node metastasis, differentiation grade, resection completeness, and neoadjuvant treatment [24].
These AI models used in prior studies have relied primarily on clinicopathologic information, such as pathologic staging, including tumor size, penetration, lymph node metastasis, and distant metastasis, with or without demographic information [13,14,15]. The current study, on the other hand, describes the development of an AI model mainly based on body morphometry, nutritional, and surgical information. With respect to clinicopathologic information, only demographic data and the TNM stage were used. The vision behind the development of this AI model using these data was to enable both doctors and patients to enter patient data easily. Generally, pathologic information, such as tumor size, extent of tumor penetration, and number of lymph node metastases, is challenging to obtain for daily practitioners and patients. Nutritional information and surgical information, in contrast, are readily available for daily practitioners and patients.
Body morphometry information might not be readily available in daily practice, as body morphometry measurements require special postprocessing software to segment SMA, visceral, and subcutaneous fat areas. The AI team of this study developed an AI model to measure body morphometry on abdominal CT with high accuracy [19,31], which automatically selects the L3 slice level and segments muscle and fat areas. In the current study, AI body morphometry software (AID-UTM) was utilized to obtain body morphometry data and apply these data in the AI prediction model. Our future plan is to integrate AI body morphometry software and the AI prediction model so that mortality after gastrectomy can be evaluated efficiently based on entered nutritional, surgical, and clinicopathologic data as well as automatically generated body morphometry data.
The present study faced some limitations; a relatively small size of data for training and validation of our CNN model was initially used as the provided data were imbalanced between survived patients and deceased patients. The under-sampling method was recently applied in order to reduce the risk of skewing toward the majority. Nevertheless, the presented model was trained using a small size of data, demonstrating that the prediction of overall survival based on body morphometry, nutritional, and surgical information is feasible. Additionally, an external validation set was acquired from only one external institution (AUH), which could raise generalizability issues. AUH, however, is a tertiary hospital where many international patients are treated with gastrectomy. Further validation studies using other external institutions are thus required.

5. Conclusions

The present study clearly demonstrated the feasibility of predicting mortality using deep learning, including body morphometry, nutritional, and surgical information in gastric cancer patients treated with gastrectomy. The presented study results can serve as a foundation for further research aiming to develop and validate a comprehensive AI prediction model in patients treated with gastrectomy.

Supplementary Materials

The following supporting information can be downloaded at: https://www.mdpi.com/article/10.3390/app12083873/s1, Figure S1: Diagram of the modeling process. Independent variables refer to quantitative indices of various patients’ characteristics, and dependent variables refer to survival outcome; Table S1: Description of gastric surgery registries data; Table S2: Standardization of time-dependent continuous features in the development and all validation sets.

Author Contributions

Conceptualization, K.W.K. and I.-S.L.; methodology, K.W.K., Y.K., J.S. and H.S.; software, J.S. and H.S.; validation, H.S. and J.S.; formal analysis, H.S.; data curation, Y.K., H.H. and J.H.; writing—original draft preparation, Y.K. and H.S.; writing—review and editing, I.-S.L., J.S., H.H., J.H., T.P. and K.W.K.; visualization, Y.K. and H.S.; supervision, K.W.K.; funding acquisition, K.W.K., and I.-S.L. All authors have read and agreed to the published version of the manuscript.

Funding

This research was supported by a grant of the Korea Health Technology R&D Project through the Korea Health Industry Development Institute (KHIDI), funded by the Ministry of Health & Welfare, Republic of Korea (No. HI18C1216), and the grants from Asan Institute for Life Sciences and Corporate Relations of Asan Medical Center, Seoul, Korea (No. 2021IP0065 and No. 2017IT0216).

Institutional Review Board Statement

The study was conducted in accordance with the Declaration of Helsinki and approved by the Institutional Review Board of Asan Medical Center (2017-0216) and Ajou University Hospital (AJIRB-MED-MDB-22-012).

Informed Consent Statement

Patient consent was waived due to the retrospective nature of this study, and the analysis used anonymous clinical data.

Data Availability Statement

The data presented in this study are available on request from the corresponding author. The data are not publicly available due to ethical issues.

Conflicts of Interest

The authors declare no conflict of interest.

References

  1. Sung, H.; Ferlay, J.; Siegel, R.L.; Laversanne, M.; Soerjomataram, I.; Jemal, A.; Bray, F. Global cancer statistics 2020: GLOBOCAN estimates of incidence and mortality worldwide for 36 cancers in 185 countries. CA Cancer J. Clin. 2021, 71, 209–249. [Google Scholar] [CrossRef] [PubMed]
  2. Cheng, X.J.; Lin, J.C.; Tu, S.P. Etiology and prevention of gastric cancer. Gastrointest. Tumors 2016, 3, 25–36. [Google Scholar] [CrossRef] [PubMed]
  3. Tegels, J.J.; van Vugt, J.L.; Reisinger, K.W.; Hulsewé, K.W.; Hoofwijk, A.G.; Derikx, J.P.; Stoot, J.H. Sarcopenia is highly prevalent in patients undergoing surgery for gastric cancer but not associated with worse outcomes. J. Surg. Oncol. 2015, 112, 403–407. [Google Scholar] [CrossRef] [PubMed]
  4. Kim, K.W.; Lee, K.; Lee, J.B.; Park, T.; Khang, S.; Jeong, H.; Ko, C.S.; Yook, J.H.; Kim, B.S.; Lee, I.S. Preoperative nutritional risk index and postoperative one-year skeletal muscle loss can predict the prognosis of patients with gastric adenocarcinoma: A registry-based study. BMC Cancer 2021, 21, 157. [Google Scholar] [CrossRef]
  5. Asplund, J.; Gottlieb-Vedi, E.; Leijonmarck, W.; Mattsson, F.; Lagergren, J. Prognosis after surgery for gastric adenocarcinoma in the Swedish Gastric Cancer Surgery Study (SWEGASS). Acta Oncol. 2021, 60, 513–520. [Google Scholar] [CrossRef]
  6. Hu, D.; Peng, F.; Lin, X.; Chen, G.; Zhang, H.; Liang, B.; Ji, K.; Lin, J.; Chen, L.F.; Zheng, X.; et al. Preoperative metabolic syndrome is predictive of significant gastric cancer mortality after gastrectomy: The Fujian prospective investigation of cancer (FIESTA) study. EBioMedicine 2017, 15, 73–80. [Google Scholar] [CrossRef]
  7. Kim, H.J.; Lee, E.S.; Kim, B.J.; Kim, W.S.; Park, J.Y.; Kim, J.G.; Park, J.M.; Kim, J.W.; Chi, K.C.; Kang, H. Risk factors and clinical outcomes of postgastrectomy sarcopenia newly developed after curative resection for gastric cancer. Medicine 2022, 101, e28699. [Google Scholar] [CrossRef]
  8. Lee, K.; Kim, K.W.; Lee, J.B.; Shin, Y.; Jang, J.K.; Yook, J.H.; Kim, B.S.; Lee, I.S. Impact of remnant stomach volume and anastomosis on nutrition and body composition in gastric cancer patients. Surg. Oncol. 2019, 31, 75–82. [Google Scholar] [CrossRef]
  9. Kuwada, K.; Kuroda, S.; Kikuchi, S.; Yoshida, R.; Nishizaki, M.; Kagawa, S.; Fujiwara, T. Clinical Impact of Sarcopenia on Gastric Cancer. Anticancer Res. 2019, 39, 2241–2249. [Google Scholar] [CrossRef] [Green Version]
  10. Karimi, P.; Islami, F.; Anandasabapathy, S.; Freedman, N.D.; Kamangar, F. Gastric cancer: Descriptive epidemiology, risk factors, screening, and prevention. Cancer Epidemiol. Biomark. Prev. 2014, 23, 700–713. [Google Scholar] [CrossRef] [Green Version]
  11. Ouyang, X.; Dang, Y.; Zhang, F.; Huang, Q. Low serum albumin correlates with poor survival in gastric cancer patients. Clin. Lab. 2018, 64, 239–245. [Google Scholar] [CrossRef] [PubMed]
  12. Li, Z.; Bai, B.; Xie, F.; Zhao, Q. Distal versus total gastrectomy for middle and lower-third gastric cancer: A systematic review and meta-analysis. Int. J. Surg. 2018, 53, 163–170. [Google Scholar] [CrossRef] [PubMed]
  13. Li, Z.; Wu, X.; Gao, X.; Shan, F.; Ying, X.; Zhang, Y.; Ji, J. Development and validation of an artificial neural network prognostic model after gastrectomy for gastric carcinoma: An international multicenter cohort study. Cancer Med. 2020, 9, 6205–6215. [Google Scholar] [CrossRef] [PubMed]
  14. Niu, P.H.; Zhao, L.L.; Wu, H.L.; Zhao, D.B.; Chen, Y.T. Artificial intelligence in gastric cancer: Application and future perspectives. World J. Gastroenterol. 2020, 26, 5408–5419. [Google Scholar] [CrossRef]
  15. Jin, P.; Ji, X.; Kang, W.; Li, Y.; Liu, H.; Ma, F.; Ma, S.; Hu, H.; Li, W.; Tian, Y. Artificial intelligence in gastric cancer: A systematic review. J. Cancer Res. Clin. Oncol. 2020, 146, 2339–2350. [Google Scholar] [CrossRef] [PubMed]
  16. Liu, Y.; Chen, P.C.; Krause, J.; Peng, L. How to read articles that use machine learning: Users’ guides to the medical literature. JAMA 2019, 322, 1806–1816. [Google Scholar] [CrossRef]
  17. Lauren, P. The two histological main types of gastric carcinoma: Diffuse and so-called intestinal-type carcinoma. An a attempt at h Histo-clinical classification. Acta Pathol. Microbiol. Scand. 1965, 64, 31–49. [Google Scholar] [CrossRef]
  18. Veterans Affairs Total Parenteral Nutrition Cooperative Study Group. Perioperative total parenteral nutrition in surgical patients. N. Engl. J. Med. 1991, 325, 525–532. [Google Scholar] [CrossRef]
  19. Park, H.J.; Shin, Y.; Park, J.; Kim, H.; Lee, I.S.; Seo, D.W.; Huh, J.; Lee, T.Y.; Park, T.; Lee, J.; et al. Development and validation of a deep learning system for segmentation of abdominal muscle and fat on computed tomography. Korean J. Radiol. 2020, 21, 88–100. [Google Scholar] [CrossRef]
  20. Chen, T.; Guestrin, C. XGBoost: A scalable tree boosting system. In Proceedings of the 22nd ACM SIGKDD International Conference on Knowledge Discovery and Data Mining, San Francisco, CA, USA, 13–17 August 2016; pp. 785–794. [Google Scholar]
  21. Lin, W.-C.; Tsai, C.-F.; Hu, Y.-H.; Jhang, J.-S. Clustering-based undersampling in class-imbalanced data. Inf. Sci. 2017, 409–410, 17–26. [Google Scholar] [CrossRef]
  22. Arnold, T.B. kerasR: R interface to the keras deep learning library. J. Open Source Softw. 2017, 2, 296. [Google Scholar] [CrossRef] [Green Version]
  23. Kingma, D.P.; Ba, J. Adam: A method for stochastic optimization. arXiv 2014, arXiv:1412.6980. [Google Scholar]
  24. Rahman, S.A.; Maynard, N.; Trudgill, N.; Crosby, T.; Park, M.; Wahedally, H.; Underwood, T.J.; Cromwell, D.A. Prediction of long-term survival after gastrectomy using random survival forests. Br. J. Surg. 2021, 108, 1341–1350. [Google Scholar] [CrossRef] [PubMed]
  25. Zhu, L.; Luo, W.; Su, M.; Wei, H.; Wei, J.; Zhang, X.; Zou, C. Comparison between artificial neural network and Cox regression model in predicting the survival rate of gastric cancer patients. Biomed. Rep. 2013, 1, 757–760. [Google Scholar] [CrossRef] [Green Version]
  26. Biglarian, A.; Hajizadeh, E.; Kazemnejad, A.; Zali, M. Application of artificial neural network in predicting the survival rate of gastric cancer patients. Iran. J. Public Health 2011, 40, 80–86. [Google Scholar]
  27. Suo, Q.; Ma, F.; Yuan, Y.; Huai, M.; Zhong, W.; Zhang, A.; Gao, J. Personalized disease prediction using a cnn-based similarity learning method. In Proceedings of the 2017 IEEE International Conference on Bioinformatics and Biomedicine (BIBM), Kansas City, MO, USA, 13–16 November 2017; pp. 811–816. [Google Scholar]
  28. Zhu, Z.; Yin, C.; Qian, B.; Cheng, Y.; Wei, J.; Wang, F. Measuring patient similarities via a deep architecture with medical concept embedding. In Proceedings of the 2016 IEEE 16th International Conference on Data Mining (ICDM), Barcelona, Spain, 12–15 December 2016; pp. 749–758. [Google Scholar]
  29. Korhani Kangi, A.; Bahrampour, A. Predicting the survival of gastric cancer patients using artificial and bayesian neural networks. Asian Pac. J. Cancer Prev. 2018, 19, 487–490. [Google Scholar] [CrossRef]
  30. Biglarian, A.; Hajizadeh, E.; Kazemnejad, A.; Zayeri, F. Determining of prognostic factors in gastric cancer patients using artificial neural networks. Asian Pac. J. Cancer Prev. 2010, 11, 533–536. [Google Scholar]
  31. Ha, J.; Park, T.; Kim, H.K.; Shin, Y.; Ko, Y.; Kim, D.W.; Sung, Y.S.; Lee, J.; Ham, S.J.; Khang, S.; et al. Development of a fully automatic deep learning system for L3 selection and body composition assessment on computed tomography. Sci. Rep. 2021, 11, 21656. [Google Scholar] [CrossRef]
Figure 1. Example of body composition measurement using automated artificial intelligence software. Skeletal muscle area (red), subcutaneous fat area (brown), and visceral fat area (purple) decreased (b) one year after gastrectomy compared to (a) before surgery.
Applsci 12 03873 g001
Figure 2. Flowchart of feature selection and preprocessing. Asterisk (*) indicates the number of deaths.
Applsci 12 03873 g002
Figure 3. Architecture of the developed CNN model. All convolution layers used Rectified Linear Unit (ReLu) as the activation function.
Applsci 12 03873 g003
Figure 4. Feature importance of XGBoost. Among 47 features, 20 features were selected through a comparison of feature importance of XGBoost. BMI = body mass index.
Applsci 12 03873 g004
Figure 5. Learning curves in the development set. The gray dotted line presents the lowest loss in validation (0.291).
Applsci 12 03873 g005
Figure 6. Deployed web application: user inputs both preoperative and postoperative values for standardization of the time-dependent continuous variables.
Applsci 12 03873 g006
Table 1. Patient characteristics.
CharacteristicsAMC
(n = 621)
AUH
(n = 33)
Total
(n = 654)
Clinicopathologic
Age (year)55.7 ± 11.660.0 ± 12.055.9 ± 11.6
Sex
Male388 (62.5%)20 (60.6%)408 (62.4%)
Female233 (37.5%)13 (39.4%)246 (37.6%)
Height (cm)162.95 ± 8.35162.55 ± 8.12162.93 ± 8.34
Weight (kg)63.1 ± 10.361.5 ± 11.463.0 ± 10.4
BMI (kg/m2)23.7 ± 2.923.2 ± 3.223.7 ± 2.9
Type of operation
Distal gastrectomy396 (63.8%)25 (75.8%)421 (64.4%)
Total gastrectomy225 (36.2%)8 (24.2%)233 (35.6%)
TNM stage 1
1A78 (12.6%)18 (54.5%)96 (14.7%)
1B21 (3.4%)3 (9.1%)24 (3.7%)
2A138 (22.2%)2 (6.1%)140 (21.4%)
2B135 (21.7%)1 (3.0%)136 (20.8%)
3A110 (17.7%)3 (9.1%)113 (17.3%)
3B93 (15.0%)3 (9.1%)96 (14.7%)
3C42 (6.8%)3 (9.1%)45 (6.9%)
44 (0.6%)0 (0%)4 (0.6%)
Preoperative Body/Nutrition
SMA (cm2)124.2 ± 30.0125.8 ± 31.7124.3 ± 30.0
SFA (cm2)118.0 ± 55.2118.0 ± 55.2118.1 ± 55.5
VFA (cm2)97.7 ± 56.6100.3 ± 72.197.9 ± 57.4
NRI101.1 ± 6.4103.9 ± 7.6101.3 ± 6.5
Data are numbers (and percentages) or mean ± standard deviation. BMI = body mass index, NRI = nutritional risk index, SFA = subcutaneous fat area, SMA = skeletal muscle area, VFA = visceral fat area. 1 TNM stage was based on the American Joint Committee on Cancer 7th edition.
Table 2. List of features for the artificial intelligence model training.
FeaturesBased on XGBoost (n = 20)Based on Experts (n = 13)Selected for AI Model (n = 15)
AgeOOO
SexOOO
HeightOXO
BMIOOO
SFAOOO
VFAOOO
SMA/height2OOO
SMA/BMIOOO
NRIOOO
CholesterolOOO
HemoglobinOOO
AlbuminOXO
ProteinOXX
Type of operation (total vs. distal gastrectomy)OOO
Type of anastomosisOOO
TNM stage 1OOO
Distal resection marginOXX
Proximal resection marginOXX
Number of metastatic lymph nodesOXX
Number of retrieved lymph nodesOXX
BMI = body mass index, NRI = nutritional risk index, SFA = subcutaneous fat area, SMA = skeletal muscle area, VFA = visceral fat area. 1 TNM stage was based on the American Joint Committee on Cancer 7th edition.
Table 3. Performance of our CNN model on validation sets.
PerformanceAll Validation Sets
(n = 53)
Internal Validation Set
(n = 20)
External Validation Set
(n = 33)
Accuracy0.8870.9000.879
F1 score0.8890.9090.882
AUC0.8870.9000.881
AUC = area under the receiver-operating characteristic curve.
Publisher’s Note: MDPI stays neutral with regard to jurisdictional claims in published maps and institutional affiliations.

