Abstract
Based on the fact that damping alloys can convert mechanical energy into heat energy and dissipate it in materials and the environment, high-strength Fe-Mn damping alloys were used to replace common gear materials to absorb vibration-generated energy from the vibration source. A high-strength Fe-Mn damping alloy was developed. Taking two kinds of new damping alloy materials and common materials as the research object, a constitutive model of the Fe-Mn damping alloy material was established, the temporal increment step form of the three-dimensional constitutive model was deduced, and a user-defined material (UMAT) subprogram of the damping constitutive alloy model was developed by FORTRAN language. Based on the three-dimensional contact non-linear finite element model of the gear shaft-bearing box, a transient dynamic analysis was conducted using a non-explicit algorithm to obtain the responses of vibration acceleration on the gear reducer box, which can verify the correctness of the proposed constitutive model. The vibration experiments of the gear reducer made of the above-mentioned materials were carried out under different working conditions. The vibration reduction of the developed high-strength Fe-Mn damping alloy can be certificated by comparing the vibration acceleration response and the measuring point temperature of the gear reducer house prepared by different alloys.
1. Introduction
In the stage of gear design, vibration and noise depression can be achieved through the optimization of gear design parameters based on studying the gear vibration law according to gear system dynamics theory [1,2] or adopting an active control structure output force to reduce the vibration amplitude by employing appropriate control theories in the gear meshing process. For example, by arranging the damping ring, damping plug or viscoelastic damping layer on the gear, bearing seat or gearbox, the mechanical vibration energy of the gearbox is converted into heat energy among the damping layer, the gear body or box by friction, and the heat energy can be dissipated into the surrounding environment, thereby reducing the vibration amplitude. However, the damping effect created by the damping ring and damping plug is valid only when the gear’s natural frequency range is low but cannot achieve a wide range of frequency damping. For transmission systems with high precision or high-quality requirements on gears, the damping layer damping method is restricted in many application scenarios due to the limitation of additional mass or structure [3].
Compared with research about conventional vibration and noise reduction methods, the research on vibration and noise reduction by controlling the vibration source using gears and gear shafts made of a damping alloy with high strength and high damping characteristics has attracted the widespread attention of scholars. In the study of an Mn-Cu alloy, Zener found that 88% Mn-Cu alloy has a high internal friction value near room temperature and developed the Sonoston and Incramute damping alloys of the Mn-Cu series. Sonoston is a high damping alloy specially developed for submarine propellers by the British Shi-Mn Marine Company. As a deformed heat treatment material, Incramute is mainly used to manufacture bearing structures such as frames, bases and pedestals [4,5,6,7,8] Seung-Han Baik et al. [9] and Shariyat et al. [10] manufactured the housing of the escalator reducer using a Fe-Mn damping alloy; they conducted vibration and noise experiments and compared it with cast iron (GC20). The results showed that the noise sound pressure level of the reducer was reduced by about 5 dB using the Fe-Mn alloy. N. Igata [11] used Fe-12Cr-22Mn and Fe-12Cr-22Mn-2Co, which are high-damping stainless steel alloys, to manufacture bolts, nuts, gears, shanks, and NC machine tools. The experimental results also showed that the vibration and noise were suppressed.
K. Ha [12] et al. extended the existing constitutive model to a three-dimensional state and established a relatively simple nonlinear viscoelastic constitutive model of particle-filled rubber under a three-dimensional stress state. The model was implemented in finite element software and verified through experiments. To describe the changing responses of a solid viscoelastic microstructure, Muliana [13] et al. integrated the multiple natural configuration theory (multi-network model) with a single integral representation for constitutive equations to construct a model, which was also confirmed by experiments. Furthermore, the effects of microstructure changes on the macroscopic deformation of polymers over time were considered in the proposed model. Based on the one-dimensional rheological model, Zhu, Yilin et al. [14] set up a viscoelastic-viscoplastic constitutive model containing several springs and damper elements to represent the nonlinear and time-varying deformation behavior of polymers. A.M.G. De Lima [15] combined the damping of viscoelastic material with the pseudo-elasticity of a shape-memory alloy and deduced the time-domain model of the dynamics equation of viscoelastic material and shape memory alloy. Its damping effect was verified by a three-layer beam unit, using the shape-memory alloy steel rope symmetrically installed on both sides of the beam to control the vibration of the beam.
Peultier et al. [16] proposed a micromechanical formula based on two macroscopic scalar (integral martensitic volume fraction) and tensor (average strain) internal variables to simulate the constitutive equation of shape memory alloy, which was calculated by embedding the UMAT form into ABAQUS, and the obtained results were compared with the experimental results. A.J. Svobodnik [17] proposed a three-dimensional finite element material law for an elastoplastic analysis of unidirectional metal matrix composites, implemented in ABAQUS by the user subroutine UMAT. Pouya Haghdoust [18,19,20] built a nonlinear damping model, developed the ABAQUS user subroutine, and obtained the finite element method using the modified Marshall principle to simulate the nonlinear high-damping characteristics of martensite shape memory alloy. The hysteresis curve of the shape memory alloy was compared with the experimental hysteresis curve to verify the correctness of the founded nonlinear damping model.
Yun et al. [21] established the isotropic nonlinear viscoelastic constitutive model of solid propellant considering damage evolution, and the simulation calculation was realized using the user subroutine UMAT of ABAQUS. The stress tests of uniaxial and biaxial specimens were carried out under different loading conditions, different strain rates and temperatures. The experimental data were in good agreement with the simulation results. Based on the thermodynamic model of martensitic transformation, B. Peultier et al. [22] embedded the constitutive model describing the thermodynamic behavior of SMA in the ABAQUS material library, which could automatically update the relevant operators of the model in the calculation process. Pouya Haghdoust et al. [23] proposed a viscoelastic nonlinear damping model to simulate the mechanical behavior of martensitic shape memory alloy according to the modified Masin rule [24], developed the ABAQUS subroutine, and obtained the hysteretic curve of a Cu Al Mn metal plate under a traction-compression cyclic load, which was consistent with the actual test results. M. Toolabi et al. [25] used the implicit user-defined material subroutine of ABAQUS to calculate the mechanical parameters related to strain rate and Poisson’s ratio, which was applied to the study of mixed-mode fractures of symmetrical double cantilever beams. Based on the creep experiments of polymer composites under different stresses, Tong Sheng Sun et al. [26] established a three-dimensional nonlinear viscoelastic constitutive model combined with the Schapery equation and used the standard finite element program UMAT to predict the creep deformation of composite guide plates after 15 years of storage. Rashid K. Abu al rub et al. [27] established a numerical integration algorithm of the coupled constitutive model based on the continuous damage mechanics theory in the finite element software ABAQUS employing the user subroutine UMAT. By comparing the numerical prediction results of the model and the experimental data under different loading conditions, it was confirmed that the model has the ability to simulate the nonlinear viscoelasticity and damage behavior of viscoelastic polymers. To further clarify the main damping source of Fe-17.5Mn-0.022C alloy under low strain amplitude, the effects of different thermomechanical treatments on defect structure and damping in cold drawing were studied to improve the damping capacity of high-strength Fe-Mn based alloy [28]. Wen et al. [29] investigated the effects of quenching temperature and ageing on variations in vacancy concentration and segregation of solute atoms and their relationship with damping capacity in a Fe-Mn alloy. Some of the damping capacity can be remarkably improved by lowering the vacancy concentration, but it can also be deteriorated by the segregation of carbon atoms. A higher damping capacity can be obtained by furnace cooling or quenching and then ageing in an Fe-Mn alloy with lower carbon content or the addition of Co or Nb.
To verify the actual damping effect of mechanical parts made of an Fe-Mn alloy, it is necessary to establish the mapping relationship between the composition of the Fe-Mn alloy and its constitutive model to truly obtain the damping effect of the mechanical products fabricated by the Fe-Mn alloy. Unfortunately, there is no relevant research work at present. Therefore, we carried out this research work, and its main contributions are as follows.
- (1)
- A nonlinear constitutive model of Fe-Mn damping alloy materials based on viscoelastic theory is constructed and extended to a three-dimensional state using tensor theory. The time increment step form of the constitutive model is derived.
- (2)
- The user subroutine UMAT of the nonlinear constitutive model of the Fe-Mn damping alloy material is written, and the accuracy of the proposed constitutive model in representing the mechanical behavior of the Fe-Mn damping alloy is verified.
- (3)
- The transient dynamic of a gearbox is analyzed by using the LS-Dyna damping alloy material user subroutine, in which the spur gear pair of the gearbox is fabricated by Fe-Mn damping alloy.
This work is structured as follows: in Section 1, the current literature regarding viscoelastic materials of Fe-Mn and damping alloys is introduced. In Section 2, the processing technology and metallographic structure of Fe-Mn alloys are investigated. The properties of damping alloys are studied through the experimental properties of Fe-Mn alloy specimens in Section 3. The constitutive model of a new type of Fe-Mn damping alloy material is put forward in Section 4. The correctness of the non-linear constitutive model subroutine UMAT developed for damping alloy materials is verified in Section 5. The transient dynamic analysis of damping alloy gears is achieved in Section 6. The experimental verification is carried out in Section 7. Finally, the conclusions are drawn in Section 8.
2. Preparation of High-Strength Fe-Mn Alloy
With pure industrial iron, electrolytic manganese, metal chromium, metal cobalt and metal niobium as raw materials, an Fe-Mn alloy was melted in a ZG-25A vacuum induction furnace. After homogenization at 1100 °C for 24 h, the ingot was hot-forged into a sheet with a thickness of about 20 mm at 1000 °C. The chemical compound of the alloy for the experiment is shown in Table 1.

Table 1.
The chemical compound of the alloy.
2.1. Phase Analysis of Fe-Mn Alloy
Bruker D8 Advance X-ray diffractometer (XRD) was used for the phase identification of Fe-Mn alloy at room temperature. After mechanical polishing, different samples were electropolished in 20% HClO4 + 80% CH3COOH electrolyte. During electropolishing, the surface layer is guaranteed to be completely removed due to the stress generated by friction with the sandpaper. The experimental parameters were: CO target (λ = 1.7903 × 10⁻¹⁰ m); the target voltage and tube current were 50 kV and 35 mA; the receiving slit width R.S was 0.3 mm; and the scanning speed was 2°/min. γ austenite, ε martensite and α’. The diffraction peaks of three phases of martensite are shown in Table 2.
Table 2.
X-ray diffraction peaks of γ austenite, ε martensite and α’ martensite.
2.2. Phase Transformation Point Test of Fe-Mn Alloy
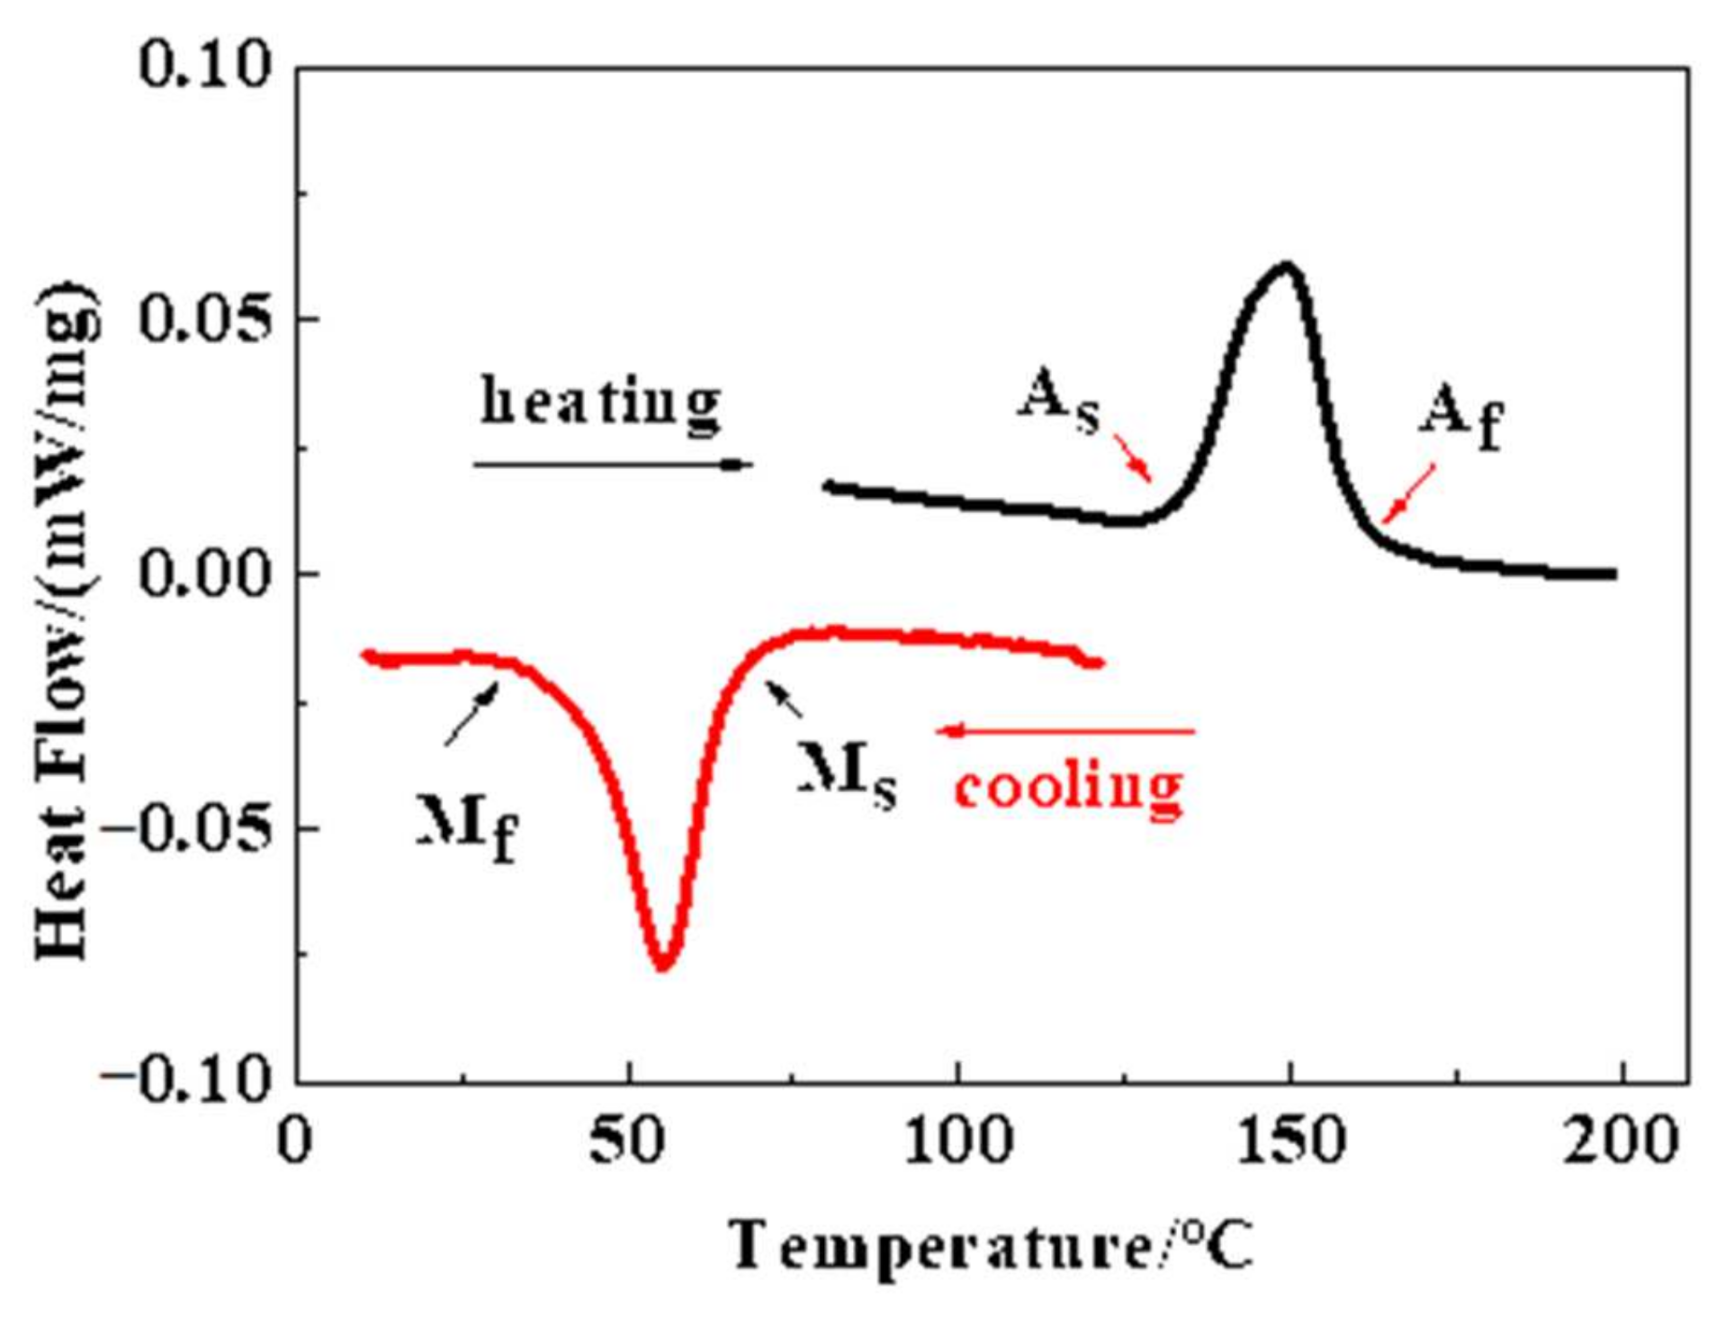
Differential scanning calorimetry (DSC) was adopted to test the phase transition point of the alloy, and the temperature rise and fall speed was 10 °C/min. As shown in Figure 1, there is an endothermic peak in the heating process of Fe-Mn alloy; the start point and the endpoint are the austenite transformation start temperature (As) and the austenite transformation end temperature (Af), respectively. There is also an endothermic peak during the cooling process from high to low temperatures. Its start point and endpoint are the martensite transformation start temperature (Ms) and martensite transformation end temperature (Mf). Since the transformation of γ→ε gradually proceeded with the decrease in temperature after heat treatment, the DSC curves of some samples did not obtain a clear Mf temperature.
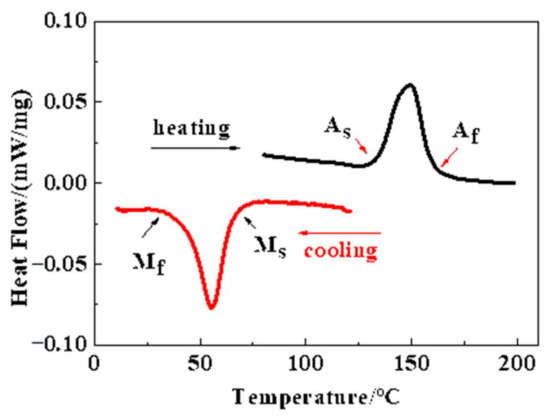
Figure 1.
DSC curves and phase transformation point of Fe-22Mn-12Cr-4Co alloy.
Due to the segregation of C atoms in the stacking fault zone, the damping performance of the Fe-Mn-based damping alloy could be greatly reduced after long-term aging. Wen et al. [29] proposed adding strong carbide elements, such as Nb and Co, to pin the diffusion of C atoms to inhibit the deterioration of damping properties of the Fe-Mn alloy during aging. The damping performances of the Fe-22Mn-12Cr-4Co-0.02C and Fe-22Mn-12Cr-4Co alloys were studied experimentally.
3. Experimental Properties of Fe-Mn Alloy Specimens
3.1. Experimental Properties of Annealed Fe-Mn Alloy Specimens
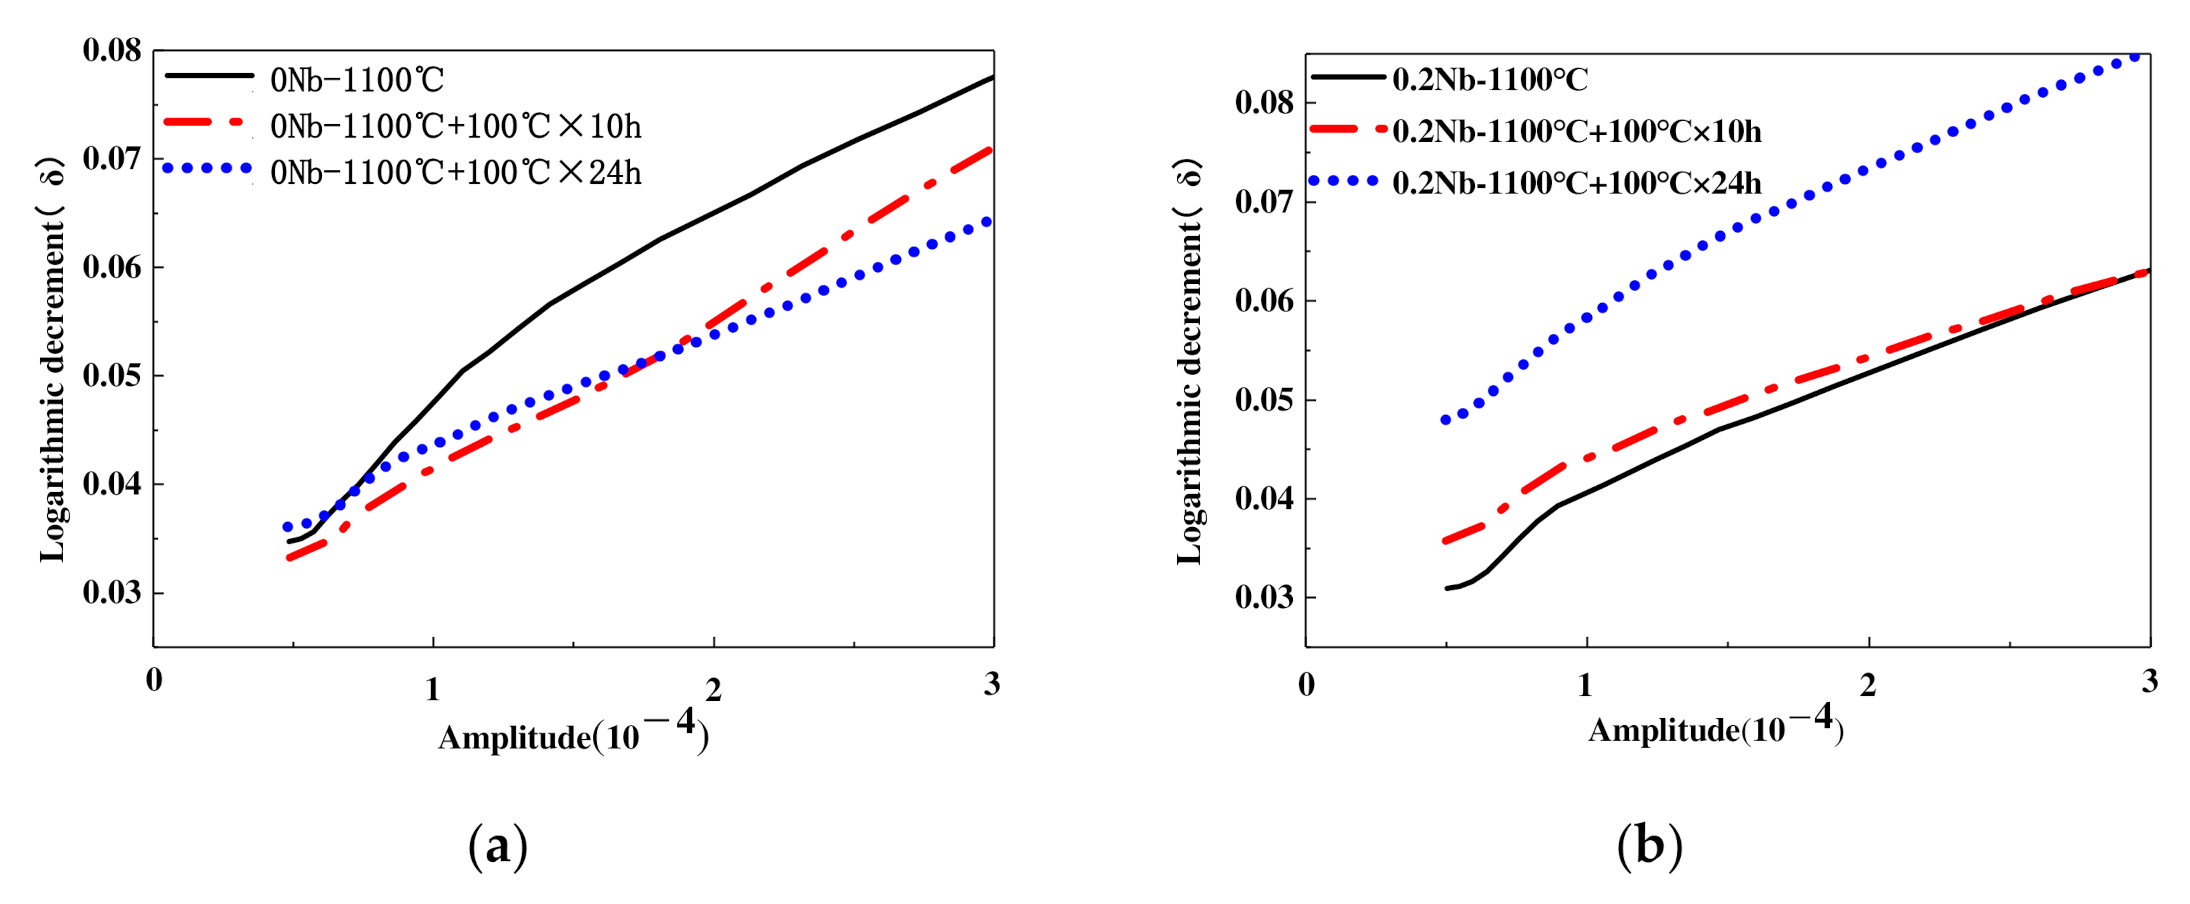
To explore whether the addition of the alloying element Nb can inhibit the deterioration of damping performance of the alloy during aging, two alloy specimens were selected for solid solution treatment at 1100 °C under argon protection for 15 min. They then were aged at 100 °C for 10 h and 24 h, respectively.
Figure 2 depicts the effect of aging time on the damping performances of the two alloy specimens. Their damping properties increase with increasing strain amplitude, but the damping performances of Fe-22Mn-12Cr-4Co-0.02C alloy decrease greatly with increased aging time. The damping performance of the alloy specimens aged 10 h is significantly lower than the non-aged ones. The damping performance of the alloy specimens aged 24 h is almost unchanged compared with those aged 10 h.
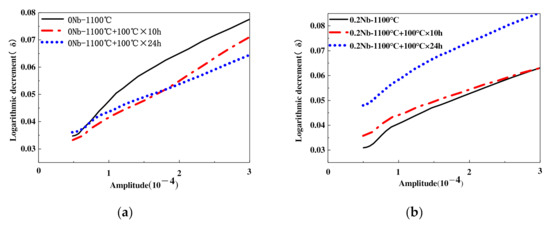
Figure 2.
Damping performance of two alloy specimens aged at 100 °C at different times. (a) 0 Nb in 1100 °C; (b) 0.2 Nb in 1100 °C.
Figure 3 depicts the influence law of aging time on the damping properties of the two alloys at strain amplitudes of 1 × 10⁻⁴ and 2 × 10⁻⁴, respectively. The damping performances of the Fe-22Mn-12Cr-4Co-0.2Nb-0.02C alloy after aging for 10 h is slightly improved compared with the unaged alloy. Still, after aging for 24 h, the damping performance of the alloy was improved greatly. When the strain amplitude of Fe-22Mn-12C-4Co-0.02C alloy is 2 × 10⁻⁴, with increased aging time, the damping performance decay rate is slower.
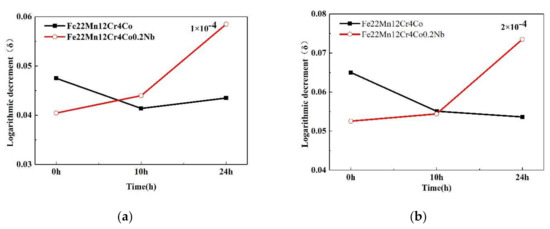
Figure 3.
Effect of aging time on two alloy specimens at different strain amplitudes of damping performance. (a) 1 × 10⁻⁴ strain amplitude; (b) 2 × 10⁻⁴ strain amplitude.
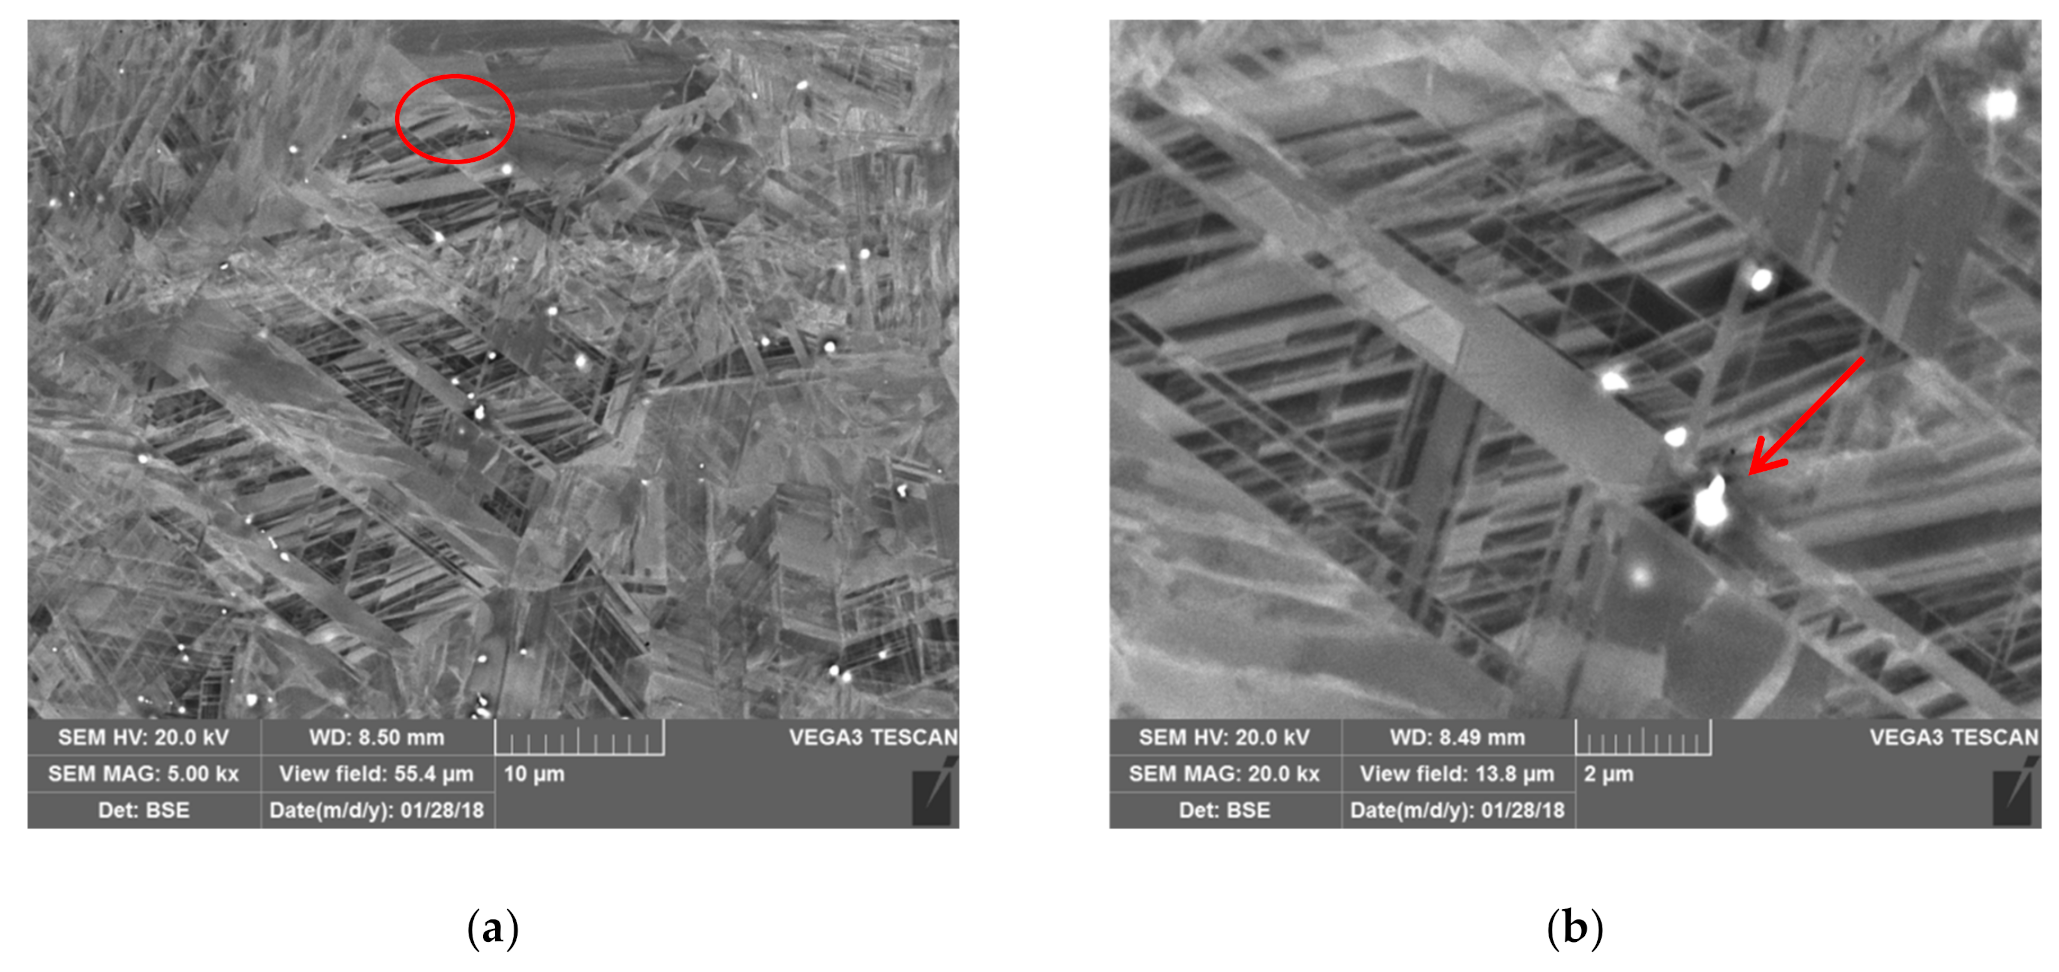
The backscattered electron images of Fe-22Mn-12Cr-4Co-0.2Nb-0.02C annealed at 1100 °C show hundreds of nanometers of second-phase NbC (white spots with arrows) in the alloy matrix, as shown in Figure 4.
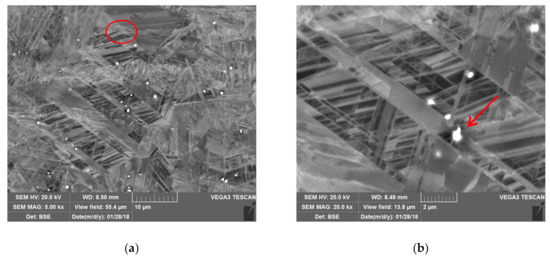
Figure 4.
The backscattered electron image of Fe22Mn12Cr4Co0.2Nb0.02C annealing at 1100 °C. (a) Backscattered electron image after annealing. (b) Enlarged image inside the circle.
3.2. Effect of Annealing Temperature on Fe-22Mn-12Cr-4Co-0.2Nb Alloy
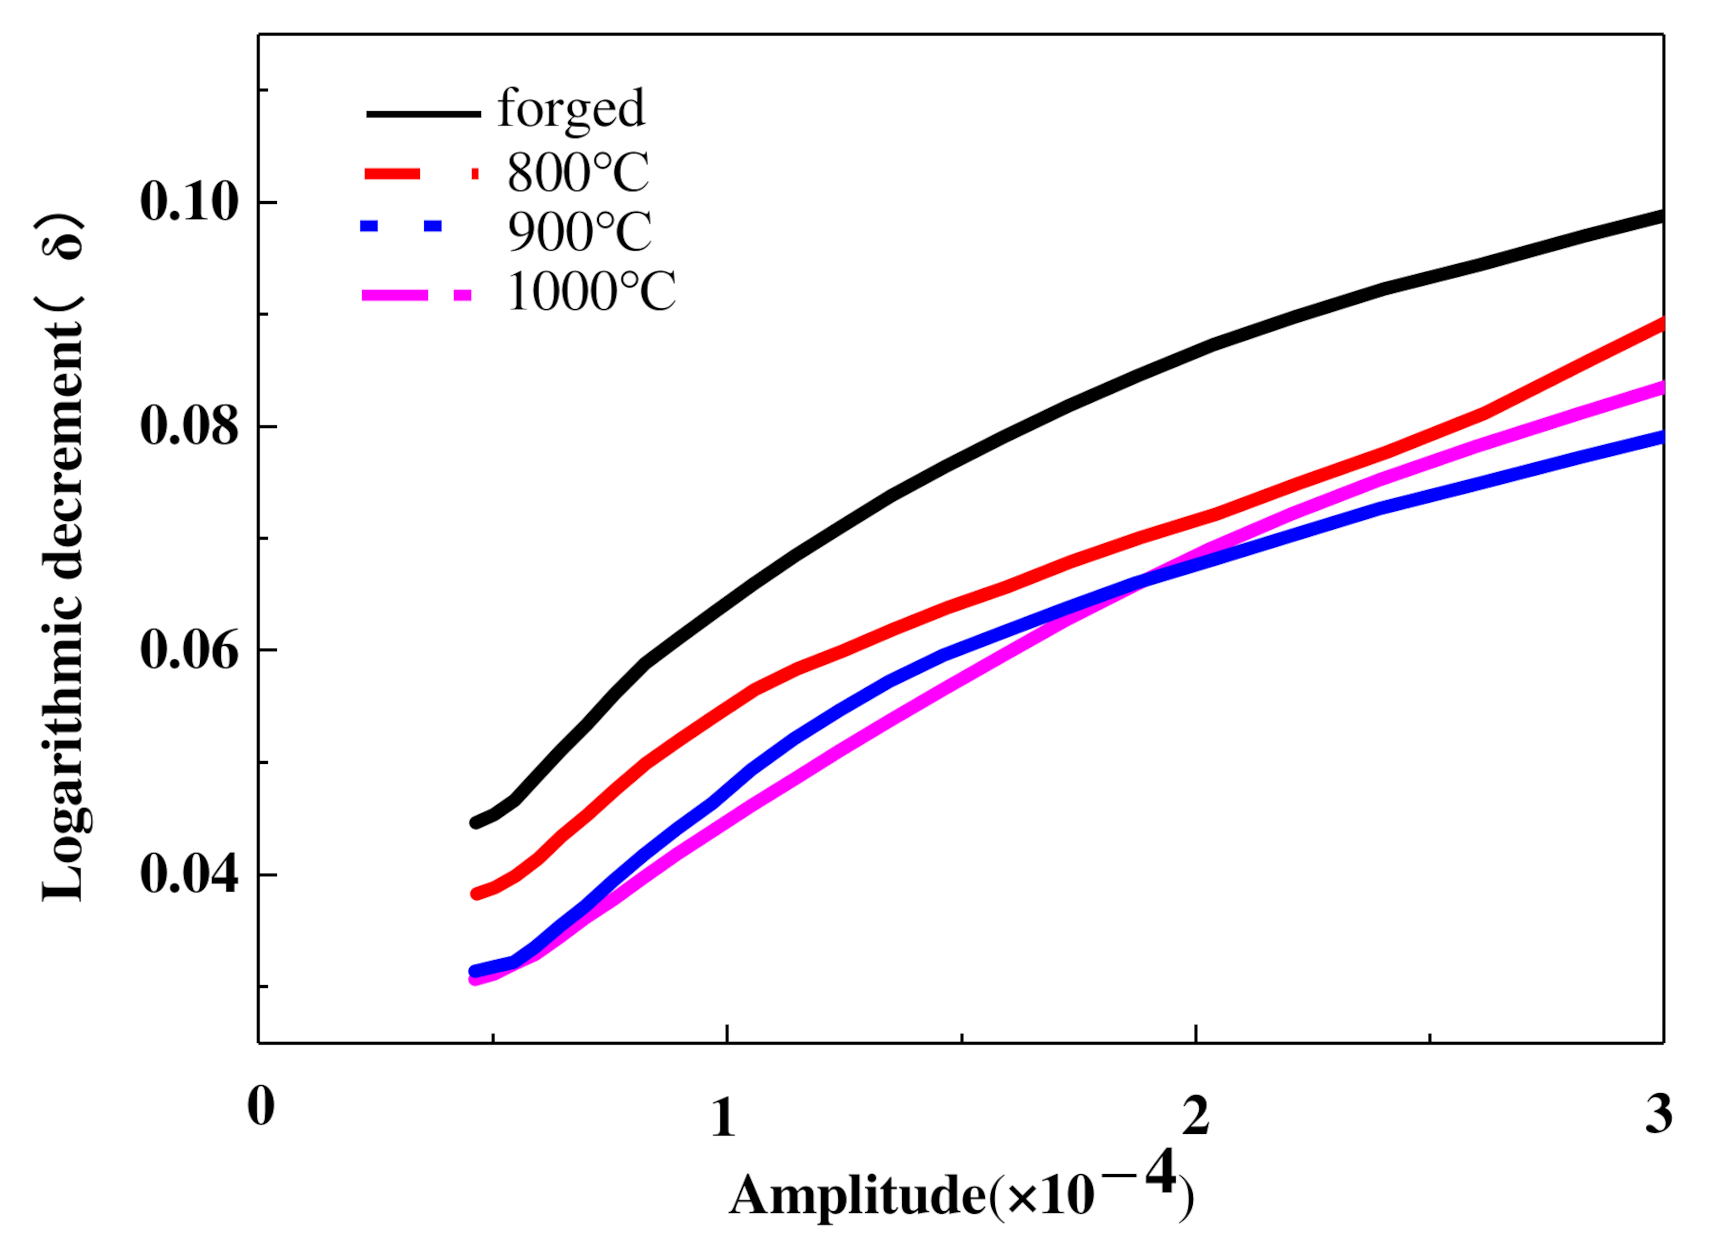
Figure 5 reflects the relationship between the damping performance and the strain amplitude of the alloy specimens under different annealing temperatures. The damping performances of alloy specimens increased with increased strain amplitude, and the damping performances of forging alloy specimens are the best. After annealing, the damping performance of the alloy specimen decreased greatly, and the higher the temperature, the more significantly the damping performance decreased.
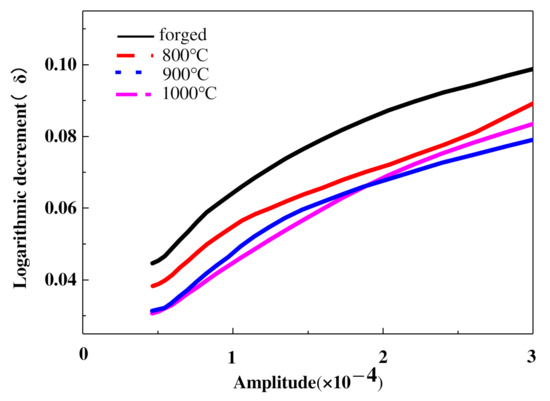
Figure 5.
The influence law of annealing temperature on the damping performance of Fe-22Mn-12Cr-4Co-0.2Nb-0.02C alloy.
3.3. Effect of Annealing Temperature on the Microstructure of the Alloy
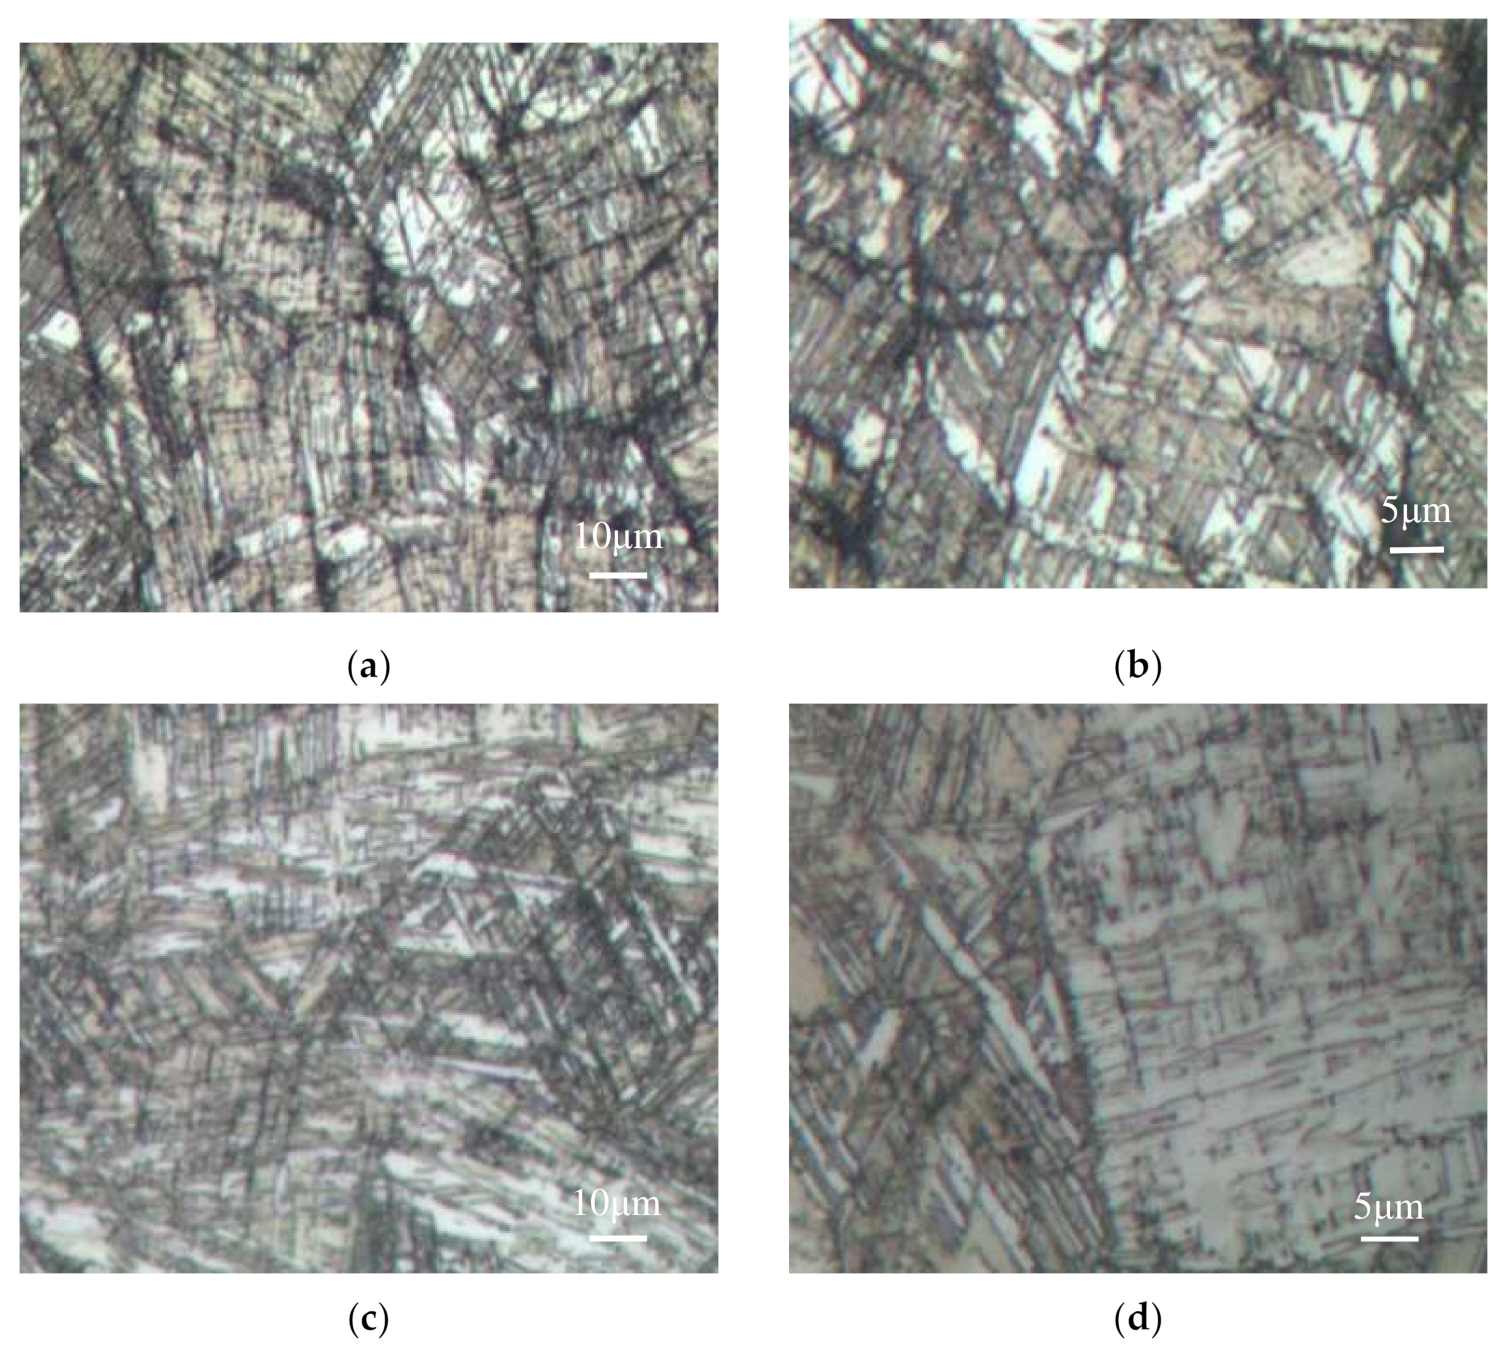
Figure 6 shows the color metallography diagrams of the alloy after different heat treatments. The alloy contains γ austenite and ε martensite (strip). It could be seen from Figure 6a,b that there are a large number of thin strip martensites in the alloy after forging. With the increase in annealing temperature, the thin strip ε martensite in the alloy gradually decreased.
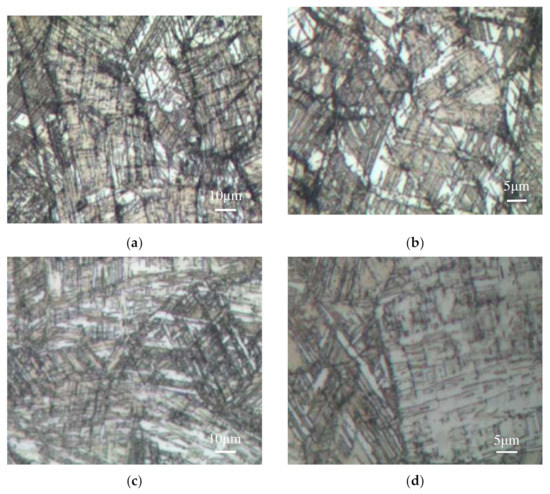
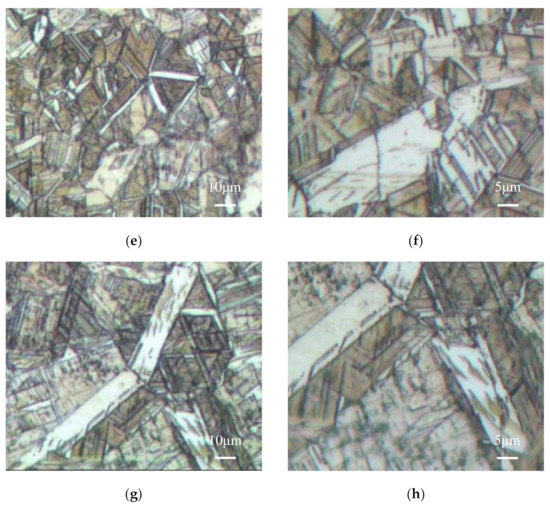
Figure 6.
The microstructure of Fe-22Mn-12Cr-4Co-0.2Nb alloy in different annealing states: (a,b): forging without annealing; (c,d): 800 °C; (e,f): 900 °C; (g,h): 1000 °C.
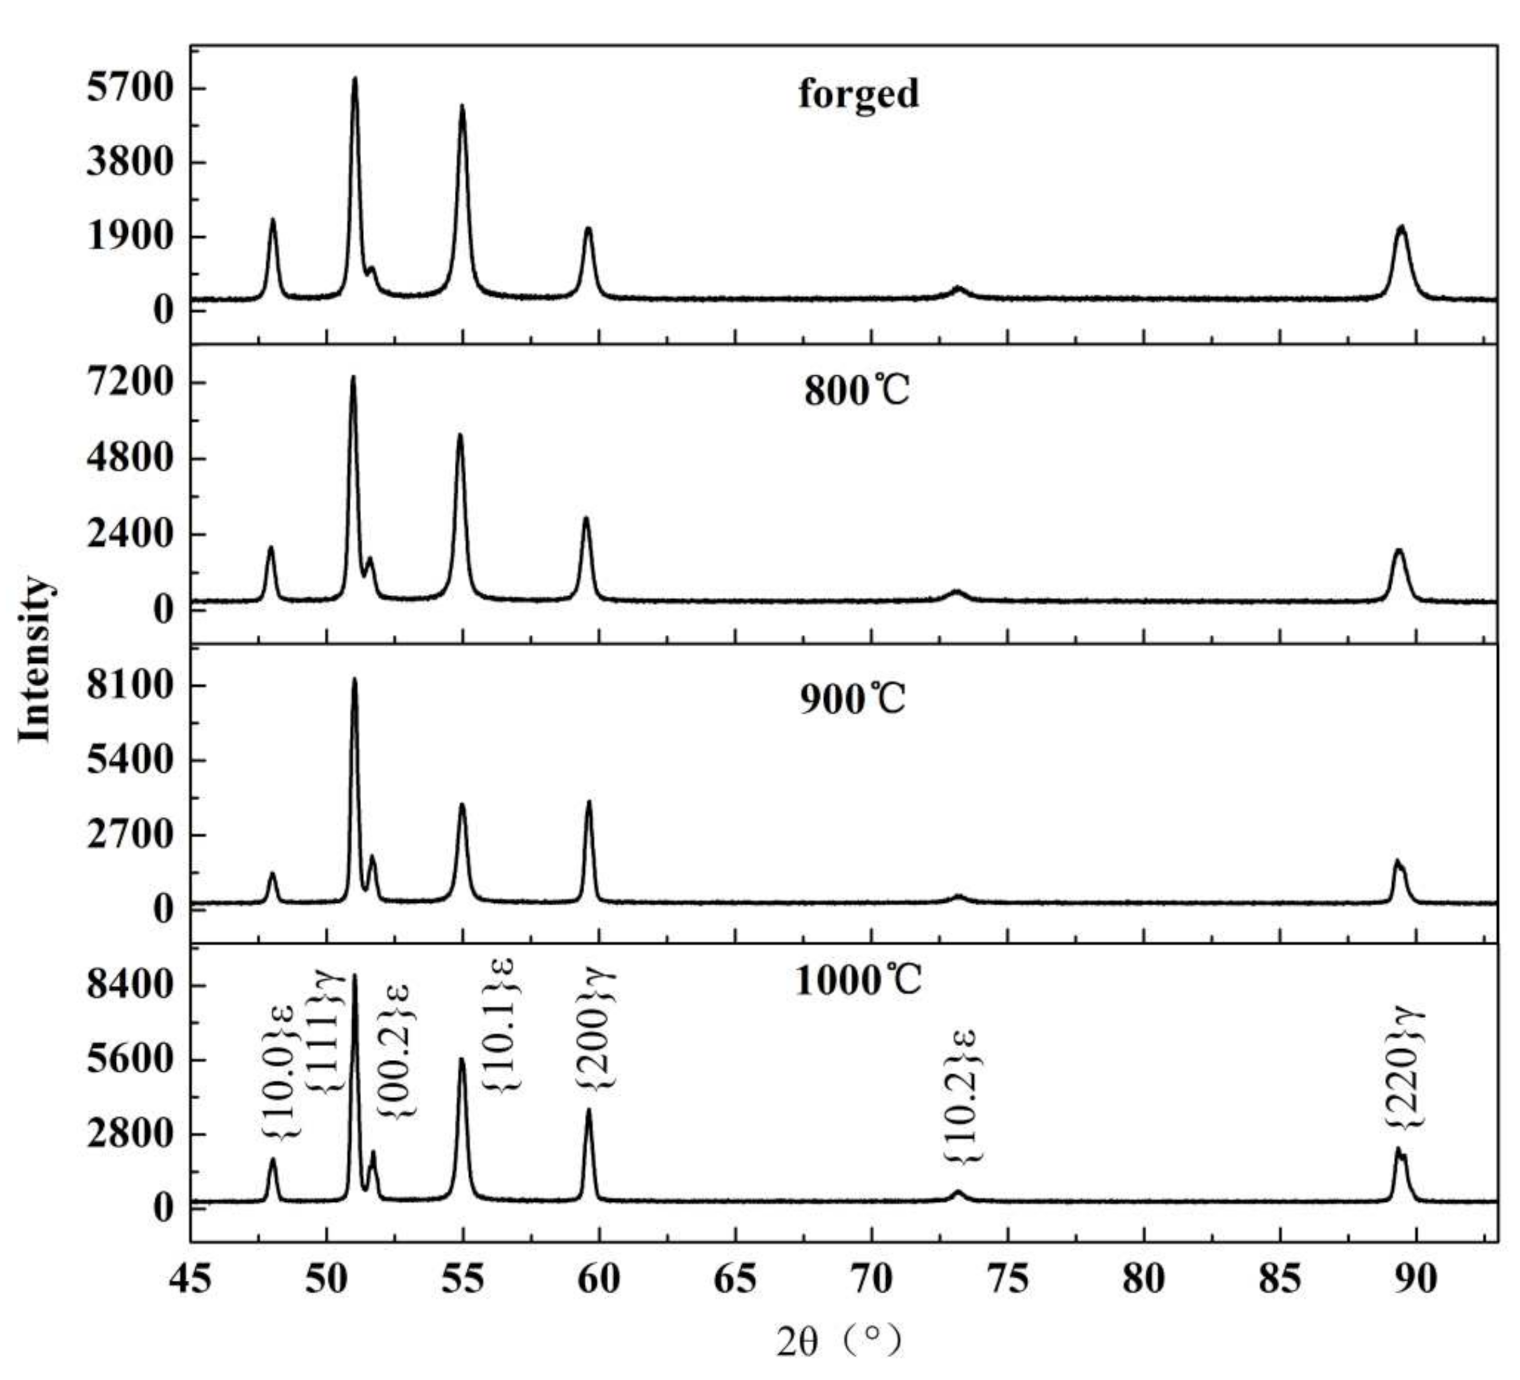
Figure 7 shows that the main phases in the forged alloy are γ austenite and ε martensite under different annealing temperatures.
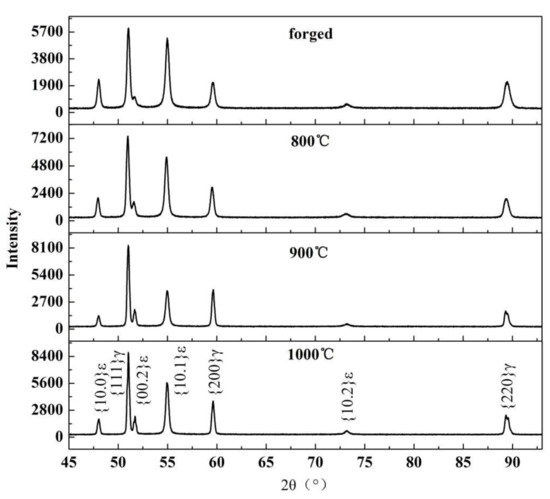
Figure 7.
XRD patterns of Fe-22Mn-12Cr-4Co-0.2Nb-0.02C alloy after annealing at different temperatures.
To effectively verify the damping effect of damping alloy materials compared with traditional materials, the damping performance of the Fe-Mn damping alloy was further studied from the constitutive curve of the Fe-Mn damping alloy, the finite element numerical simulation of the damping alloy, and the verification of the damping effect of the Fe-Mn damping alloy.
4. Constitutive Model of a New Type of Fe-Mn Damping Alloy Material
4.1. The Constitutive Equation for Loading
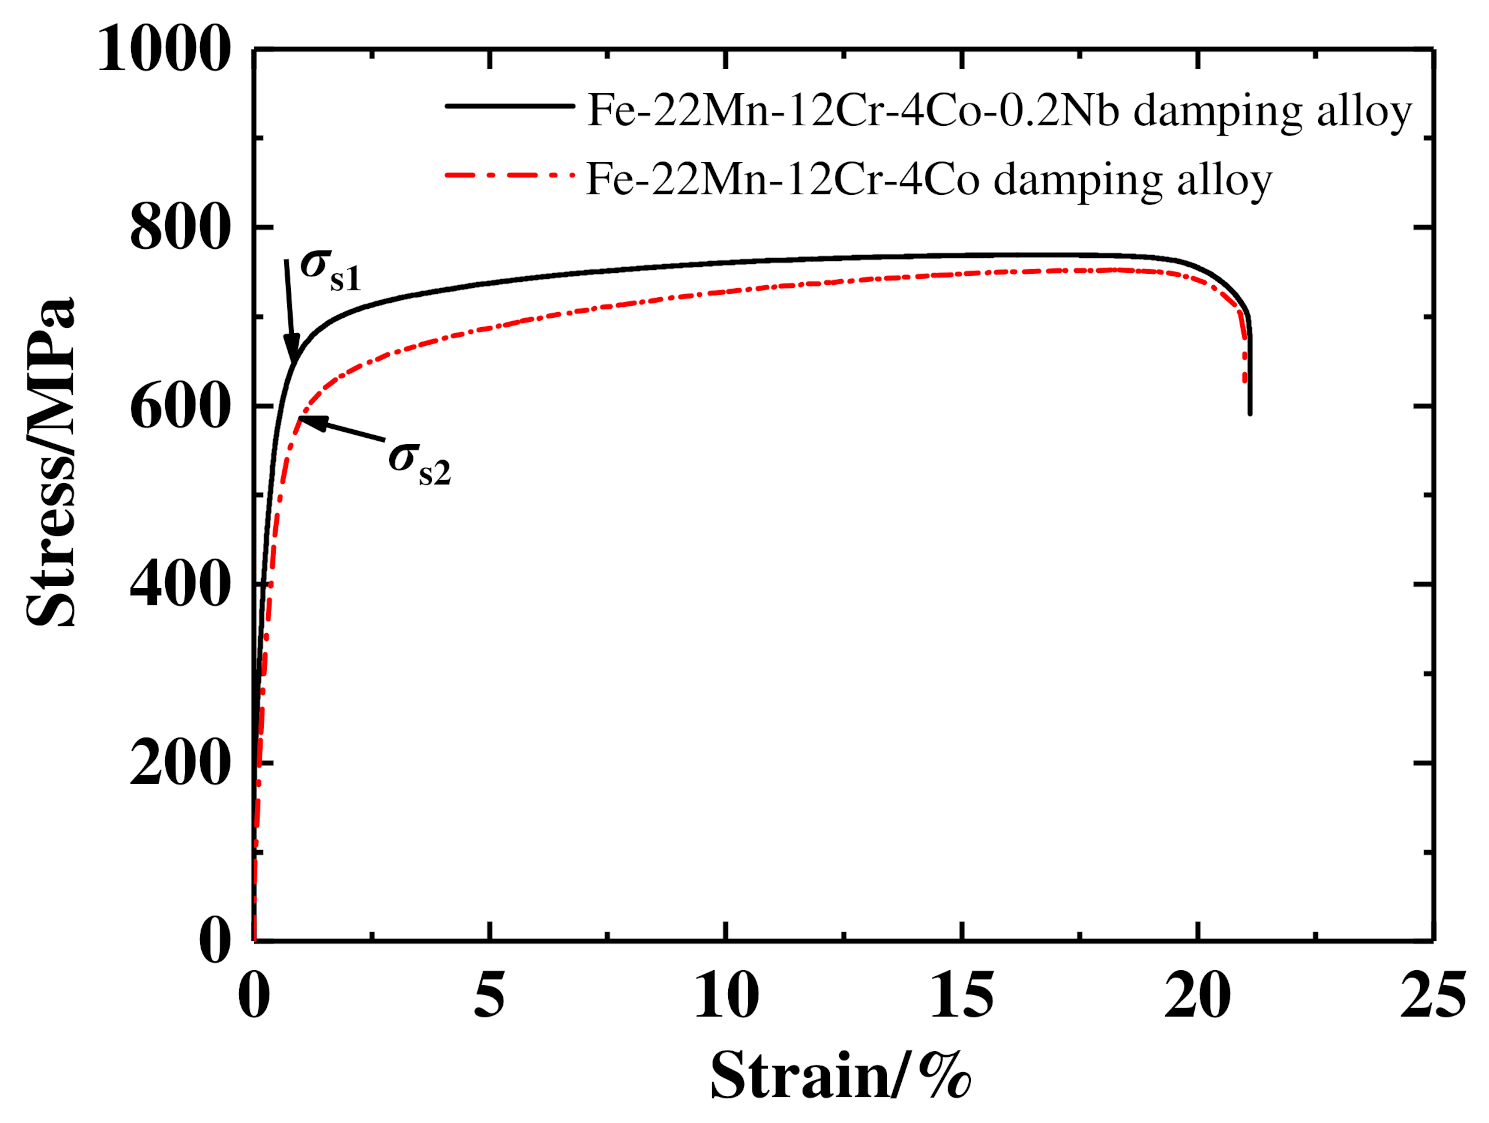
There are few currently available works of literature on the constitutive model of damping alloys. Damping alloys have high damping characteristics in general applications, and energy dissipation occurs. As shown in Figure 8, the engineering stress-strain curves of two kinds of damping alloy materials are obtained by conducting standard tensile tests on the Fe-22Mn-12Cr-4Co-0.2Nb alloy material and the Fe-22Mn-12Cr-4Co alloy material. The stress exceeded the yield limit, and the plastic deformation of the two damping alloys was significantly larger. However, the stress increase was much smaller. The tensile limit of the two damping alloys is very close. After the tensile limit was reached, necking occurred with continuous stretching, the stress decreased sharply, and the final fracture occurred. After the yield stage of the alloy, the stress and strain showed a nonlinear variation that did not conform to Hooke’s law. The stress-strain relationship of the damping alloy was very similar to that of high polymers (rubber, plastics, etc.) before the tensile limit was reached. The Fe-Mn damping alloy was characterized by high strength and low cost, and its damping property increases with increased strain amplitude. The viscoelastic theory was therefore used to construct its constitutive model.
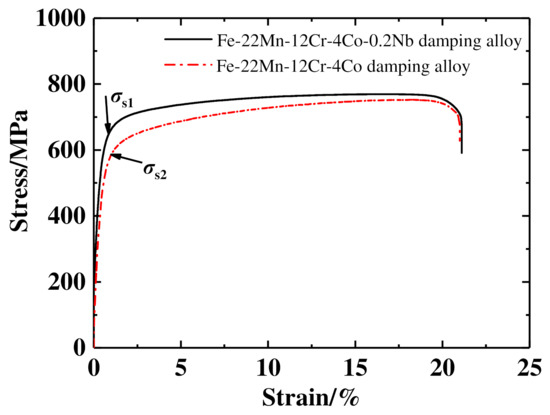
Figure 8.
Engineering stress-strain curves of two damping alloy materials.
The constitutive relations of linear, isothermal, homogeneous and isotropic viscoelastic materials in the time domain can be expressed as follows:
The relaxation modulus function was a continuous monotone, non-increasing function in time, represented by the stress relaxation part and related to the material itself. When , , .
The constitutive Equation (1) was extended to a three-dimensional state by using symmetric Piola–Kirchhoff stress tensor and Green strain tensor :
When the Cauchy stress tensor was transformed to the Cauchy stress tensor relative to the current configuration, the relationship was as follows:
where was the determinant of deformation gradient stress tensor , .
The expression of in Formula (2) was:
was the Jacobian matrix of the constitutive model, which was:
was Poisson’s ratio for the material. To solve the integrals in formula (2), the material parameters were expressed as Prony series.
By substituting Formula (5) with Formula (2), we could obtain:
Considering the gear reducer as a research object, the input speed was 500 rpm~900 rpm, the pinion tooth number was 19, and the gear tooth number was 26. The meshing motion between single teeth was low-frequency motion, and the influence of the high-frequency Maxwell element could be ignored. The model could be simplified to consist of a nonlinear spring element and a low-frequency Maxwell element in parallel, as shown in Figure 9.
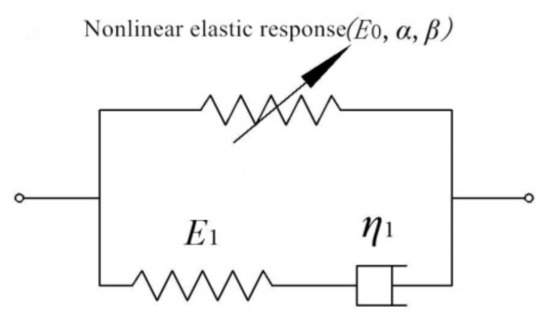
Figure 9.
Simplified model of damping alloy material.
The constitutive model of nonlinear damping alloy materials was as follows:
The integral term of the viscoelastic response in Formula (7) was related to the deformation history. The nonlinear elastic response could be written as a step increment scheme according to the stress tensor and the strain tensor . Let the viscoelastic response section be:
Then, the of moment was:
When was very small, that was, within the time of , the strain rate of the moment and the moment is approximately equal: .
Formula (8) was simplified as:
Formula (9) could be simplified as:
That was:
Therefore,
The increment of the stress tensor in the interval was:
where and represented the nonlinear elastic coefficient of the loading curve, ,, and represented the nonlinear elastic coefficient of the unloading curve, represented the viscoelastic constant and represented the viscoelastic relaxation time. Among them, was solving the formula through the recursive form. The stress recursion relation on the time increment step was as follows:
Formula (15) was a three-dimensional time increment form of the constitutive equation of a new type of Fe-Mn damping alloy material. According to Formula (3), the corresponding Cauchy stress could be calculated.
4.2. The Constitutive Equation for Unloading
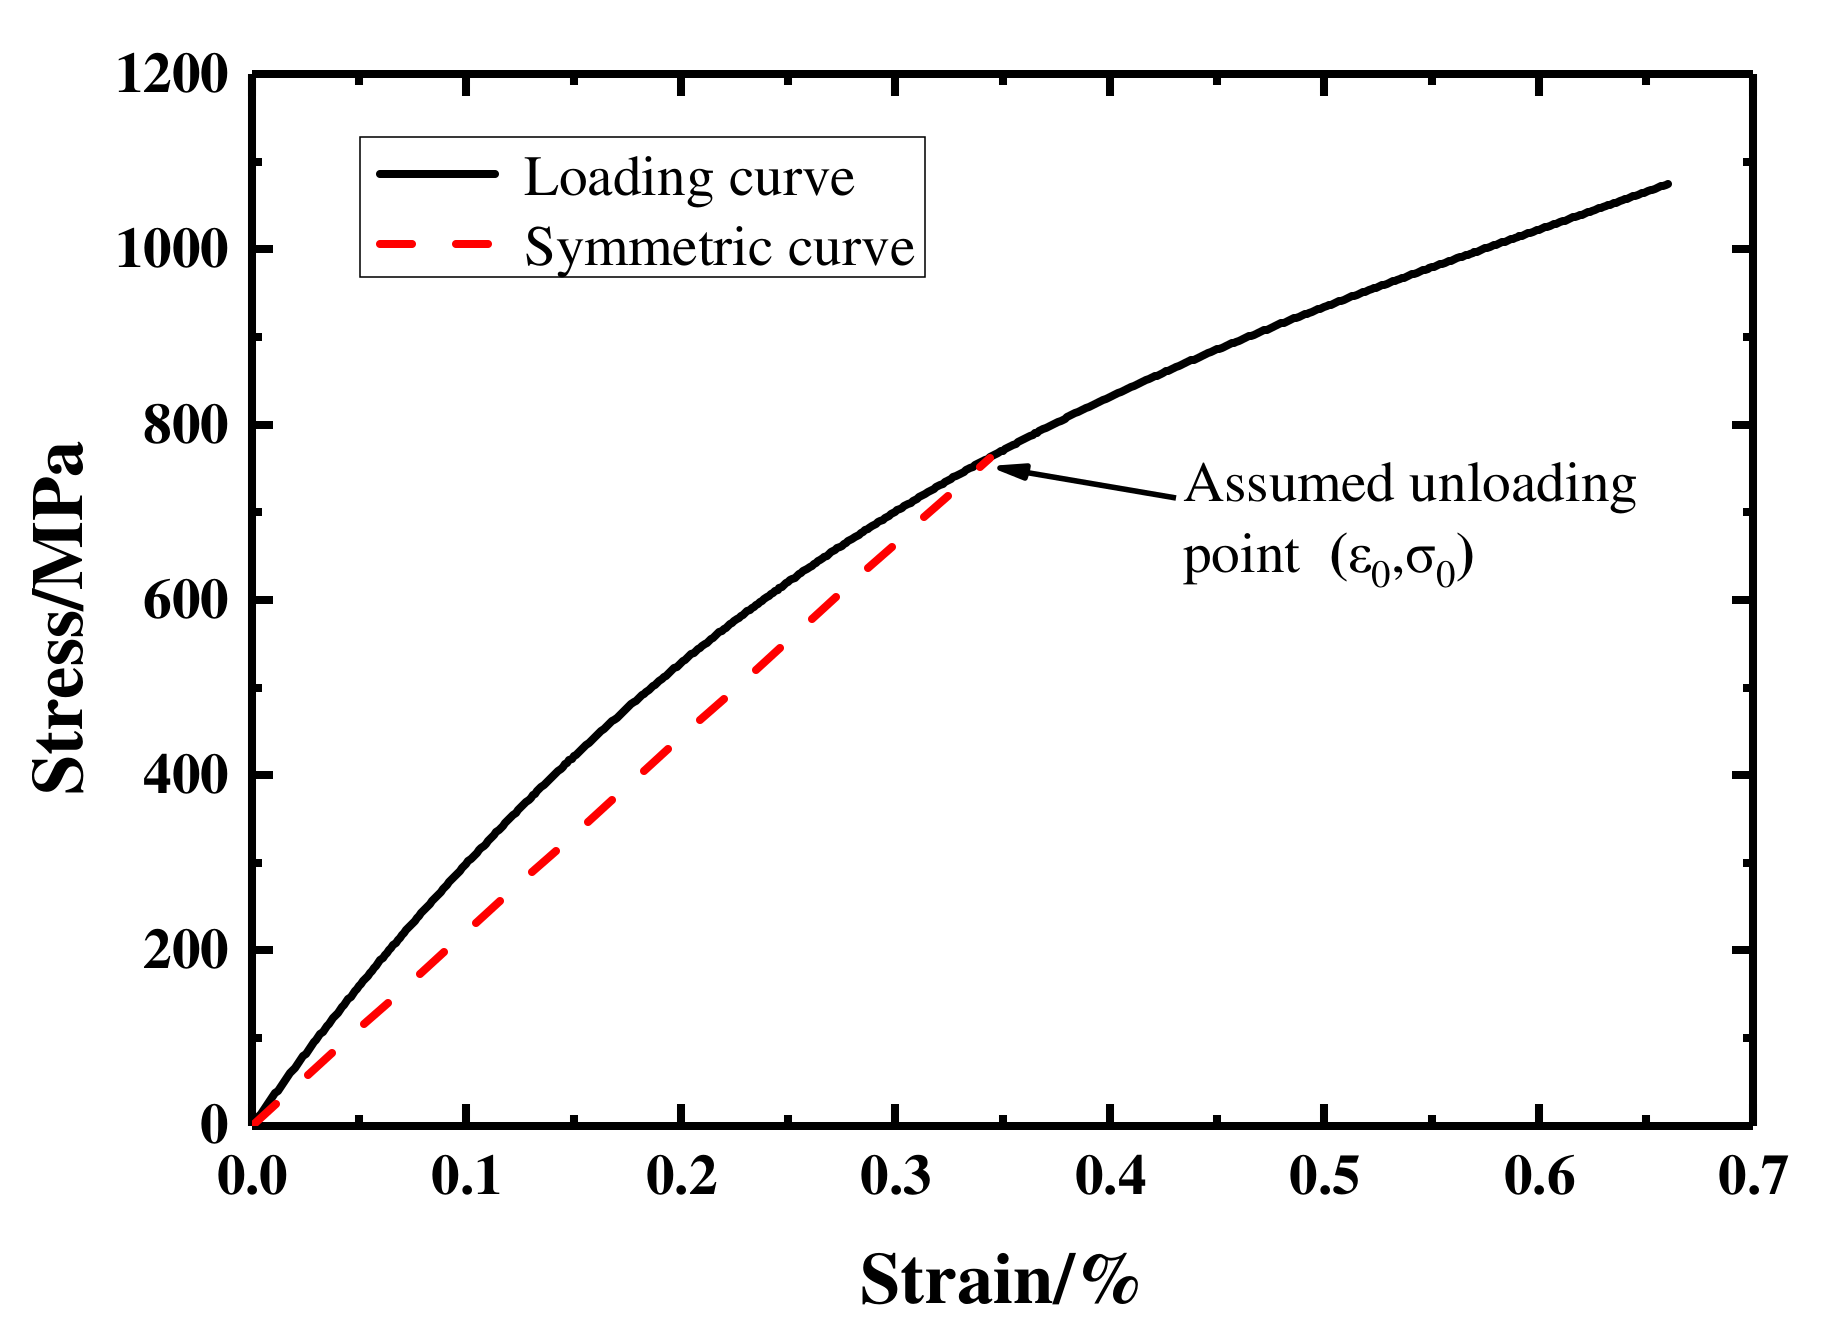
To determine the constitutive equation of the damping alloy material at different unloading points, the unloading curve was approximately located in the nonlinear elastic response part, according to the experimental stress-strain curve before the stress of material reached the yield limit. The unloading and loading curves were approximately symmetrical about the straight line connecting any unloading point and the origin. Assume that unloading begins in ; then, the straight-line equation of its origin was . After making the loading curve symmetric about this line, the unloading curve could be obtained, as shown in Figure 10.

Figure 10.
Loading curve and assumed unloading point.
We dimmed the unloading curve to and the loading curve to . The tangential slope of the loading curve at a certain point was , the tangential slope of the corresponding point on the unloading curve was , and the slope of the symmetrical curve was . According to the angle relationship of the symmetrical curve, the following could be obtained:
At the origin, the derivative of the loading curve was . The derivative of the unloading curve was , and when , . Then, we obtained
At the unloading point , the derivative of the loading curve was , and the derivative of the unloading curve was . After substituting them into Equation (17), it was equal to:
In addition, the unloading curve passes the unloading point . Then
From Equations (18) and (19), we obtained , , and , where and . Thus, the unloading curve at the unloading point was .
After the unloading curve was obtained, referring to the stress tensor increment of the loading curve within the time interval , the increment of the Kirchhoff stress tensor was:
5. The User Subprogram of LS-Dyna Software for the Constitutive Model of the Damping Alloy Material
LS-Dyna software does not have a constitutive model of new materials such as damping alloys. It is necessary to use the user-defined material interface module UMAT provided by LS-Dyna software on the basis of the above-mentioned research works to write the user subprogram of LS-Dyna software for a constitutive model of the damping alloy material to carry out the secondary development of the material subprogram of LS-Dyna software and to verify the written subprogram and constitutive model by the uniaxial tensile specimen model.
5.1. Calculation Process
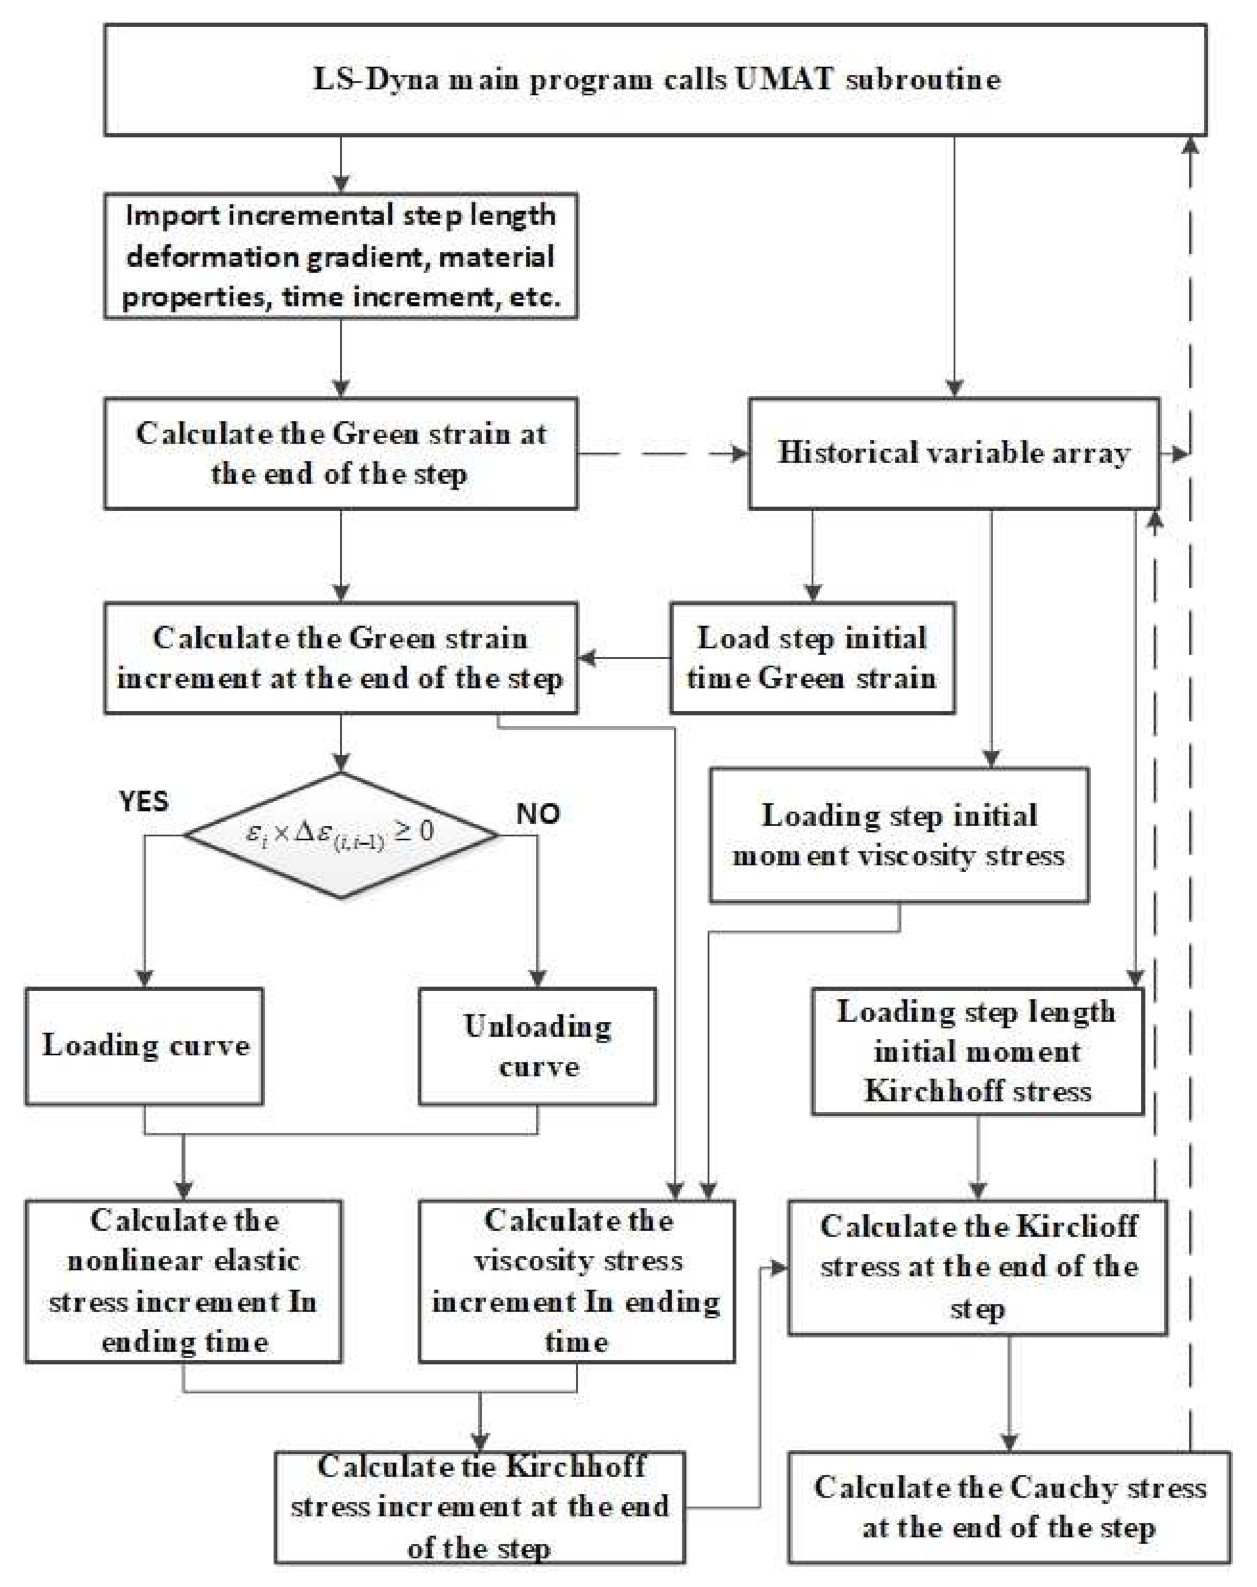
Based on the constitutive equation of a new type of Fe-Mn damping alloy material, we wrote a UMAT subprogram of the non-linear constitutive model of the damping alloy material with FORTRAN language and applied the nonlinear constitutive model of damping alloy materials to the simulation of the finite element software LS-Dyna. The flow chart is shown in Figure 11. The real lines represent the parameters imported into the subroutine by the main program and the data passed in the subroutine. In contrast, the dashed lines represent the data that needed to be returned by the subroutine to LS-Dyna. The numerical calculation steps of the constitutive equation of damping alloy materials were as follows:
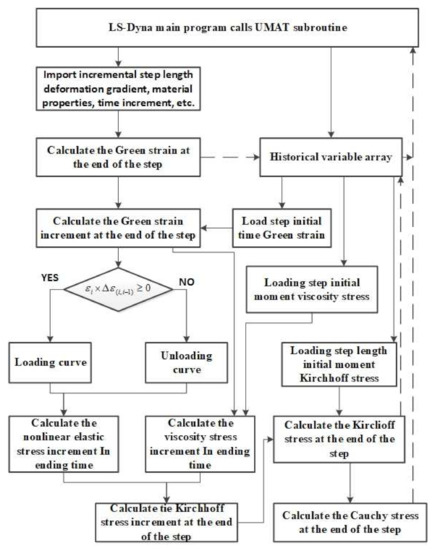
Figure 11.
Calculation flow of user-defined subroutine for damping alloy material.
- We first imported the material attributes , , , , , , and from the LS-Dyna main program, with the variables at the beginning of the time step being the deformation gradient tensor , time increment , and an array of historical variables;
- We then loaded the strain tensor , the stress tensor and the viscous response stress of the previous step from the user-defined array of historical variables;
- We calculated the strain tensor and the increment of the strain tensor of the current step length;
- We calculated the nonlinear elastic stress increment and viscoelastic stress increment ;
- We calculated the increment of the stress tensor ;
- We calculated the stress tensor ;
- We calculated and returned the Cauchy stress tensor at the end of the incremental step;
- We then updated the state variables , , , etc.
5.2. Example Verification
In order to verify the correctness of the non-linear constitutive model subroutine UMAT developed for damping alloy materials, the standard uniaxial tensile finite element model was employed, as shown in Figure 12, which included 450 elements and 740 nodes. The boundary condition was as follows: the left end was fixed, and the velocity load of 350mm/s was forced to the right section in the x-direction. The time step was 0.0001 s and the loading time was 0.01 s. We took as material parameters t/mm3, MPa, and .
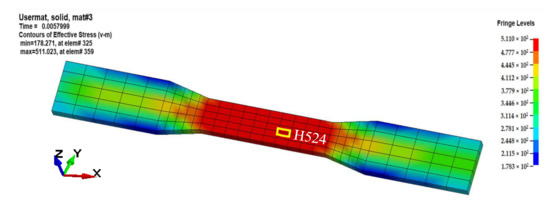
Figure 12.
Contours of the finite element model of effective stress.
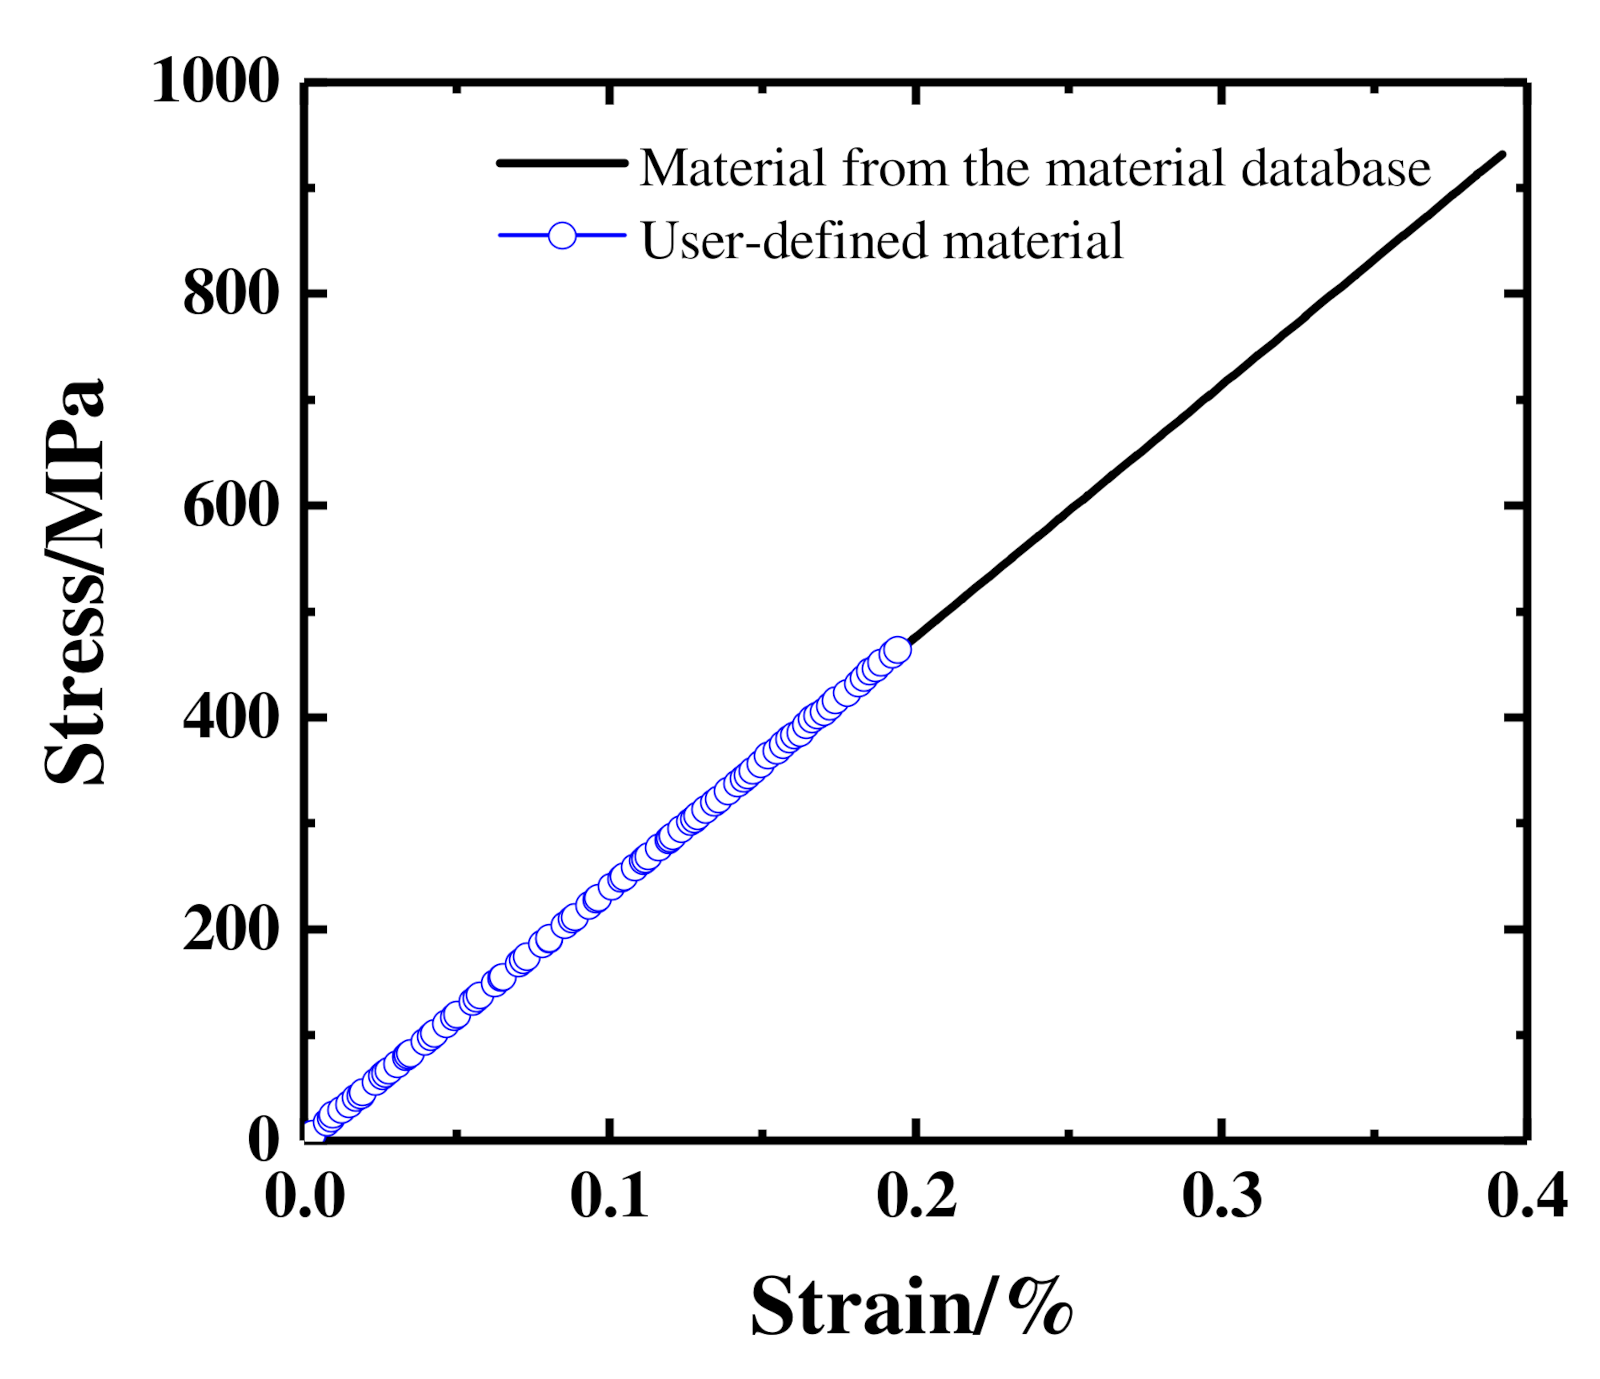
The stress-strain results of the finite element model numbered 524 were extracted, and the stress-strain curves were achieved using the two methods of the LS-Dyna software material library and the user-defined material subroutine, respectively. The result is shown in Figure 13. The stress values increase linearly with increased strain values. The two completely coincide with the theoretical stress-strain curves, which prove the correctness of the subprogram of linear elastic materials written in the research.
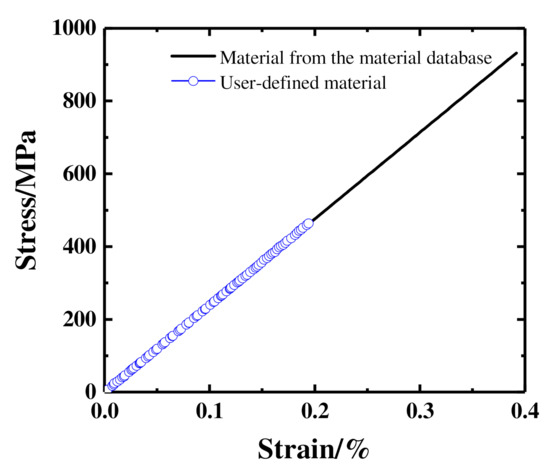
Figure 13.
Comparison of stress-strain relationships.
6. Transient Dynamic Analysis of Gears Made by Damping Alloy Materials
6.1. Numerical Simulation of Damping Alloy Materials
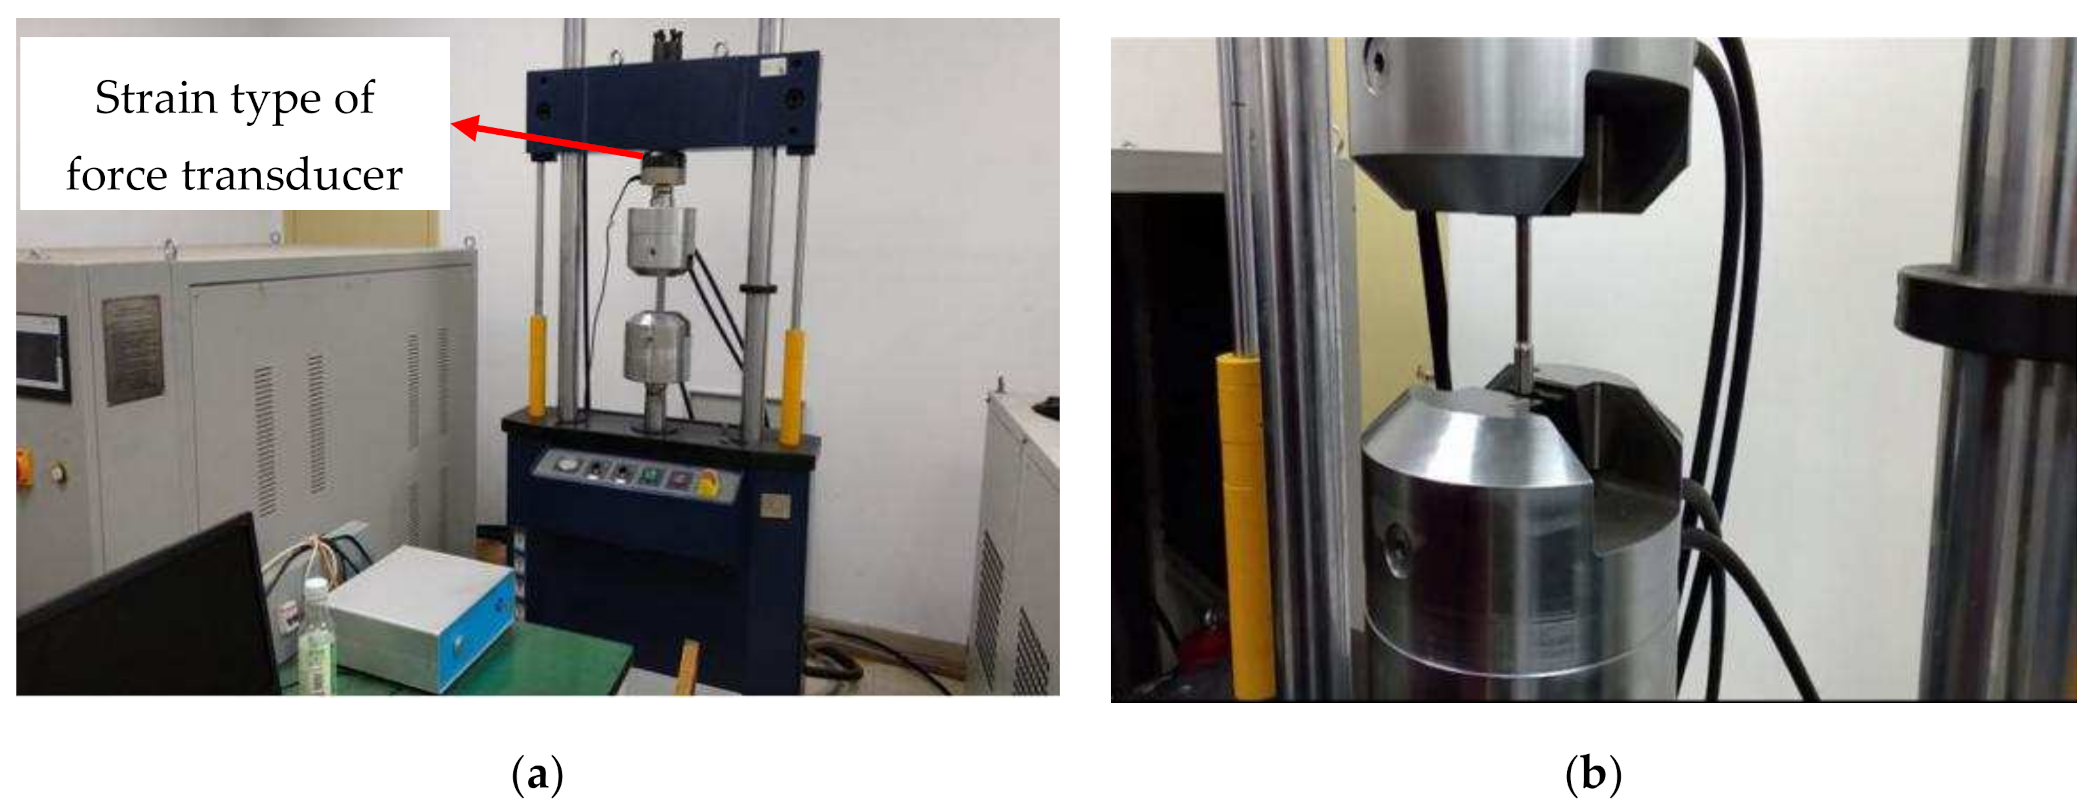
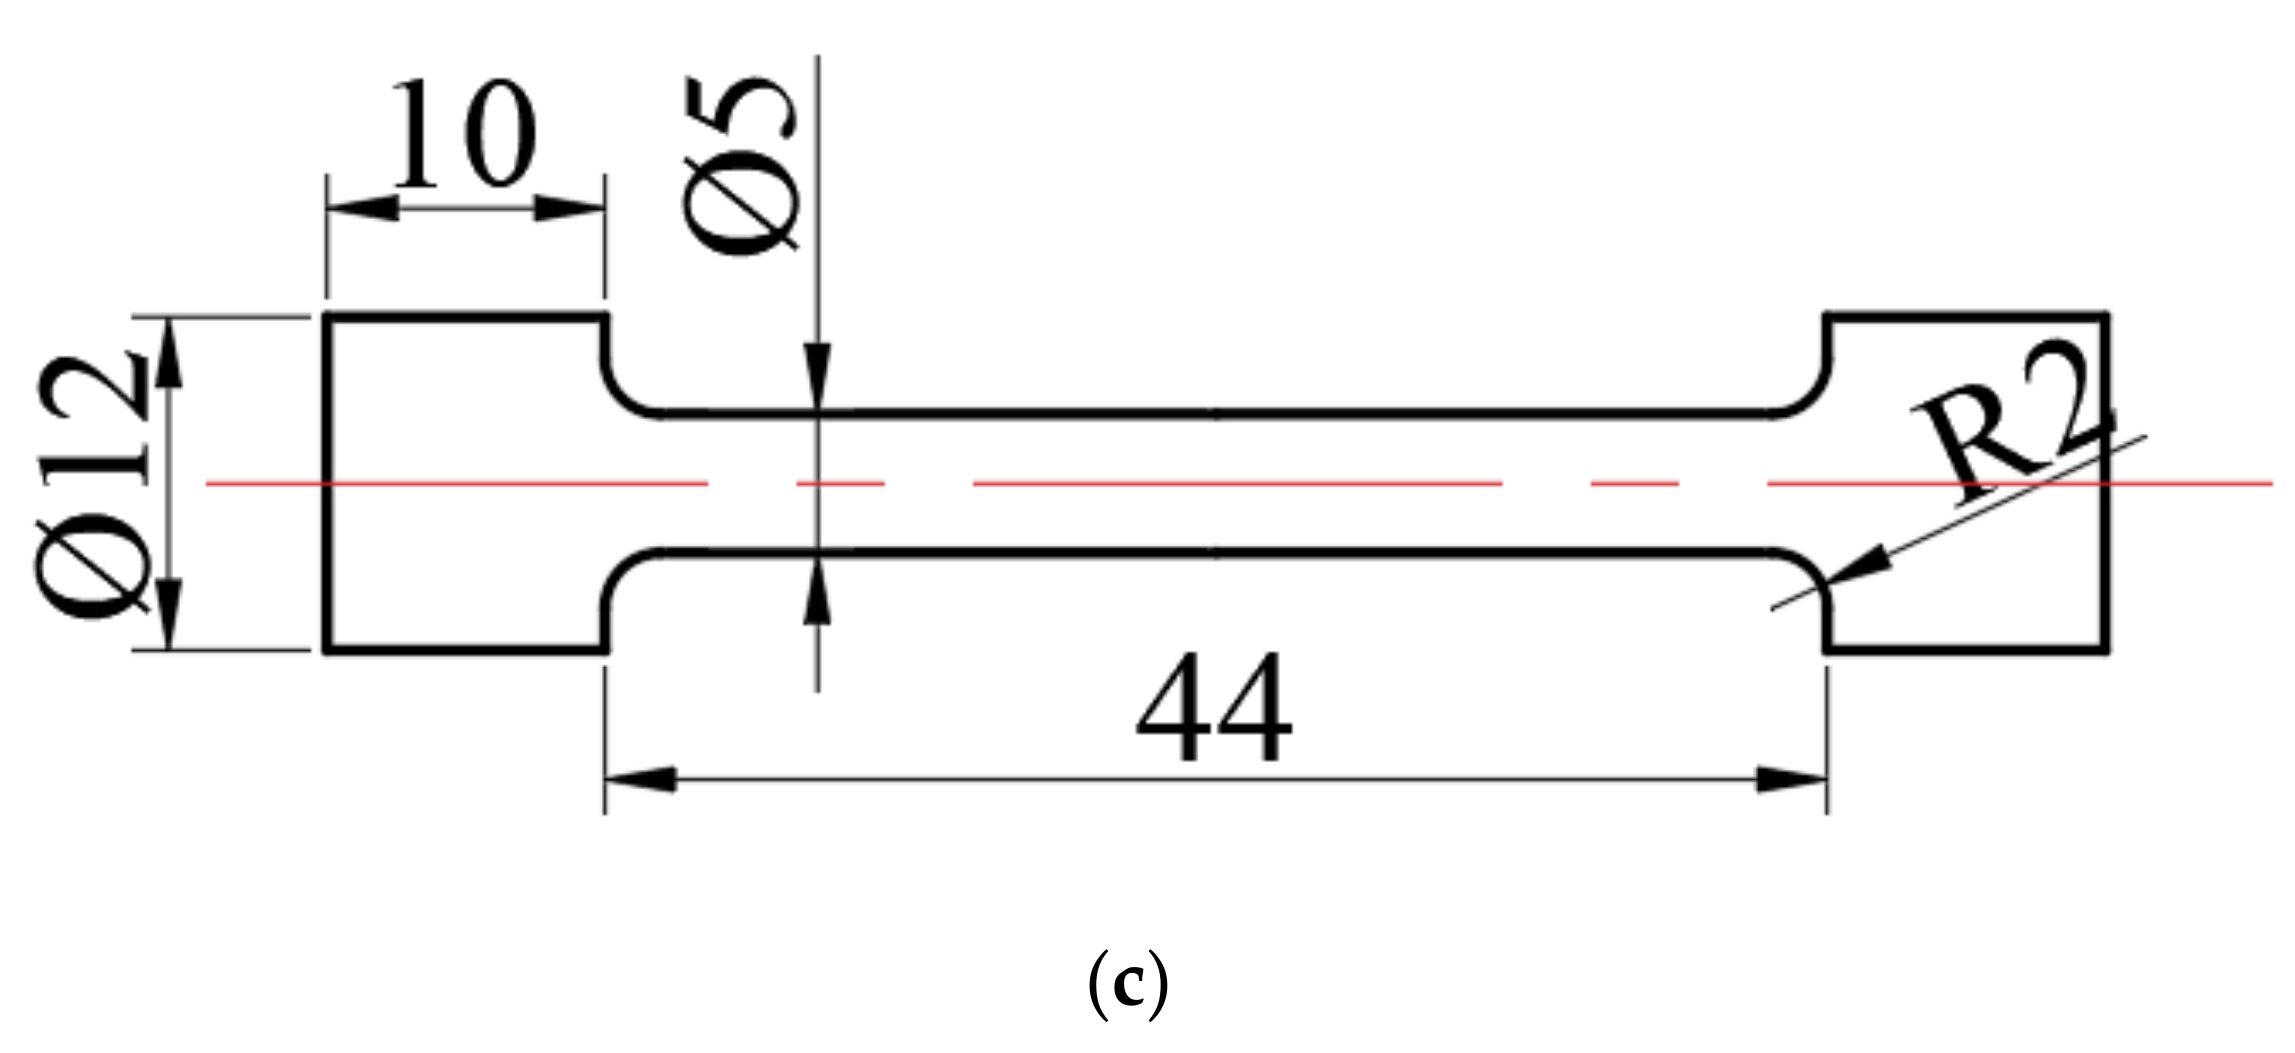
As shown in Figure 14, the loading and unloading tests of the specimen, which was fabricated by two of the alloys, were completed on the tensile testing machine. During the test of material mechanical properties, the specimen was clamped between the moving beam and the base of the wa-300b universal testing machine. The structure of the specimen is shown in Figure 14c. The servo direct-current motor controlled the running speed of the motor and drove the moving beam to move up and down after being decelerated by the precision reducer. The three-way sensor transmitted the signal values of pressure, deformation and displacement to the controller and realized feedback control through one of the signal values to complete the test of the mechanical properties, such as tensile and compressive strength, of the specimen.

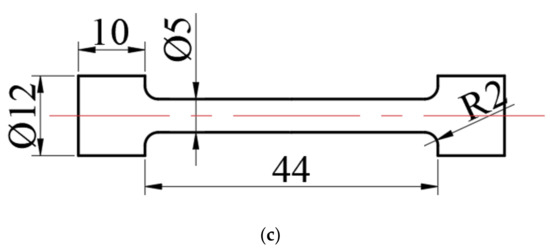
Figure 14.
Loading and unloading experiments: (a) experimental equipment; (b) installation of the specimens; (c) size of the specimen.
The force measurement consisted of a force measuring sensor and data processing system. In general, the force sensor is a strain type of force sensor. Since the strain of the elastic element is proportional to the external force, the strain gauge can be connected to the measurement circuit to measure its output voltage, and then the output force can be measured. When the distance between the two chucks changes, it drives the shaft of the photoelectric encoder to rotate, and the photoelectric encoder has a pulse signal output. The pulse signal is processed by a single-chip microcomputer, and the deformation of the sample can be obtained.
The load-displacement curve of the test specimen fabricated of Fe-Mn alloys during the stretching process was recorded, and the stretching speed was 0.5 mm/min until the sample was broken. To make the results more accurate, the extensometer was used to measure the small deformation during the deformation process of the specimen. The gauge length of the extensometer was set at 25 mm. When the extension meter was stretched to the limit of 1 mm of the extensometer range, the stretching was suspended, and the extensometer was unloaded. For subsequent experiments, the following steps should be followed: displacement reset, keeping the load, continuing to stretch, and recording the displacement. Finally, the acquisition system processed the load, displacement, and deformation curve recorded by the universal testing machine into a stress-strain curve.
The viscoelastic constant and relaxation time parameters of the viscoelastic portion were determined according to the damping alloy material’s properties. The parameters in the constitutive equation of the fitted load curve are shown in Table 3, and the parameters in the unloading curve constitutive equation are shown in Table 4. The parameter values of the nonlinear part of the damping alloy’s constitutive equations were, respectively, achieved (as shown in Figure 15).
Table 3.
Constitutive equation values of damping alloy loading curve.
Table 4.
Constitutive equation values of damping alloy unloading curve.
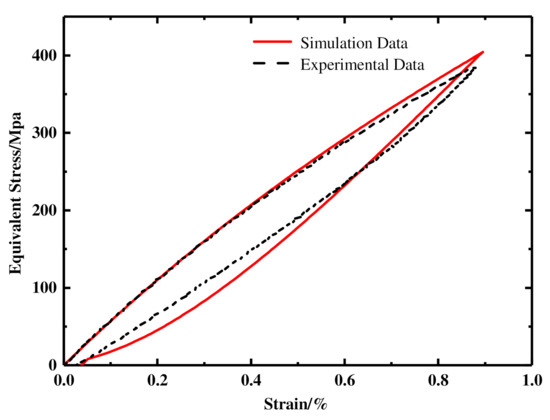
Figure 15.
Simulation and experimental results of uniaxial loading and unloading.
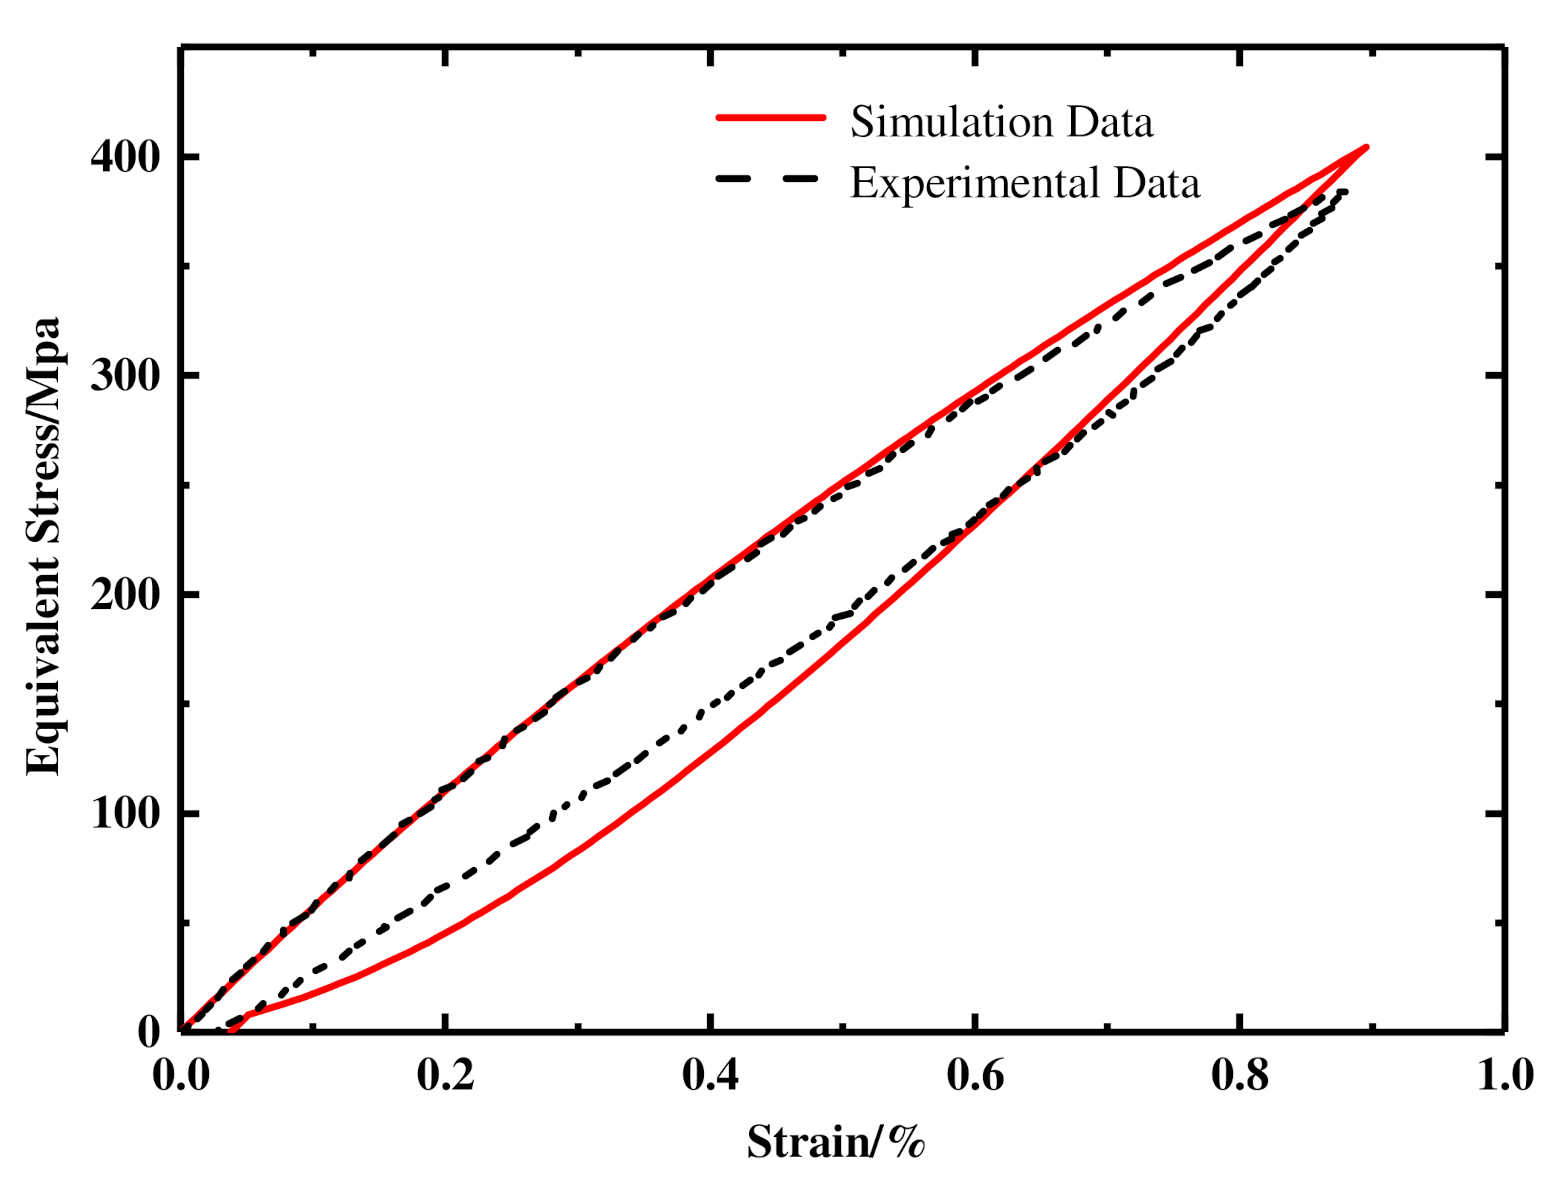
We constrained the six degrees of freedom of the nodes in the left end of the canine bone test piece and applied the displacement load at the nodes in the right end. To facilitate the comparison of the experimental results with the numerical simulation results, the maximum load was 0.3 mm, the direction was along the positive direction of the X-axis, and the time interval was 0.0001 s. The load time was 0.3 s. The LS-Dyna solver obtained by the compilation was used to simulate and calculate the loading and unloading of the canine bone test piece. After the calculation, the stress-strain curve corresponding to unit 521 was extracted, and then the stress of the Fe-Mn damping alloy test piece achieved through the experiment was obtained. The strain curve was compared, as shown in Figure 15. The stress-strain curve achieved by the experiment and the stress-strain curve obtained by numerical simulation had some errors, but the trend of the curves was the same. The stress-strain curve achieved by the simulation can be considered reasonable, and the prepared sub-procedure of the damping alloy material was correct.
6.2. Simulation Results of Different Damping Alloy Materials and 40Cr Materials
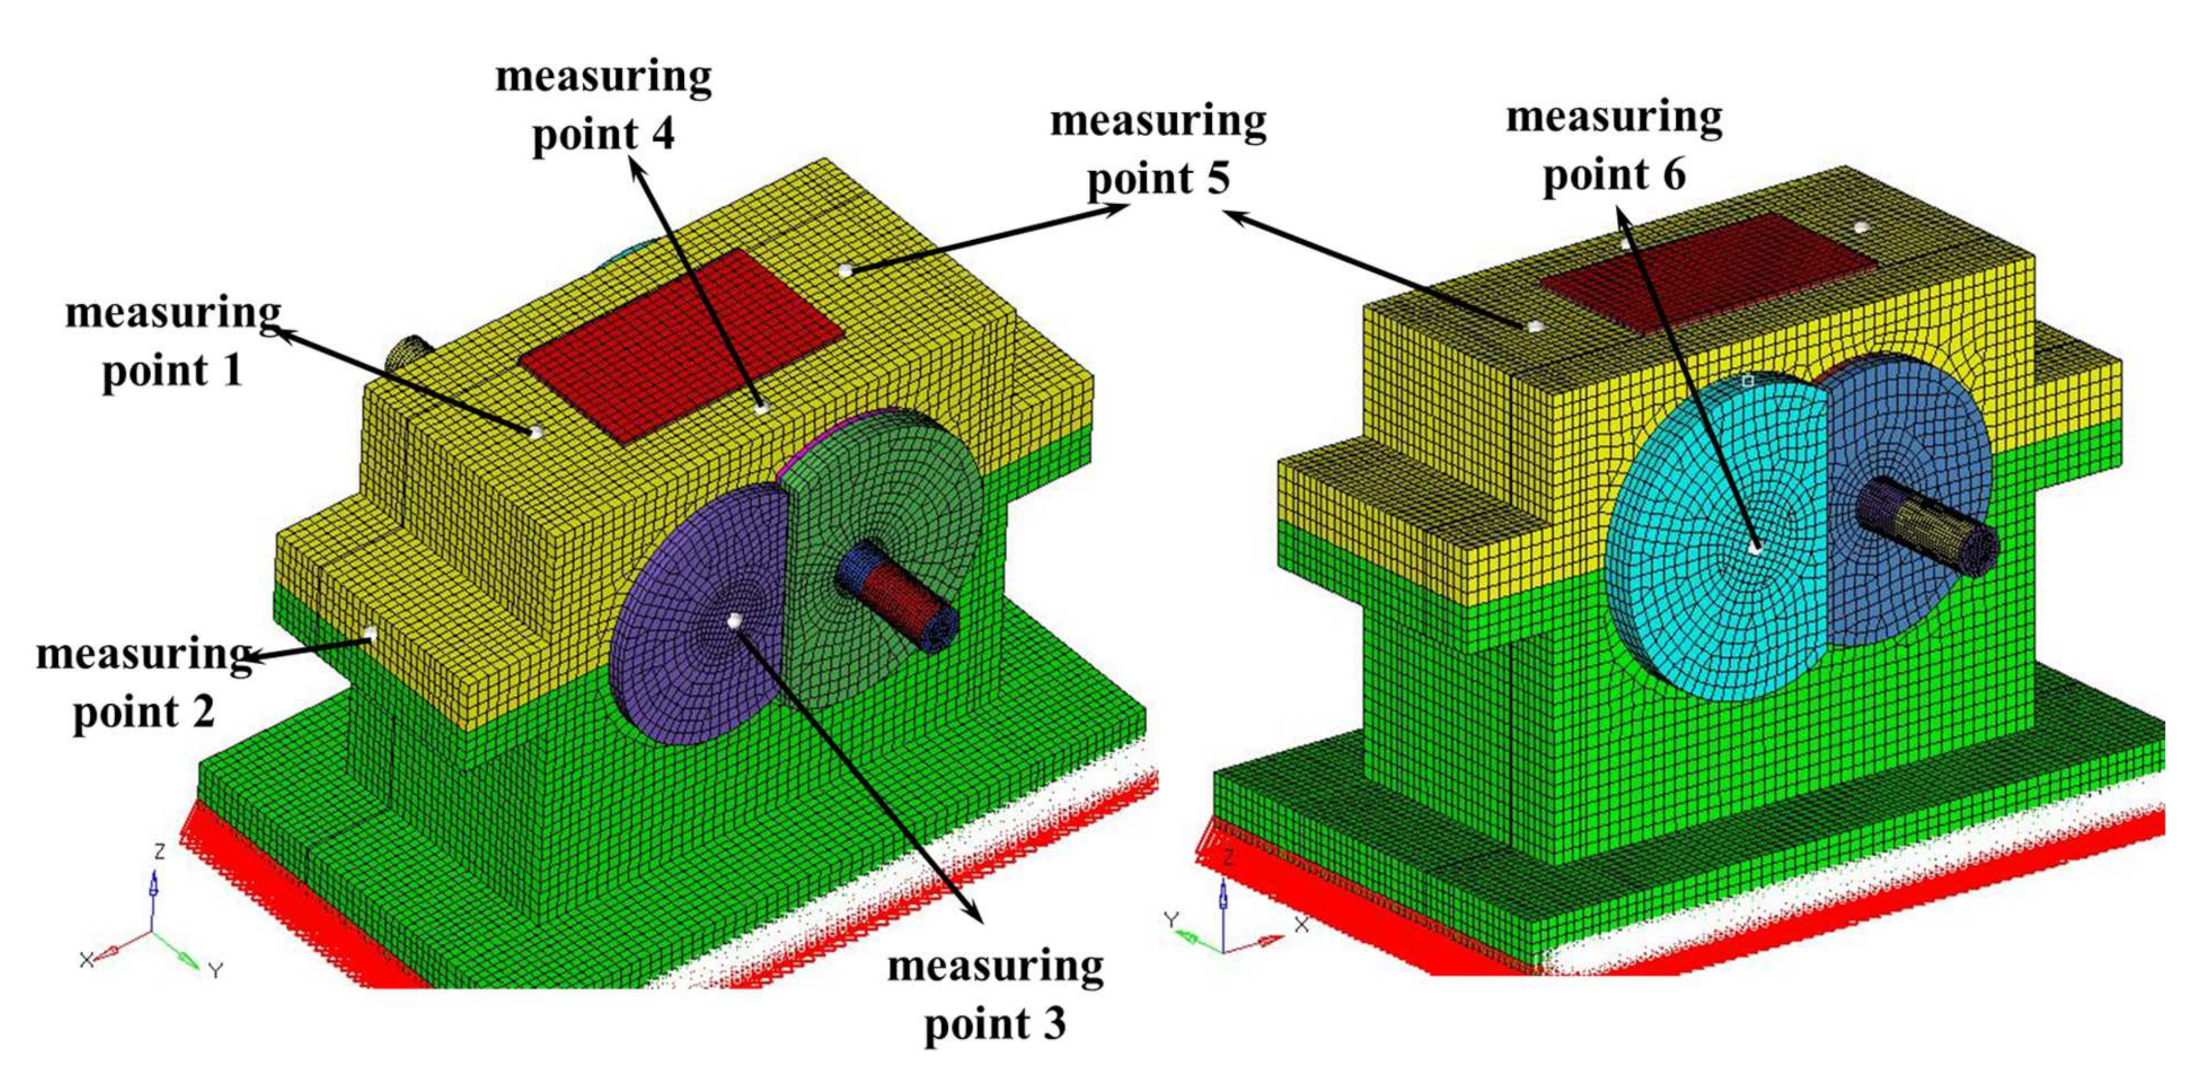
In the operating condition, the vibration of the gearbox is mainly transmitted to the box’s house through the gear shaft, bearing and bearing seat by the shock excitation of the gear meshing. As shown in Figure 16, the six nodes on the box’s surface were selected as the measuring points. The simulation results of different damping alloy materials and 40Cr materials were compared, as shown in Figure 17.

Figure 16.
The measuring points on the surface of the box.
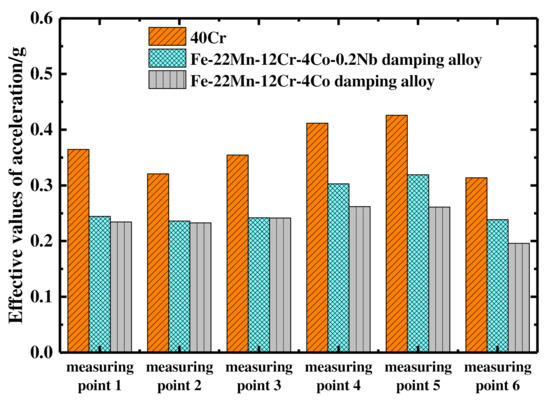
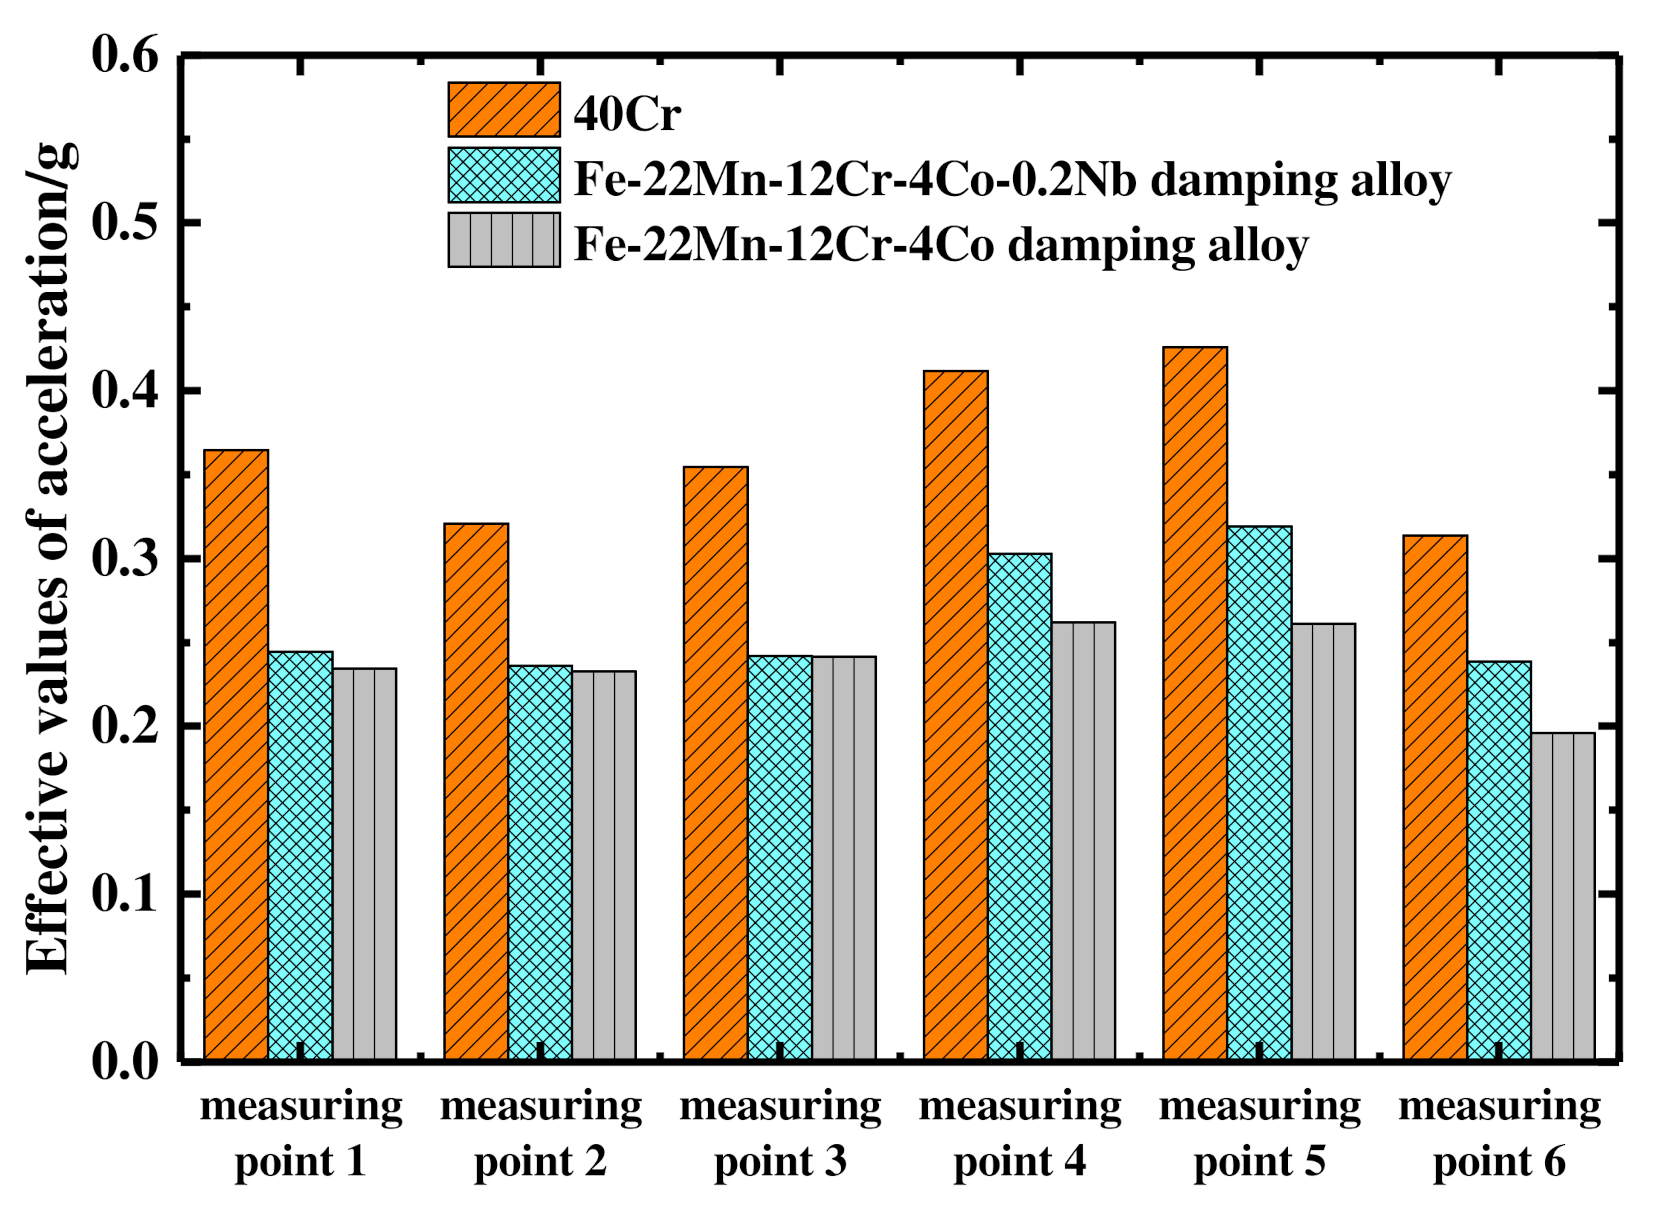
Figure 17.
Effective values of acceleration at measuring points.
The results showed that the effective values (the effective values which are defined as the absolute value of the square root of the mean squares) of vibration acceleration of the Fe-22Mn-12Cr-4Co-0.2Nb damping alloy and the Fe-22Mn-12Cr-4Co damping alloy were smaller than that of the 40Cr material, which indicated that the two damping alloy materials have an obvious damping effect compared with the 40Cr material. At measuring points 1~3, the difference in the effective acceleration between the two kinds of damping alloy materials was not significant. At measuring points 4~6, the effective value of the acceleration of the Fe-22Mn-12Cr-4Co damping alloy material was smaller, so the damping effect of the Fe-22Mn-12Cr-4Co damping alloy was better, with the maximum damping effect reaching 38.6%.
7. Gearbox Vibration Experiment
7.1. Experiment Objects
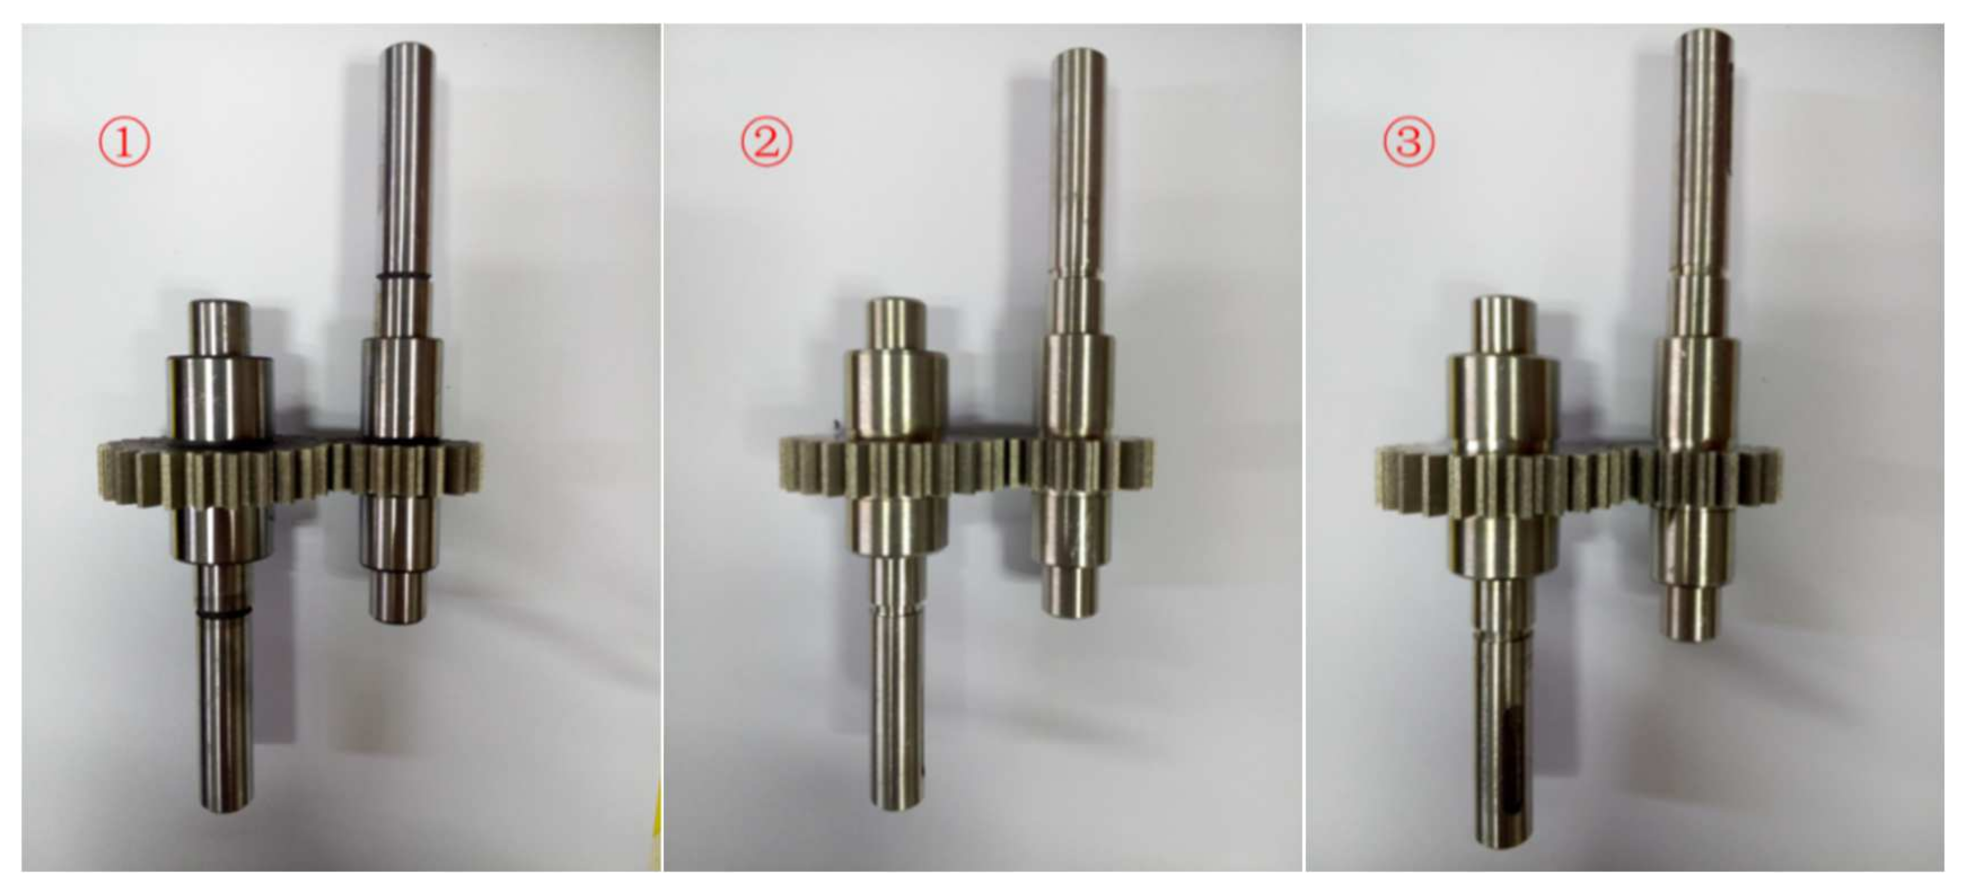
Experiments on the gearbox vibration of gears of different materials are shown in Figure 18. The no. 1 gear material was 40Cr, the no. 2 gear material was Fe-22Mn-12Cr-4Co-0.2Nb, and the no. 3 gear material was Fe-22Mn-12Cr-4Co. The gear was machined by wire cutting.
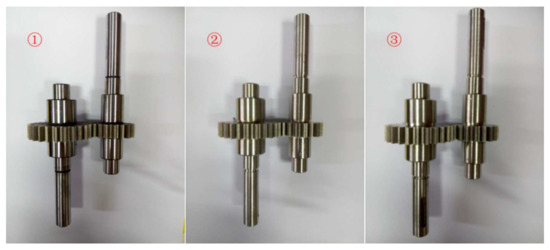
Figure 18.
Three pairs of gears made of different materials.
7.2. Vibration Test System for Reduction Gearbox
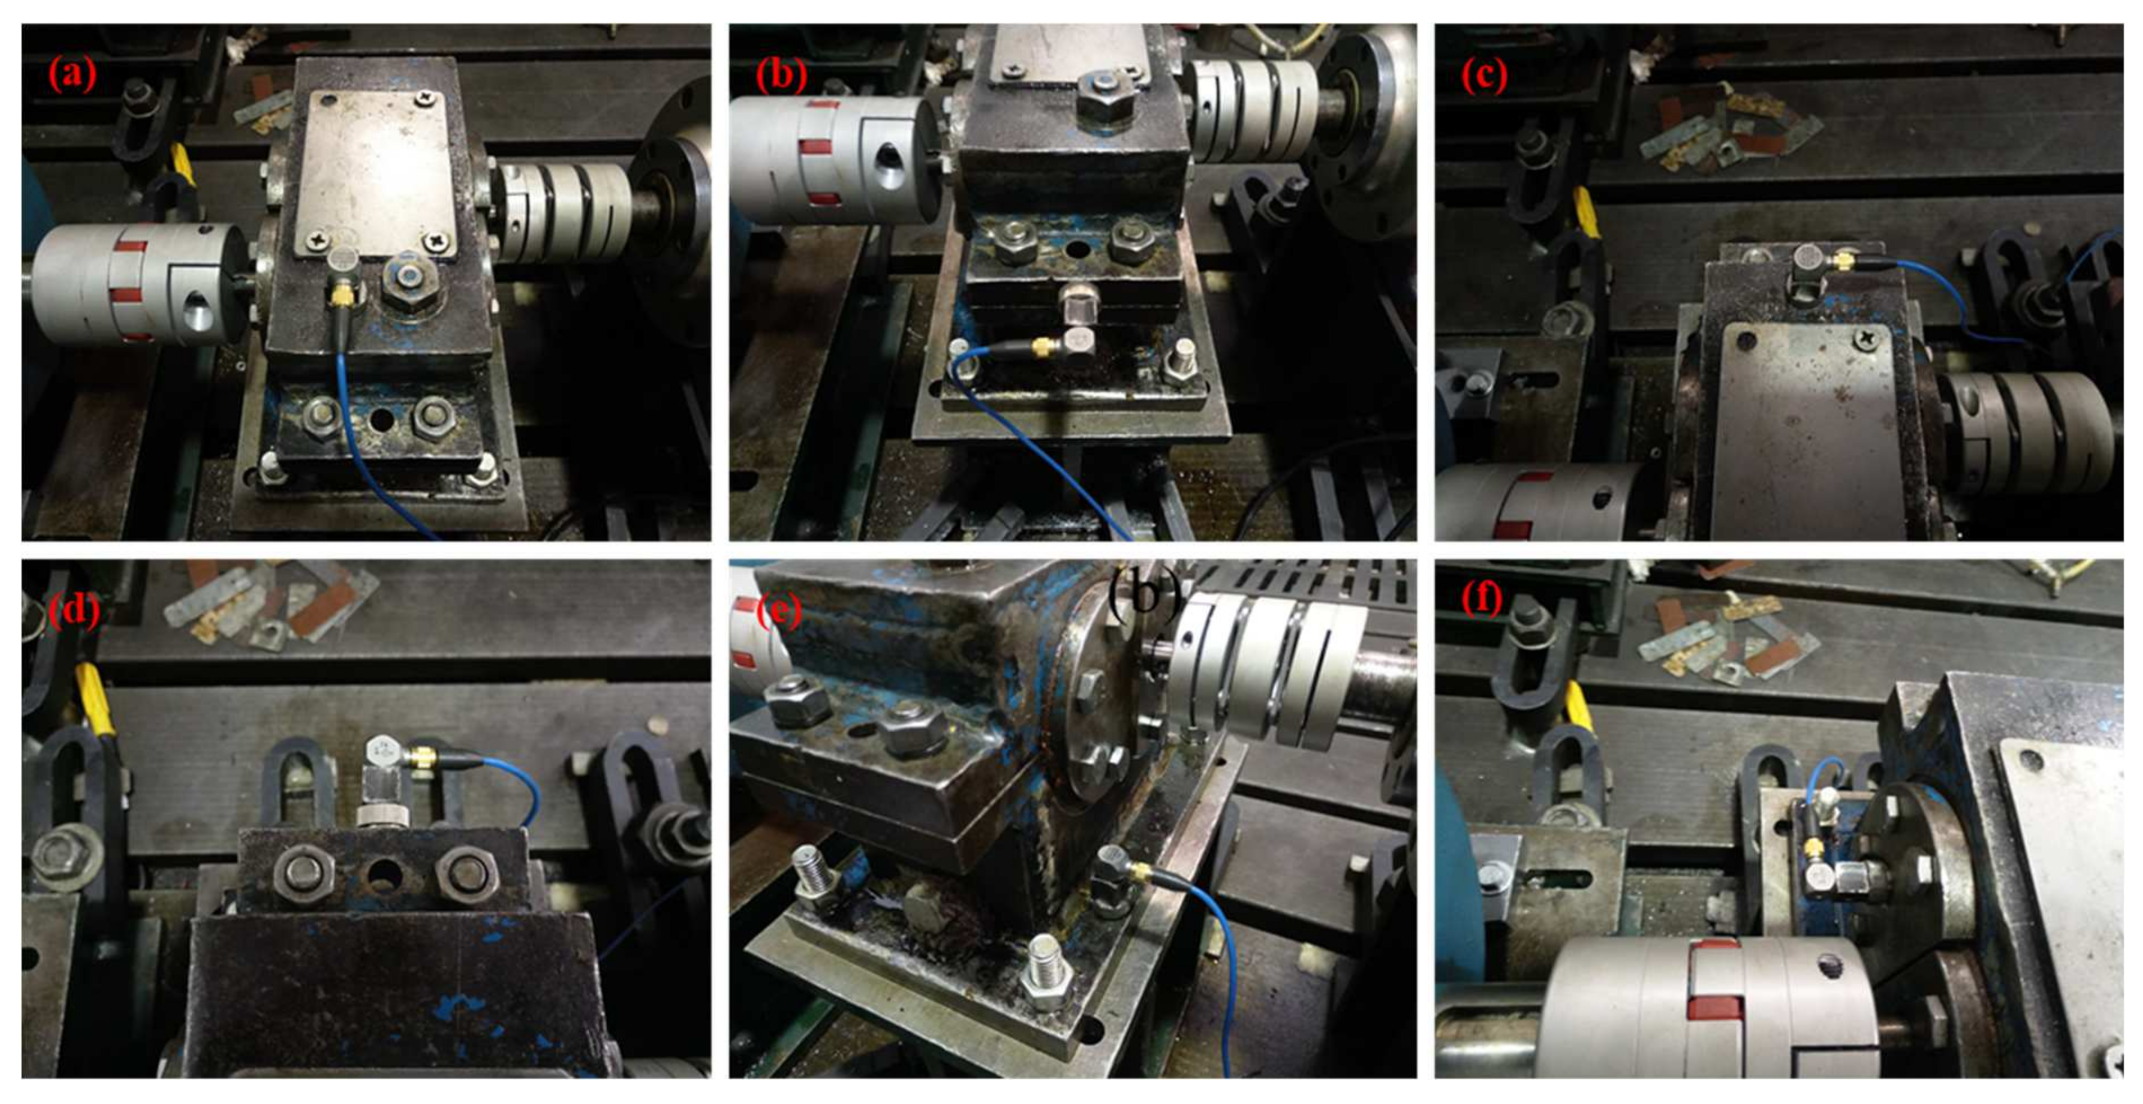
As shown in Figure 19, a three-phase induction motor was used as the reducer’s input, while a magnetic powder brake was used to provide torque loading for the reducer. The output speed of the servo motor was controlled by a rotating speed torque console, and the input current was controlled by a magnetic powder brake via a WLK-3A tension controller. In this way, testing different working conditions can be achieved. The output end of the gearbox was connected with the torque and speed sensor, which can read the real-time speed and torque on the JX-3 efficiency instrument. The model parameters of the motor and other equipment are shown in Table 5.
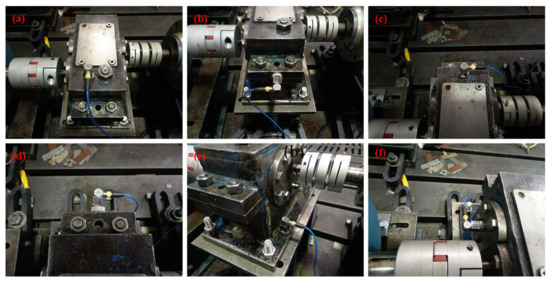
Figure 19.
The experimental measuring points: (a) measuring point 1, (b) measuring point 2, (c) measuring point 3, (d) measuring point 4, (e) measuring point 5, (f) measuring point 6.
Table 5.
The main parameters of the equipment.
In the process of the experiment, when the speed of the AC motor and the torque of the magnetic powder brake were controlled under a certain working condition, the vibration acceleration signals of the measuring points on the gearbox house were achieved using the ICP three-axis acceleration sensor and the DEWESoft data acquisition instrument. Measuring point 1 was fixed at the end cover of the gearbox near the input shaft to measure the vibration of the upper-end cover near the input shaft. Measuring point 2 was installed at the side joint of the box on the input shaft side to measure the vibration of the side joint of the box on the input shaft side. Measuring point 3 was fixed at the end cover of the gearbox near the output shaft to measure the vibration of the upper-end cover near the output shaft. Measuring point 4 was installed at the side joint of the box of the output shaft side to measure the vibration of the side joint of the box on the output shaft side. Measuring point 5 was fixed at the end cover of the input shaft to measure the vibration near the input bearing seat. Measuring point 6 was installed at the end cover of the output shaft to measure the vibration near the output bearing seat. The arrangement of test points is shown in Figure 19.
7.3. Vibration Test Results and Analysis of Gearbox
7.3.1. Comparison of Effective Values of Vibration Acceleration of Gears with Different Materials under 700 rpm and 10 N·m Working Conditions
The test conditions were as follows: the driving motor input speed was 700 rpm, and the load was 10 N·m. The sampling parameters of the DEWESoft data acquisition system were: the sampling time was 10 s, and the sampling frequency was 16,384 Hz. After the three-way vibration acceleration of each measuring point was obtained, the time domain and frequency spectrum of the vibration acceleration of different gear materials were listed.
As shown in Figure 20, the effective value of vibration acceleration for the Fe-22Mn-12Cr-4Co-0.2Nb damping alloy material at measuring points 1~5 is smaller than that of the 40Cr material when comparing the effective values of the vibration acceleration results of three gear materials at each measuring point under 700 rpm, 10 N·m conditions. The maximum value could be reduced by 32.5% at measuring point 5, but the effective value of vibration acceleration was larger than that of the Fe-22Mn-12Cr-4Co damping alloy material at each measuring point. The effective value of the vibration acceleration of the Fe-22Mn-12Cr-4Co damping alloy at each measuring point was smaller than the 40Cr material. The maximum value was reduced by 77.35% at measuring point 5. Therefore, under the working conditions of 700 rpm and 10 N·m, the Fe-22Mn-12Cr-4Co-0.2Nb damping alloy material and the Fe-22Mn-12Cr-4Co damping alloy material have a good damping effect, and the Fe-22Mn-12Cr-4Co damping alloy material has a better damping effect.
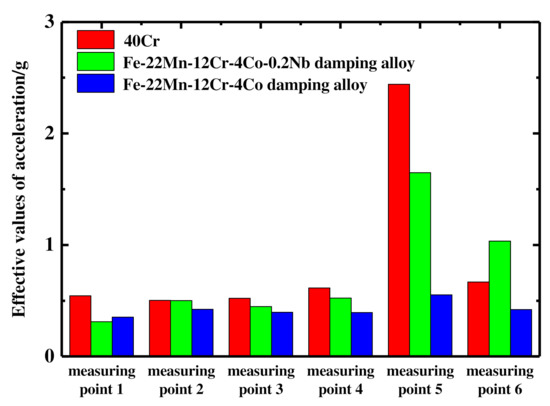
Figure 20.
Comparison of effective values of vibration acceleration of different gear materials under 700 rpm and 10 N·m working conditions.
7.3.2. Comparison of Effective Values of Vibration Acceleration of Gears with Different Materials under 900 rpm 10 N·m Working Conditions
Figure 21 was depicted that the effective value of vibration acceleration of Fe-22Mn-12Cr-4Co-0.2Nb damping alloy at each measuring point was smaller than that of 40Cr material. The maximum value was reduced by 16.1% from 1.103 g to 0.925 g at measuring point 3 compared to the effective values of the results of the combined acceleration of the three gear materials at each measuring point under the 900rpm10N m condition. The effective value of vibration acceleration of Fe-22Mn-12Cr-4Co damping alloy at each measuring point was smaller than that of 40Cr material. The maximum value was reduced by 33.8% from 1.103 g to 0.73 g at measuring point 3 of the upper part of the box at the end of the output gear. The effective value of vibration acceleration of Fe-22Mn-12Cr-4Co damping alloy was smaller than that of Fe-22Mn-12Cr-4Co-0.2Nb damping alloy at each measuring point. Fe-22Mn-12Cr-4Co-0.2Nb damping alloy material and Fe-22Mn-12Cr-4Co damping alloy material have a good damping effect, and Fe-22Mn-12Cr-4Co damping alloy material has a better damping effect.
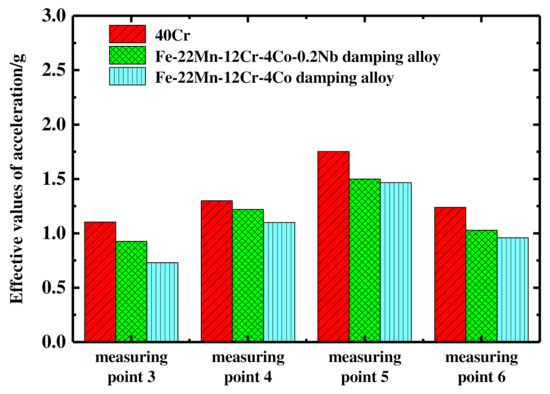
Figure 21.
Comparison of vibration acceleration effective values of different material gear under 900 rpm 10 N·m working conditions.
7.3.3. Comparison of Vibration Acceleration Results of Different Gear Materials under Different Working Conditions
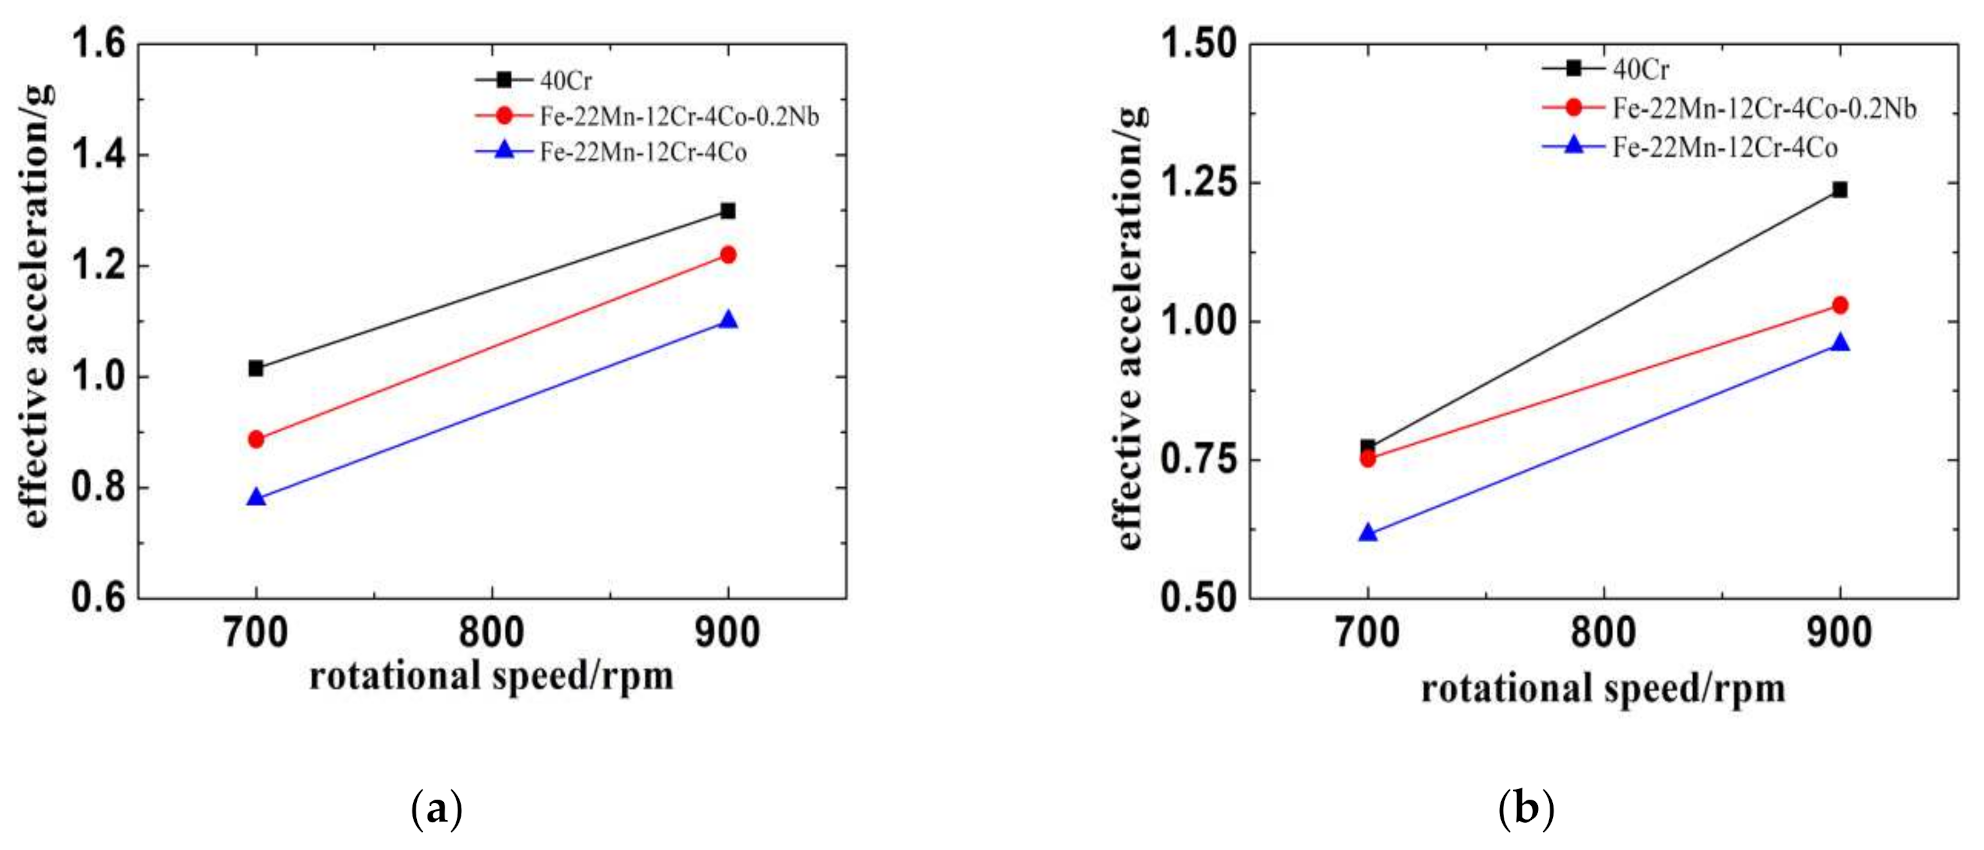
As shown in Figure 22, we compared the effective acceleration values of point 1 at 700 rpm and measuring point 3 at 900 rpm under different loading conditions. The results showed that the two kinds of damping alloy materials had an obvious damping effect. At measuring point 1 at the speed of 700 rpm, the effective acceleration values of the two kinds of damping alloy materials were reduced by 18.8% and 213%, respectively, when the load was 10 N·m. The effective acceleration values of the two kinds of damping alloy materials were reduced by 16.1% and 33.8%, respectively, when loading 10 N·m at measuring point 3 at the speed of 900 rpm.
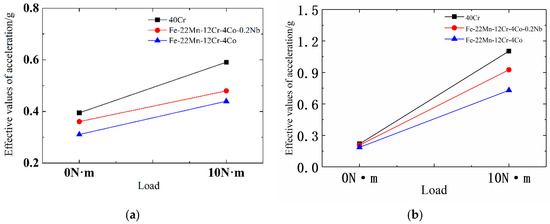
Figure 22.
Comparison of the results of different loading: (a) results of measuring point 1 at the speed of 700 rpm; (b) results of measuring point 3 at the speed of 900 rpm.
In order to compare the damping effect of the gearbox with alloy materials at different rotational speeds, we compared the effective acceleration values of measuring points 4 and 6 at different speeds. The results are shown in Figure 23. At measuring point 4, the effective acceleration values of the two kinds of damping alloy materials decreased by 11.0% and 21.8%, respectively, at the speed of 700 rpm, and the effective acceleration values of the damping alloy materials decreased by 6.1% and 15.3%, respectively, at the speed of 900 rpm. At measuring point 6, the effective acceleration values of damping alloy materials at a 700 rpm rotation speed were reduced by 5.32% and 20.2%, respectively. The effective acceleration values of damping alloy materials were reduced by 16.8% and 22.5%, respectively, at 900 rpm.
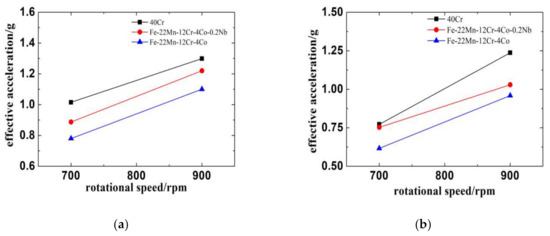
Figure 23.
Comparison of test results at different speeds when loading was 10 N·m: (a) measuring point 4; (b) measuring point 6.
7.3.4. Comparison between Test Results and Simulation Results of Acceleration Effective Values of Different Gear Materials
To compare the experimental and simulation results of the gearbox, we selected the nodes corresponding to the measuring points on the dynamic simulation model of the damping alloy gear reducer. The corresponding vibration acceleration was extracted, and the effective value of the acceleration was calculated. The results were converted to the same unit as the test acceleration results, and the comparison results of the 1(Z) direction and 3(Z) direction were shown in Figure 24. It was shown that the error between the test results of the 40Cr material gearbox and the simulation results was relatively small, and the acceleration test results of damping alloy materials and 40Cr materials were the same as the simulation results. The main reason was that the simulation analysis was carried out under the perfect ideal condition. The stirring of the lubricating oil, the dynamic change of the input motor and the brake all had a certain influence on the test results.
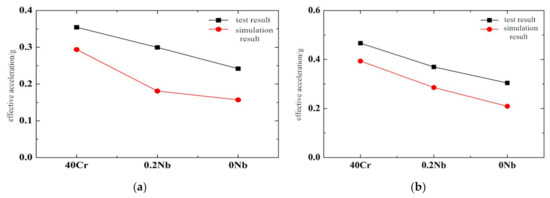
Figure 24.
Comparison of experimental results and simulation results: (a) comparison of the results for measuring point 1 (Z); (b) comparison of the results for measuring point 3(Z).
7.4. Comparison of Temperature Changes in Different Parts of the Gearbox during Gear Operation with Different Materials
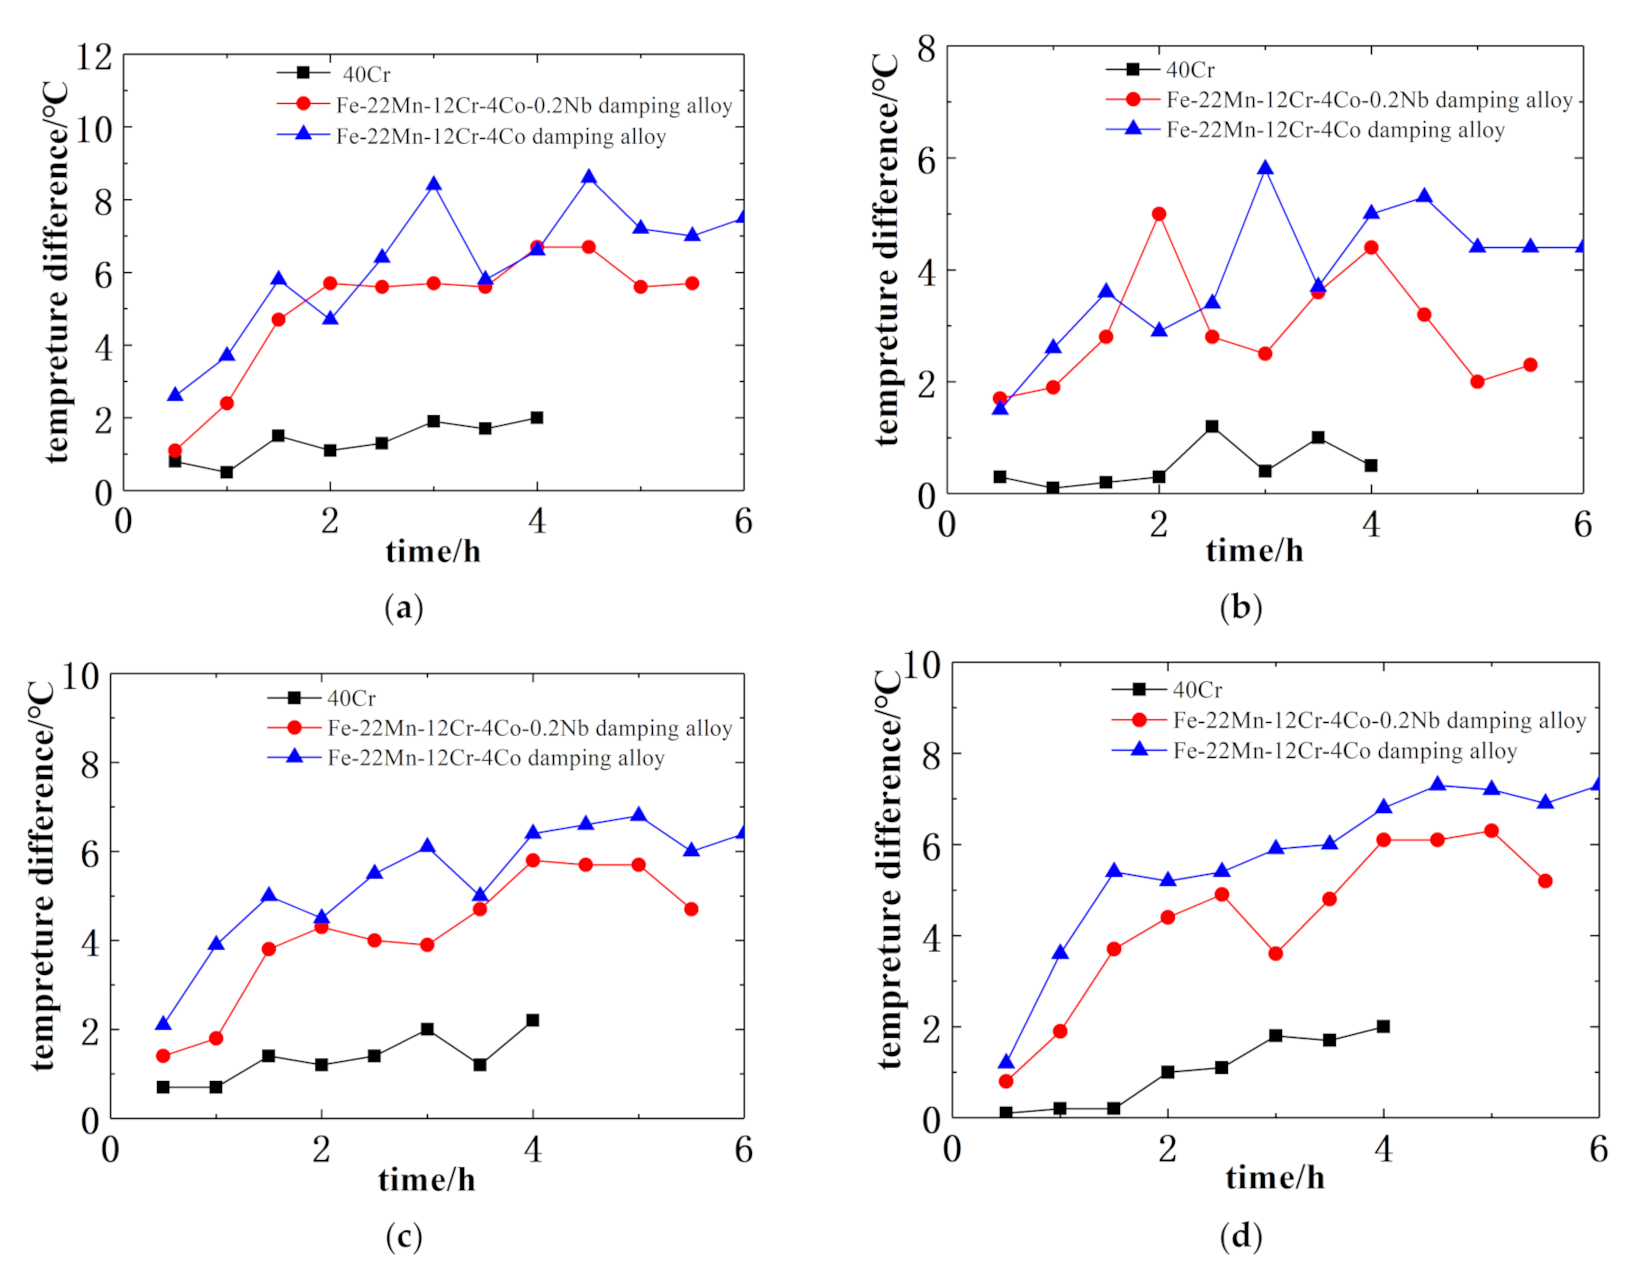
The damping mechanism of the alloy materials converts mechanical energy into heat energy. It dissipates to the surrounding environment by using its high-damping characteristics to achieve the purpose of vibration reduction. Because of the damping alloy’s damping characteristics and gear meshing, the tooth surface friction and heat energy dissipation occurred, and the gearbox temperature rose. Comparing the change in temperature of the gearbox surface and the gear shaft for different damping alloy materials and 40Cr materials under certain working conditions was helpful to verify the damping characteristics of gears made of the damping alloy materials. Because of the different testing times of gear with different materials and the influence of weather, time and the surrounding testing environment, there was a large fluctuation at room temperature, which affected the temperature changes in different parts of the gearbox. Thus, comparing the temperature difference between the different parts of the gearbox and the room temperature, the temperature difference for the gear with different materials varies with the running time, as shown in Figure 25.
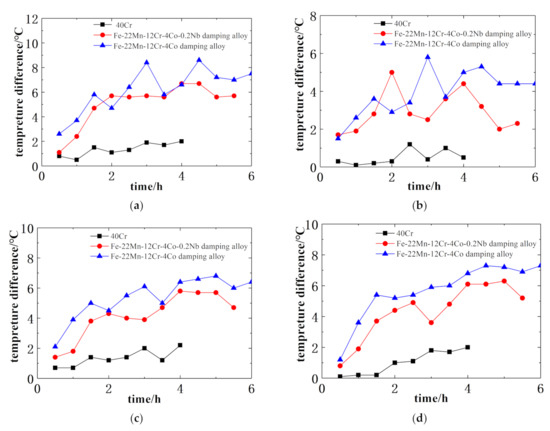
Figure 25.
The temperature difference between the different parts of the gearbox and the room temperature: (a) difference between input shaft temperature and room temperature; (b) difference between end cover temperature and room temperature; (c) comparison of difference between output shaft temperature and room temperature; (d) comparison of difference between housing temperature and room temperature.
The test results showed that the temperature difference in different parts of the gearbox increased with increasing running time. The temperature difference of the end cap fluctuated greatly, which was due to the thinner end cover and the greater influence of room temperature on the end cover, as well as the influence of the oil spattered inside the gearbox. The difference in temperature between the Fe-22Mn-12Cr-4Co-0.2Nb damping alloy material and the Fe-22Mn-12Cr-4Co damping alloy material was larger than that of the 40Cr material in different parts of the gearbox, which indicated that the damping alloy material had an obvious damping effect compared with the 40Cr material. The Fe-22Mn-12Cr-4Co damping alloy material had the largest temperature difference, which indicated that the gear of the Fe-22Mn-12Cr-4Co damping alloy material had more heat energy and the best damping effect. The results were consistent with the results of vibration acceleration on the surface of the box under different gear materials.
8. Conclusions
The mapping relationship between the composition of Fe-Mn alloys and its constitutive models was built to truly obtain the damping effect of mechanical products fabricated by Fe-Mn alloys. The following conclusions were drawn:
- (1)
- A nonlinear constitutive model of Fe-Mn damping alloy materials based on viscoelastic theory was constructed and extended to a three-dimensional state using tensor theory, and the time increment step form of the constitutive model was derived;
- (2)
- Using the three-dimensional stress-strain expression of the nonlinear constitutive model of the damping alloy material and the stress recurrence relationship under the time increment step, the user subroutine UMAT of the nonlinear constitutive model of the Fe-Mn damping alloy materials was compiled, and the tensile test simulation of an Fe-Mn damping alloy rod was carried out. The experimental data of the Fe-Mn damping alloy tensile specimen are consistent with the simulation result. It was proved that the proposed constitutive model can accurately describe the mechanical behavior of the Fe-Mn damping alloy.
- (3)
- A transient dynamic analysis of the gearbox, in which spur gear pairs were fabricated by Fe-Mn damping alloys, was achieved using an LS-Dyna damping alloy material user subroutine. It can effectively and quantitatively evaluate the vibration damping performance of Fe-Mn alloys;
- (4)
- By comparing the time domain effective values of vibration acceleration between two kinds of damping alloy materials and 40Cr materials under different working conditions, it can be concluded that two kinds of damping alloy materials have an obvious damping effect. The damping effect of Fe-22Mn-12Cr-4Co alloy materials is better.
Author Contributions
Conceptualization, P.X. and W.Y.; methodology, P.X. and W.Y.; software, P.X.; validation, P.X., W.Y. and K.J.; formal analysis, P.X., W.Y.; investigation, P.X., W.Y., K.J., J.Y. and W.S.; resources, W.Y. and W.S.; data curation, P.X., W.Y., K.J., J.Y. and W.S.; writing—original draft preparation, P.X. and W.Y.; writing—review and editing, P.X., W.Y., K.J., J.Y. and W.S.; visualization, P.X., W.Y., K.J. and J.Y.; supervision, W.Y. and W.S.; project administration, W.Y. and W.S.; funding acquisition, W.Y. All authors have read and agreed to the published version of the manuscript.
Funding
This project is supported by the National Natural Science Foundation of China (Grant No. 50975295), the national science and technology support program (Grant No. 2013BAF01B05) and the Chongqing Basic Research and Frontier Exploration Project (Grant No. cstc2018jcyjAX0468).
Institutional Review Board Statement
Not applicable.
Informed Consent Statement
Not applicable.
Data Availability Statement
The study did not report any data.
Acknowledgments
Thanks to Yuhua Wen for his support and guidance on the damping alloy materials in this paper.
Conflicts of Interest
The authors declare no conflict of interest.
References
- Chen, M.H.; Brennan, M.J. Active control of gear vibration using specially configured sensors and actuators. Smart Mater. Struct. 2000, 9, 342–350. [Google Scholar] [CrossRef]
- Guan, Y.H.; Lim, T.C.; Shepard, W.S. Experimental study on active vibration control of a gearbox system. J. Sound Vib. 2005, 282, 713–733. [Google Scholar] [CrossRef]
- Okamura, H.; Suzuki, Y.; Nakano, N. Experiments and analysis of sound-damping rings for gears: Application of snap rings. In Proceedings of the Power Transmission and Gearing Conference, San Diego, CA, USA, 6–9 October 1996; pp. 345–349. [Google Scholar]
- Hume-Rothery, W. Elasticity and Anelasticity of Metals. Nature 1949, 164, 84–85. [Google Scholar] [CrossRef]
- Worrell, F.T. Twinning in tetragonal alloys of copper and manganese. J. Appl. Phys. 1948, 19, 929–933. [Google Scholar] [CrossRef]
- Bacon, G.E.; Dunmur, I.W.; Smith, J.H.; Street, R. The Antiferromagnetism of Manganese Copper Alloys. Proc. R. Soc. Lond. Ser. A Math. Phys. Sci. 1957, 241, 223–238. [Google Scholar]
- Lee, Y.K.; Jun, J.H.; Choi, C.S. Damping capacity in Fe-Mn binary alloys. ISIJ Int. 1997, 37, 1023–1030. [Google Scholar] [CrossRef] [Green Version]
- Baik, S.H. High damping Fe-Mn martensitic alloys for engineering applications. Nucl. Eng. Des. 2000, 198, 241–252. [Google Scholar] [CrossRef]
- Baik, S.H.; Kim, J.C.; Han, D.W.; Kim, T.H.; Back, J.H.; Lee, Y.K. Fe-Mn martensitic alloys for control of noise and vibration in engineering applications. Mater. Sci. Eng. A Struct. Mater. Prop. Microstruct. Proc. 2006, 438, 1101–1105. [Google Scholar] [CrossRef]
- Shariyat, M.; Mozaffari, A.; Pachenari, M.H. Damping sources interactions in impact of viscoelastic composite plates with damping treated SMA wires, using a hyperbolic plate theory. Appl. Math. Model. 2017, 43, 421–440. [Google Scholar] [CrossRef]
- Igata, N. Applications of High Damping Stainless Alloy (HIDAS). Key Eng. Mater. 2006, 319, 209–216. [Google Scholar] [CrossRef]
- Ha, K.; Schapery, R.A. A three-dimensional viscoelastic constitutive model for particulate composites with growing damage and its experimental validation. Int. J. Solids Struct. 1998, 35, 3497–3517. [Google Scholar] [CrossRef]
- Muliana, A.; Rajagopal, K.R.; Tscharnuter, D.; Pinter, G. A nonlinear viscoelastic constitutive model for polymeric solids based on multiple natural configuration theory. Int. J. Solids Struct. 2016, 100, 95–110. [Google Scholar] [CrossRef]
- Zhu, Y.; Lu, F.; Yu, C.; Kang, G. A Rate-Type Nonlinear Viscoelastic-Viscoplastic Cyclic Constitutive Model for Polymers: Theory and Application. Polym. Eng. Sci. 2016, 56, 1375–1381. [Google Scholar] [CrossRef]
- De Lima, A.M.G.; Guaraldo-Neto, B.; Sales, T.P.; Rade, D.A. A time-domain modeling of systems containing viscoelastic materials and shape memory alloys as applied to the problem of vibration attenuation. Eng. Struct. 2014, 68, 85–95. [Google Scholar] [CrossRef]
- Peultier, B.; Ben Zineb, T.; Patoor, E. A simplified micromechanical constitutive law adapted to the design of shape memory applications by finite element methods. Mater. Sci. Eng. A Struct. Mater. Prop. Microstruct. Proc. 2008, 481, 384–388. [Google Scholar] [CrossRef]
- Svobodnik, A.J.; Bohm, H.J.; Rammerstorfer, F.G. Elastic-Plastic Behavior of Metal Matrix Composites with a Special Emphasis on Finite Element Analysis. In Advances in Plasticity 1989; Khan, A.S., Tokuda, M., Eds.; Pergamon: Oxford, UK, 1989; pp. 137–140. [Google Scholar]
- Haghdoust, P.; Lo Conte, A.; Cinquemani, S.; Lecis, N. A Numerical Method to Model Non-linear Damping Behaviour of Martensitic Shape Memory Alloys. Materials 2018, 11, 2178. [Google Scholar] [CrossRef] [Green Version]
- Zhou, A.G.; Basu, S.; Friedman, G.; Finkel, P.; Yeheskel, O.; Barsoum, M.W. Hysteresis in kinking nonlinear elastic solids and the Preisach-Mayergoyz model. Phys. Rev. B 2010, 82, 094105. [Google Scholar] [CrossRef]
- Mahi, A.E.; Assarar, M.; Sefrani, Y.; Berthelot, J.M. Damping analysis of orthotropic composite materials and laminates. Compos. Part. B Eng. 2008, 39, 1069–1076. [Google Scholar] [CrossRef]
- Yun, K.S.; Park, J.B.; Jung, G.D.; Youn, S.K. Viscoelastic constitutive modeling of solid propellant with damage. Int. J. Solids Struct. 2016, 80, 118–127. [Google Scholar] [CrossRef]
- Peultier, B.; Zineb, T.B.; Patoor, E. Macroscopic constitutive law for SMA: Application to structure analysis by FEM. Mater. Sci. Eng. A 2018, 438, 454–458. [Google Scholar] [CrossRef]
- Haghdoust, P.; Conte, A.L.; Cinquemani, S.; Lecis, N. Experimental and Numerical Characterization of High Damping Martensitic CuAlMn Sheets. Materials. 2020, 13, 529. [Google Scholar] [CrossRef] [Green Version]
- Muravskii, G. On description of hysteretic behaviour of materials. Int. J. Solids Struct. 2005, 42, 2625–2644. [Google Scholar] [CrossRef]
- Toolabi, M.; Fallah, A.S.; Baiz, P.M.; Louca, L.A. Dynamic analysis of a viscoelastic orthotropic cracked body using the extended finite element method. Eng. Fract. Mech. 2013, 109, 17–32. [Google Scholar] [CrossRef]
- Sun, T.S.; Yu, C.G.; Wang, Q.; Zhong, J.L. Creep Prediction of GFRP Directors in Multiple Launch Rocket System under Long-term Stacking Storage. Trans. Can. Soc. Mech. Eng. 2020, 45, 147–158. [Google Scholar] [CrossRef]
- Abu Al-Rub, R.K.; Tehrani, A.H.; Darabi, M.K. Application of a large deformation nonlinear-viscoelastic viscoplastic viscodamage constitutive model to polymers and their composites. Int. J. Damage Mech. 2014, 24, 198–244. [Google Scholar] [CrossRef]
- Zhang, J.; Wang, Y.; Luo, Q.; Peng, H.; Wen, Y. Designing damping capacity in high strength Fe–Mn based alloys by controlling crystal defect configurations. J. Philos. Mag. 2021, 101, 1765–1781. [Google Scholar] [CrossRef]
- Wen, Y.; Xiao, H.; Peng, H.; Li, N.; Raabe, D. Relationship Between Damping Capacity and Variations of Vacancies Concentration and Segregation of Carbon Atom in an Fe-Mn Alloy. Metall. Mater. Trans. A 2015, 46, 4828–4833. [Google Scholar] [CrossRef]


Publisher’s Note: MDPI stays neutral with regard to jurisdictional claims in published maps and institutional affiliations. |
© 2022 by the authors. Licensee MDPI, Basel, Switzerland. This article is an open access article distributed under the terms and conditions of the Creative Commons Attribution (CC BY) license (https://creativecommons.org/licenses/by/4.0/).