Article

An Intelligent Handover Mechanism Based on MOS Predictions for Real-Time Video Conference Services in Mobile Networks

Department of Computer Science, National Taichung University of Education, No. 140, Minsheng Rd., West Dist., Taichung City 403454, Taiwan
*
Author to whom correspondence should be addressed.
Appl. Sci. 2022, 12(8), 4049; https://doi.org/10.3390/app12084049
Submission received: 26 February 2022 / Revised: 10 April 2022 / Accepted: 11 April 2022 / Published: 16 April 2022
(This article belongs to the Special Issue Innovations in Intelligent Machinery and Industry 4.0)

Abstract

:
In mobile networks, handover mechanisms provide fast and smooth access service for mobile users. However, one of the main challenges in mobile networks is the handover management with increased mobility and bandwidth demand of the required network services. Therefore, in this paper, we propose a MOS-aware (mean opinion score-aware) mobile network handover mechanism based on deep learning to determine the appropriate handover time for real-time video conference services in mobile networks. We construct a wireless network topology with LTE characteristics in a Mininet-WiFi simulation. User equipment (UE) can determine the service-required MOS (Mean Opinion Score) from the proposed deep-learning-based handover mechanism with appropriate handover time. Simulation results show that the proposed scheme provides higher performance than the original A3 handover mechanism. The contribution of this paper is to combine the real-time video conferencing services with a deep-learning-based handover mechanism by predicting MOS values to improve the quality of service for users in mobile networks.

1. Introduction

Long-term evolution (LTE) and 5G, which were recently launched and which officially triggered the new era of fifth generation telecommunication, [1] are high-speed wireless communication standards for mobile devices in the field of telecommunications that provide high-speed mobile networks for people’s lives. LTE and 5G provide mobile users with the stability of data transmission through handover technology, allowing users to have enough bandwidth to meet the needs of quality of service (QoS) for various network applications. In order to meet the increasing demand for data traffic, the deployment of small base stations will play an important role in future network deployment. Network operators must not only meet the needs of mobile users for traditional signal coverage but must also meet the needs of users to provide a quality of experience (QoE) for different network services. When users are moving around the deployment environment of multiple base stations, the user equipment (UE) in general only decides the time to handover based on the signal strength. The most important issue in the handover mechanism is to find the appropriate moment to trigger the handover process. The original event A3 handover mechanism is usually used as a measurement for the required signal strength of handover in LTE, which detects the offset when the signal strength of the neighboring eNB is continuously greater than the signal strength from the serving eNB during the signaling period. However, the handover mechanism should be predicted and carried out before a user encounters QoE degradation. The QoE of network services will be degraded due to the low signal quality. Therefore, it is the motivation of this research to predict the optimal handover time for each UE based on the signal strength provided by neighboring base stations (BSs), and to maintain the required QoE during its continuous movement.
In addition, real-time video streaming service is a crucial application, such as automated guided vehicles (AGVs) and unmanned aerial vehicles (UAVs) in the smart machinery. For instance, real-time video streaming services in UAVs are now widely used for aerial photography, surveillance, image recognition, object detection, and remote sensing. However, existing LTE handover solutions are unable to meet the quality requirements in terms of quality of service for real-time video streaming while the UAV is moving in flight.
This research proposes a deep learning model on a mean opinion score (MOS) evaluation approach for a real-time video conference service for optimal handover time prediction to improve the user’s QoE. We will construct an experimental and simulation platform for LTE/5G networks to analyze the signal strength (reference symbol received power, RSRP) of neighboring base stations reported by UE. Besides the fact that the experimental results show the proposed deep-learning-based MOS-aware handover mechanism, we will analyze the QoE performance and compare the experimental results with the general LTE Event A3 handover mechanism.
The rest of this paper is organized as follows. Section 2 introduces related research studies. In Section 3, MOS modeling for video conferences over mobile networks is presented. Section 4 presents the handover dataset collection and deep-learning model performance analysis. Section 5 describes the proposed deep-learning-based handover mechanism. Section 6 provides experimental results and performance analysis. Finally, we draw the conclusion and suggest future works in Section 7.

2. Related Works

2.1. Event A3 Handover Mechanism

The handover method of evolved Node B (eNB) can be divided into X2-Handover and S1-Handover [2]. X2 handover occurs when there is an X2 interface connection between eNBs, and each eNB is controlled by the same mobility management entity (MME). S1 handover is suitable for a non-X2 interface connection between eNBs or when eNBs are controlled by different MMEs. In this paper, we focus on the X2 handover. The X2 handover process is shown in Figure 1 [3]. According to the roaming and measurement control messages sent by the source eNB, the UE generates the required measurement report and transmits the report to the serving eNB. The serving eNB decides whether to hand over based on the measurement report and radio resource management (RRM). The serving eNB sends a request and necessary related information to the target eNB when the handover occurs. When the target eNB agrees to handover, it sends an ACK back to the serving eNB. The serving eNB uses this information through a radio resource control (RRC) connection reconfiguration to deliver to the UE. Once the UE successfully accesses the target eNB, the UE sends an RRC connection reconfiguration complete message to the target eNB, indicating that the UE has successfully completed the handover to the target eNB. After the target eNB receives the message returned by the UE, it sends a path switch request message to the MME to notify the MME to switch the path of the resource transmission. After receiving the notification, the MME sends a request to the S-GW to update the user plane. when the path switch and user plane are updated, the target eNB returns an ACK message to the serving eNB. After receiving the message, the serving eNB can release the resources previously occupied by the UE.
The common activities for handover measurements in LTE include events A1 to A5. Event A3 [4] is usually used as a measurement for the required signal strength of the handover. Among the different events in LTE, event A3 uses an offset to reduce the possibility of a ping-pong effect and does not require any adjustment of the signal threshold for different environments. The general process of event A3 is shown in Figure 2. When the signal strength of the neighboring eNB is continuously greater than the offset of the signal strength from the serving eNB during the measurement time, event A3 is triggered and the UE switches to the neighboring eNB. In this research, we refer to the previous research [5] and set the offset value as 3 dB.

2.2. Machine Learning Based Handover Management

In [6], the authors present a machine-learning-based handover management scheme for LTE to improve the QoE of file download for users. They proposed two QoE metrics, the probability of successful file download and the completed download time of the file, in their research. A two-level neural network scheme was proposed in their paper. In the first level, the authors used the past QoE in terms of the RSRP and RSRQ values measured by the UE and the past QoE as the input and in terms of download complete or non-complete as output. In the second level, the UE measurement report was used as input, and the download completion time was taken as the output when the file was complete. The machine learning architecture used in [6] includes 12 inputs, one hidden layer, two biases and one output. The general representative model is drawn in Figure 3. The main model used was feed forward neural network (FFNN), in which 75% of the data was used as a training dataset and 25% of the data was used as a test dataset. Their proposed handover algorithm then triggered the handover to the target eNB when the file download was expected to download successfully. If there was more than one target, it would switch to the target eNB with the lowest file download time. The authors in [6] proposed two QoE metrics, which were the probability and time to download the files successfully. However, we believe that these QoE metrics do not match the main applications of next-generation Internet. The challenge of next-generation Internet is real-time Internet services, such as video streaming over the Internet, real-time interactive streaming over the Internet, and Internet telephony services. Therefore, the analysis of QoE in this paper will focus on the Skype network real-time streaming services. In this paper, we propose a deep-learning-based MOS-aware mobile network handover mechanism to determine the appropriate handover time for real-time video conferencing services in mobile networks.
In [7], the authors proposed a vertical handover prediction scheme based on the signal-to-noise ratio (SNR) for LTE-WLAN heterogeneous networks. The minimum value of SNR allowed for each bandwidth was determined based on the specifications of the IEEE 802.11 standard. From the first scheme, their research required continuous reports of the strength of the nearby network signals scanned by the MS. Similarly, in the second scheme, the strength of the nearby network signals and the data rate of the MS and the available bandwidth of the neighboring sites were continuously reported. To perform the handover prediction, the authors used a threshold and handover zone (HOzone) for the computation. Their proposed prediction scheme used two independent thresholds. The first threshold was defined as the signal strength of the current service station. The second threshold was obtained from the signal strength of the candidate target station measured by the MS. HOzone represented the time interval between the selection of another base station (BS) and access point (AP) as candidate targets, such that the mobile station (MS) would possess enough time to perform the prediction. The proposed vertical handover prediction schemes achieved a prediction success with 99% percentage in the predefined surrounding areas using a random movement manner. However, the signal strength and available bandwidth were used to determine whether the handover was needed. The difference in bandwidth and delay requirements between different network services, however, was ignored. It may not be sufficient to meet the diverse needs of the Internet services if any handover mechanism only provides information of the signal strength and/or available bandwidth. Therefore, it is essential to provide the QoE-aware mechanism as the handover criteria for network services.
In [8], the authors presented a trajectory prediction algorithm of UE to plan for BS handover. The proposed CNN-LSTM model extracted features from historical trajectories to predict the direction of UE actions based on the historical trajectories of the UE. They selected a certain range of user trajectory data and set the time span of the data to no more than 5 s in order to better predict user trajectories for small coverage of 5G BS. For every 5 s, these data were recalculated as new path data. The simulation results showed that the proposed model could reduce the number of BS handovers by predicting the trajectory of the user. The CNN-LSTM was a more effective and stable model in predicting the trajectory of the user. However, we believe that the selected prediction time range cannot be based merely on a single prediction time range. It may not be sufficient to meet all demands of a handover decision in a shorter prediction time when the UE is moving fast. Therefore, in our research, we conduct the different prediction times, 2, 4, 6, 8 and 10 s as the basis of the experiments to meet the requirements of various UE moving speeds.
In [9], the authors proposed and evaluated the performance of a machine-learning-based approach to handover in scenarios with the presence of signal-blocking obstacles. The ns-3 simulator was used as the proof of concept. In the proposed mechanism, UE could choose the eNB that would most likely offer users the highest long-term QoS after the handover procedure, even in severe propagation conditions. The proposed schemes presented higher performance as compared to the classical ones and substantially improved users’ QoS in challenging scenarios. In [10], an intelligent handover scheme based on the Elman network in high-speed rail scenarios has been proposed. A neural network model in different regions, as well as input parameters, was trained by the Elman network to obtain the good prediction capabilities in order to improve the effectiveness and reliability of handover.
A handover mechanism for cost assessment was proposed in [11] that integrated signaling overhead, delay, call drops, and radio resource. The mathematical model developed was applicable to a variety of cellular architectures, but the focus of the paper was on the control/data separation architecture (CDSA). In addition, the handover prediction was proposed and evaluated as part of the overall cost through the stacked long and short-term memory (LSTM) model. Their evaluation of the overall model across different prioritization parameters such as user dissatisfaction, latency, signaling strength, and resources showed the impact of prediction accuracy as part of the overall cost. They also showed that the developed model coupled with a complementary data-driven deep-learning approach could reduce user complaints, latency, signaling overhead and resource waste. They concluded that the performance improvement could be attributed to the inherent recurrent nature of the LSTM model, which favors better model time series data. However, the priority parameters proposed in their paper should be specific to the network services used by the user, rather than fixed parameters, especially for the scenarios of users conducting services such as real-time video stream services. In this case, the users are more sensitive to the network quality requirements. Therefore, our research will provide a deep learning model to provide a more efficient handoff mechanism for users when using Skype real-time video conference services.
In [12], the authors proposed an offline scheme based on double deep reinforcement learning to minimize the frequency of handover in mm-wave networks. The optimal base station selection policy maximized the UE-BS connection time from the offline DDRL algorithms. The authors in [13] employed the LSTM model to simulate a regression problem to estimate the expected time for different neighbors of the current service cell while downloading a file. The proposed approach was better than the traditional event-based handover scheme. The proposed QoE model was similar to the research in literature [7], which evaluated QoE based on the time required to download a file. However, they did not consider the QoS or QoE issue for users being more sensitive with real-time stream services. Therefore, the more complex QoE evaluation criteria for real-time video conference services proposed in our research are applied to evaluate the proposed deep-learning-based handoff mechanism.
In [14], a multilayer neural network (MLNN) privacy and security preservation protocol was presented. To facilitate target cell selection, parameters taking user satisfaction, network, UE and service requirements into consideration were deployed so as to enhance both QoS and QoE during and after handover. The authors in [15] presented a machine learning scheme that not only facilitated optimal selection of target cells but also upheld both security and privacy during handovers. The simulation results showed that their proposed handover scheme provided a lower packet drop rate and ping-pong rate.
In summary, the research studies in [6,8,9,10,11,12,13,14,15] have shown the advantage of predicting optimal handover timing with better results as compared to the original handover mechanism by using the deep learning model. This observation is consistent with the results in this paper. However, this paper further considers the QoE required for the network service and then uses deep learning to predict the optimal handover timing. In addition, the authors also compared the performance results for different deep learning models, such as MLP, CNN, GRU and RNN/LSTM. From the results of [8,11,13], the RNN/LSTM-based deep learning model showed much more effective and stable predictions of the handover timing of UE. The above results are consistent with the experimental results in this paper. The experimental results in this paper show that RNN has the best performance among the MLP, CNN, RNN and LSTM models.

2.3. Quality of Experience

The standard P.10 [16] proposed by the ITU Telecommunication Standardization Sector (ITU-T) was first interpreted as QoE in Amendment 1 [17] in 2007. The QoE represents the user’s subjective perception of the overall service acceptance of an application. The European Cooperation in Science and Technology (COST) proposed a more detailed white paper to explain QoE [18], which was included in ITU-T P.10 Amendment 5 in 2016 [19].
The QoE focuses more on users’ subjective experience than traditional QoS. Therefore, besides common network parameters such as throughput, delay or packet loss rate, users’ expectation may also affect the QoE. However, users may have different requirements when using different network services in a mobile network. For example, authors A. Vizzarri and F. Davide proposed a QoE measurement based on page response time (PRT) and video response time (VRT) [20] and summarized three key factors that affect PRT or VRT. These three factors were used to quantify whether the service is good or not to meet the required QoE from users.
The authors C. Lambrecht and O. Verscheure [21] used the Moving Picture Quality Metric (MPQM) model to evaluate the MOS of video quality, which is based on the human spatio-temporal vision projection. The MPQM model is based on human spatio-temporal vision, and the process not only considers the effect of network parameters, but also includes the degradation of image quality caused by the compression and decompression of images.
In [22], the authors proposed a QoS-aware flexible mobility management scheme for software-defined networking (SDN)-based mobile networks. The proposed QoS-based differential handover procedure for each class can be provided by the interaction between the forwarding plane nodes and SDN controller. The performance analysis showed that the proposed scheme could enhance flexible network resource utilization to meet the QoS requirements for each class. A handover management scheme for device-to-device (D2D) communication was proposed in [23]. The proposed approach predicted the destination eNB of D2D users based on their movements and the received signal characteristics. Therefore, both UE in a D2D pair resided in the same cell to increase throughput and reduce latency.

3. MOS-Aware Measurement Scheme in Mobile Networks

The most commonly used QoE measurement is the mean opinion score (MOS). It is defined by the ITU-T in standard P.800 [24]. MOS was first used as a measure of VoIP service quality, as shown in Table 1. MOS of 1 means bad quality of experience, MOS of 5 means excellent quality of experience. With the popularity of QoE-related research and discussion, MOS is gradually used in various services.

3.1. Video Conference MOS Measurement

The real-time video conferencing MOS values were calculated based on the experimental results in [25]. The tool used to test video conferencing was Skype. Since Skype supports variable video bit rates, it is often used for real-time video processing by adjusting the video resolution and FPS. Table 2 lists the video-related parameters used by Skype. Skype can support up to 640 × 480 resolution, 30 FPS and 950 Kbps bit rate, and it can be reduced to 160 × 120 resolution, 5 FPS and 5 Kbps bit rate when the network conditions are not sufficient to support it.
According to the test experiments in [26], video transmission in video conferencing relies mainly on the UDP protocol. The factors affecting the quality of video conference are packet loss rate, video bitrate and frame rate. The video bitrate is calculated as shown in Equation (1), which represents the amount of data that can be received during a video conference. When the packet loss rate is less than 10%, the amount of received data depends on the current available throughput, and when the available throughput is more than 1 Mbps, the amount of received data is sufficient for the video conference. When the packet loss rate is greater than 10%, due to the continuous loss of packets, it is difficult to meet the requirement of video conference, and then the first priority will be to ensure the transmission quality of sound, thus the BW value will be fixed at 21 Kbps.
R v = { ( 1 0.15 4.5 P L ) ( 0.77 B W 10.8 ) ( 1 0.15 4.5 P L ) × 21   P L < 10 % P L 10 %
Equation (2) represents the relationship between the amount of received data and the frame rate. The measurement results are shown in Figure 4, which illustrates that the fps (frame per second) can achieve 28 fps when the video bit rate is greater than 200 kbps and can only maintain 5 fps when the bitrate is less than 20 kbps.
f ( R v ) = { 5 10 15 28   R v 20 20 < R v 80 80 < R v 200 200 < R v
The video bitrate and frame rate obtained from Equations (1) and (2) can be used to calculate the current MOS for the video conference service, defined in [21]. In Equation (3), where Icoding represents the video quality under the influence of video bitrate and frame rate and PL represents the packet loss rate, DPL indicates the extent to which the robustness of the video quality is affected by packet loss.
MOS = 1 + I coding exp ( PL D PL )
The Icoding is shown in Equation (4), where Iofr represents the ideal video quality that can be achieved at the current video bitrate, f(Rv) represents the current fps, Ofr represents the ideal frame rate that can be achieved at the current video bitrate, and Dfr represents the extent to which the robustness of the video quality is affected by the frame rate.
I coding = I O fr × exp { [ ln ( f ( R v ) ) ln ( O fr ) ] 2 2 D fr 2 }
IOfr is calculated as shown in Equation (5) for video bitrate, and Ofr and Dfr are calculated in the same way as Equation (6).
I O fr = a a 1 + ( R v b ) c
D fr = O fr = g + h × R v
The relevant constants, a, b, c, g, h, are defined in [19], with a = 3.759, b = 184.1, c = 1.161, g = 1.446, and h = 0.02228, resulting in the complete MOS calculation equation as shown in (7).
MOS = 1 + ( 3.759 3.759 1 + ( R v 184.1 ) 1.161 ) × exp ( ( ln ( f ( R v ) ) ln ( 1.431 + 0.02228 R v ) ) 2 2 ( 1.446 + 0.03881 R v ) 2 )

3.2. Video Conference MOS Testing and Analysis

In order to conduct a simulation environment for mobile networks, we refer to the path loss model in 3GPP TR36.814 [27]. As shown in Equation (8), PL represents the path loss in dB. R means the eNB’s signal covered radius in kilometers. The UE-measured RSRP (reference symbol received power) is given by Equation (9). The transmission power for each resource element is Pt (dBm), and this model is imported into Mininet-WiFi [28] to ensure that the user’s performance during mobility has the characteristics of an LTE network.
PL = 131.1 + 42.8 log 10 R   ( dB )
RSRP = P t PL   ( dBm )
In addition, the effect between distance and throughput was simulated based on the characteristics of IEEE 802.11 g in the original Mininet-WiFi. However, this simulation result will be different from LTE. Therefore, we obtained the correspondence between throughput and RSRP from the UE measurements based on the results of the downlink tests for LTE from [29]. The relationship between the average downlink throughput and RSRP is shown in Table 3. QDL = 10% is used as a reference for LTE throughput performance in this paper.
The simulation scenario is implemented using Mininet-WiFi, which is based on the Mininet SDN network simulator with the IEEE 802.11 module for simulating the characteristics of wireless networks. Although Mininet-WiFi has the capability of SDN network simulation, in this research, we only deploy it for analysis of handover characteristics in wireless networks. A single eNB scenario has been considered in order to study the impact of transmission distance on RSRP. The topology is shown in Figure 5, and the network parameters in this simulation scenario are shown in Table 4. The eNB’s transmission range is about 4200 m. During the experiment, one target UE moves from the center of the effective eNB transmission range at a speed of 20 m per second until it reaches the edge of the eNB transmission range. The total test time is 230 s. There are eight UE competing for network resources as the background traffic, while each of them uses Skype video calls with 640 × 480 resolution.
In this paper, the acceptable threshold of MOS is set to 4. When the MOS value is higher than 4, it means that the current network environment can meet the acceptable needs of users. When the MOS is lower than 4, the network resources at this time may not be able to maintain the quality of user experience for the application.
Since this experiment is based on LTE telecom network architecture, assuming that the network throughput can meet the Skype video conferencing demand for users. The experiment aims at analyzing the impact caused by packet loss rate on MOS values of video conferencing. Since there are eight users using video conferencing services at the same time, they compete with each other for throughput, as shown in Figure 6. It can be found that when the RSRP is greater than −122.6 dBm, the packet loss rate is smaller than 10%. When the RSRP is lower than −122.6 dBm, the packet loss rate increases sharply due to the long distance from the eNB.
Figure 7 shows the relationship between MOS and RSRP. The MOS value of the Skype video conference service is calculated according to Equation (7) based on the packet loss rate and the relative video bitrate. In Figure 7, when the RSRP is greater than −122.6 dBm, the MOS value is about 4.25. When RSRP is smaller than −122.6 dBm, the packet loss rate rises to more than 10%, and the MOS value drops below 4, lower than the MOS acceptable threshold. Based on the explanations above, the eNB needs to determine whether the current eNB can satisfy the users’ demand for video conferencing services based on the received RSRP from UE.

4. Handover Dataset Collection and Deep Learning Model Performance Analysis

The most common mobile network handover method is based on RSRP measurements. Therefore, the main essence of the proposed handover mechanism is to predict the RSRP from neighboring eNBs using deep learning models. The implementation of the deep learning models is achieved with Python, using Keras (version 2.2.2) and Tensorflow (version 1.8.0), as a backend. We compare the performance of four deep learning models, including MLP (multilayer perceptron), CNN (convolutional neural network), RNN (recurrent neural network), and LSTM (long short-term memory), and we apply the deep learning models with the best prediction accuracy.

4.1. Dataset Collection and Analysis

Figure 8 shows the scenario being implemented in Mininet-WiFi to collect the training dataset. During the dataset collection, the UE passes through the transmission range of the eNB at a speed of 20 m per second from different tangents and observes the variation of RSRP under different tangents. The collection method is to record the change of RSRP values of UE in every 1 s interval.
Table 5 shows the features for the training dataset. The training dataset will collect the RSRP values in every one-second interval from the eNB as the input to predict the RSRP values for the next 2, 4, 6, 8, and 10 s. RSRP_t represents the collected RSRP value at time t. The training label of RSRP value after 2 s, i.e., at time t + 2, is RSRP_t + 2. The training label of RSRP value after 4 s is RSRP_t + 4, and so on. Lastly, the training label of RSRP value after 10 s is RSRP_t + 10.
In this paper, the performance of deep learning models such as MLP, CNN, RNN, and LSTM are compared and the relevant parameters of the models are listed in Table 6.
  • In the MLP model, the numbers of neurons in the first and second layers are both 128, and the number of neurons in the third layer is reduced to 64.
  • The CNN model includes a convolutional layer, a pooling layer, and a fully connected layer. The convolutional base layer uses 32 neurons and the fully connected layer uses 16 neurons.
  • The RNN model uses two RNN layers, where the first layer uses 64 neurons and the second layer uses 32 neurons.
  • The LSTM model uses two LSTM layers with the same number of neurons as the RNN.
All the deep learning models are trained using a training dataset with 2840 in number. Each deep learning model is trained for a total of 100 epochs with 50 batch size in each epoch. The performance of each deep learning model is evaluated after training with a testing dataset, which is 525 in number. Some other training parameters are shown in Table 7.
In this study, the measured RSRP values of the UE collected in every second. The RSRP value with the timestamp is used as the training input for the training model to predict the RSRP values. To verify the reliability of the prediction model, we analyzed the results of the deep learning model at different future time instants and predicted the future RSRP value at 2 s intervals for 2, 4, 6, 8, and 10 s.

4.2. Deep Learning Model Evaluation

Since regression models are used to predict numerical data with continuous values, the way to evaluate a regression model is different from the common categorical model evaluation. The common regression model evaluation methods are mean square error (MSE) [30] and coefficient of determination (R-squared) [31]. The MSE is calculated as in Equation (10).
MSE = 1 n i = 1 n ( Y i _ original Y i _ predit ) 2
In Equation (10), n represents the total number of test samples used for evaluation, i represents the first sample, Yi_original represents the original data of the ith test sample, and Yi_predit represents the predicted result of the ith test sample. The MSE is inversely proportional to the predicted result. The smaller value of MSE means that the predicted result is closer to the actual value.
R-squared represents the ratio between the variance of the predicted data and the variance of the actual data in the deep learning model. A higher value of R-squared indicates a higher correlation between the predicted and actual data. R-squared is calculated as in Equation (11).
R _ squared = SSR SST
In Equation (11), SSR represents the amount of variation in the regression model and is calculated as in Equation (12).
SSR = i = 1 n ( Y i _ predit Y ¯ ) 2
where Y ¯ represents the mean of the actual data ( Y i _ original )
In addition, SST represents the sum of squares of the differences between the original data and the actual data, and is calculated as shown in Equation (13).
SST = i = 1 n ( Y i _ original Y ¯ ) 2
Figure 9 shows the model loss of RSRP after 2 s predicted by the four deep learning models, MLP, CNN, RNN, LSTM models, respectively. Similarly, Figure 10, Figure 11, Figure 12 and Figure 13 show the model loss of RSTP after 4, 6, 8, and 10 s, respectively. The loss function used in the training is MSE. The MSE is chosen such that the deep learning models can reduce the gap between the predicted and the actual data during the training process. As shown in Figure 9, Figure 10, Figure 11, Figure 12 and Figure 13, the RNN model has lower MSE values than MLP, CNN and LSTM models after 2, 4, 6, 8, and 10 s. That is, the RNN model has better prediction performance of RSRP than other models for all different predicting time intervals.

5. The Proposed Deep-Learning-Based Handover Mechanism for Real-Time Video Conference Services

Figure 14 shows the mobile moving path for a deep learning model performance analysis. The purpose of designing this verification path is to observe whether the deep learning model can maintain a certain prediction accuracy for the RSRP after changing the movement direction. During the collection of the verification dataset, the UE starts moving from a position close to the center of the eNB and changes its direction of movement when it reaches the edge of the effective transmission range of the eNB at 202 s. The change of RSRP is recorded once per second during the movement. The experiment collects a total of 525 s of verification dataset. The test results of the validation dataset are presented in this section. The prediction results of four deep learning models: MLP, CNN, RNN, and LSTM, are implemented to analyze the RSRP prediction function for LTE and to select the deep learning model with best prediction capability.
In order to verify the reliability of the prediction models, we analyze the results of the deep learning models in predicting the RSRP values at different future time points: the 2nd, 4th, 6th, 8th and 10th seconds, with an interval of 2 s by using MLP, CNN, RNN and LSTM deep learning models. The 2 s period is chosen as the shortest prediction time. The main reason is that when the deep learning model predicts the future RSRP and prepares handover based on the prediction results, the process requires some processing and communication time. If the interval time is set to 1 s, it may result in a situation where the handover event has already occurred by the time the prediction result is returned. Therefore, using 2 s as the prediction time can provide the eNB with enough response time to analyze and process the prediction results. The purpose of selecting and predicting RSRP from eNBs with different time intervals is to observe whether the selected eNBs can continue to satisfy the users’ demand, thus avoiding the ping-pong effect at the handover. In addition, by predicting the selection of eNBs that can maintain MOS greater than 4 for a longer period of time, frequent handover will be avoided. The speed of UE movement in the experiment is set at 90 km/h. The maximum prediction time is 10 s. In this case, the UE moves a distance of 250 m in 10 s. In addition, when the user wanders for a long time around the cell boundary, the proposed mechanism in this paper will predict and select the RSRP with different time intervals for eNBs to continually satisfy the user’s requirements in order to avoid the ping-pong effect during handover.
Based on the prediction results of the four deep learning models shown in Table 8, Table 9, Table 10 and Table 11, we can observe that the mean square error (MSE) of accuracy gradually increases and the R-square value of accuracy slightly decreases as the prediction interval increases. The results indicate that the models are less accurate in predicting longer intervals. Among the four deep learning models, the minimum MSE value of accuracy is the RNN model with 0.111 and the maximum R-square value of accuracy is the RNN with 0.999 compared with the other three models in the 2 s period. This indicates that RNN has better performance results than the other three models.
Figure 15, Figure 16, Figure 17, Figure 18 and Figure 19 show the RSRP results predicted by the four deep learning models after 2, 4, 6, 8, and 10 s. The X-axis shows the time in seconds when the UE moves, and the Y-axis shows the change in RSRP in dBm. The blue line represents the actual RSRP, and the red line is the predicted RSRP from the trained deep learning model. A higher overlap between the blue and red lines means that the prediction result of the deep learning model is better.
From Figure 15, Figure 16, Figure 17, Figure 18 and Figure 19, the four deep learning models all show a significant or considerable gap between the real data and the predicted data as the prediction time increases. However, the predicted data of the RNN model stays relatively close to the real data in general. Conversely, the overall prediction result of the CNN model produces a relatively larger deviation from the real data.
The proposed deep-learning-based handover mechanism is implemented using the Mininet-WiFi for LTE network simulation. When the UE sends back the received RSRP value to the eNB in every second, the eNB will make RSRP predictions for the next 2, 4, 6, 8, and 10 s based on the RSRP values. Based on the predicted RSRP values, the corresponding MOS values are calculated according to Equation (7). According to the RSRP values received from the UE, the eNB needs to predict whether the eNB can meet the required MOS for video conferencing services in the next few seconds. If not, it activates the handover mechanism before the signal quality is degraded to avoid the MOS value going too low.

6. Experimental Results and Analysis

In this section, the proposed deep-learning-based handover mechanism is evaluated to meet the MOS requirements of the real-time video conference service. We also compare the original event A3 and the proposed deep-learning-based handover mechanism. The experiment topology and UE’s moving path are shown in Figure 20. The injection of network traffic from the iperf tool is used to simulate the transmission of a video call in Skype. The experiments were performed three times with fixed paths for the original event A3 and the proposed deep-learning-based handover mechanism individually. The mobile nodes were evaluated with the same moving speed. According to the previous experimental results, the RNN model has the lowest MSE value and the highest R-square value than the MLP, CNN and LSTM models. Thus, the RNN deep learning model is implemented using the Mininet-WiFi for LTE network simulation. The acceptable threshold of MOS is set to 4 since the speed of the mobile node in the experiment is 20 m per second. The eNB will make RSRP predictions for the next 2 s to confirm whether the eNB can meet the required MOS for Skype video conferencing services. If not, eNB activates the handover mechanism before the signal quality is degraded to avoid an MOS value lower than 4.
Figure 21 and Figure 22 show the packet loss rates of three experimental results of the proposed deep-learning-based handover mechanism and LTE event A3 handover mechanism, respectively. The LTE event A3 handover mechanism is based only on the signal strength difference between eNBs. It results in a higher packet loss rate under the required network traffic for the real-time video conference service due to the late triggering of the handover mechanism, as compared to the proposed deep-learning-based handover mechanism. Therefore, the overall packet loss rate of the event A3 handover mechanism is relatively higher than that of the proposed deep-learning-based handover mechanism.
Figure 23 and Figure 24 show the 95% confidence interval of three experimental results of packet loss rates for the proposed deep-learning-based handover mechanism and the LTE event A3 handover mechanism, respectively. Within the 95% confidence interval, it can be found that both the event A3 handover mechanism and the proposed deep-learning-based handover mechanism can maintain their packet loss rates below 4%. The highest packet loss rates of the proposed deep-learning-based handover mechanism is from 61% to 62%; however, the highest packet loss rates of the LTE Event A3 handover mechanism is from 92% to 97%.
Figure 25 and Figure 26 show the MOS of three experimental results of the proposed deep-learning-based handover mechanism and LTE event A3 handover mechanism, respectively. We observe the experiments of the MOS values equal to or greater than 4 for both mechanisms. In the three experiments, the proposed deep-learning-based handover mechanism with MOS values equal to or greater than 4 are maintained for 682, 683 and 682 s. However, the MOS values equal to or greater than 4 for the three experimental results of the LTE event A3 handover mechanism are only 673, 674 and 673 s.
Figure 27 and Figure 28 show the 95% confidence intervals of the MOS values for the deep-learning-based handover mechanism and the LTE event A3 handover mechanism, respectively. The MOS results of these two handover mechanisms are compared as below. Within the 95% confidence interval, it can be found that both the LTE event A3 handover mechanism and the proposed deep-learning-based handover mechanism are able to maintain their MOS around 4.2. The minimum MOS for the proposed deep-learning-based handover mechanism is around 3.2 to 3.3; however, the minimum MOS for the LTE event A3 handover mechanism is as low as 2.4.
Based on the packet loss rate variation of the two handover mechanisms within 15 s before and after the handover time, in the first handover, the average packet loss rate of the proposed deep-learning-based handover mechanism is 6.30%, and the average packet loss rate of the LTE event A3 handover mechanism is 7.07%. In the second handover, the average packet loss rate of the proposed deep-learning-based handover mechanism is 5.12%, and the average packet loss rate of the LTE event A3 handover mechanism is 7.06%; thus, the deep learning prediction video conference MOS-based hand change mechanism proposed in this study is better than the general one. Therefore, the above results show that the proposed deep-learning-based handover mechanism is better than the LTE event A3 handover mechanism.

7. Conclusions

This paper is based on user experience for real-time video conference service and combines deep learning to implement a handover mechanism by predicting MOS to enhance the quality of service for users in the LTE network. First, we summarize the MOS evaluation criteria of a real-time video conference service and establish a handover mechanism based on MOS.
In addition, we have proposed a deep learning model to predict the RSRP of LTE signal strength, and we analyzed the prediction accuracy of four deep learning models, including MLP, CNN, RNN and LSTM. From the evaluation experiments of the prediction results of the four deep learning models, it can be observed that all the deep learning models lead to a decrease in accuracy when predicting longer time intervals. However, the RNN model has the lowest MSE when predicting after 2, 4, 6, 8 and 10 s, respectively. Moreover, the experimental results for model loss indicate that the RNN model has better prediction results in both the short and long term than the other three deep learning models.
Based on the predicted RSRP values from the proposed RNN deep learning model, the corresponding MOS values are calculated according to Equation (7). The experimental results have also demonstrated that the proposed deep-learning-based handover mechanism can improve the quality of users’ real-time video conference service experience as compared with the general LTE event A3 handover mechanism. The MOS values equal to or greater than 4 for the proposed deep-learning-based handover mechanism can accumulate about 682 s; however, it can accumulate only about 673 s for the LTE event A3 handoff mechanism.
Furthermore, this paper focuses on the proposed deep learning handover mechanism via the Skype video conference services in LTE. However, the same approach could be extended to the main applications of online video conferencing services such as MS Teams, Zoom, Google Meet, etc., by adjusting the parameters.
In addition, AGVs and UAVs are two of the major applications of current mobile robotics in the context of Industry 4.0. For example, mobile robots can implement applications such as image recognition and object detection via real-time video streaming. However, the proposed deep-learning-based handover mechanism can provide a more stable real-time video streaming service while the robot is moving to meet the video quality requirements for image recognition and object recognition.
In the future, the proposed deep-learning-based handover mechanism can be extended to different application services for MOS handover mechanism research and can be implemented in the 5G next-generation network.

Author Contributions

Conceptualization, T.-H.L., L.-H.C. and Y.-S.C.; methodology, T.-H.L., L.-H.C. and Y.-S.C.; software, Y.-S.C.; validation, T.-H.L., L.-H.C. and Y.-S.C.; formal analysis, T.-H.L., L.-H.C. and Y.-S.C.; investigation, T.-H.L. and L.-H.C.; resources, T.-H.L.; data curation, T.-H.L., L.-H.C. and Y.-S.C.; writing—original draft preparation, T.-H.L., L.-H.C. and Y.-S.C.; writing—review and editing, T.-H.L. and L.-H.C.; visualization, Y.-S.C.; supervision, T.-H.L.; project administration, T.-H.L.; funding acquisition, T.-H.L. All authors have read and agreed to the published version of the manuscript.
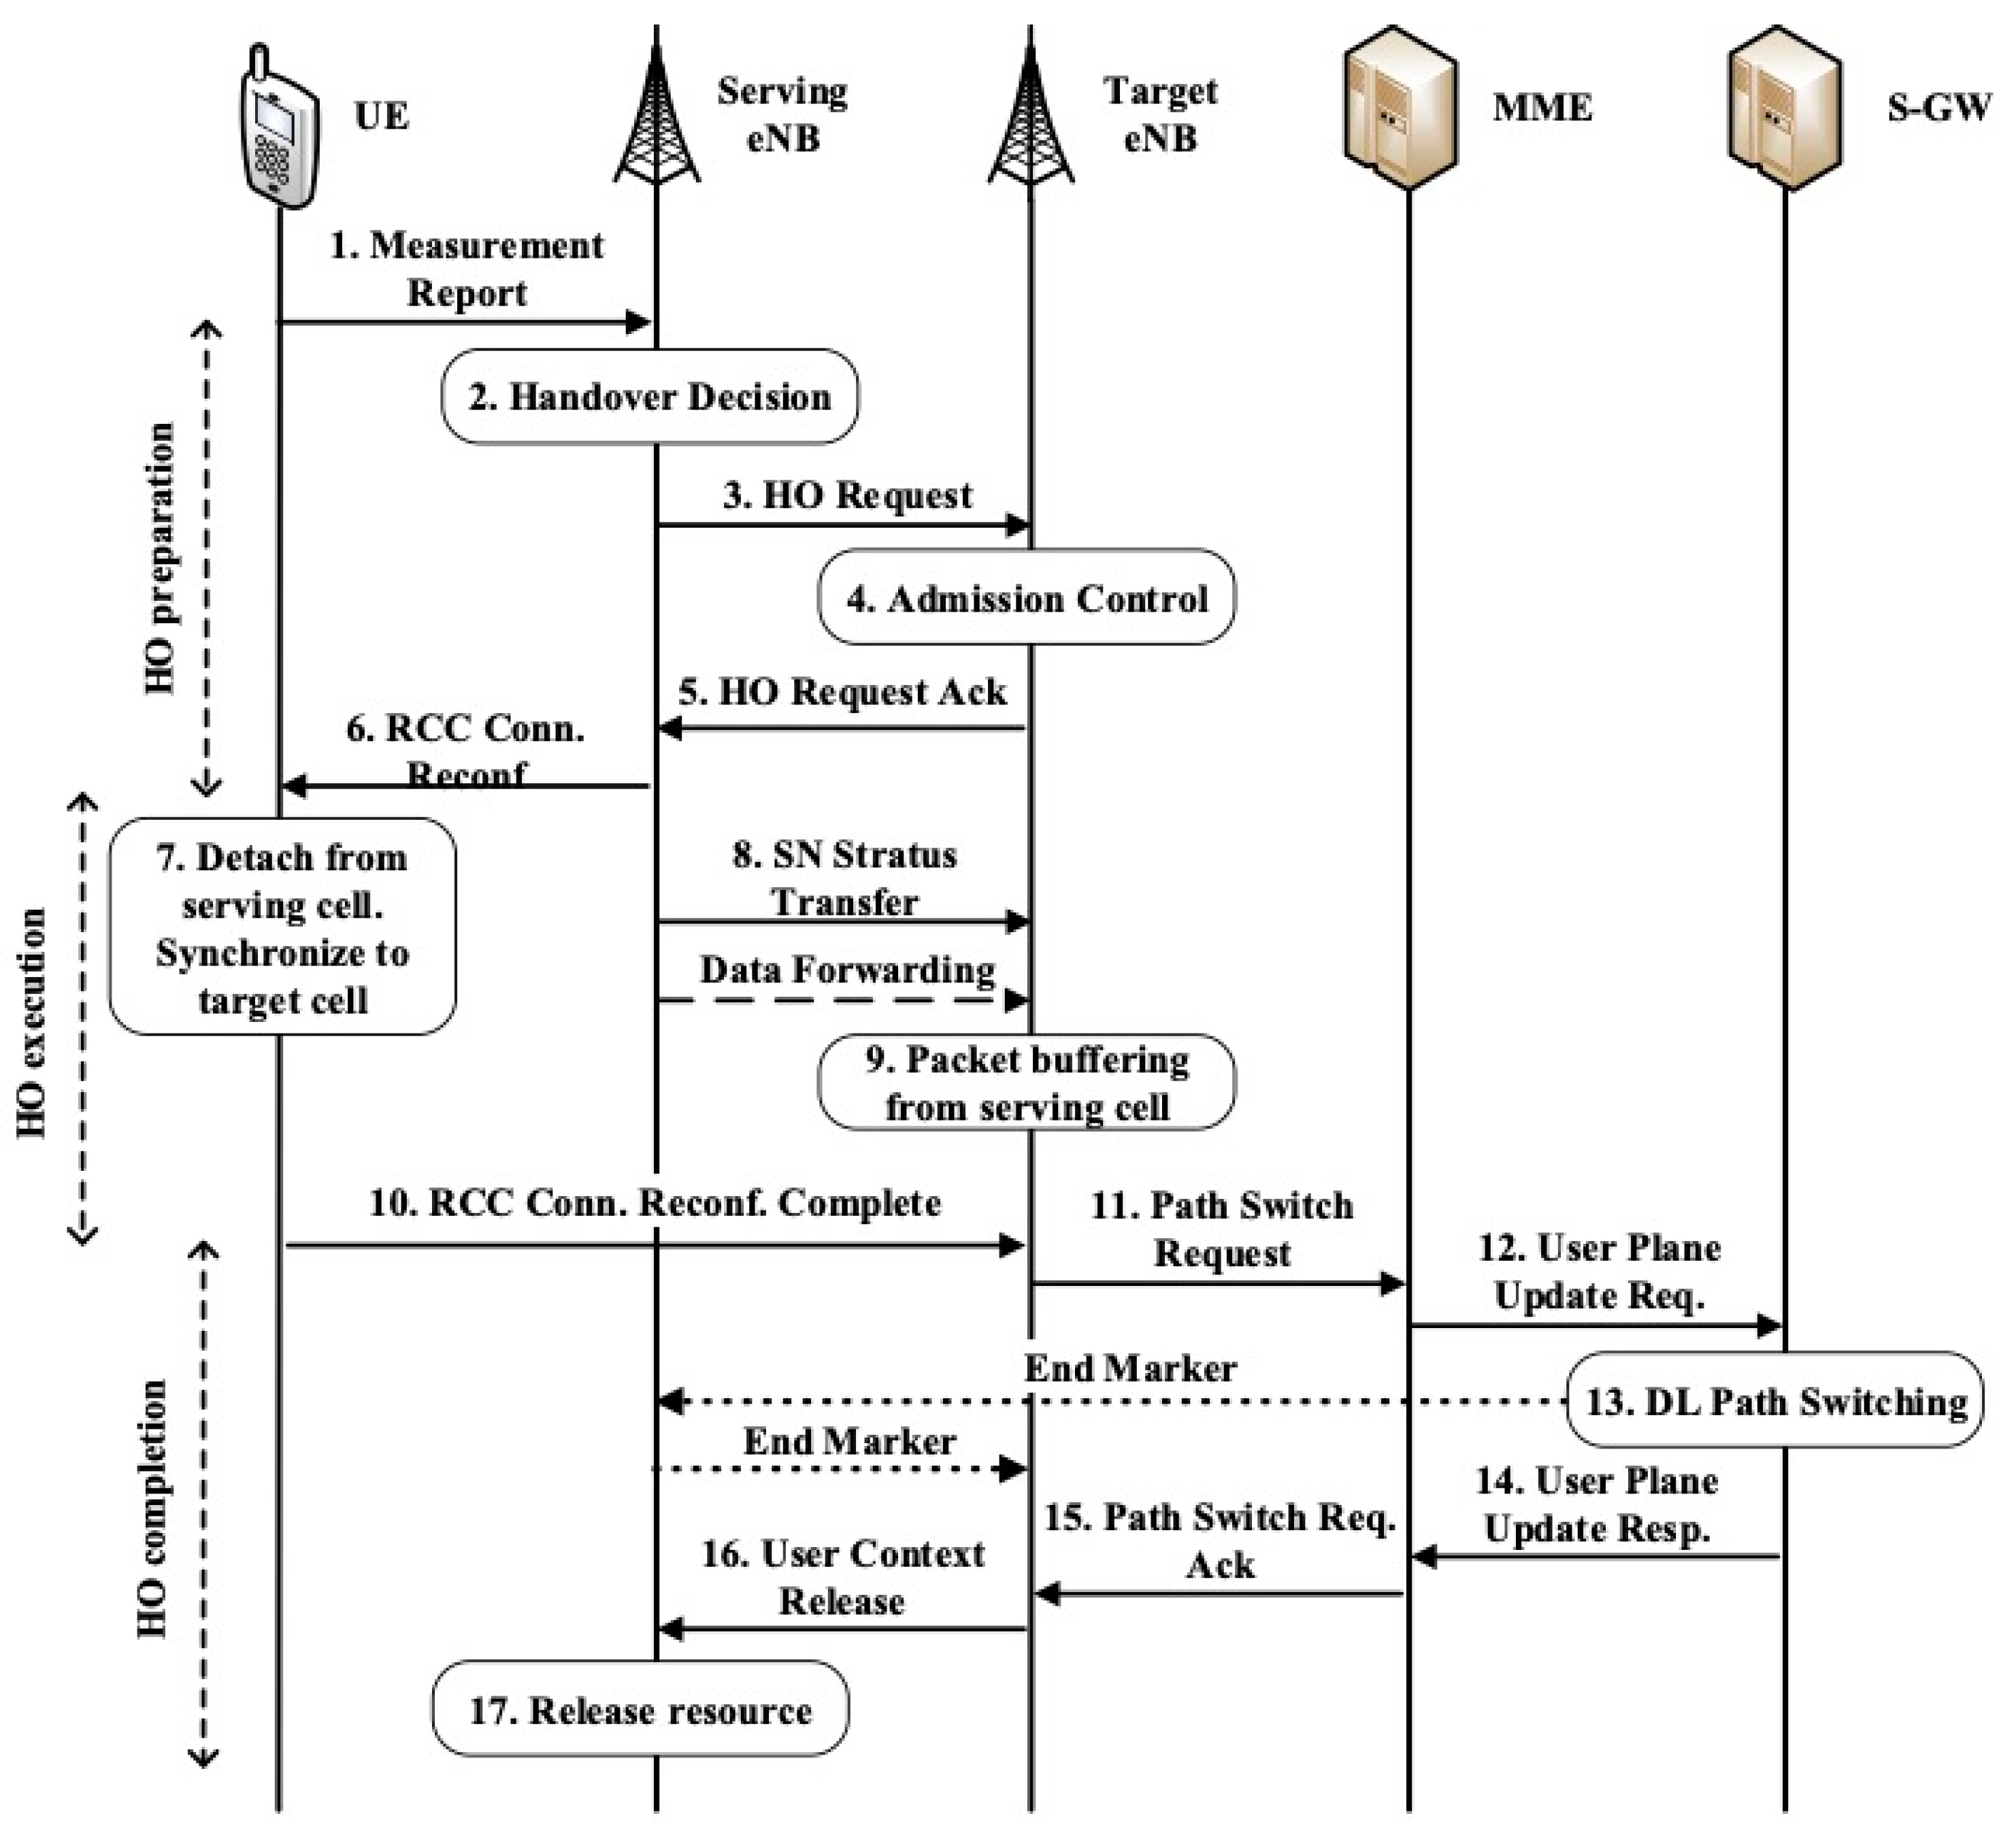
Funding

This research was funded by the Ministry of Science and Technology, Taiwan, ROC, grant number MOST 109-2221-E-142-002 and MOST 110-2221-E-142-001.

Institutional Review Board Statement

Not applicable.

Informed Consent Statement

Not applicable.

Data Availability Statement

Not applicable.

Acknowledgments

The authors would like to acknowledge the support from the Ministry of Science and Technology of Taiwan, ROC (MOST 109-2221-E-142-002 and MOST 110-2221-E-142-001).

Conflicts of Interest

The authors declare no conflict of interest.

References

  1. Yi, S.; Chun, S.; Lee, Y.; Park, S.; Jung, S. Radio Protocols for LTE and LTE-Advanced; Wiley Online Library: Hoboken, NJ, USA, 2012. [Google Scholar] [CrossRef]
  2. 3GPP TS 36.423 Release 15.4.0; Evolved Universal Terrestrial Radio Access Network (E-UTRAN); X2 Application Protocol (X2AP). ETSI: Sophia Antipolis, France, 2019. Available online: https://www.etsi.org/deliver/etsi_ts/136400_136499/136423/15.05.00_60/ts_136423v150500p.pdf (accessed on 18 February 2022).
  3. Ahmad, R.; Sundararajan, E.A.; Othman, N.E.; Ismail, M. Handover in LTE-advanced wireless networks: State of art and survey of decision algorithm. Telecommun. Syst. 2017, 66, 533–558. [Google Scholar] [CrossRef]
  4. Davaasambuu, B.; Yu, K.; Sato, T. Self-Optimization of Handover Parameters for Long-Term Evolution with Dual Wireless Mobile Relay Nodes. Future Internet 2015, 7, 196–213. [Google Scholar] [CrossRef] [Green Version]
  5. Harja, S.L.; Hendrawan. Evaluation and Optimization Handover Parameter based X2 in LTE Network. In Proceedings of the 2017 3rd International Conference on Wireless and Telematics (ICWT), Palembang, Indonesia, 27–28 July 2017; pp. 175–180. [Google Scholar] [CrossRef]
  6. Ali, Z.; Baldo, N.; Mangues-Bafalluy, J.; Giupponi, L. Machine Learning Based Handover Management for Improved QoE in LTE. In Proceedings of the NOMS 2016-2016 IEEE/IFIP Network Operations and Management Symposium, Istanbul, Turkey, 25–29 April 2016; pp. 794–798. [Google Scholar] [CrossRef]
  7. Hosny, K.M.; Khashaba, M.M.; Khedr, W.I.; Amer, F.A. New vertical handover prediction schemes for LTE-WLAN heterogeneous networks. PLoS ONE 2019, 14, e0215334. [Google Scholar] [CrossRef] [PubMed] [Green Version]
  8. Ma, Y.; Chen, X.; Zhang, L. Base Station Handover Based on User Trajectory Prediction in 5G Networks. In Proceedings of the IEEE International Symposium on Parallel and Distributed Processing with Applications (ISPA), New York, NY, USA, 30 September–3 October 2021; pp. 1476–1482. [Google Scholar]
  9. Cabral de Brito Guerra, T.; Dantas, Y.R.; Sousa, V.A., Jr. A Machine Learning Approach for Handover in LTE Networks with Signal Obstructions. J. Commun. Inf. Syst. 2020, 35, 271–289. [Google Scholar] [CrossRef]
  10. Li, D.; Li, D.; Xu, Y. Machine Learning Based Handover Performance Improvement for LTE-R. In Proceedings of the 2019 IEEE International Conference on Consumer Electronics—Taiwan (ICCE-TW), Yilan, Taiwan, 20–22 May 2019; pp. 1–2. [Google Scholar] [CrossRef]
  11. Ozturk, M.; Gogate, M.; Onireti, O.; Adeel, A.; Hussain, A.; Imran, M.A. A novel deep learning driven, low-cost mobility prediction approach for 5G cellular networks: The case of the Control/Data Separation Architecture (CDSA). Neurocomputing 2019, 358, 479–489. [Google Scholar] [CrossRef]
  12. Mollel, M.S.; Abubakar, A.I.; Ozturk, M.; Kaijage, S.; Kisangiri, M.; Zoha, A.; Imran, M.A.; Abbasi, Q.H. Intelligent handover decision scheme using double deep reinforcement learning. Phys. Commun. 2020, 42, 101133. [Google Scholar] [CrossRef]
  13. Ali, Z.; Miozzo, M.; Giupponi, L.; Dini, P.; Denic, S.Z.; Vassaki, S. Recurrent Neural Networks for Handover Management in Next-Generation Self-Organized Networks. In Proceedings of the 2020 IEEE 31st Annual International Symposium on Personal, Indoor and Mobile Radio Communications, Virtual Conference, London, UK, 31 August–3 September 2020; pp. 1–6. [Google Scholar]
  14. Nyangaresi, V.O.; Rodrigues, A.J. Efficient handover protocol for 5G and beyond networks. Comput. Secur. 2022, 113, 102546. [Google Scholar] [CrossRef]
  15. Nyangaresi, V.O.; Rodrigues, A.J.; Abeka, S.O. Machine Learning Protocol for Secure 5G Handovers. Int. J. Wirel. Inf. Netw. 2022, 29, 14–35. [Google Scholar] [CrossRef]
  16. ITU-T Recommendation P.10/G.100; Vocabulary of Terms on Telephone Transmission Quality and Telephone Sets. December 1998. ITU: Geneva, Switzerland. Available online: https://www.itu.int/rec/T-REC-P.10-199812-S (accessed on 18 February 2022).
  17. ITU-T Recommendation P.10/G.100 Amendment 1; New Appendix I—Definition of Quality of Experience (QoE). January 2007. ITU: Geneva, Switzerland. Available online: https://www.itu.int/rec/T-REC-P.10-200701-S!Amd1 (accessed on 18 February 2022).
  18. Brunnström, K.; Beker, S.A.; Moor, K.D.; Dooms, A.; Egger, S.; Garcia, M.; Hossfeld, T.; Jumisko-Pyykkö, S.; Keimel, C.; Larabi, M.; et al. Qualinet White Paper on Definitions of Quality of Experience; HAL: Lyon, France, 2013. [Google Scholar]
  19. ITU-T Rec. P.10/G.100; Vocabulary for Performance and Quality of Service. Amendment 5: New Definitions for Inclusion in Recommendation ITU-T P.10/G.100. July 2016. ITU: Geneva, Switzerland. Available online: https://www.itu.int/rec/T-REC-P.10-201607-S!Amd5 (accessed on 18 February 2022).
  20. Vizzarri, A.; Davide, F. QoE QoS Mapping for YouTube services Over LTE Network. MobiWac ‘16. In Proceedings of the 14th ACM International Symposium on Mobility Management and Wireless Access, Malta, 13–17 November 2016; pp. 107–114. [Google Scholar] [CrossRef]
  21. Lambrecht, C.J.V.D.B.; Verscheure, O. Perceptual Quality Measure Using a Spatiotemporal Model of the Human Visual System. In Digital Video Compression: Algorithms and Technologies 1996; SPIE: San Jose, CA, USA, 1996; Volume 2668, pp. 450–461. [Google Scholar] [CrossRef] [Green Version]
  22. Kyung, Y.; Kim, T. QoS-Aware Flexible Handover Management in Software-Defined Mobile Networks. Appl. Sci. 2020, 10, 4264. [Google Scholar] [CrossRef]
  23. Lai, W.K.; Shieh, C.; Chou, F.; Hsu, C.; Shen, M. Handover Management for D2D Communication in 5G Networks. Appl. Sci. 2020, 10, 4409. [Google Scholar] [CrossRef]
  24. ITU-T Recommendation P.800; Methods for Objective and Subjective Assessment of Quality. August 1996. ITU: Geneva, Switzerland. Available online: https://www.itu.int/rec/T-REC-P.800-199608-I/en (accessed on 18 February 2022).
  25. Zhang, X.; Xu, Y.; Hu, H.; Liu, Y.; Guo, Z.; Wang, Y. Modeling and Analysis of Skype Video Calls: Rate Control and Video Quality. In IEEE Transactions on Multimedia; IEEE: Manhattan, NY, USA, 2013; Volume 15, pp. 1446–1457. [Google Scholar] [CrossRef]
  26. ITU-T Recommendation G.1070; Opinion Model for Video-Telephony Applications. June 2018. ITU: Geneva, Switzerland. Available online: https://www.itu.int/rec/T-REC-G.1070-201806-I/en (accessed on 24 February 2022).
  27. 3GPP TR 36.814 Release 9.2.0; Evolved Universal Terrestrial Radio Access (E-UTRA); Further Advancements for E-UTRA Physical Layer Aspects. 3GPP: Sophia Antipolis, France, 2017. Available online: https://www.3gpp.org/ftp/Specs/archive/36_series/36.814/36814-920.zip (accessed on 24 February 2022).
  28. Fontes, R.R.; Afzal, S.; Brito, S.H.B.; Santos, M.A.S.; Rothenberg, C.E. Mininet-WiFi: Emulating Software-Defined Wireless Networks. In Proceedings of the 2015 11th International Conference on Network and Service Management (CNSM), Barcelona, Spain, 9–13 November 2015; pp. 384–389. [Google Scholar] [CrossRef]
  29. Tomić, I.A.; Davidović, M.S.; Bjeković, S.M. On the Downlink Capacity of LTE Cell. In Proceedings of the 2015 23rd Telecommunications Forum Telfor (TELFOR), Belgrade, Serbia, 24–26 November 2015; pp. 181–185. [Google Scholar] [CrossRef]
  30. Sai, Y.; Jinxia, R.; Zhongxia, L. Learning of Neural Networks Based on Weighted Mean Squares Error Function. In Proceedings of the 2009 Second International Symposium on Computational Intelligence and Design, Changsha, China, 12–14 December 2009; pp. 241–244. [Google Scholar] [CrossRef]
  31. Awawdeh, M.; Faisal, T.; Bashir, A.; Sheikh, A. Application of Outlier Detection Using Re-Weighted Least Squares and R-squared for IoT Extracted Data. In Proceedings of the 2019 Advances in Science and Engineering Technology International Conferences (ASET), Dubai, United Arab Emirates, 26 March–10 April 2019; pp. 1–6. [Google Scholar] [CrossRef]
Figure 1. The X2 handover process.
Applsci 12 04049 g001
Figure 2. The event A3 handover.
Applsci 12 04049 g002
Figure 3. The general representative model with 12 inputs, 1 hidden layer, 2 biases and 1 output.
Applsci 12 04049 g003
Figure 4. The relationship between the amount of data received and the frame rate.
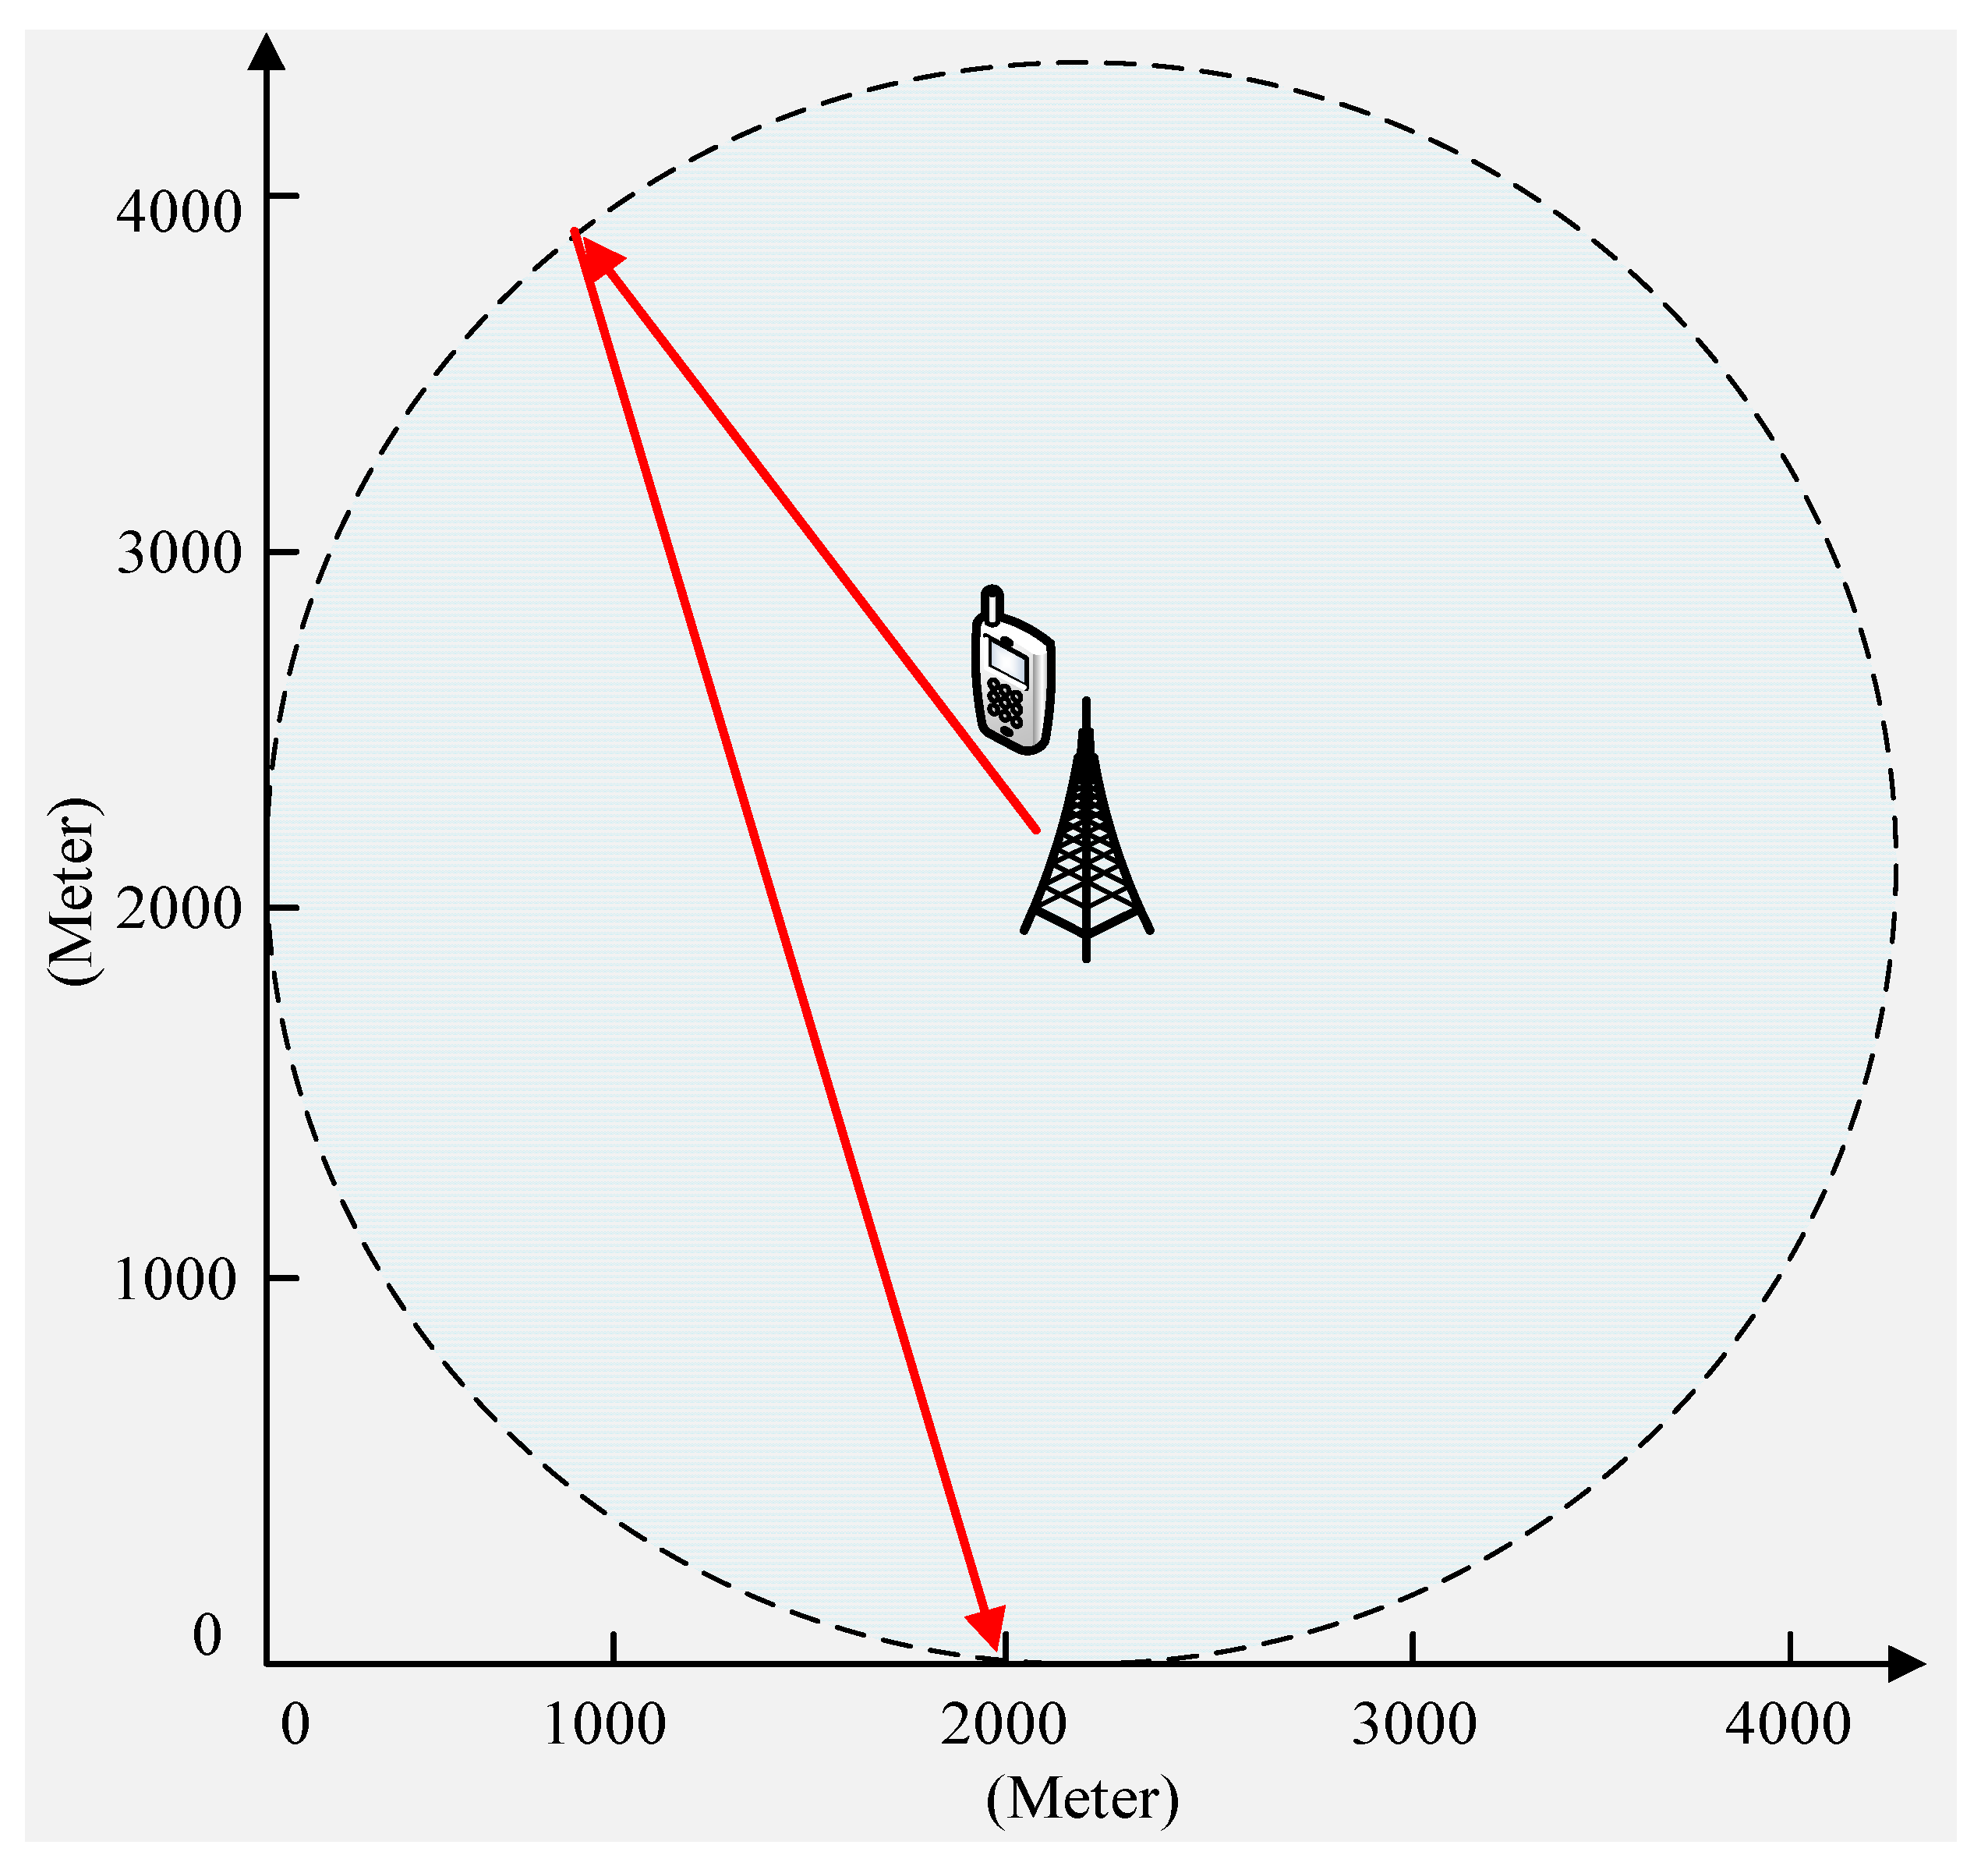
Applsci 12 04049 g004
Figure 5. Network topology.
Applsci 12 04049 g005
Figure 6. The relationship for packet loss rate and RSRP from UE.
Applsci 12 04049 g006
Figure 7. The relationship between MOS and RSRP for video conference service for UE.
Applsci 12 04049 g007
Figure 8. The UE movement path and RSRP are collected as the training dataset.
Applsci 12 04049 g008
Figure 9. The model loss of RSRP after 2 s of prediction: (a) MLP, (b) CNN, (c) RNN, (d) LSTM.
Applsci 12 04049 g009
Figure 10. The model loss of RSRP after 4 s of prediction: (a) MLP, (b) CNN, (c) RNN, (d) LSTM.
Applsci 12 04049 g010
Figure 11. The model loss of RSRP after 6 s of prediction: (a) MLP, (b) CNN, (c) RNN, (d) LSTM.
Applsci 12 04049 g011
Figure 12. The model loss of RSRP after 8 s of prediction: (a) MLP, (b) CNN, (c) RNN, (d) LSTM.
Applsci 12 04049 g012
Figure 13. The model loss of RSRP after 10 s of prediction: (a) MLP, (b) CNN, (c) RNN, (d) LSTM.
Applsci 12 04049 g013
Figure 14. Mobile moving path for deep learning model performance analysis.
Applsci 12 04049 g014
Figure 15. Predicted RSRP results for the next 2 s: (a) MLP, (b) CNN, (c) RNN, (d) LSTM.
Applsci 12 04049 g015aApplsci 12 04049 g015b
Figure 16. Predicted RSRP results for the next 4 s: (a) MLP, (b) CNN, (c) RNN, (d) LSTM.
Applsci 12 04049 g016aApplsci 12 04049 g016b
Figure 17. Predicted RSRP results for the next 6 s: (a) MLP, (b) CNN, (c) RNN, (d) LSTM.
Applsci 12 04049 g017aApplsci 12 04049 g017b
Figure 18. Predicted RSRP results for the next 8 s: (a) MLP, (b) CNN, (c) RNN, (d) LSTM.
Applsci 12 04049 g018
Figure 19. Predicted RSRP results for the next 10 s: (a) MLP, (b) CNN, (c) RNN, (d) LSTM.
Applsci 12 04049 g019
Figure 20. UE’s moving path for handover mechanism testing.
Applsci 12 04049 g020
Figure 21. The packet loss rates of three experimental results of the proposed deep-learning-based handover mechanism.
Applsci 12 04049 g021
Figure 22. The packet loss rates of three experimental results of the LTE event A3 handover mechanism.
Applsci 12 04049 g022
Figure 23. The confidence interval of packet loss rates of the three experimental results for the proposed deep-learning-based handover mechanism.
Applsci 12 04049 g023
Figure 24. The confidence interval of packet loss rates of three experimental results for the LTE event A3 handover mechanism.
Applsci 12 04049 g024
Figure 25. The MOS of three experimental results of the proposed deep-learning-based handover mechanism.
Applsci 12 04049 g025
Figure 26. The MOS of three experimental results of the LTE event A3 handover mechanism.
Applsci 12 04049 g026
Figure 27. The confidence interval of MOS of the three experimental results for the proposed deep-learning-based handover mechanism.
Applsci 12 04049 g027
Figure 28. The confidence interval of MOS of the three experimental results for the LTE event A3 handover mechanism.
Applsci 12 04049 g028
Table 1. The relationship between MOS and VoIP.
MOSQualityImpairment
5ExcellentImperceptible
4GoodPerceptible but not annoying
3FairSlightly annoying
2PoorAnnoying
1BadVery Annoying
Table 2. Skype video codec parameters.
Video resolution640 × 480, 320 ×240, 160 × 120
Frame rate per second5–30 fps
Video bitrate5–950 Kbps
Table 3. The relationship between downlink throughput and RSRP.
RSRP Range (dBm)Downlink Throughput (Kbps)
Q D L   =   5 % Q D L   =   1 Q D L   =   20 % Q D L   =   50 %
(−130, −125)5286.424957.904511.613413.85
(−125, −120)9965.038336.406276.863608.57
(−120, −115)19,379.1117,267.4414,352.469847.88
(−115, −110)31,757.0727,976.8223,088.0816,024.25
(−110, −105)45,420.3939,257.9231,975.0522,218.22
(−105, −100)57,578.1748,962.6039,552.4727,603.03
(−100, −95)59,869.9449,117.7238,543.6826,140.81
(−95, −90)69,091.7657,735.7446,309.8632,471.78
(−90, −85)69,119.6457,362.8145,757.7931,899.25
(−85, −80)73,730.6662,012.5550,166.7835,667.25
(−80, −75)81,108.9969,941.4758,038.2642,717.76
(−75, −70)84,024.2173,216.9461,404.4945,849.86
(−70, −65)84,040.7473,226.5161,409.5245,851.77
(−65, −60)88,638.7078,669.0667,211.1151,452.32
(−60, −55)94,461.8686,211.7575,755.5760,218.17
(−55, −50)101,295.2099,657.9594,443.5983,012.62
Table 4. The network parameters used in the simulation.
Band2.1 GHz
Channel Bandwidth15 MHz
Resource Block 75
eNB’s transport range4200 M
eNB’s txpower43 dBm
eNB’s antenna gain18 dB
UE’s txpower18 dBm
UE’s moving speed20 m/s
Table 5. The features for the training dataset.
Prediction TimeDataset FeaturesLabel
Prediction next 2 s of time tRSRP_t, RSRP_t + 1, RSRP_t + 2, RSRP_t + 3, RSRP_t + 4, RSRP_t + 5, RSRP_t + 6, RSRP_t + 7, RSRP_t- + 8, RSRP_t + 9, RSRP_t + 10RSRP_t + 2
Prediction next 4 s of time tRSRP_t + 4
Prediction next 6 s of time tRSRP_t + 6
Prediction next 8 s of time tRSRP_t + 8
Prediction next 10 s of time tRSRP_t + 10
Table 6. Deep learning model parameters.
ModelHidden LayerNeurons
MLP3 full connection layers128, 128, 64
CNN1 convolutional layer, 1 pooling layer, 1 full connection layers32, 16
RNN2 RNN layer64, 32
LSTM2 LSTM layer64, 32
Table 7. Deep learning training parameters.
ParameterValue
Epoch100
Batch size50
Activationrelu
Optimizeradam
Loss functionMSE
Table 8. RSRP prediction test results using MLP.
IntervalMSER-Squared
2 s0.8140.993
4 s2.1150.979
6 s3.5260.962
8 s4.9490.942
10 s5.6330.929
Table 9. RSRP prediction test results using CNN.
IntervalMSER-Squared
2 s0.6210.994
4 s0.9580.99
6 s1.5550.983
8 s1.8180.979
10 s2.7010.966
Table 10. RSRP prediction test results using RNN.
IntervalMSER-Squared
2 s0.1110.999
4 s0.4090.996
6 s0.9680.99
8 s1.2190.986
10 s1.2590.984
Table 11. RSRP prediction test results using LSTM.
IntervalMSER-Squared
2 s0.7150.993
4 s1.8960.981
6 s2.9020.969
8 s3.2030.963
10 s4.2540.946
Publisher’s Note: MDPI stays neutral with regard to jurisdictional claims in published maps and institutional affiliations.

