
Element Geochemical Characteristics and Provenance Conditions of the 1st Member of Jurassic Zhongjiangou Formation in Wudun Sag, Dunhuang Basin


Abstract
:1. Introduction
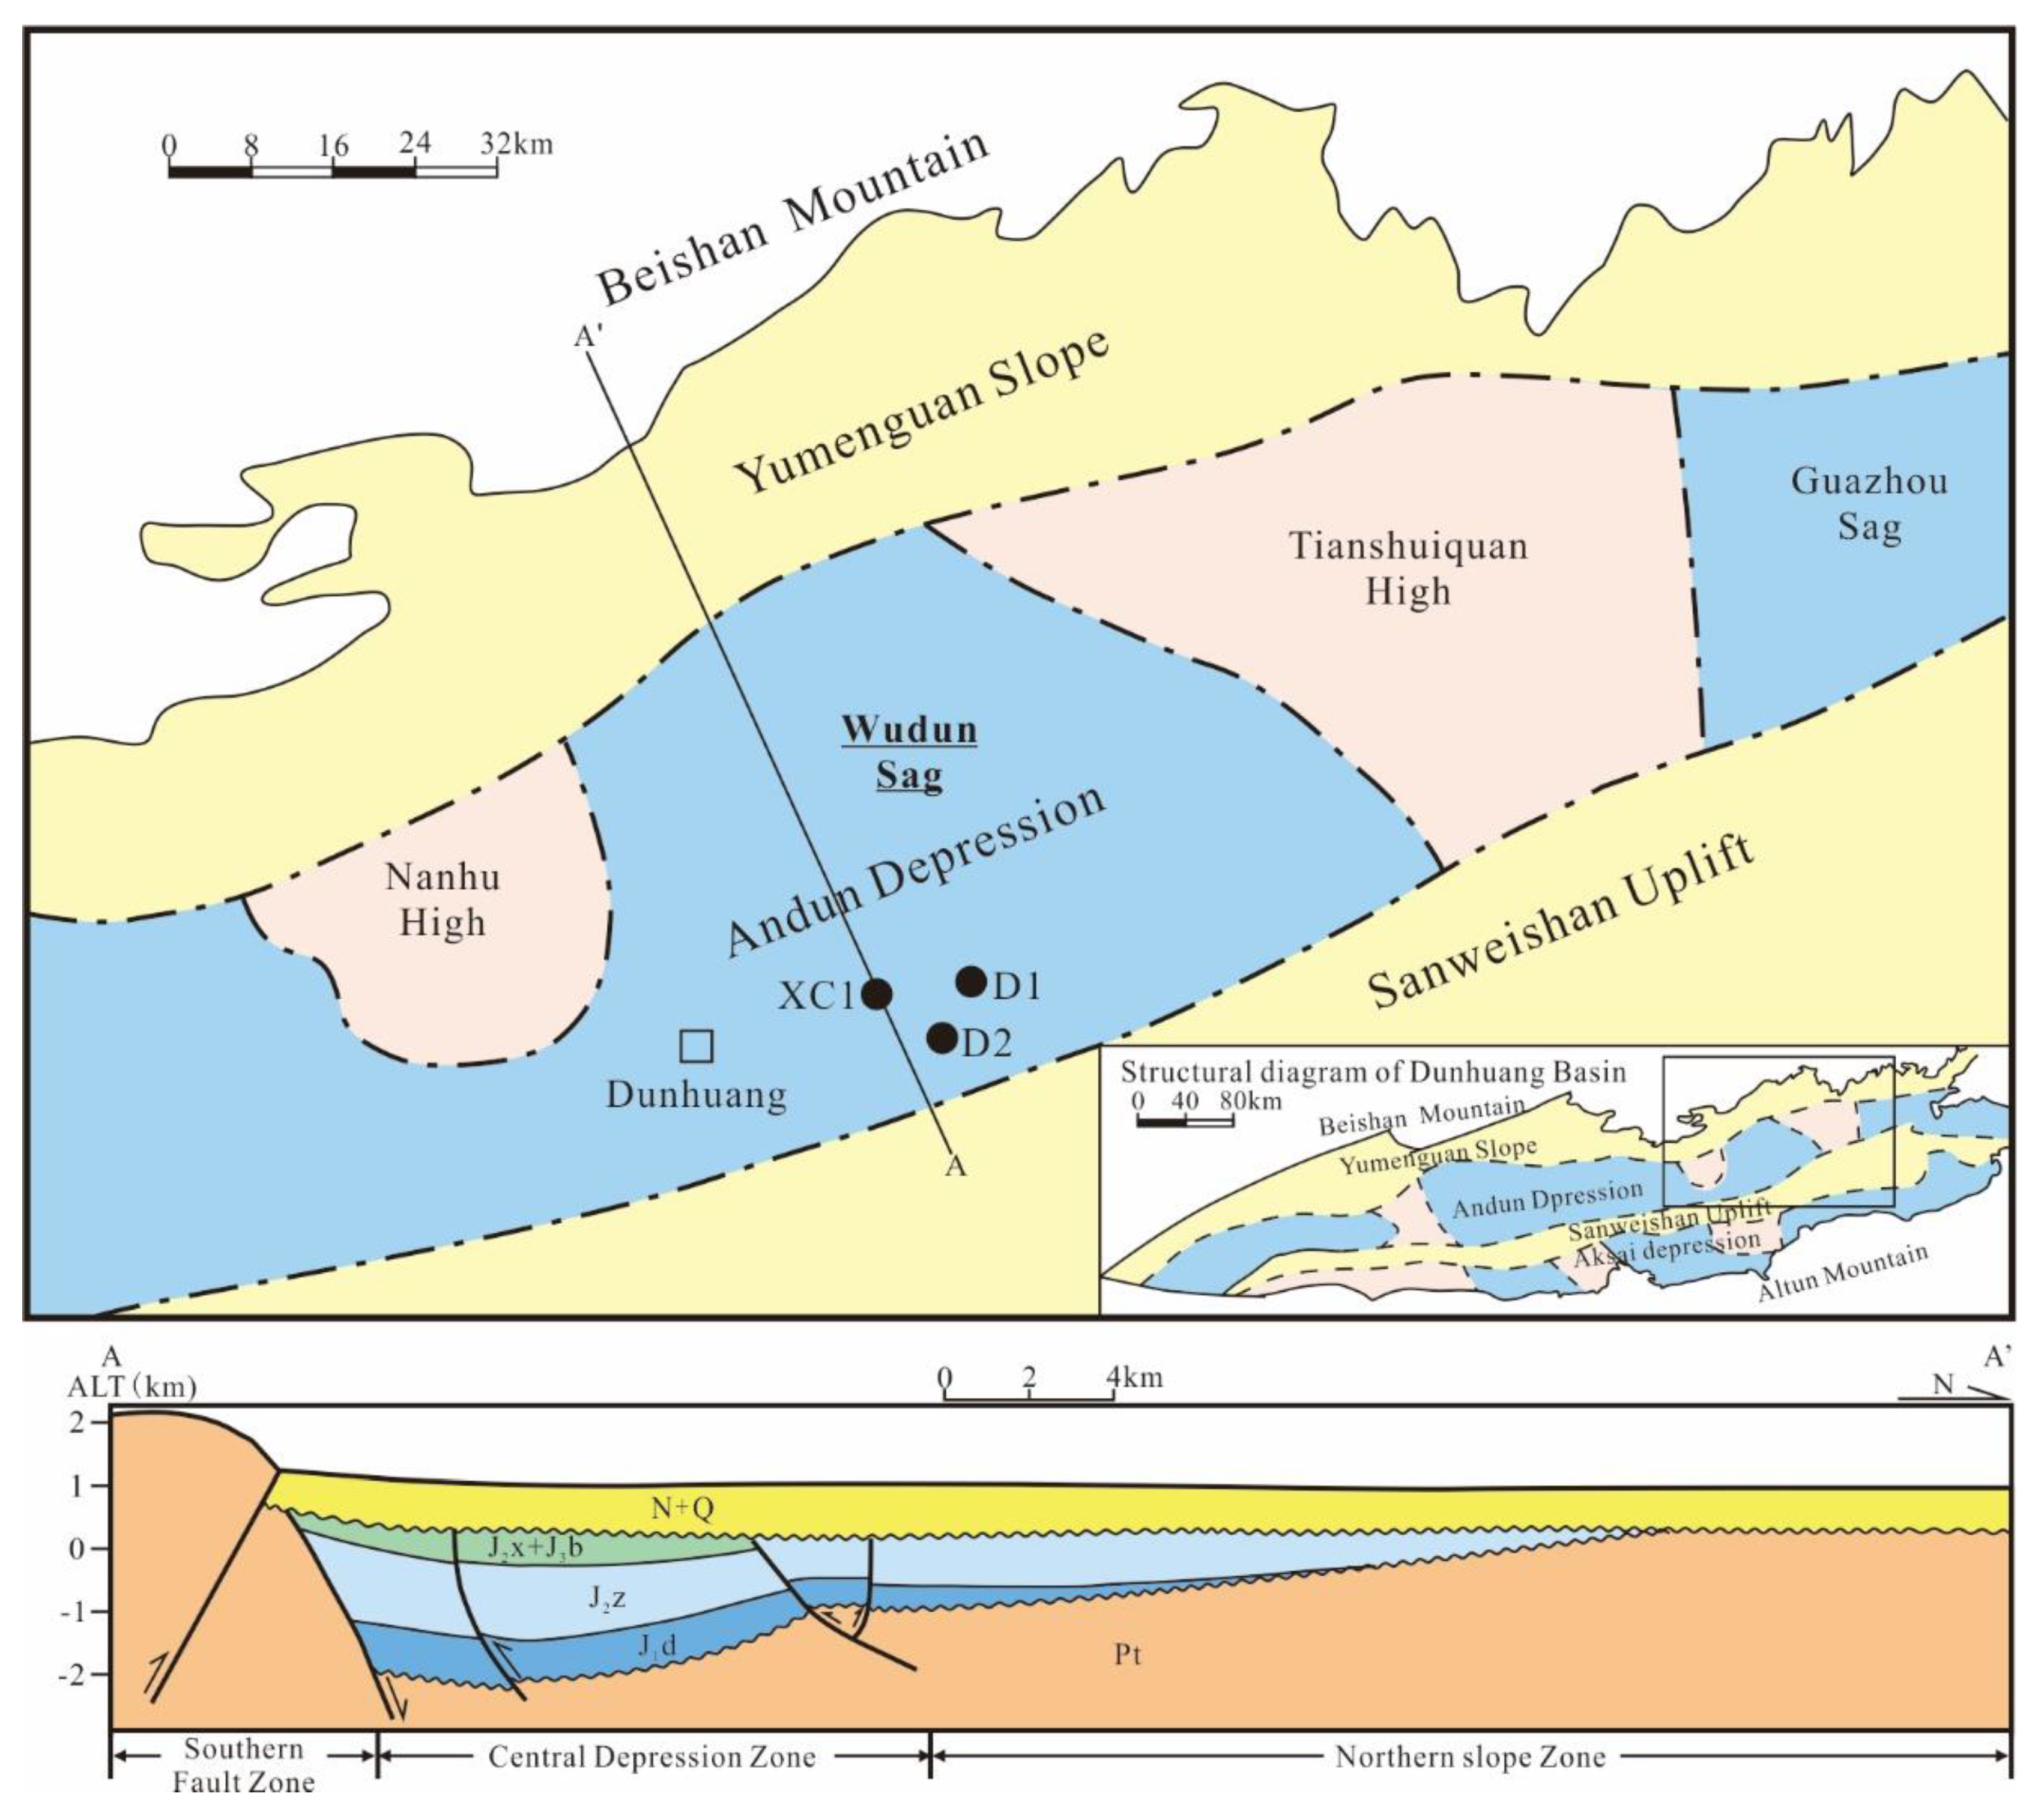
2. Geological Settings
3. Sample and Experimental Methods
4. Results
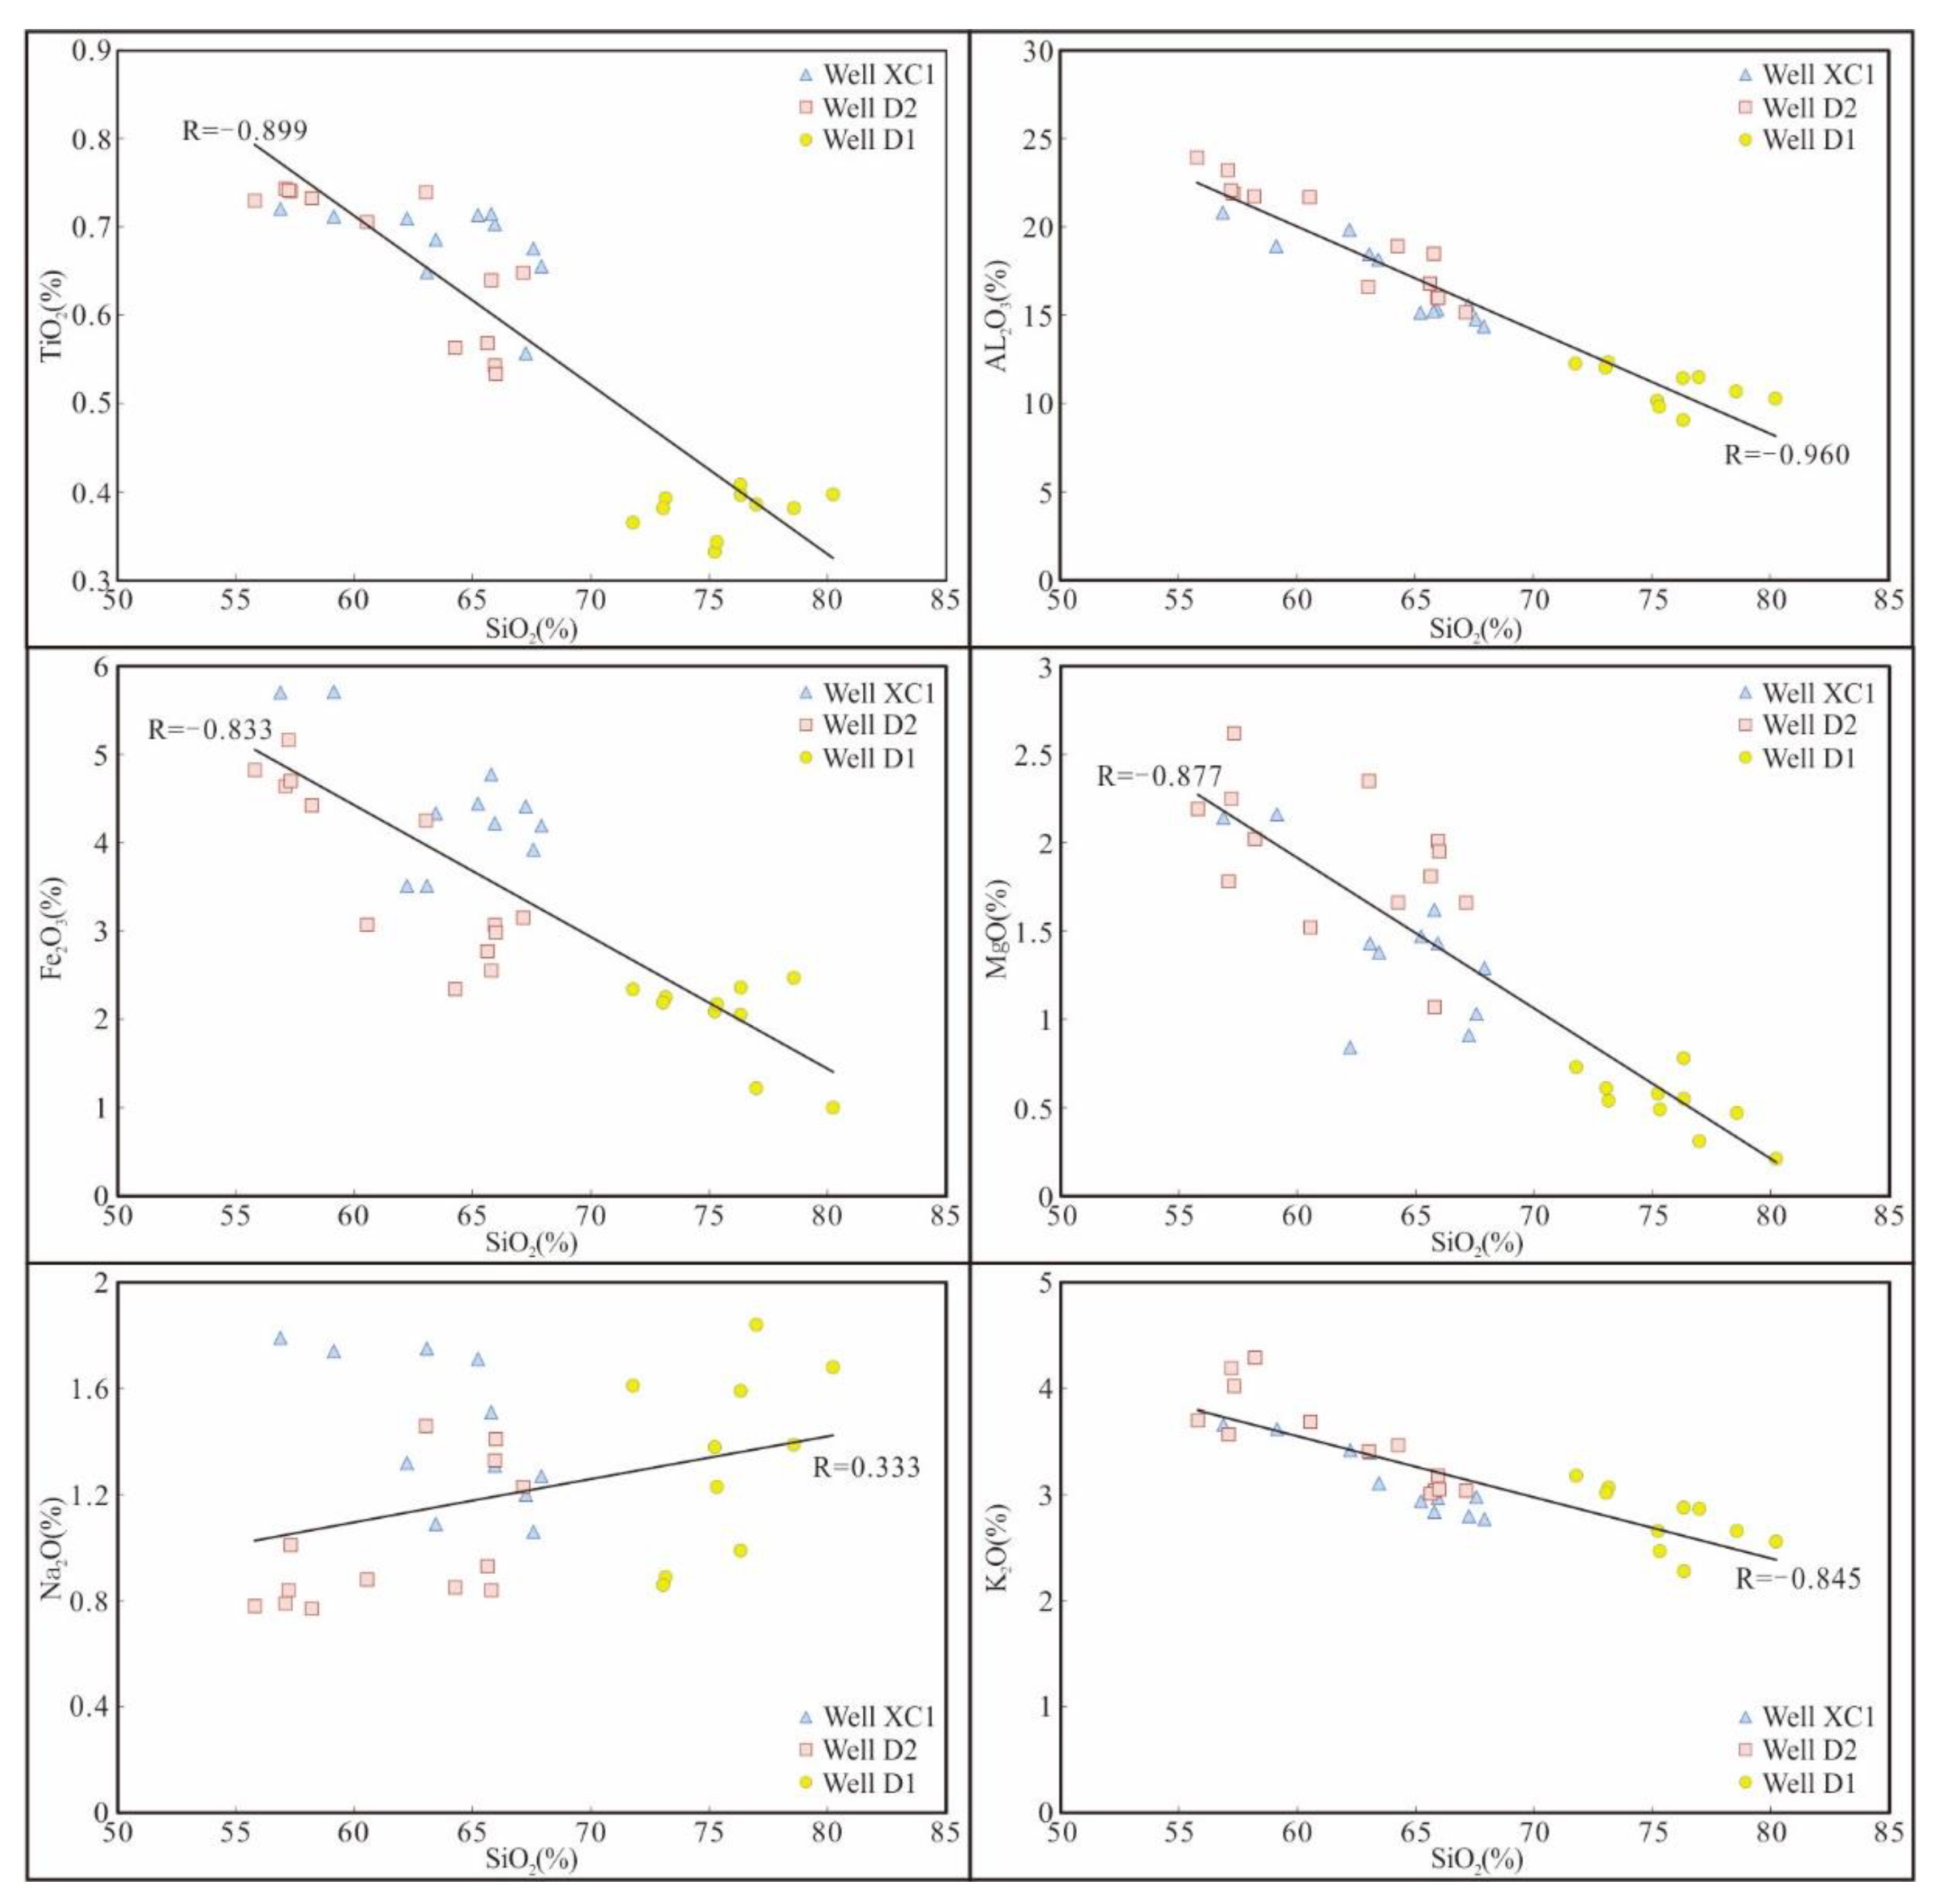
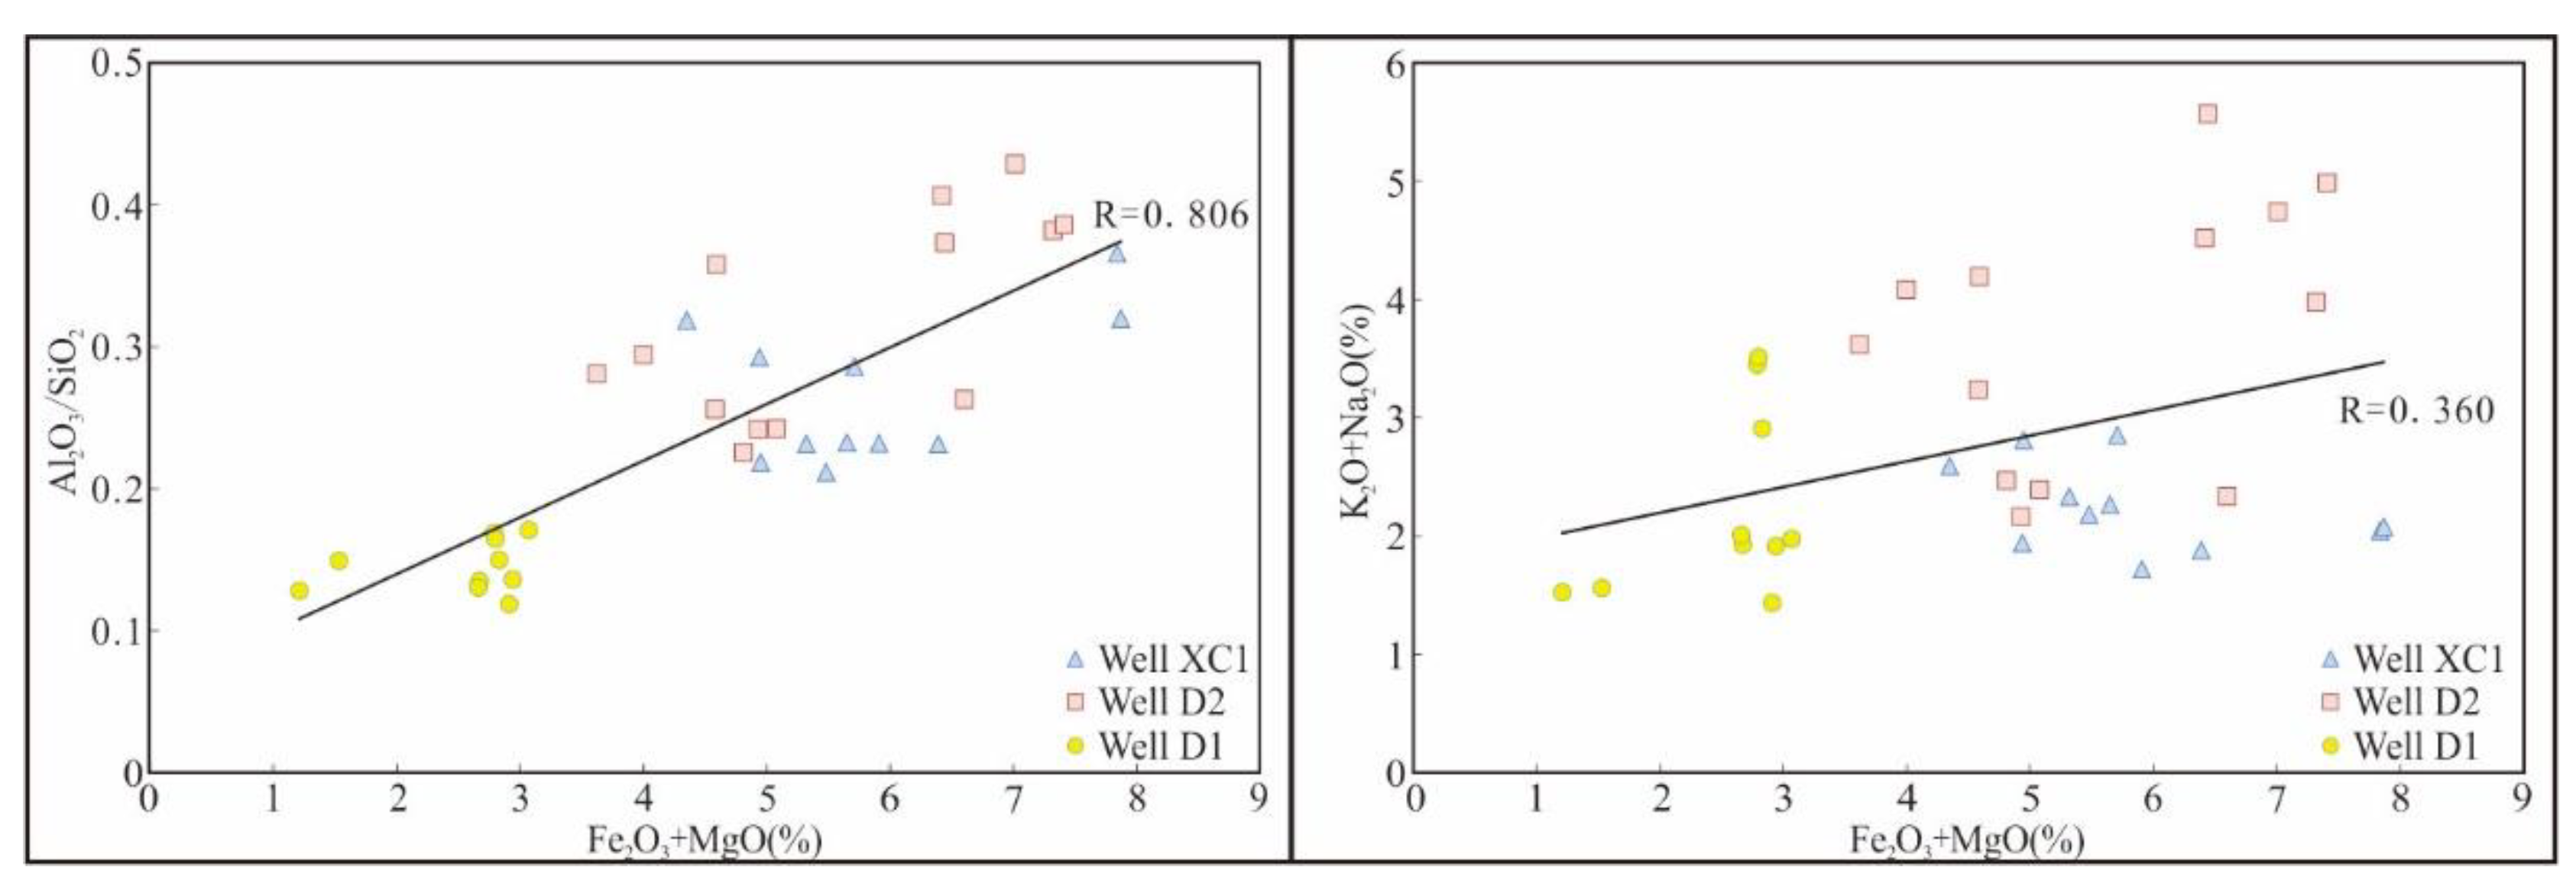
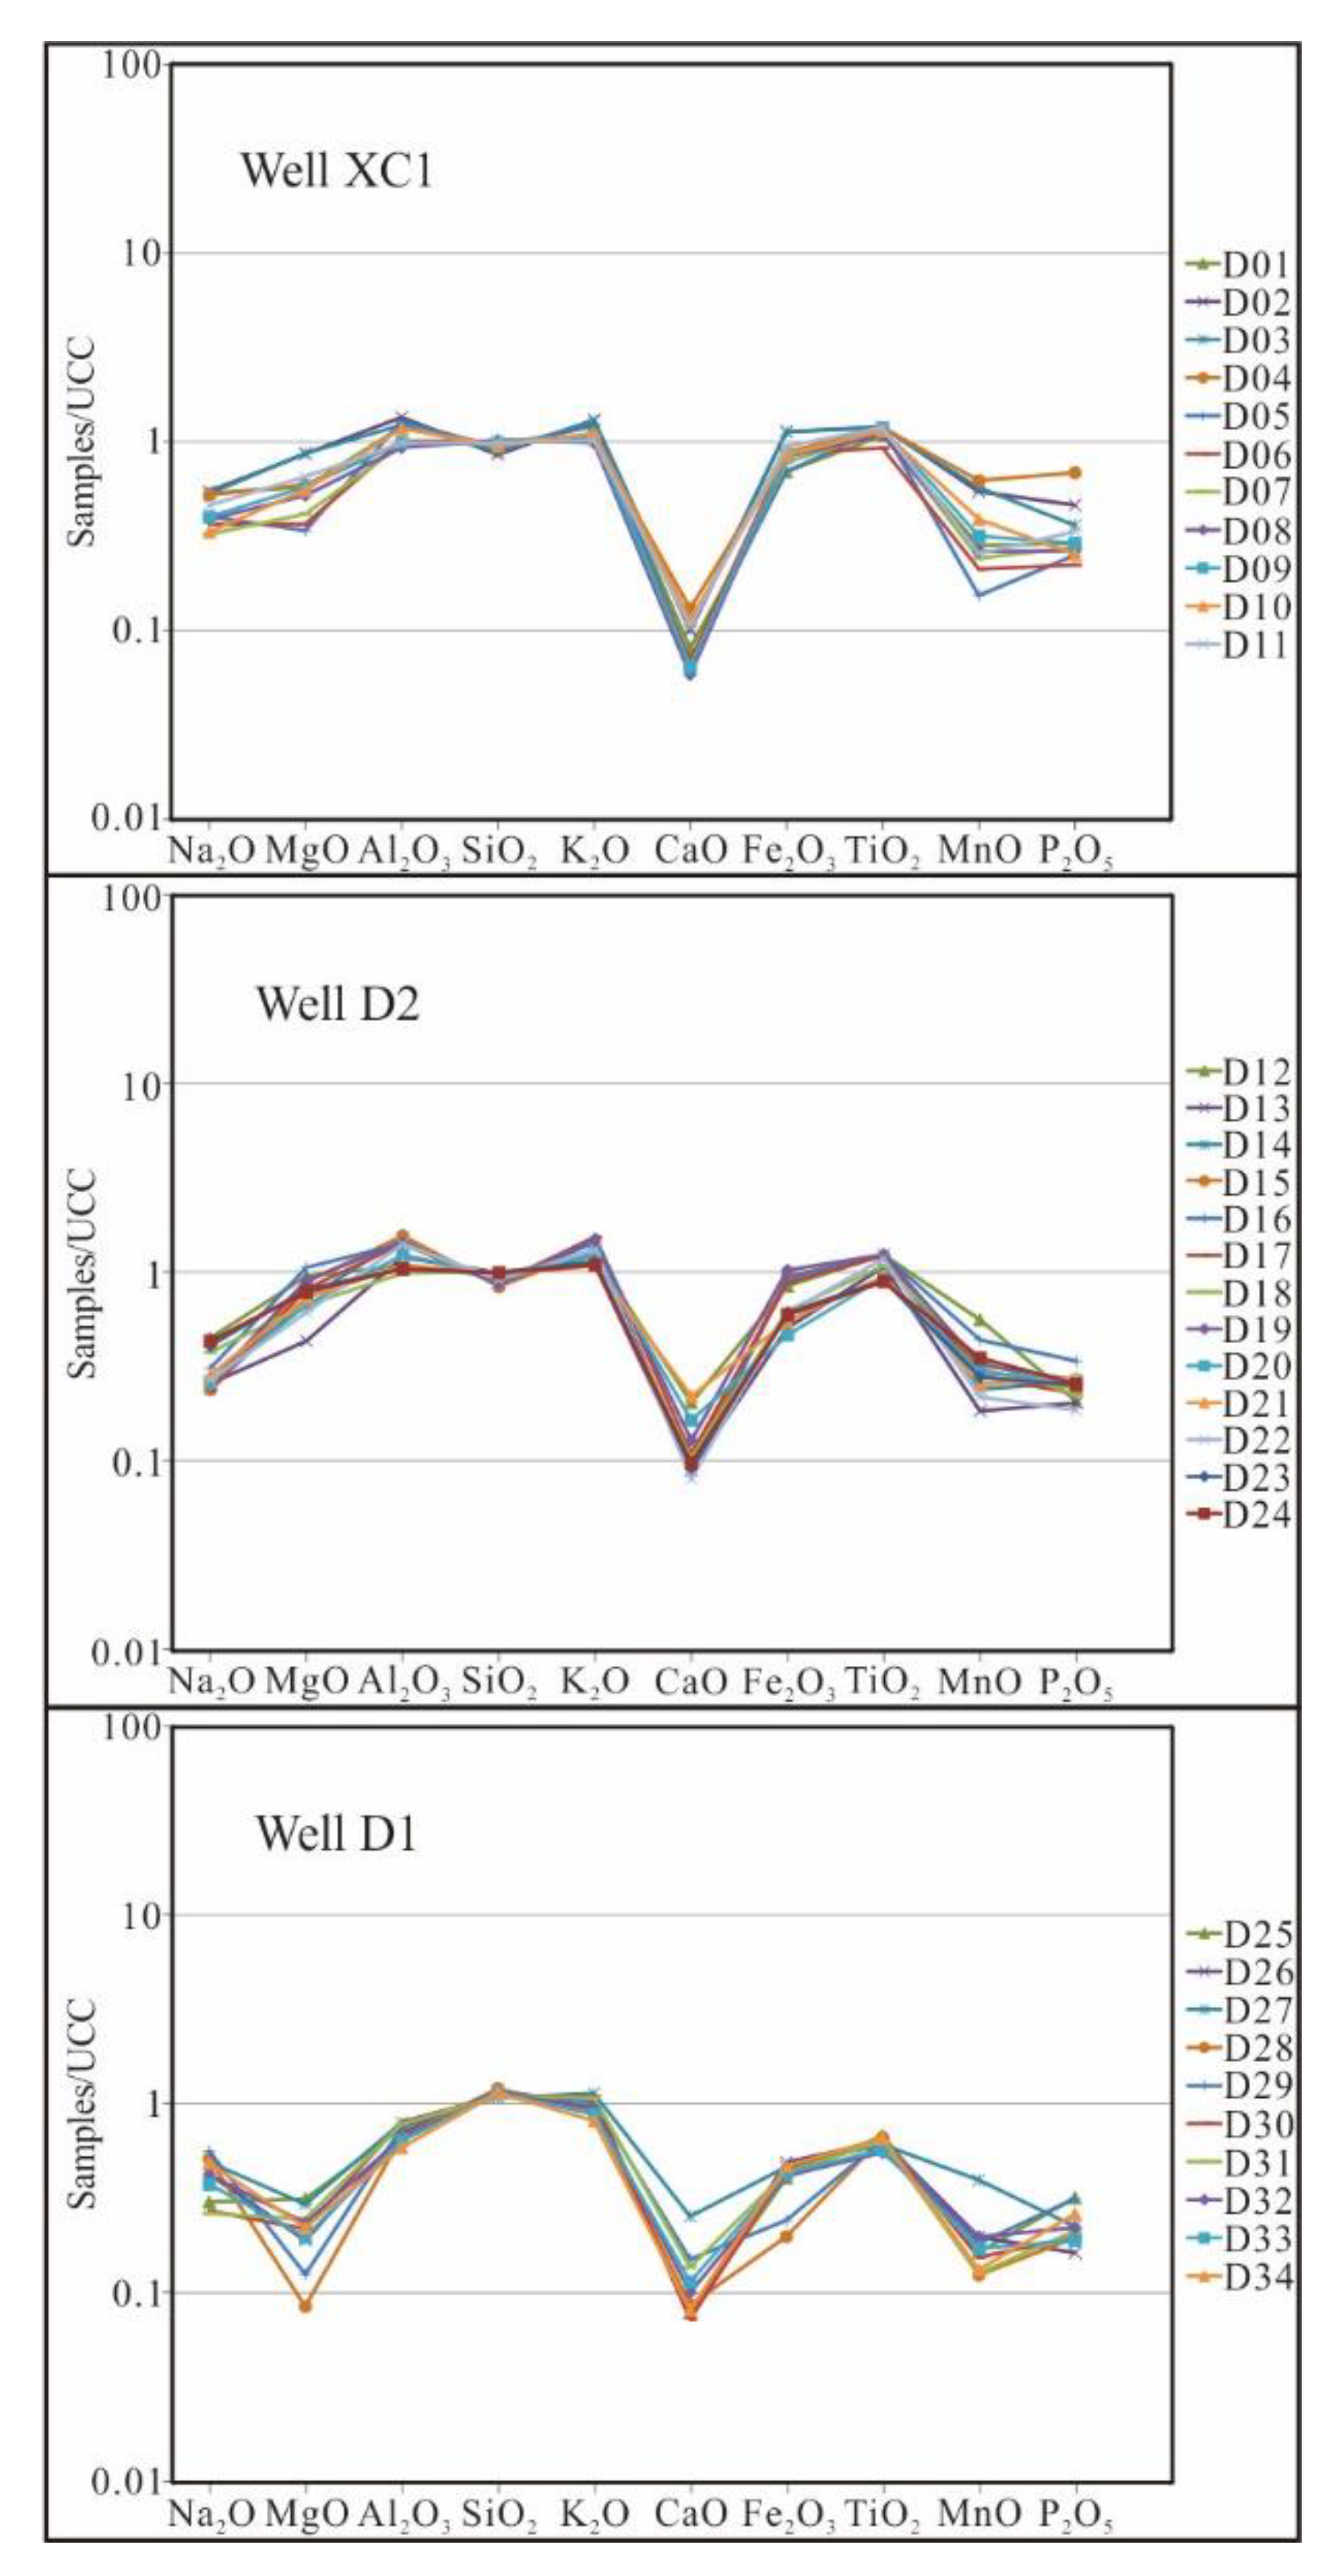
4.1. Characteristics of Major Element
4.1.1. Well XC1
4.1.2. Well D2
4.1.3. Well D1

| Sample Name | Well Name | Depth /m | Na2O /% | MgO /% | Al2O3 /% | SiO2 /% | K2O /% | CaO /% | Fe2O3 /% | TiO2 /% | MnO /% | P2O3 /% | (Fe2O3 + MgO) /% | SiO2/Al2O3 | K2O/Na2O | (CaO + Na2O) /% | CIA | ICV |
|---|---|---|---|---|---|---|---|---|---|---|---|---|---|---|---|---|---|---|
| D01 | XC1 | 2379.75 | 1.75 | 1.43 | 18.45 | 63.07 | 3.4 | 0.29 | 3.51 | 0.65 | 0.03 | 0.04 | 4.94 | 3.42 | 1.94 | 2.04 | 77.23 | 0.60 |
| D02 | XC1 | 2358.65 | 1.79 | 2.14 | 20.81 | 56.88 | 3.66 | 0.36 | 5.7 | 0.72 | 0.05 | 0.07 | 7.84 | 2.73 | 2.04 | 2.15 | 78.17 | 0.69 |
| D03 | XC1 | 2352.08 | 1.74 | 2.16 | 18.92 | 59.14 | 3.62 | 0.37 | 5.71 | 0.71 | 0.06 | 0.05 | 7.87 | 3.13 | 2.08 | 2.11 | 76.75 | 0.76 |
| D04 | XC1 | 2351.38 | 1.71 | 1.47 | 15.13 | 65.23 | 2.94 | 0.47 | 4.44 | 0.71 | 0.06 | 0.10 | 5.91 | 4.31 | 1.72 | 2.18 | 74.72 | 0.78 |
| D05 | XC1 | 2304.89 | 1.32 | 0.84 | 19.84 | 62.23 | 3.42 | 0.25 | 3.51 | 0.71 | 0.02 | 0.04 | 4.35 | 3.14 | 2.59 | 1.57 | 79.90 | 0.51 |
| D06 | XC1 | 2294.50 | 1.2 | 0.91 | 15.58 | 67.25 | 2.8 | 0.25 | 4.41 | 0.56 | 0.02 | 0.03 | 5.32 | 4.32 | 2.33 | 1.45 | 78.57 | 0.65 |
| D07 | XC1 | 2293.24 | 1.06 | 1.03 | 14.78 | 67.57 | 2.98 | 0.23 | 3.92 | 0.68 | 0.02 | 0.04 | 4.95 | 4.57 | 2.81 | 1.29 | 77.59 | 0.67 |
| D08 | XC1 | 2289.95 | 1.27 | 1.29 | 14.36 | 67.91 | 2.77 | 0.21 | 4.19 | 0.66 | 0.03 | 0.04 | 5.48 | 4.73 | 2.18 | 1.48 | 77.16 | 0.73 |
| D09 | XC1 | 2288.25 | 1.31 | 1.43 | 15.33 | 65.94 | 2.97 | 0.23 | 4.22 | 0.70 | 0.03 | 0.04 | 5.65 | 4.30 | 2.27 | 1.54 | 77.27 | 0.71 |
| D10 | XC1 | 2286.11 | 1.09 | 1.38 | 18.15 | 63.45 | 3.11 | 0.41 | 4.33 | 0.69 | 0.04 | 0.04 | 5.71 | 3.50 | 2.85 | 1.50 | 79.75 | 0.61 |
| D11 | XC1 | 2283.45 | 1.51 | 1.62 | 15.23 | 65.79 | 2.84 | 0.38 | 4.77 | 0.71 | 0.03 | 0.05 | 6.39 | 4.32 | 1.88 | 1.89 | 76.30 | 0.78 |
| D12 | D2 | 2282.50 | 1.46 | 2.35 | 16.58 | 63.03 | 3.41 | 0.73 | 4.25 | 0.74 | 0.06 | 0.03 | 6.60 | 3.80 | 2.34 | 2.19 | 74.75 | 0.78 |
| D13 | D2 | 2282.15 | 0.84 | 1.07 | 18.48 | 65.8 | 3.04 | 0.32 | 2.55 | 0.64 | 0.02 | 0.03 | 3.62 | 3.56 | 3.62 | 1.16 | 81.48 | 0.46 |
| D14 | D2 | 2281.80 | 0.79 | 1.78 | 23.21 | 57.1 | 3.57 | 0.34 | 4.64 | 0.74 | 0.02 | 0.04 | 6.42 | 2.46 | 4.52 | 1.13 | 83.16 | 0.51 |
| D15 | D2 | 2281.45 | 0.78 | 2.19 | 23.93 | 55.8 | 3.7 | 0.34 | 4.82 | 0.73 | 0.03 | 0.04 | 7.01 | 2.33 | 4.74 | 1.12 | 83.23 | 0.53 |
| D16 | D2 | 2280.60 | 1.01 | 2.62 | 21.88 | 57.32 | 4.02 | 0.30 | 4.70 | 0.74 | 0.04 | 0.05 | 7.32 | 2.62 | 3.98 | 1.31 | 80.41 | 0.61 |
| D17 | D2 | 2280.00 | 0.77 | 2.02 | 21.72 | 58.21 | 4.29 | 0.39 | 4.42 | 0.73 | 0.03 | 0.03 | 6.44 | 2.68 | 5.57 | 1.16 | 79.94 | 0.58 |
| D18 | D2 | 2279.50 | 1.23 | 1.66 | 15.15 | 67.13 | 3.04 | 0.37 | 3.15 | 0.65 | 0.03 | 0.03 | 4.81 | 4.43 | 2.47 | 1.60 | 76.55 | 0.67 |
| D19 | D2 | 2279.00 | 0.84 | 2.25 | 22.08 | 57.22 | 4.19 | 0.46 | 5.16 | 0.74 | 0.03 | 0.04 | 7.41 | 2.59 | 4.99 | 1.30 | 80.09 | 0.62 |
| D20 | D2 | 2278.40 | 0.85 | 1.66 | 18.92 | 64.26 | 3.47 | 0.59 | 2.34 | 0.56 | 0.03 | 0.04 | 4.00 | 3.40 | 4.08 | 1.44 | 79.40 | 0.50 |
| D21 | D2 | 2277.75 | 0.93 | 1.81 | 16.79 | 65.63 | 3.01 | 0.79 | 2.77 | 0.57 | 0.03 | 0.04 | 4.58 | 3.91 | 3.24 | 1.72 | 78.02 | 0.59 |
| D22 | D2 | 2277.30 | 0.88 | 1.52 | 21.67 | 60.55 | 3.69 | 0.29 | 3.07 | 0.71 | 0.02 | 0.03 | 4.59 | 2.79 | 4.19 | 1.17 | 81.68 | 0.47 |
| D23 | D2 | 2277.15 | 1.33 | 2.01 | 15.99 | 65.95 | 3.18 | 0.33 | 3.07 | 0.54 | 0.03 | 0.04 | 5.08 | 4.12 | 2.39 | 1.66 | 76.76 | 0.66 |
| D24 | D2 | 2275.70 | 1.41 | 1.95 | 15.98 | 65.99 | 3.05 | 0.35 | 2.98 | 0.53 | 0.04 | 0.04 | 4.93 | 4.13 | 2.16 | 1.76 | 76.86 | 0.65 |
| D25 | D1 | 1932.40 | 0.99 | 0.78 | 11.44 | 76.32 | 2.88 | 0.28 | 2.05 | 0.41 | 0.02 | 0.05 | 2.83 | 6.67 | 2.91 | 1.27 | 73.38 | 0.65 |
| D26 | D1 | 1932.00 | 1.39 | 0.47 | 10.69 | 78.57 | 2.66 | 0.28 | 2.47 | 0.38 | 0.02 | 0.02 | 2.94 | 7.35 | 1.91 | 1.67 | 71.17 | 0.72 |
| D27 | D1 | 1927.00 | 1.61 | 0.73 | 12.26 | 71.78 | 3.18 | 0.91 | 2.34 | 0.37 | 0.04 | 0.03 | 3.07 | 5.85 | 1.98 | 2.52 | 68.26 | 0.75 |
| D28 | D1 | 1923.70 | 1.68 | 0.21 | 10.28 | 80.23 | 2.56 | 0.31 | 1.00 | 0.40 | 0.01 | 0.03 | 1.21 | 7.80 | 1.52 | 1.99 | 69.32 | 0.60 |
| D29 | D1 | 1922.20 | 1.84 | 0.31 | 11.49 | 76.99 | 2.87 | 0.54 | 1.22 | 0.39 | 0.02 | 0.05 | 1.53 | 6.7 | 1.56 | 2.38 | 68.64 | 0.63 |
| D30 | D1 | 1921.60 | 0.89 | 0.54 | 12.35 | 73.15 | 3.07 | 0.26 | 2.25 | 0.39 | 0.02 | 0.03 | 2.79 | 5.92 | 3.45 | 1.15 | 74.53 | 0.6 |
| D31 | D1 | 1919.22 | 0.86 | 0.61 | 12.03 | 73.05 | 3.02 | 0.49 | 2.19 | 0.38 | 0.01 | 0.03 | 2.80 | 6.07 | 3.51 | 1.35 | 73.35 | 0.63 |
| D32 | D1 | 1918.95 | 1.38 | 0.58 | 10.16 | 75.23 | 2.66 | 0.36 | 2.09 | 0.33 | 0.02 | 0.03 | 2.67 | 7.40 | 1.93 | 1.74 | 69.78 | 0.73 |
| D33 | D1 | 1918.35 | 1.23 | 0.49 | 9.82 | 75.32 | 2.47 | 0.41 | 2.17 | 0.34 | 0.02 | 0.03 | 2.66 | 7.67 | 2.01 | 1.64 | 70.50 | 0.73 |
| D34 | D1 | 1917.20 | 1.59 | 0.55 | 9.06 | 76.33 | 2.28 | 0.29 | 2.36 | 0.40 | 0.01 | 0.04 | 2.91 | 8.42 | 1.43 | 1.88 | 68.53 | 0.83 |
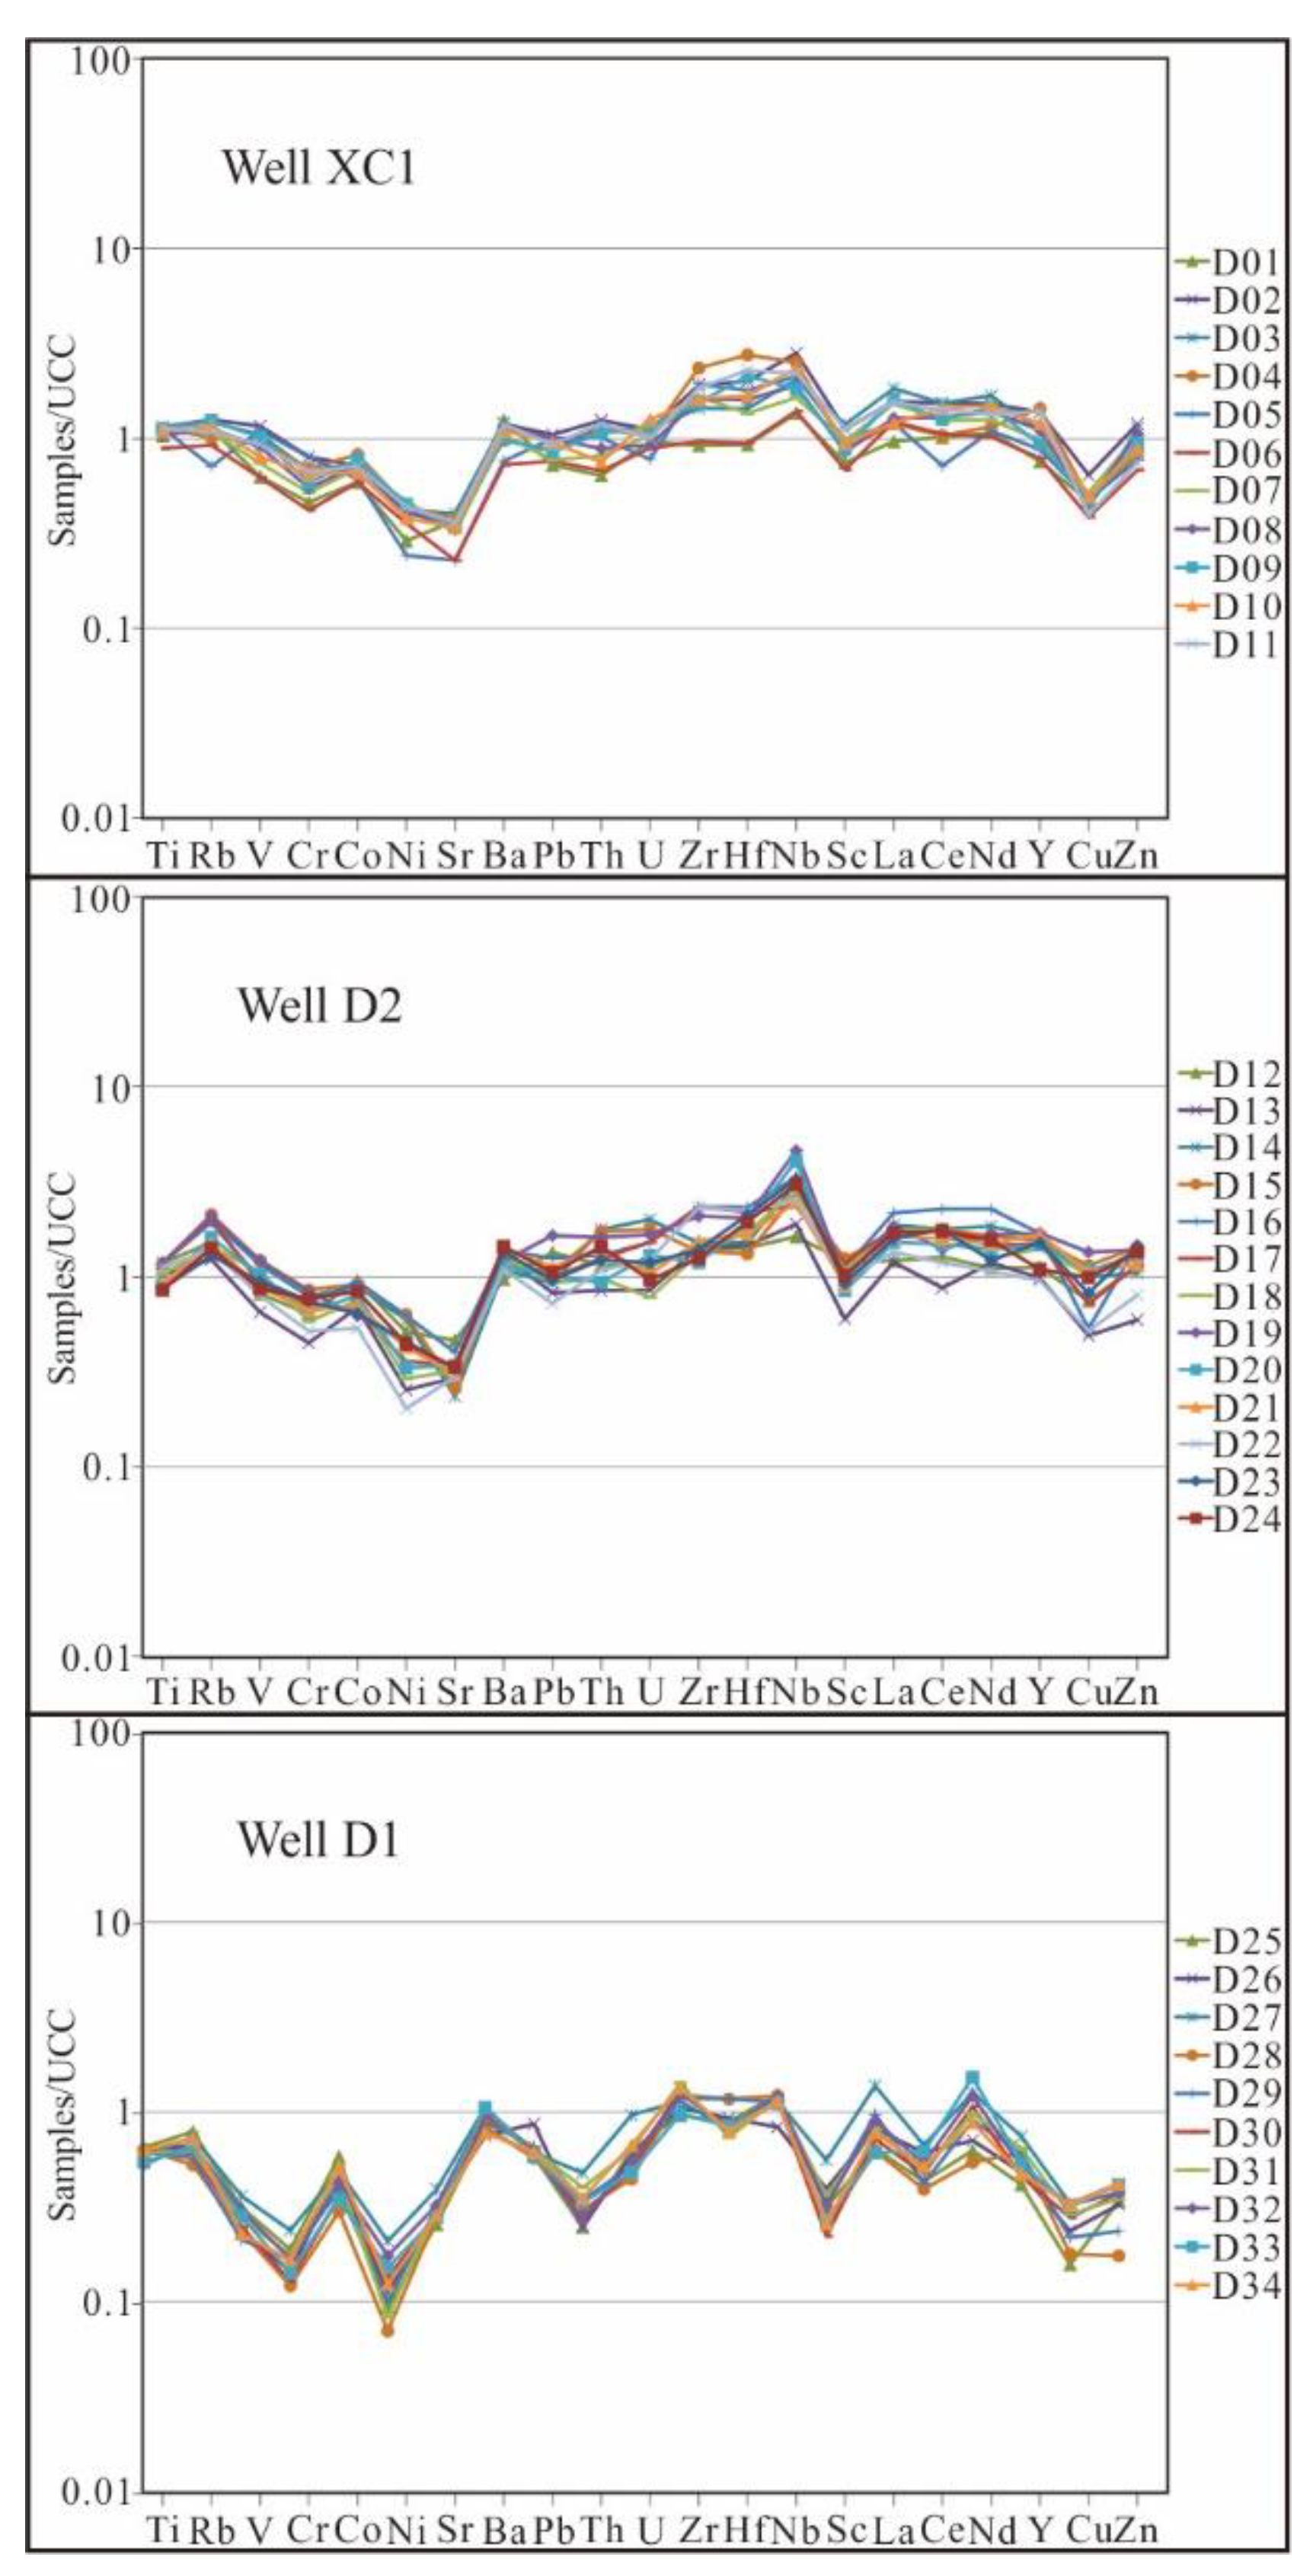
4.2. Characteristics of Trace Elements
4.2.1. Well XC1
4.2.2. Well D2
4.2.3. Well D1
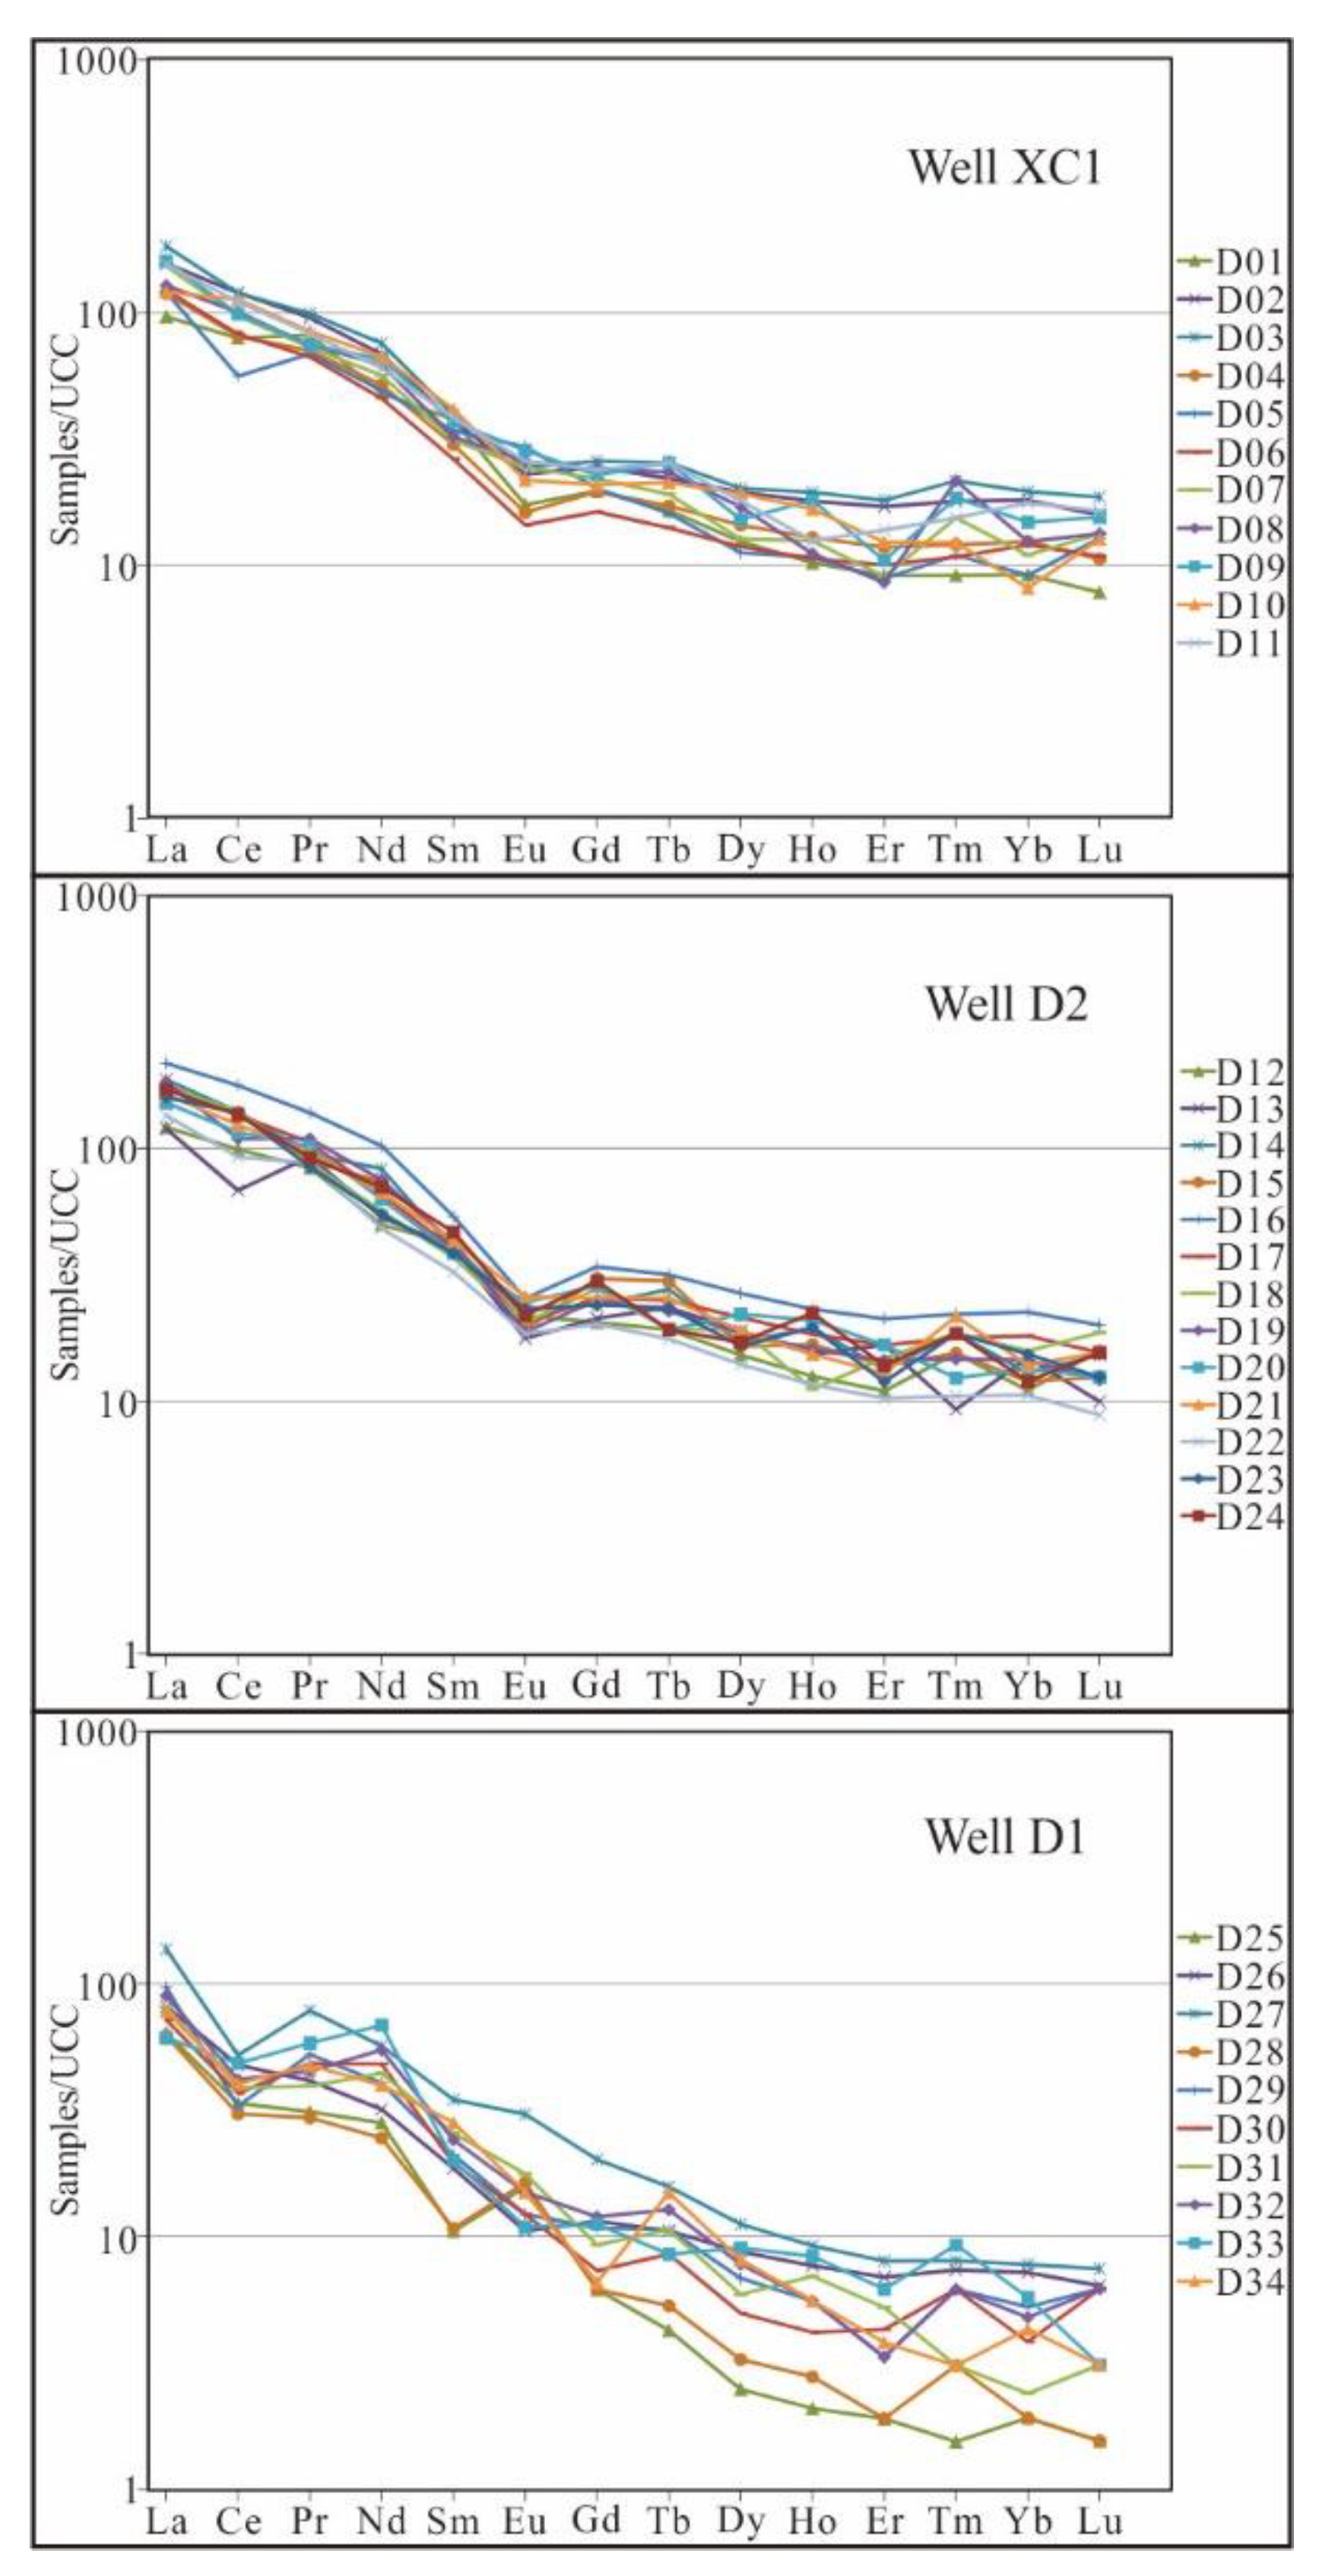
4.3. Characteristics of Rare Earth Elements
5. Discussions
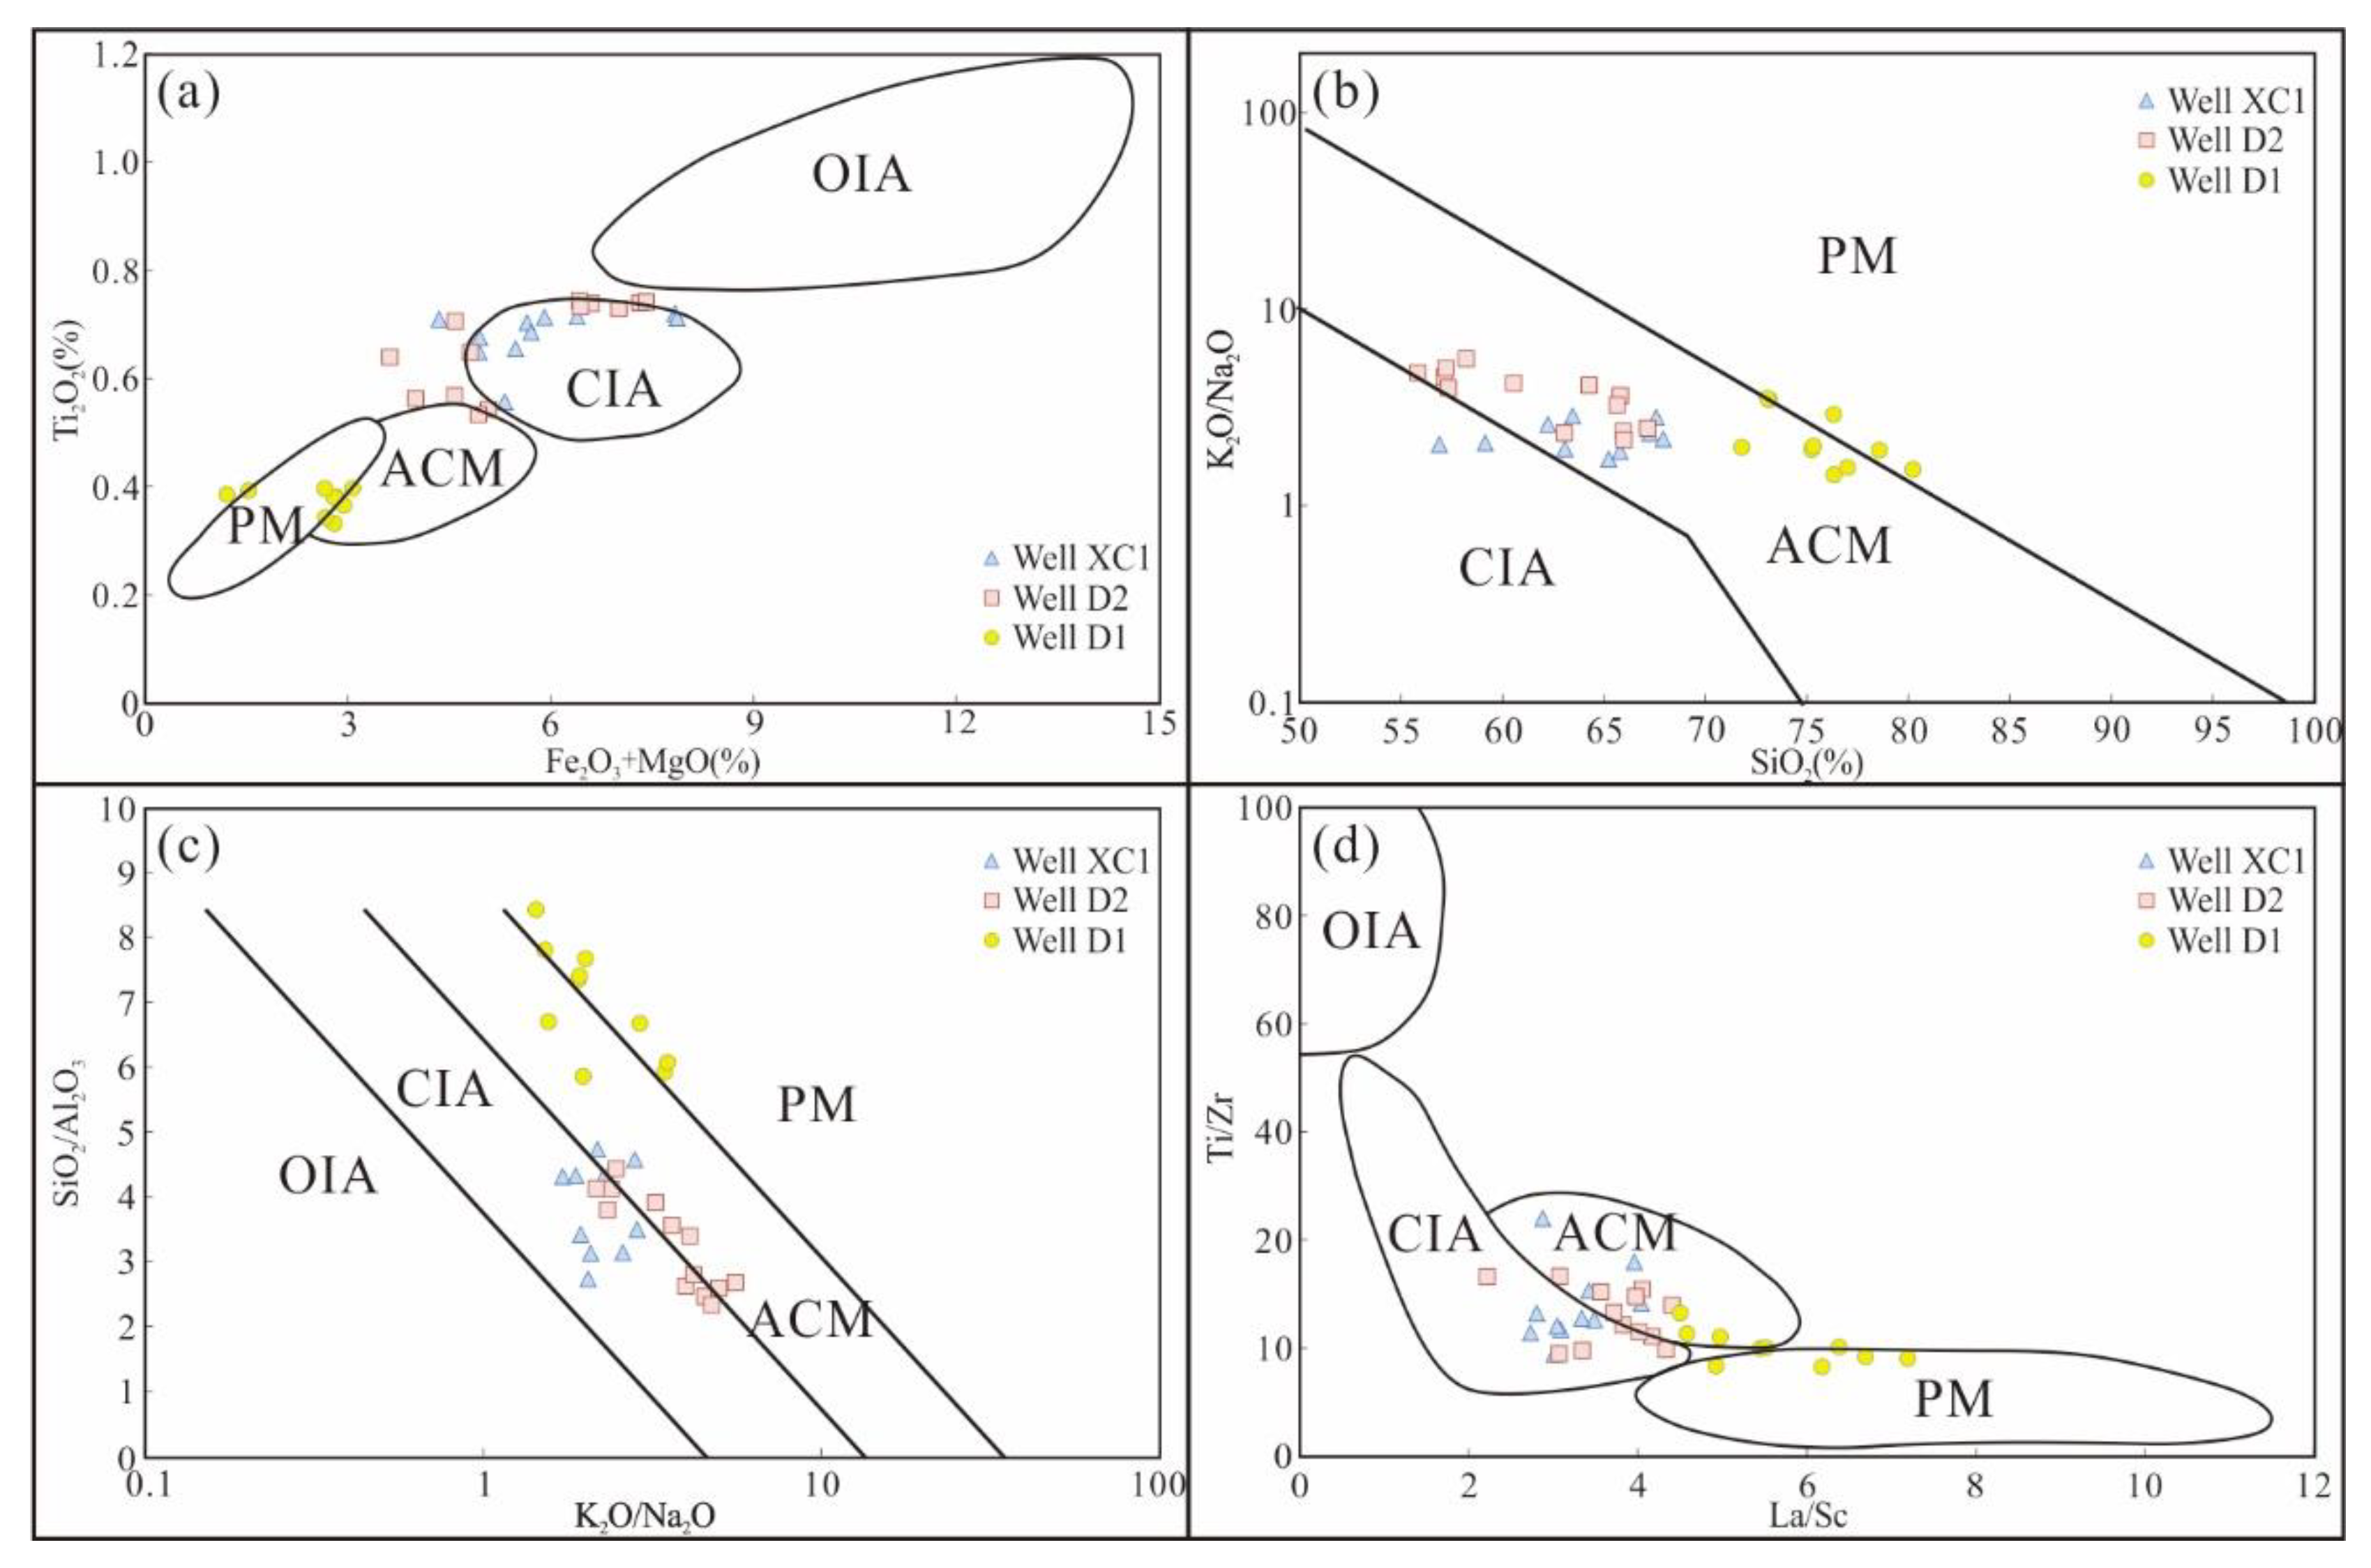
5.1. Analysis of Tectonic Background in Provenance Area
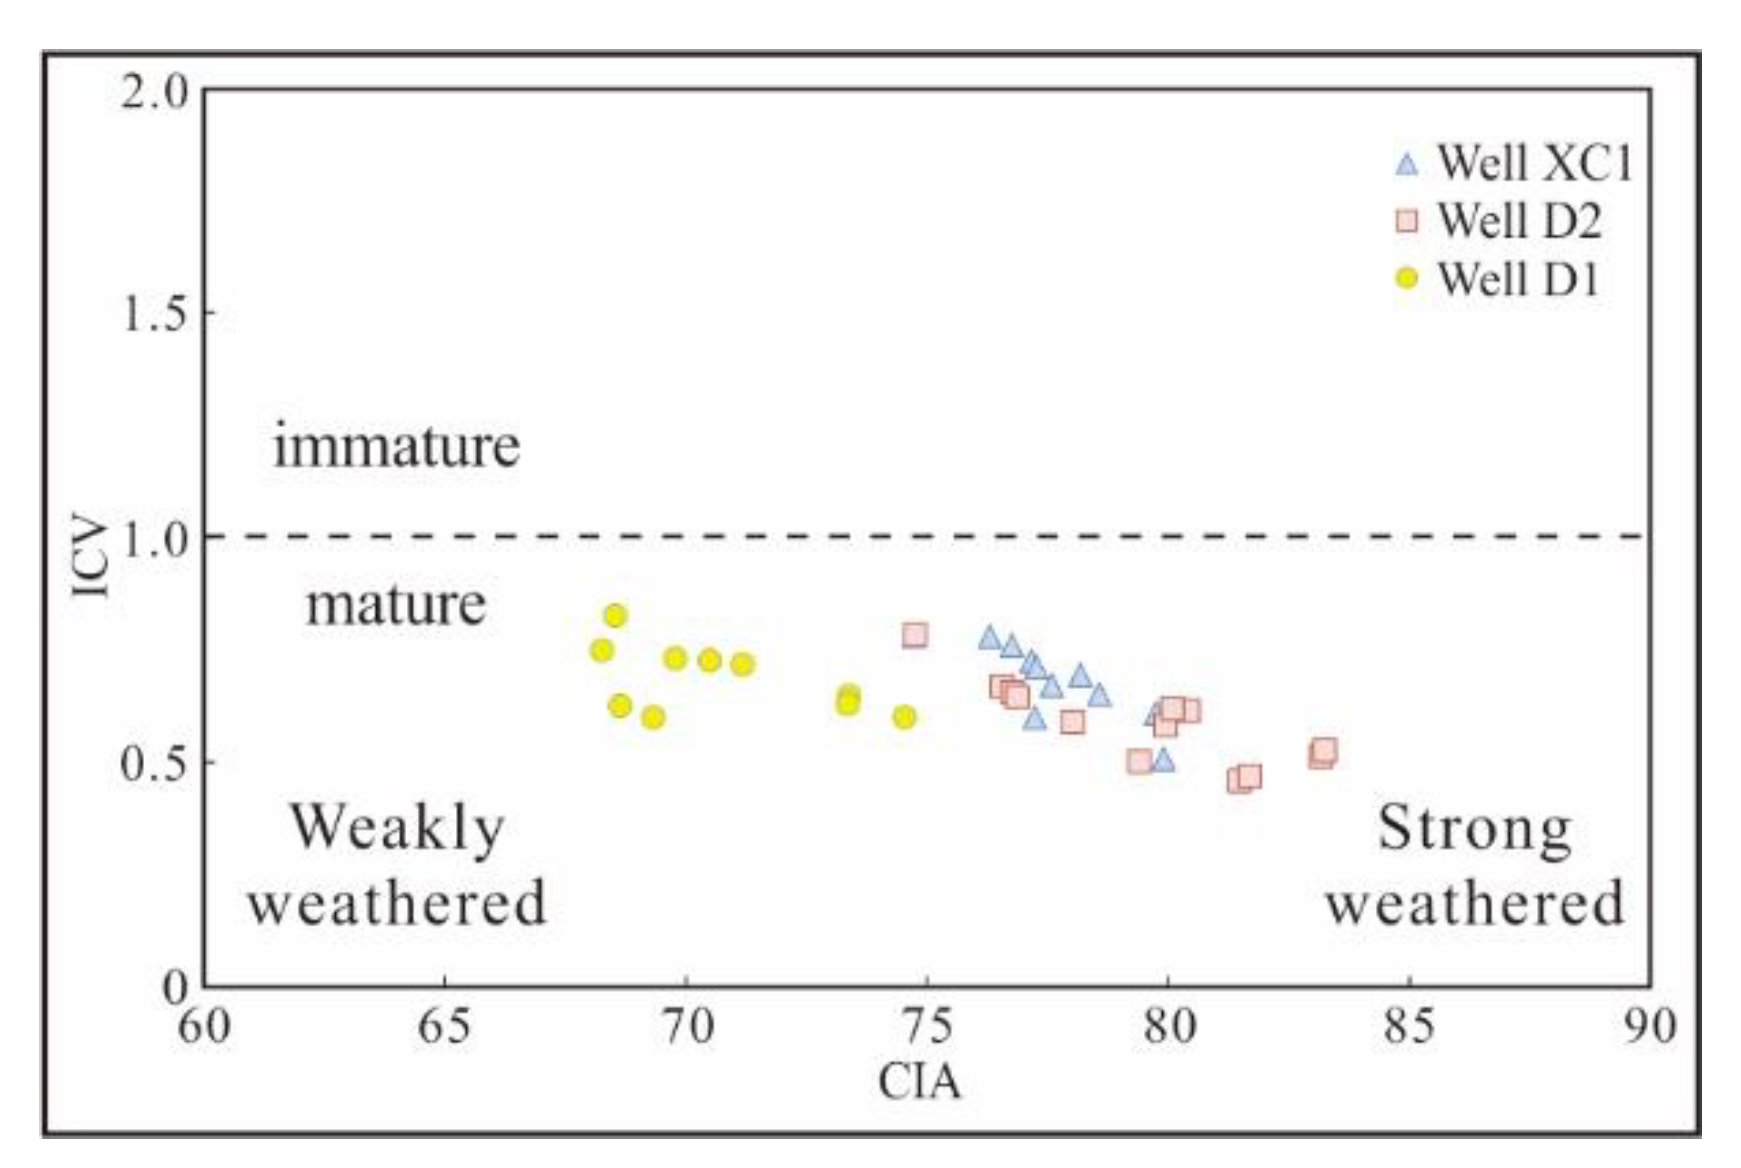
5.2. Weathering and Sedimentary Characteristics in Provenance Area
6. Conclusions
Author Contributions
Funding
Institutional Review Board Statement
Informed Consent Statement
Data Availability Statement
Acknowledgments
Conflicts of Interest
References
- Dong, Y.Y. Research on the Uplift Age of Sanwei Mountain and Accumulation Models of Well XC1 in the Dunhuang Basin. Master’s Dissertation, Xi’an Shiyou University, Xi’an, China, 2017. [Google Scholar]
- Zhang, X.C.; Li, J.G.; Liu, Q.W. Geological Conditions of Tight Oil Reservoirs in Wudun Sag of Dunhuang Basin, Gansu, China. J. Earth Sci. Environ. 2017, 39, 248–254. [Google Scholar]
- Zhang, M.; Cao, L.W. The Characteristics of lower Jurassic source system and its sedimentary evolution in Wudun sag. J. Yangtze Univ. 2017, 14, 8–12, 23, 115. [Google Scholar]
- Wei, M.P. The Sedimentary System and Distribution of Jurassic in Wudun Sag of Dunhuang Basin. Master’s Dissertation, China University of Petroleum, Beijing, China, 2017. [Google Scholar]
- Qu, L.H.; Liu, X.F.; Zhao, F.; Zhou, X.Y.; Li, J.S. Geochemical Characteristics of the Sandstones from Triassic Kannan Formation in North Qiangtang Basin(Tibet): Implication for Provenance and Tectonic Setting. Northwestern Geol. 2018, 51, 97–113. [Google Scholar]
- Wanas, H.A.; Abdel-Maguid, N.M. Petrography and geochemistry of the Cambro Ordovician Wajid Sandstone, southwest Saudi Arabia: Implications for provenance and tectonic setting. J. Asian Earth Sci. 2006, 27, 416–429. [Google Scholar] [CrossRef]
- Sallam, E.S.; Wanas, H.A. Petrography and geochemistry of the Jurassic siliciclastic rocks in the Khashm El-Galala area (NW Gulf of Suez, Egypt): Implication for provenance, tectonic setting and source area paleoweathering. J. Afr. Earth Sci. 2019, 160, 103607. [Google Scholar] [CrossRef]
- Wanas, H.A.; Assal, E.M. Provenance, tectonic setting and source area paleoweathering of sandstones of the Bahariya Formation in the Bahariya Oasis, Egypt: An implication to paleoclimate and paleogeography of the southern NeoTethys region during Early Cenomanian. Sediment. Geol. 2021, 413, 105822. [Google Scholar] [CrossRef]
- Zhang, J.J.; Mou, C.L.; Zhou, K.K.; Feng, L.X.; Wu, H.; Chen, X.W. Geochemical Characteristic of Sandstones from the Mangbang Formation in the Husa Basin, Western Yuannan, and Its Constraints on Provenances and Tectonic Setting. Acta Geol. Sin. 2017, 91, 1083–1096. [Google Scholar]
- Liu, W.Q.; Qiao, Y.; Bo, J.F.; Mu, C.L.; Tong, J.N.; Yao, J.X. Geochemistry of Mudstones from the Upper Permian Dalong Formation in the Enshi area, western Hubei, and its Implications for Weathering, Provenance and Tectonic Setting. J. Lanzhou Univ. Nat. Sci. 2019, 55, 158–167. [Google Scholar]
- Cai, L.P. Meso-cenozoic Tectonic Evolution and Significance in Petroleum Geology of Wudun Sag in Dunhuang Basin. Pet. Geol. Eng. 2017, 31, 1–4+130. [Google Scholar]
- Bhatia, R.M.; Crook, K.A.W. Trace Element Characteristics of Graywackes and Tectonic Setting Discrimination of Sedimentary Basins. Contrib Miner. Pet. 1986, 92, 181–193. [Google Scholar] [CrossRef]
- Rudnick, R.L.; Gao, S. Composition of the continental crust. Treatise Geochem. 2003, 3, 1–64. [Google Scholar]
- McLennan, S.M.; Hemming, S.; McDaniel, D.K.; Hanson, G.N. Geochemical Approaches to Sedimentation, Provenance, and Tectonics. Geol. Soc. Am. Spec. Pap. 1993, 284, 21–40. [Google Scholar]
- Dong, R.; Wang, H.; Yan, Q.H.; Zhang, X.Y.; Wei, X.P.; Li, P.; Zhou, K.L. Geochemical Characteristics and Zircon U-Pb Ages of the Bayankalashan Group in the Tianshihai Terrain of the West Kunlun Orogenic Belt: Implication for its Provenance and Tectonic Environment. Geotecton. Metallog. 2019, 43, 1236–1257. [Google Scholar]
- Zhang, H.; Li, R.T.; Ba, J.; Li, X.P.; Ma, J.Y. Geochemical Characteristics of the Lower Triassic Feixianguan Formation in Meigu Area, Southwestern Sichuan and its Significance for the Provenance and Tectonic Setting. J. Miner. Pet. 2019, 39, 52–59. [Google Scholar]
- Nesbitt, H.W.; Young, G.M. Early Proterozoic Climates and Plate Motions Inferred from Major Element Chemistry of Lutites. Nature 1982, 299, 715–717. [Google Scholar] [CrossRef]
- Cox, R.; Lowe, R.D.; Cullers, R.L. The Influence of Sediment Recycling and Basement Composition on Evolution of Mudrock Chemistry in the Southwestern United States. Geochim. Cosmochim. Acta 1995, 59, 2919–2940. [Google Scholar] [CrossRef]
- Li, M.; Zhao, H.G.; Li, W.H.; Ren, Z.L.; Liu, W.H. Major and Trace Elements of the Late Triassic Strata in the Helan Mountain: Constraints on the Provenance and Discussions on Different Methods. Geol. J. China Univ. 2018, 24, 841–855. [Google Scholar]
- Kimberley, M.M.; Grandstaff, D.E. Profiles of Elemental Concentrations in Precambrian Paleosols on Basaltic and Granitic Parent Materials. Precambrian Res. 1986, 32, 133–154. [Google Scholar] [CrossRef]

| Sample | D01 | D02 | D03 | D04 | D05 | D06 | D07 | D08 | D09 | D10 | D11 | D12 |
|---|---|---|---|---|---|---|---|---|---|---|---|---|
| Well name | XC1 | XC1 | XC1 | XC1 | XC1 | XC1 | XC1 | XC1 | XC1 | XC1 | XC1 | D2 |
| Depth/m | 2379.8 | 2358.7 | 2352.1 | 2351.4 | 2304.9 | 2294.5 | 2293.2 | 2290 | 2288.3 | 2286.1 | 2283.5 | 2282.5 |
| Ti/10−6 | 3892.6 | 4321.7 | 4271.6 | 4279.4 | 4256.7 | 3342.2 | 4052.1 | 3931.2 | 4219.4 | 4112.7 | 4286.4 | 4434 |
| Mn/10−6 | 219.6 | 421.9 | 444 | 483.9 | 119 | 164.5 | 187.3 | 204.3 | 245.3 | 301.8 | 198.5 | 433 |
| Rb/10−6 | 92.3 | 102.9 | 100.1 | 82.6 | 58.6 | 75.6 | 89 | 92.2 | 101.9 | 95.2 | 88.9 | 124.1 |
| V/10−6 | 60.9 | 112.7 | 101.7 | 93.8 | 106.8 | 60.4 | 72.1 | 87.6 | 98.3 | 77.8 | 90.3 | 79 |
| Cr/10−6 | 42.5 | 73.6 | 62.4 | 63.9 | 73.4 | 38.6 | 47.8 | 50.5 | 53.9 | 59.4 | 61.9 | 58.3 |
| Co/10−6 | 10 | 12.2 | 12.5 | 14 | 10.4 | 10 | 11.8 | 12.3 | 13.2 | 11.3 | 12.1 | 16.1 |
| Ni/10−6 | 13.6 | 19 | 19.7 | 20.6 | 11.4 | 16.8 | 22.1 | 19.6 | 21.1 | 17.9 | 20.5 | 24 |
| Ga/10−6 | 18.4 | 28.8 | 24 | 16.9 | 19.2 | 17.3 | 18.5 | 19.3 | 22.7 | 20.9 | 23.1 | 20.7 |
| Sr/10−6 | 118 | 116 | 129 | 121 | 73 | 73 | 102 | 107 | 110 | 109 | 116 | 148 |
| Ba/10−6 | 783 | 748 | 756 | 613 | 478 | 458 | 649 | 718 | 625 | 688 | 744 | 608 |
| Pb/10−6 | 12.3 | 17.8 | 16 | 14.8 | 17 | 12.9 | 13.1 | 16.9 | 14.5 | 16.2 | 15.8 | 22.8 |
| Th/10−6 | 6.7 | 13.1 | 11.9 | 11.7 | 10.6 | 7.1 | 8.5 | 9.3 | 11.2 | 7.9 | 12.6 | 12.1 |
| U/10−6 | 2.6 | 3 | 3 | 2.8 | 2.1 | 2.4 | 2.8 | 2.5 | 3.1 | 3.4 | 2.7 | 3.1 |
| Zr/10−6 | 177 | 369 | 279 | 453 | 373 | 186 | 321 | 308 | 298 | 311 | 356 | 267 |
| Hf/10−6 | 4.9 | 10.6 | 7.6 | 14.6 | 9.5 | 5 | 7.2 | 8.5 | 11.3 | 8.9 | 12.1 | 7.5 |
| Nb/10−6 | 16.3 | 33.8 | 24.6 | 30.2 | 25.5 | 16.7 | 19.7 | 22.8 | 21.9 | 28.1 | 26.5 | 19.5 |
| Sc/10−6 | 10.4 | 15.7 | 16.6 | 12.3 | 13.7 | 9.6 | 13.6 | 11.9 | 12.3 | 13.3 | 15.8 | 16.9 |
| Cu/10−6 | 13.1 | 18 | 12.1 | 13.6 | 13.4 | 10.8 | 14.5 | 12.9 | 13.3 | 13.8 | 11.1 | 20.9 |
| Zn/10−6 | 56 | 79.7 | 75.3 | 56.6 | 51.6 | 45.7 | 69.8 | 70.9 | 62.9 | 58.9 | 50.2 | 76.7 |
| As/10−6 | 3.3 | 0 | 0 | 0.3 | 4.6 | 1.1 | 2.1 | 1.3 | 1.1 | 0 | 1.3 | 4.2 |
| Br/10−6 | 0.3 | 0.6 | 0.2 | 0.5 | 0.5 | 0.5 | 0.4 | 0.2 | 0.5 | 0.3 | 0.3 | 0.8 |
| Mo/10−6 | 1.5 | 1.5 | 1.4 | 1.6 | 1.9 | 1.8 | 1.5 | 1.7 | 1.3 | 1.3 | 1.6 | 0.9 |
| Sn/10−6 | 4.3 | 2.7 | 3 | 1.4 | 3.3 | 1.6 | 2.2 | 1.9 | 1.5 | 1.1 | 3.1 | 5.4 |
| Sb/10−6 | 3.6 | 0.9 | 2.6 | 3.3 | 0.2 | 0.8 | 3.2 | 2.6 | 2.1 | 0.9 | 2.2 | 5.1 |
| W/10−6 | 20.6 | 21.6 | 21.1 | 27.3 | 18.7 | 15.9 | 22.1 | 25.1 | 27.1 | 22.9 | 19.6 | 11.7 |
| Bi/10−6 | 0.4 | 0.2 | 0 | 1.3 | 0.8 | 0 | 0.6 | 0.7 | 0.5 | 0 | 0.3 | 1.2 |
| Y/10−6 | 15.9 | 28.8 | 22.9 | 30.2 | 18.4 | 16.5 | 20.6 | 23.3 | 19.6 | 25.1 | 29.3 | 23.5 |
| La/10−6 | 29.9 | 48.5 | 56.8 | 37 | 37.4 | 38 | 47.4 | 39.7 | 49.7 | 37.3 | 48.1 | 37.5 |
| Ce/10−6 | 64.1 | 96.8 | 96.7 | 65.2 | 45.3 | 66.5 | 78.4 | 81.3 | 79.8 | 91.3 | 89.2 | 80 |
| Pr/10−6 | 9.9 | 11.7 | 12.1 | 8.6 | 8.4 | 8.2 | 8.9 | 9.1 | 9.1 | 10.3 | 10.1 | 10.2 |
| Nd/10−6 | 28.9 | 41.1 | 45.4 | 31.1 | 29.6 | 27.5 | 33.9 | 37.4 | 39.4 | 40.2 | 36.2 | 29.9 |
| Sm/10−6 | 7.4 | 7.3 | 7.7 | 5.9 | 6.6 | 5.1 | 6.1 | 6.3 | 7.2 | 8.1 | 7.5 | 8.1 |
| Eu/10−6 | 1.3 | 1.7 | 1.8 | 1.2 | 2.2 | 1.1 | 1.8 | 1.9 | 2.1 | 1.6 | 1.9 | 1.6 |
| Gd/10−6 | 5.1 | 6.4 | 6.7 | 5.1 | 5.2 | 4.2 | 5.7 | 6.2 | 5.9 | 5.4 | 6.2 | 5.3 |
| Tb/10−6 | 0.8 | 1 | 1.2 | 0.8 | 0.8 | 0.7 | 0.9 | 1.1 | 1.2 | 1 | 1.2 | 0.9 |
| Dy/10−6 | 4 | 6.3 | 6.5 | 4.7 | 3.6 | 3.8 | 4.1 | 5.5 | 4.9 | 6.2 | 5.8 | 4.9 |
| Ho/10−6 | 0.7 | 1.3 | 1.4 | 0.9 | 0.8 | 0.8 | 0.9 | 0.8 | 1.3 | 1.2 | 0.9 | 0.9 |
| Er/10−6 | 1.9 | 3.6 | 3.8 | 2.5 | 1.9 | 2.1 | 1.9 | 1.8 | 2.2 | 2.6 | 2.9 | 2.3 |
| Tm/10−6 | 0.3 | 0.6 | 0.7 | 0.4 | 0.4 | 0.4 | 0.5 | 0.7 | 0.6 | 0.4 | 0.5 | 0.5 |
| Yb/10−6 | 1.9 | 3.8 | 4.1 | 2.6 | 1.9 | 2.5 | 2.3 | 2.6 | 3.1 | 1.7 | 3.7 | 2.3 |
| Lu/10−6 | 0.3 | 0.5 | 0.6 | 0.3 | 0.4 | 0.4 | 0.4 | 0.4 | 0.5 | 0.4 | 0.5 | 0.5 |
| Th/U | 2.6 | 4.4 | 4 | 4.2 | 5 | 3 | 3 | 3.7 | 3.6 | 2.3 | 4.7 | 3.9 |
| La/Sc | 2.9 | 3.1 | 3.4 | 3 | 2.7 | 4 | 3.5 | 3.3 | 4 | 2.8 | 3 | 2.2 |
| Rb/Sr | 0.8 | 0.9 | 0.8 | 0.7 | 0.8 | 1 | 0.9 | 0.9 | 0.9 | 0.9 | 0.8 | 0.8 |
| Ti/Zr | 22 | 11.7 | 15.3 | 7.7 | 11.4 | 18 | 12.6 | 12.8 | 14.2 | 13.2 | 12 | 16.6 |
| La/Th | 4.5 | 3.7 | 4.8 | 3.2 | 3.5 | 5.4 | 5.6 | 4.3 | 4.4 | 4.7 | 3.8 | 3.1 |
| La/Y | 1.9 | 1.7 | 2.5 | 1.2 | 2 | 2.3 | 2.3 | 1.7 | 2.5 | 1.5 | 1.6 | 1.6 |
| Sc/Cr | 0.2 | 0.2 | 0.3 | 0.2 | 0.2 | 0.2 | 0.3 | 0.2 | 0.2 | 0.2 | 0.3 | 0.3 |
| Th/Sc | 0.6 | 0.8 | 0.7 | 1 | 0.8 | 0.7 | 0.6 | 0.8 | 0.9 | 0.6 | 0.8 | 0.7 |
| Zr/Sc | 17 | 23.5 | 16.8 | 45 | 27.2 | 19.4 | 23.6 | 25.9 | 24.2 | 23.4 | 22.5 | 15.8 |
| Co/Th | 1.5 | 0.9 | 1.1 | 1.2 | 1 | 1.4 | 1.4 | 1.3 | 1.2 | 1.4 | 1 | 1.3 |
| Th/Co | 0.7 | 1.1 | 1 | 0.8 | 1 | 0.7 | 0.7 | 0.8 | 0.8 | 0.7 | 1 | 0.8 |
| ∑REE/10−6 | 156.5 | 230.4 | 245.5 | 166.3 | 144.4 | 161.2 | 193.2 | 194.8 | 207 | 207.7 | 214.7 | 184.9 |
| ∑LREE/10−6 | 141.5 | 207 | 220.5 | 149 | 129.5 | 146.4 | 176.5 | 175.7 | 187.3 | 188.8 | 193 | 167.3 |
| ∑HREE/10−6 | 15 | 23.4 | 25 | 17.3 | 14.9 | 14.8 | 16.7 | 19.1 | 19.7 | 18.9 | 21.7 | 17.6 |
| δEu | 0.64 | 0.76 | 0.77 | 0.67 | 0.96 | 0.7 | 0.93 | 0.93 | 0.99 | 0.74 | 0.85 | 0.75 |
| Sample | D13 | D14 | D15 | D18 | D17 | D20 | D19 | D21 | D22 | D16 | D23 | |
| Well name | D2 | D2 | D2 | D2 | D2 | D2 | D2 | D2 | D2 | D2 | D2 | |
| Depth/m | 2282.2 | 2281.8 | 2281.5 | 2280.6 | 2280 | 2279.5 | 2279 | 2278.4 | 2277.8 | 2277.3 | 2277.2 | |
| Ti/10−6 | 3838 | 4459.1 | 4377.7 | 4443 | 4395.1 | 3889.3 | 4448.9 | 3378.3 | 3409.2 | 4232.9 | 3258.2 | |
| Mn/10−6 | 142.2 | 185.7 | 234.8 | 338.7 | 217.6 | 264.6 | 249.8 | 226.3 | 196.9 | 168.9 | 214.6 | |
| Rb/10−6 | 101.1 | 162.3 | 173.7 | 158.1 | 164.8 | 117.3 | 170.8 | 131.8 | 122.9 | 113.7 | 105.9 | |
| V/10−6 | 63 | 112 | 118.3 | 93.8 | 88.9 | 103.4 | 117 | 98.2 | 85.3 | 77 | 91.3 | |
| Cr/10−6 | 41.2 | 72.7 | 78.3 | 67.8 | 65.4 | 53.6 | 77 | 59.8 | 61.3 | 47.5 | 68.2 | |
| Co/10−6 | 11.7 | 15.1 | 15.5 | 16 | 11.2 | 12.7 | 10.6 | 13.5 | 11.9 | 9.1 | 10.9 | |
| Ni/10−6 | 11.9 | 27.9 | 29.6 | 29.2 | 16.8 | 13.7 | 21 | 15.6 | 19.9 | 9.5 | 21.4 | |
| Ga/10−6 | 20.3 | 29 | 31.4 | 28.6 | 24.7 | 22.8 | 27.2 | 27.6 | 24.5 | 21.7 | 23.9 | |
| Sr/10−6 | 94 | 75 | 83 | 128 | 110 | 102 | 104 | 109 | 99 | 95 | 105 | |
| Ba/10−6 | 802 | 681 | 757 | 858 | 797 | 799 | 759 | 714 | 879 | 687 | 852 | |
| Pb/10−6 | 14 | 15.7 | 17.8 | 21.3 | 16.8 | 15.8 | 28 | 17.1 | 19.2 | 12.3 | 16.3 | |
| Th/10−6 | 8.9 | 18.6 | 18.1 | 13.6 | 13.1 | 10.3 | 16.9 | 9.8 | 14.7 | 11.4 | 12.9 | |
| U/10−6 | 2.3 | 5.4 | 4.8 | 4.1 | 4.1 | 2.1 | 4.5 | 3.5 | 2.8 | 3.3 | 3.2 | |
| Zr/10−6 | 275 | 289 | 263 | 450 | 449 | 256 | 402 | 229 | 297 | 448 | 268 | |
| Hf/10−6 | 7.7 | 8 | 7 | 12.3 | 11.6 | 9.1 | 10.8 | 10.1 | 8.9 | 11.8 | 11.2 | |
| Nb/10−6 | 22.7 | 36.9 | 32.7 | 40.1 | 28.1 | 33.8 | 55.3 | 48.9 | 29.5 | 30.7 | 39.1 | |
| Sc/10−6 | 8.4 | 14.3 | 17.4 | 15.5 | 16.5 | 15.2 | 13.6 | 11.8 | 12.6 | 13.6 | 12.9 | |
| Cu/10−6 | 13.7 | 27.9 | 32 | 14.9 | 20.1 | 28.6 | 77.7 | 30.1 | 29.5 | 14.5 | 22.9 | |
| Zn/10−6 | 39.7 | 70.3 | 95.9 | 98.3 | 76.9 | 91.3 | 92.9 | 86.5 | 77.9 | 53.6 | 97.1 | |
| As/10−6 | 0.3 | 3.4 | 0 | 0 | 0 | 1.3 | 0 | 1.9 | 0 | 0 | 2.5 | |
| Br/10−6 | 0.4 | 0.2 | 0.3 | 0.5 | 0.5 | 0.5 | 0.5 | 0.3 | 0.4 | 0.3 | 0.6 | |
| Mo/10−6 | 3 | 3.7 | 1.3 | 0.4 | 0.5 | 2.2 | 0.8 | 1.9 | 2.1 | 0.8 | 1.7 | |
| Sn/10−6 | 3.2 | 12.5 | 13.5 | 1.7 | 3.6 | 9.8 | 4.3 | 11.5 | 10.6 | 4.4 | 9.9 | |
| Sb/10−6 | 5.2 | 12.6 | 17.2 | 0 | 0.8 | 15.8 | 3 | 7.1 | 9.7 | 3 | 5.2 | |
| W/10−6 | 13.9 | 6.2 | 3.7 | 16.3 | 21.9 | 19.8 | 11.8 | 18.4 | 20.1 | 25.8 | 17.9 | |
| Bi/10−6 | 0 | 0 | 0.7 | 0.4 | 0 | 0.8 | 0 | 0.6 | 0 | 0 | 0.6 | |
| Y/10−6 | 20.7 | 33.7 | 32.6 | 35.5 | 31.5 | 29.5 | 55.6 | 30.8 | 35.1 | 20 | 31.8 | |
| La/10−6 | 37 | 57.9 | 53.5 | 67.2 | 55.2 | 54.1 | 56.7 | 46.9 | 50.6 | 41.7 | 49.3 | |
| Ce/10−6 | 55 | 112.7 | 111.6 | 143.1 | 109.1 | 112.9 | 88.1 | 93.4 | 99.9 | 74.7 | 111.4 | |
| Pr/10−6 | 11.3 | 11.6 | 10.9 | 16.9 | 12.8 | 10.7 | 13.3 | 12.4 | 11.7 | 10.7 | 10.3 | |
| Nd/10−6 | 32 | 49.7 | 44.2 | 61.3 | 39.3 | 33.8 | 44.9 | 37.7 | 40.1 | 28.9 | 32.9 | |
| Sm/10−6 | 7.9 | 7.7 | 8.3 | 10.5 | 7.8 | 7.2 | 8.2 | 7.5 | 8.4 | 6.3 | 7.5 | |
| Eu/10−6 | 1.3 | 1.7 | 1.4 | 1.9 | 1.5 | 1.5 | 1.4 | 1.8 | 1.9 | 1.4 | 1.7 | |
| Gd/10−6 | 5.5 | 6.2 | 7.9 | 8.8 | 6.6 | 7.2 | 6.5 | 7.4 | 6.6 | 5.2 | 6.2 | |
| Tb/10−6 | 1.1 | 1.3 | 1.4 | 1.5 | 1.2 | 0.9 | 1.1 | 0.9 | 1.2 | 0.8 | 1.1 | |
| Dy/10−6 | 6.1 | 5.5 | 5.3 | 8.6 | 6.9 | 6.2 | 6 | 7.1 | 6.1 | 4.5 | 5.3 | |
| Ho/10−6 | 1.1 | 1.4 | 1.2 | 1.7 | 1.3 | 0.8 | 1.2 | 1.5 | 1.1 | 0.8 | 1.4 | |
| Er/10−6 | 3.5 | 2.8 | 2.9 | 4.4 | 3.5 | 3.1 | 3 | 3.5 | 2.7 | 2.2 | 2.5 | |
| Tm/10−6 | 0.3 | 0.6 | 0.5 | 0.7 | 0.6 | 0.6 | 0.5 | 0.4 | 0.7 | 0.3 | 0.6 | |
| Yb/10−6 | 3.1 | 2.7 | 2.5 | 4.7 | 3.8 | 3.3 | 3 | 2.8 | 2.9 | 2.2 | 3.2 | |
| Lu/10−6 | 0.3 | 0.5 | 0.4 | 0.6 | 0.5 | 0.6 | 0.4 | 0.4 | 0.5 | 0.3 | 0.4 | |
| Th/U | 3.9 | 3.4 | 3.8 | 3.3 | 3.2 | 4.9 | 3.8 | 2.8 | 5.3 | 3.5 | 4 | |
| La/Sc | 4.4 | 4 | 3.1 | 4.3 | 3.3 | 3.6 | 4.2 | 4 | 4 | 3.1 | 3.8 | |
| Rb/Sr | 1.1 | 2.2 | 2.1 | 1.2 | 1.5 | 1.2 | 1.6 | 1.2 | 1.2 | 1.2 | 1 | |
| Ti/Zr | 14 | 15.4 | 16.6 | 9.9 | 9.8 | 15.2 | 11.1 | 14.8 | 11.5 | 9.4 | 12.2 | |
| La/Th | 4.2 | 3.1 | 3 | 4.9 | 4.2 | 5.3 | 3.4 | 4.8 | 3.4 | 3.7 | 3.8 | |
| La/Y | 1.8 | 1.7 | 1.6 | 1.9 | 1.8 | 1.8 | 1 | 1.5 | 1.4 | 2.1 | 1.6 | |
| Sc/Cr | 0.2 | 0.2 | 0.2 | 0.2 | 0.3 | 0.3 | 0.2 | 0.2 | 0.2 | 0.3 | 0.2 | |
| Th/Sc | 1.1 | 1.3 | 1 | 0.9 | 0.8 | 0.7 | 1.2 | 0.8 | 1.2 | 0.8 | 1 | |
| Zr/Sc | 32.7 | 20.2 | 15.1 | 29 | 27.2 | 16.8 | 29.6 | 19.4 | 23.6 | 32.9 | 20.8 | |
| Co/Th | 1.3 | 0.8 | 0.9 | 1.2 | 0.9 | 1.2 | 0.6 | 1.4 | 0.8 | 0.8 | 0.8 | |
| Th/Co | 0.8 | 1.2 | 1.2 | 0.9 | 1.2 | 0.8 | 1.6 | 0.7 | 1.2 | 1.3 | 1.2 | |
| ∑REE/10−6 | 165.5 | 262.3 | 252 | 331.8 | 250 | 242.9 | 234.2 | 223.7 | 234.4 | 180 | 233.8 | |
| ∑LREE/10−6 | 144.5 | 241.3 | 229.9 | 300.8 | 225.7 | 220.2 | 212.6 | 199.7 | 212.6 | 163.6 | 213.1 | |
| ∑HREE/10−6 | 21 | 21 | 22.1 | 31 | 24.3 | 22.7 | 21.7 | 24 | 21.8 | 16.4 | 20.7 | |
| δEu | 0.6 | 0.75 | 0.53 | 0.6 | 0.64 | 0.64 | 0.58 | 0.74 | 0.78 | 0.72 | 0.76 | |
| Sample | D24 | D25 | D26 | D27 | D28 | D29 | D30 | D31 | D32 | D33 | D34 | UCC |
| Well name | D2 | D1 | D1 | D1 | D1 | D1 | D1 | D1 | D1 | D1 | D1 | |
| Depth/m | 2275.7 | 1932.4 | 1932 | 1927 | 1923.7 | 1922.2 | 1921.6 | 1919.2 | 1919 | 1918.4 | 1917.2 | |
| Ti/10−6 | 3201.7 | 2448.9 | 2289.6 | 2190.7 | 2382.9 | 2313.1 | 2356.9 | 2288.4 | 1992.8 | 2059.3 | 2378.4 | 3765 |
| Mn/10−6 | 272.1 | 127.3 | 152.7 | 306.4 | 96.3 | 141.4 | 119.4 | 98.1 | 153.2 | 132.9 | 102.7 | - |
| Rb/10−6 | 115.6 | 64.5 | 55.3 | 60.5 | 43.2 | 46.9 | 49.5 | 51.3 | 55.8 | 53.7 | 59.5 | 82 |
| V/10−6 | 83.9 | 30.5 | 22.6 | 35 | 22.8 | 20.6 | 24.1 | 26.8 | 29.4 | 27.3 | 22.1 | 97 |
| Cr/10−6 | 70.5 | 17.3 | 13.3 | 21.9 | 11.2 | 15.4 | 11.8 | 16.2 | 15.5 | 13.1 | 15.3 | 92 |
| Co/10−6 | 14.2 | 9.9 | 8 | 8.3 | 5.1 | 6.7 | 6.1 | 7.8 | 7.2 | 5.9 | 8.8 | 17 |
| Ni/10−6 | 20.8 | 4.4 | 5.3 | 9.8 | 3.3 | 4.7 | 6.3 | 3.9 | 8.2 | 7.1 | 5.8 | 47 |
| Ga/10−6 | 27.8 | 11.6 | 10.8 | 12.6 | 8.6 | 8.8 | 9.3 | 9.9 | 8.9 | 11.1 | 10.4 | |
| Sr/10−6 | 107 | 82 | 96 | 125 | 90 | 100 | 92 | 98 | 103 | 89 | 91 | 320 |
| Ba/10−6 | 904 | 519 | 471 | 665 | 523 | 553 | 593 | 652 | 637 | 661 | 489 | 628 |
| Pb/10−6 | 17.9 | 10 | 14.7 | 10.4 | 9.7 | 11.2 | 11 | 10.7 | 10.5 | 9.9 | 10.4 | 17 |
| Th/10−6 | 15.1 | 2.6 | 2.6 | 5 | 3.2 | 3.6 | 3.1 | 4.2 | 2.8 | 3.5 | 3.7 | 10.5 |
| U/10−6 | 2.6 | 1.7 | 1.6 | 2.6 | 1.2 | 1.4 | 1.3 | 1.7 | 1.5 | 1.3 | 1.8 | 2.7 |
| Zr/10−6 | 241 | 185 | 202 | 220 | 238 | 229 | 261 | 274 | 241 | 187 | 258 | 193 |
| Hf/10−6 | 10.3 | 4.7 | 4.9 | 4.3 | 6.2 | 6.2 | 4.1 | 3.9 | 4.4 | 4.5 | 4.2 | 5.3 |
| Nb/10−6 | 36.8 | 14.8 | 10 | 13.6 | 14.6 | 13.5 | 13.8 | 14.1 | 14.5 | 13.3 | 13.7 | 12 |
| Sc/10−6 | 14.2 | 4.4 | 5.5 | 7.8 | 3.5 | 4.7 | 3.1 | 5.1 | 4.5 | 3.8 | 3.6 | 14 |
| Cu/10−6 | 27.7 | 4.4 | 6.6 | 9.2 | 5 | 6.1 | 7.8 | 8.1 | 9.1 | 8.9 | 9.1 | 28 |
| Zn/10−6 | 90.5 | 22.8 | 21.8 | 28.1 | 11.7 | 15.8 | 24.8 | 23.4 | 25.1 | 27.6 | 28.1 | 67 |
| As/10−6 | 1.9 | 0 | 0 | 3.4 | 5.7 | 3.4 | 4.1 | 3.9 | 4.6 | 5.3 | 3.8 | - |
| Br/10−6 | 0.4 | 0.5 | 0.6 | 0.4 | 0.7 | 0.9 | 0.8 | 0.6 | 0.7 | 0.8 | 0.7 | - |
| Mo/10−6 | 1.5 | 2 | 1.9 | 1.7 | 2.7 | 2.3 | 2.2 | 2.7 | 2.4 | 2.6 | 2.5 | - |
| Sn/10−6 | 10.7 | 2 | 1.5 | 3.3 | 1.6 | 1.2 | 1.5 | 2.2 | 2.8 | 3.2 | 2.9 | - |
| Sb/10−6 | 13.4 | 0 | 3.6 | 4 | 0.6 | 0 | 3.8 | 3.1 | 3.5 | 3.3 | 3.1 | - |
| W/10−6 | 19.8 | 39.5 | 23.3 | 23.3 | 22.6 | 35 | 28.7 | 30.9 | 32.1 | 22.9 | 30.1 | - |
| Bi/10−6 | 0.5 | 0.5 | 1.4 | 0.4 | 0.7 | 0.5 | 1.3 | 1.4 | 1.3 | 1.1 | 0.9 | - |
| Y/10−6 | 22.9 | 8.7 | 10.1 | 15.6 | 12.7 | 12.7 | 9.6 | 13.5 | 10.8 | 11.2 | 9.9 | 21 |
| La/10−6 | 52.8 | 19.8 | 25.2 | 42.5 | 19.3 | 30 | 22.3 | 25.1 | 27.8 | 18.9 | 24.1 | 31 |
| Ce/10−6 | 109.5 | 27.2 | 38.5 | 42.1 | 24.7 | 26.5 | 29.8 | 31.4 | 33.7 | 39.1 | 32.5 | 63 |
| Pr/10−6 | 11.2 | 3.8 | 5 | 9.6 | 3.6 | 6.4 | 5.9 | 4.8 | 5.5 | 7.1 | 5.8 | 7.1 |
| Nd/10−6 | 42.1 | 16.9 | 19.1 | 34 | 14.7 | 24.3 | 28.9 | 26.5 | 32.8 | 41.1 | 23.8 | 27 |
| Sm/10−6 | 9.1 | 2.1 | 3.6 | 6.8 | 2.1 | 4.1 | 3.8 | 5 | 4.7 | 3.9 | 5.5 | 4.7 |
| Eu/10−6 | 1.6 | 1.2 | 0.8 | 2.2 | 1.2 | 0.9 | 0.9 | 1.3 | 1.1 | 0.8 | 1.1 | 1 |
| Gd/10−6 | 7.7 | 1.6 | 3 | 5.2 | 1.6 | 2.8 | 1.9 | 2.4 | 3.1 | 2.9 | 1.7 | 4 |
| Tb/10−6 | 0.9 | 0.2 | 0.5 | 0.7 | 0.3 | 0.5 | 0.4 | 0.5 | 0.6 | 0.4 | 0.7 | 0.7 |
| Dy/10−6 | 5.5 | 0.8 | 2.8 | 3.6 | 1.1 | 2.2 | 1.6 | 1.9 | 2.5 | 2.9 | 2.6 | 3.9 |
| Ho/10−6 | 1.6 | 0.2 | 0.6 | 0.7 | 0.2 | 0.4 | 0.3 | 0.5 | 0.4 | 0.6 | 0.4 | 0.8 |
| Er/10−6 | 2.9 | 0.4 | 1.5 | 1.7 | 0.4 | 0.7 | 0.9 | 1.1 | 0.7 | 1.3 | 0.8 | 2.3 |
| Tm/10−6 | 0.6 | 0.1 | 0.2 | 0.3 | 0.1 | 0.2 | 0.2 | 0.1 | 0.2 | 0.3 | 0.1 | 0.3 |
| Yb/10−6 | 2.5 | 0.4 | 1.5 | 1.6 | 0.4 | 1.1 | 0.8 | 0.5 | 1 | 1.2 | 0.9 | 2 |
| Lu/10−6 | 0.5 | 0.1 | 0.2 | 0.2 | 0.1 | 0.2 | 0.2 | 0.1 | 0.2 | 0.1 | 0.1 | 0.3 |
| Th/U | 5.8 | 1.5 | 1.6 | 1.9 | 2.7 | 2.6 | 2.4 | 2.5 | 1.9 | 2.7 | 2.1 | - |
| La/Sc | 3.7 | 4.5 | 4.6 | 5.4 | 5.5 | 6.4 | 7.2 | 4.9 | 6.2 | 5 | 6.7 | - |
| Rb/Sr | 1.1 | 0.8 | 0.6 | 0.5 | 0.5 | 0.5 | 0.5 | 0.5 | 0.5 | 0.6 | 0.7 | - |
| Ti/Zr | 13.3 | 13.2 | 11.3 | 10 | 10 | 10.1 | 9 | 8.4 | 8.3 | 11 | 9.2 | - |
| La/Th | 3.5 | 7.6 | 9.7 | 8.5 | 6 | 8.3 | 7.2 | 6 | 9.9 | 5.4 | 6.5 | - |
| La/Y | 2.3 | 2.3 | 2.5 | 2.7 | 1.5 | 2.4 | 2.3 | 1.9 | 2.6 | 1.7 | 2.4 | - |
| Sc/Cr | 0.2 | 0.3 | 0.4 | 0.4 | 0.3 | 0.3 | 0.3 | 0.3 | 0.3 | 0.3 | 0.2 | - |
| Th/Sc | 1.1 | 0.6 | 0.5 | 0.6 | 0.9 | 0.8 | 1 | 0.8 | 0.6 | 0.9 | 1 | - |
| Zr/Sc | 17 | 42 | 36.7 | 28.2 | 68 | 48.7 | 84.2 | 53.7 | 53.6 | 49.2 | 71.7 | - |
| Co/Th | 0.9 | 3.8 | 3.1 | 1.7 | 1.6 | 1.9 | 2 | 1.9 | 2.6 | 1.7 | 2.4 | - |
| Th/Co | 1.1 | 0.3 | 0.3 | 0.6 | 0.6 | 0.5 | 0.5 | 0.5 | 0.4 | 0.6 | 0.4 | - |
| ∑REE/10−6 | 248.5 | 74.6 | 102.5 | 151.2 | 69.7 | 100.3 | 97.9 | 101.2 | 114.3 | 120.6 | 100.1 | - |
| ∑LREE/10−6 | 226.3 | 70.9 | 92.2 | 137.2 | 65.6 | 92.2 | 91.6 | 94.1 | 105.6 | 110.9 | 92.8 | - |
| ∑HREE/10−6 | 22.2 | 3.7 | 10.2 | 14 | 4.1 | 8.1 | 6.3 | 7.1 | 8.7 | 9.7 | 7.3 | - |
| δEu | 0.58 | 1.94 | 1.13 | 1.15 | 2 | 1.05 | 1.02 | 1.15 | 1.05 | 1.08 | 1.1 | - |
Publisher’s Note: MDPI stays neutral with regard to jurisdictional claims in published maps and institutional affiliations. |
© 2022 by the authors. Licensee MDPI, Basel, Switzerland. This article is an open access article distributed under the terms and conditions of the Creative Commons Attribution (CC BY) license (https://creativecommons.org/licenses/by/4.0/).
Share and Cite
Xu, T.; Feng, L.; Yin, W.; Wei, J.; Wang, Y.; Zou, X. Element Geochemical Characteristics and Provenance Conditions of the 1st Member of Jurassic Zhongjiangou Formation in Wudun Sag, Dunhuang Basin. Appl. Sci. 2022, 12, 4110. https://doi.org/10.3390/app12094110
Xu T, Feng L, Yin W, Wei J, Wang Y, Zou X. Element Geochemical Characteristics and Provenance Conditions of the 1st Member of Jurassic Zhongjiangou Formation in Wudun Sag, Dunhuang Basin. Applied Sciences. 2022; 12(9):4110. https://doi.org/10.3390/app12094110
Chicago/Turabian StyleXu, Tao, Ling Feng, Wen Yin, Jinpeng Wei, Yarong Wang, and Xianli Zou. 2022. "Element Geochemical Characteristics and Provenance Conditions of the 1st Member of Jurassic Zhongjiangou Formation in Wudun Sag, Dunhuang Basin" Applied Sciences 12, no. 9: 4110. https://doi.org/10.3390/app12094110