
Quality Assessment of Components of Wheat Seed Using Different Classifications Models


 , ,
, ,  and
and 
Abstract
:1. Introduction
2. Materials and Methods
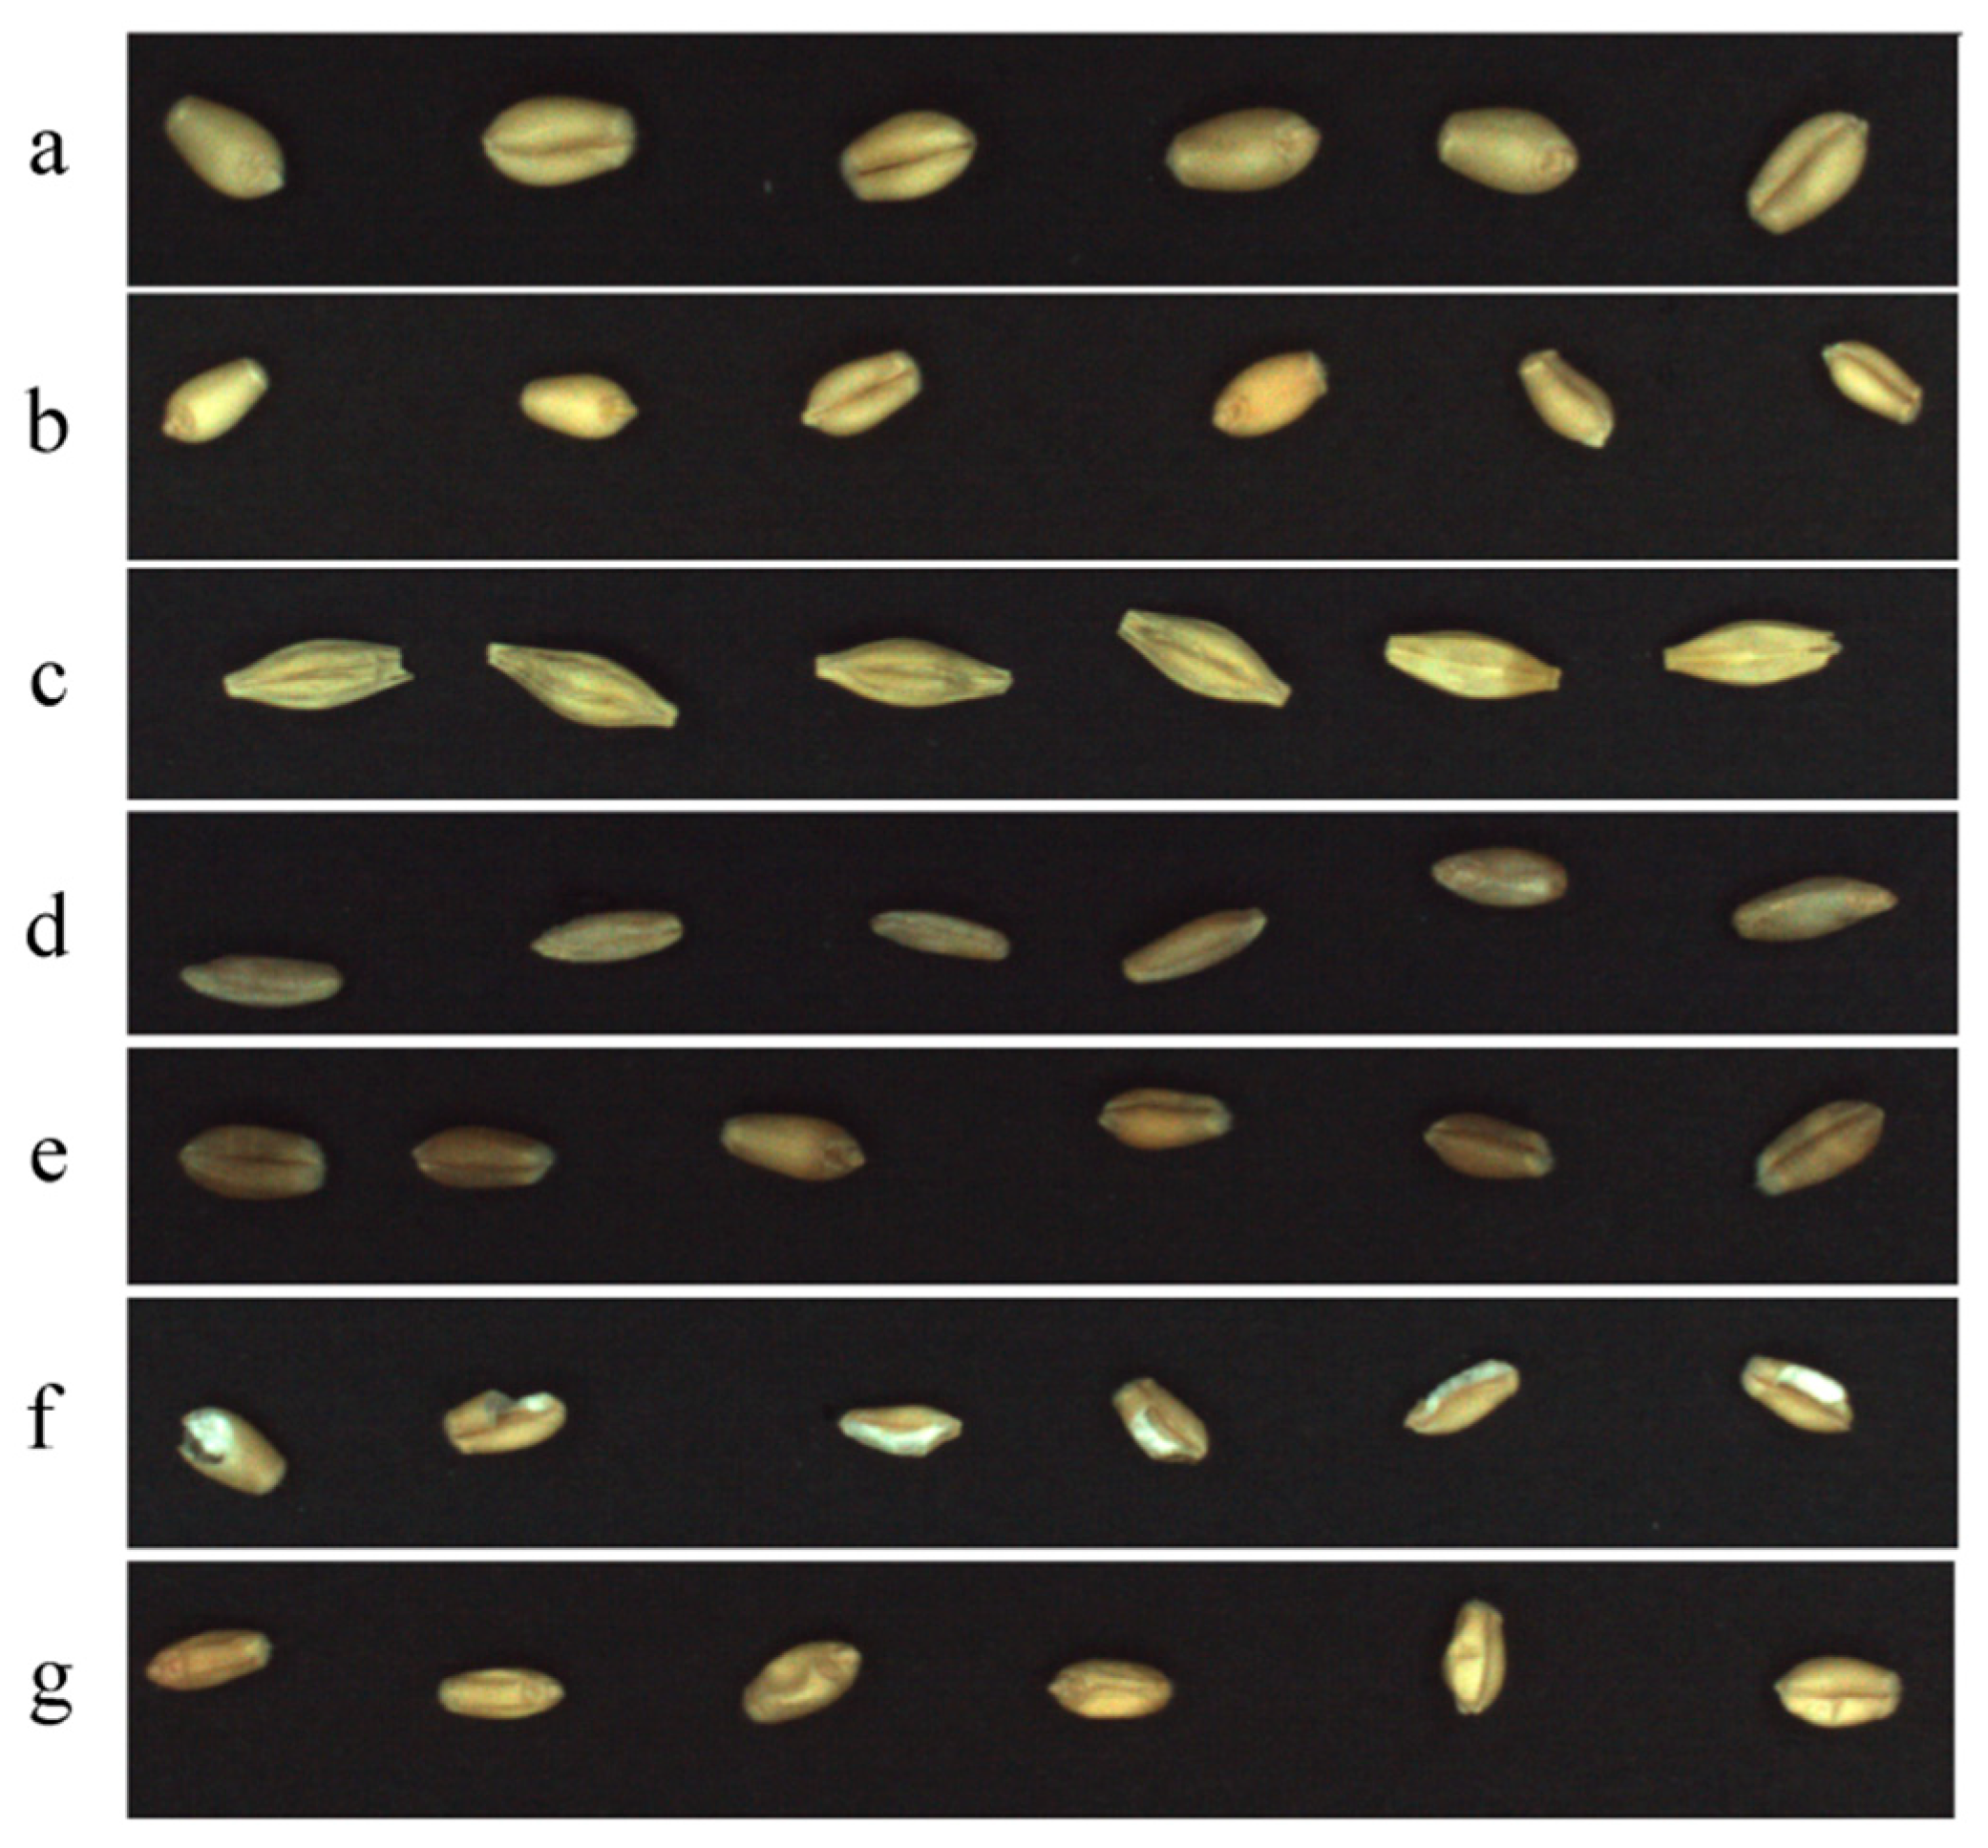
2.1. Preparing Grain Samples
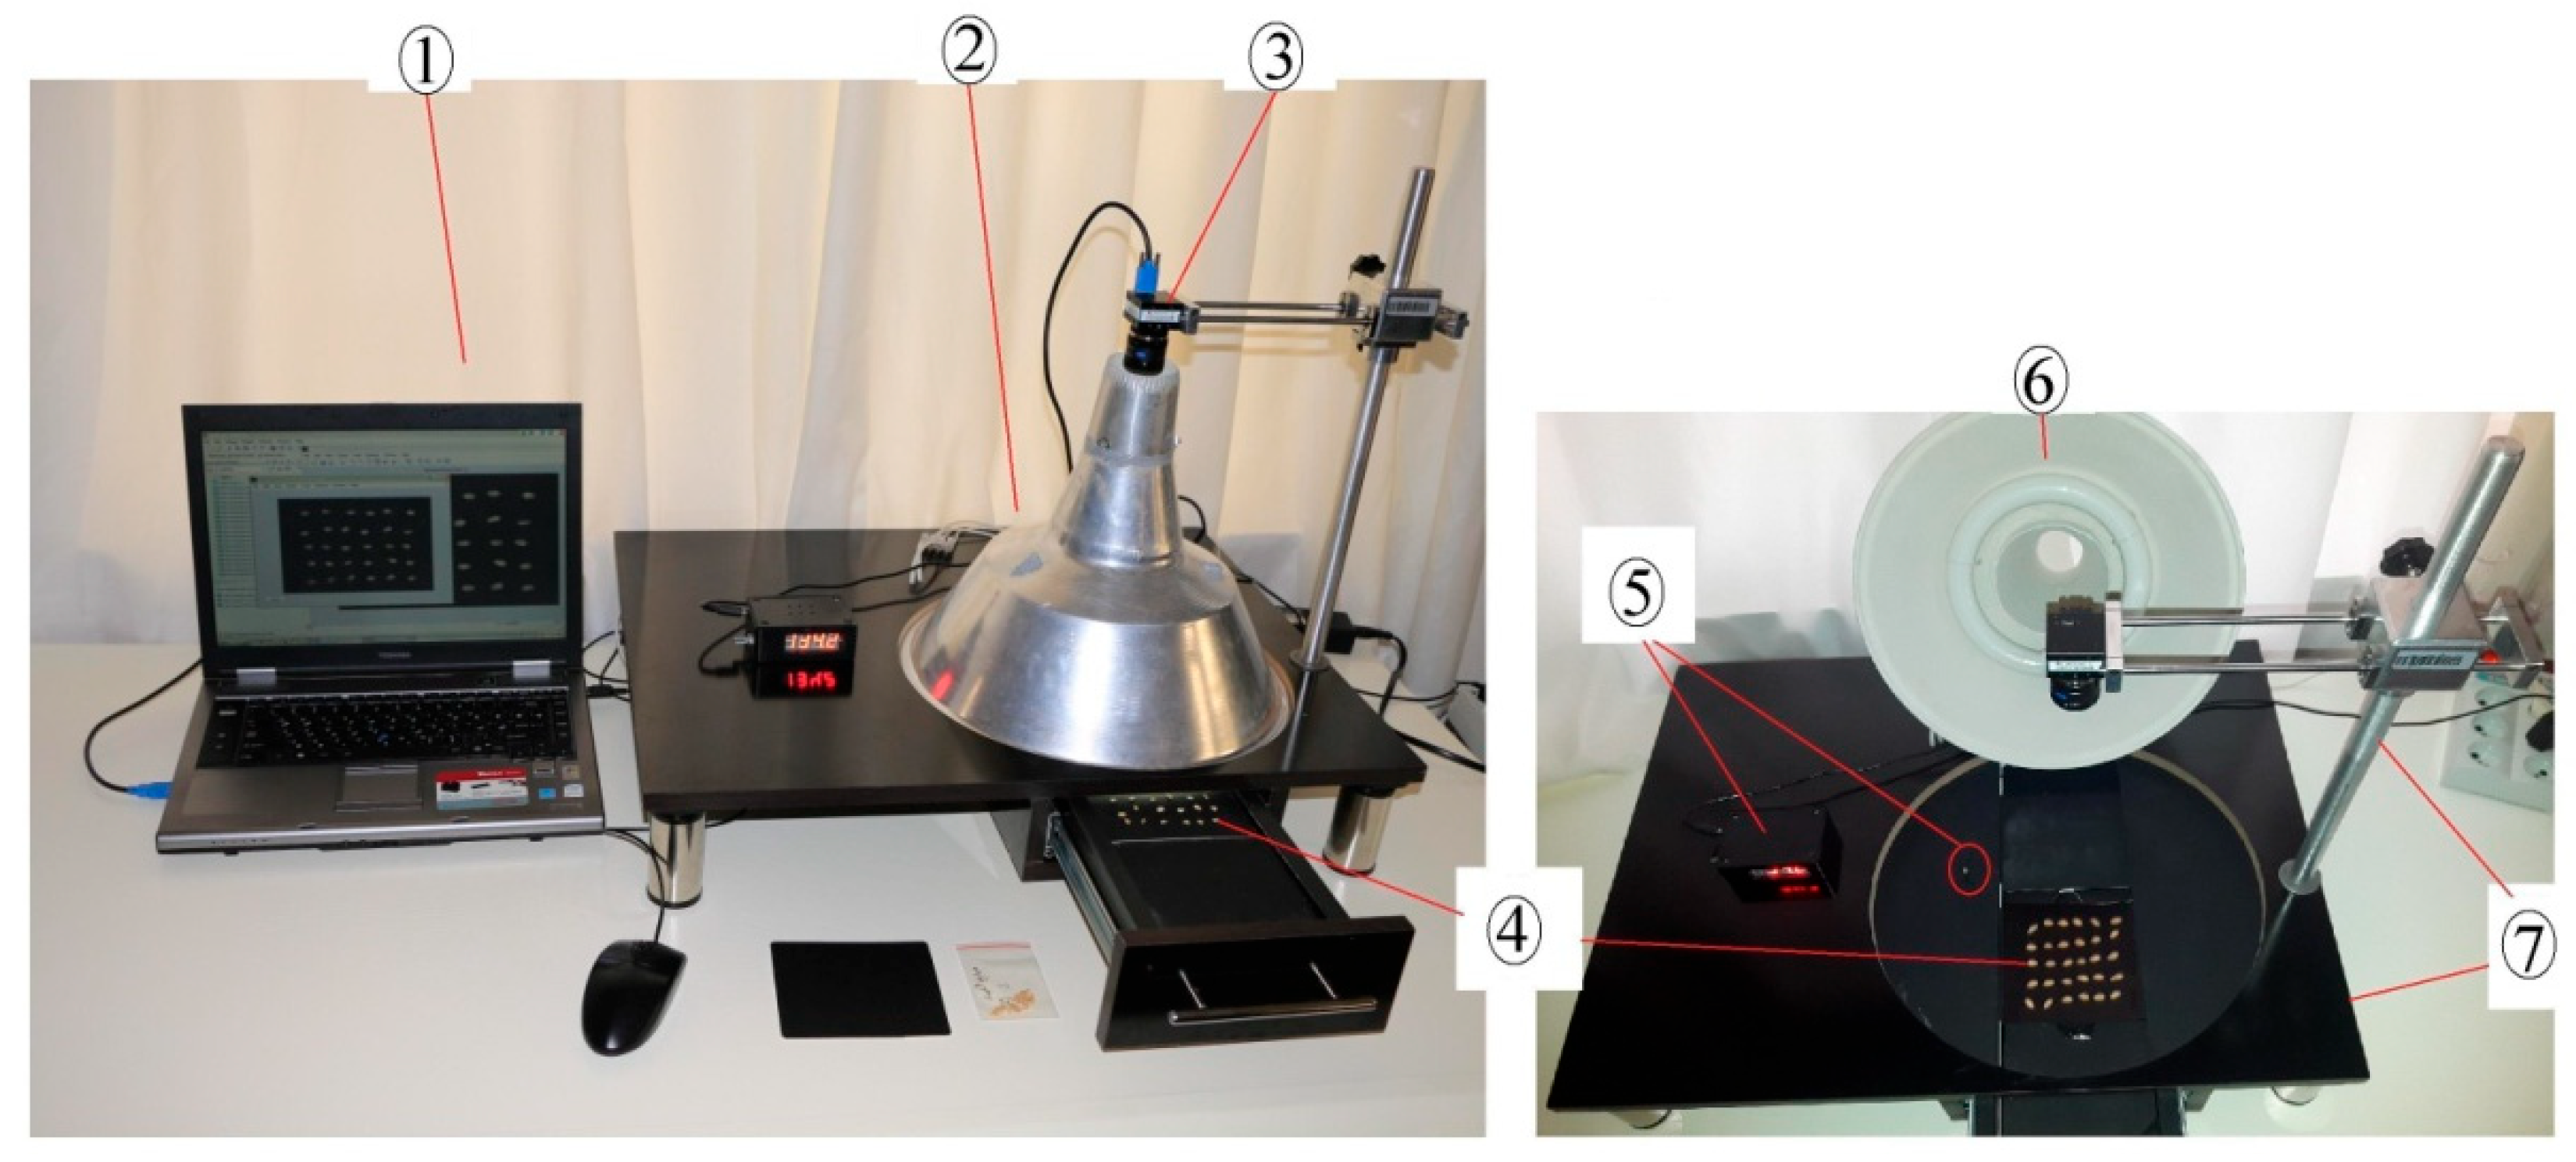
2.2. Imaging
2.3. Image Processing
2.4. Calculating the Shape Features
2.5. Calculating Colour Features
2.6. Calculating Texture Features
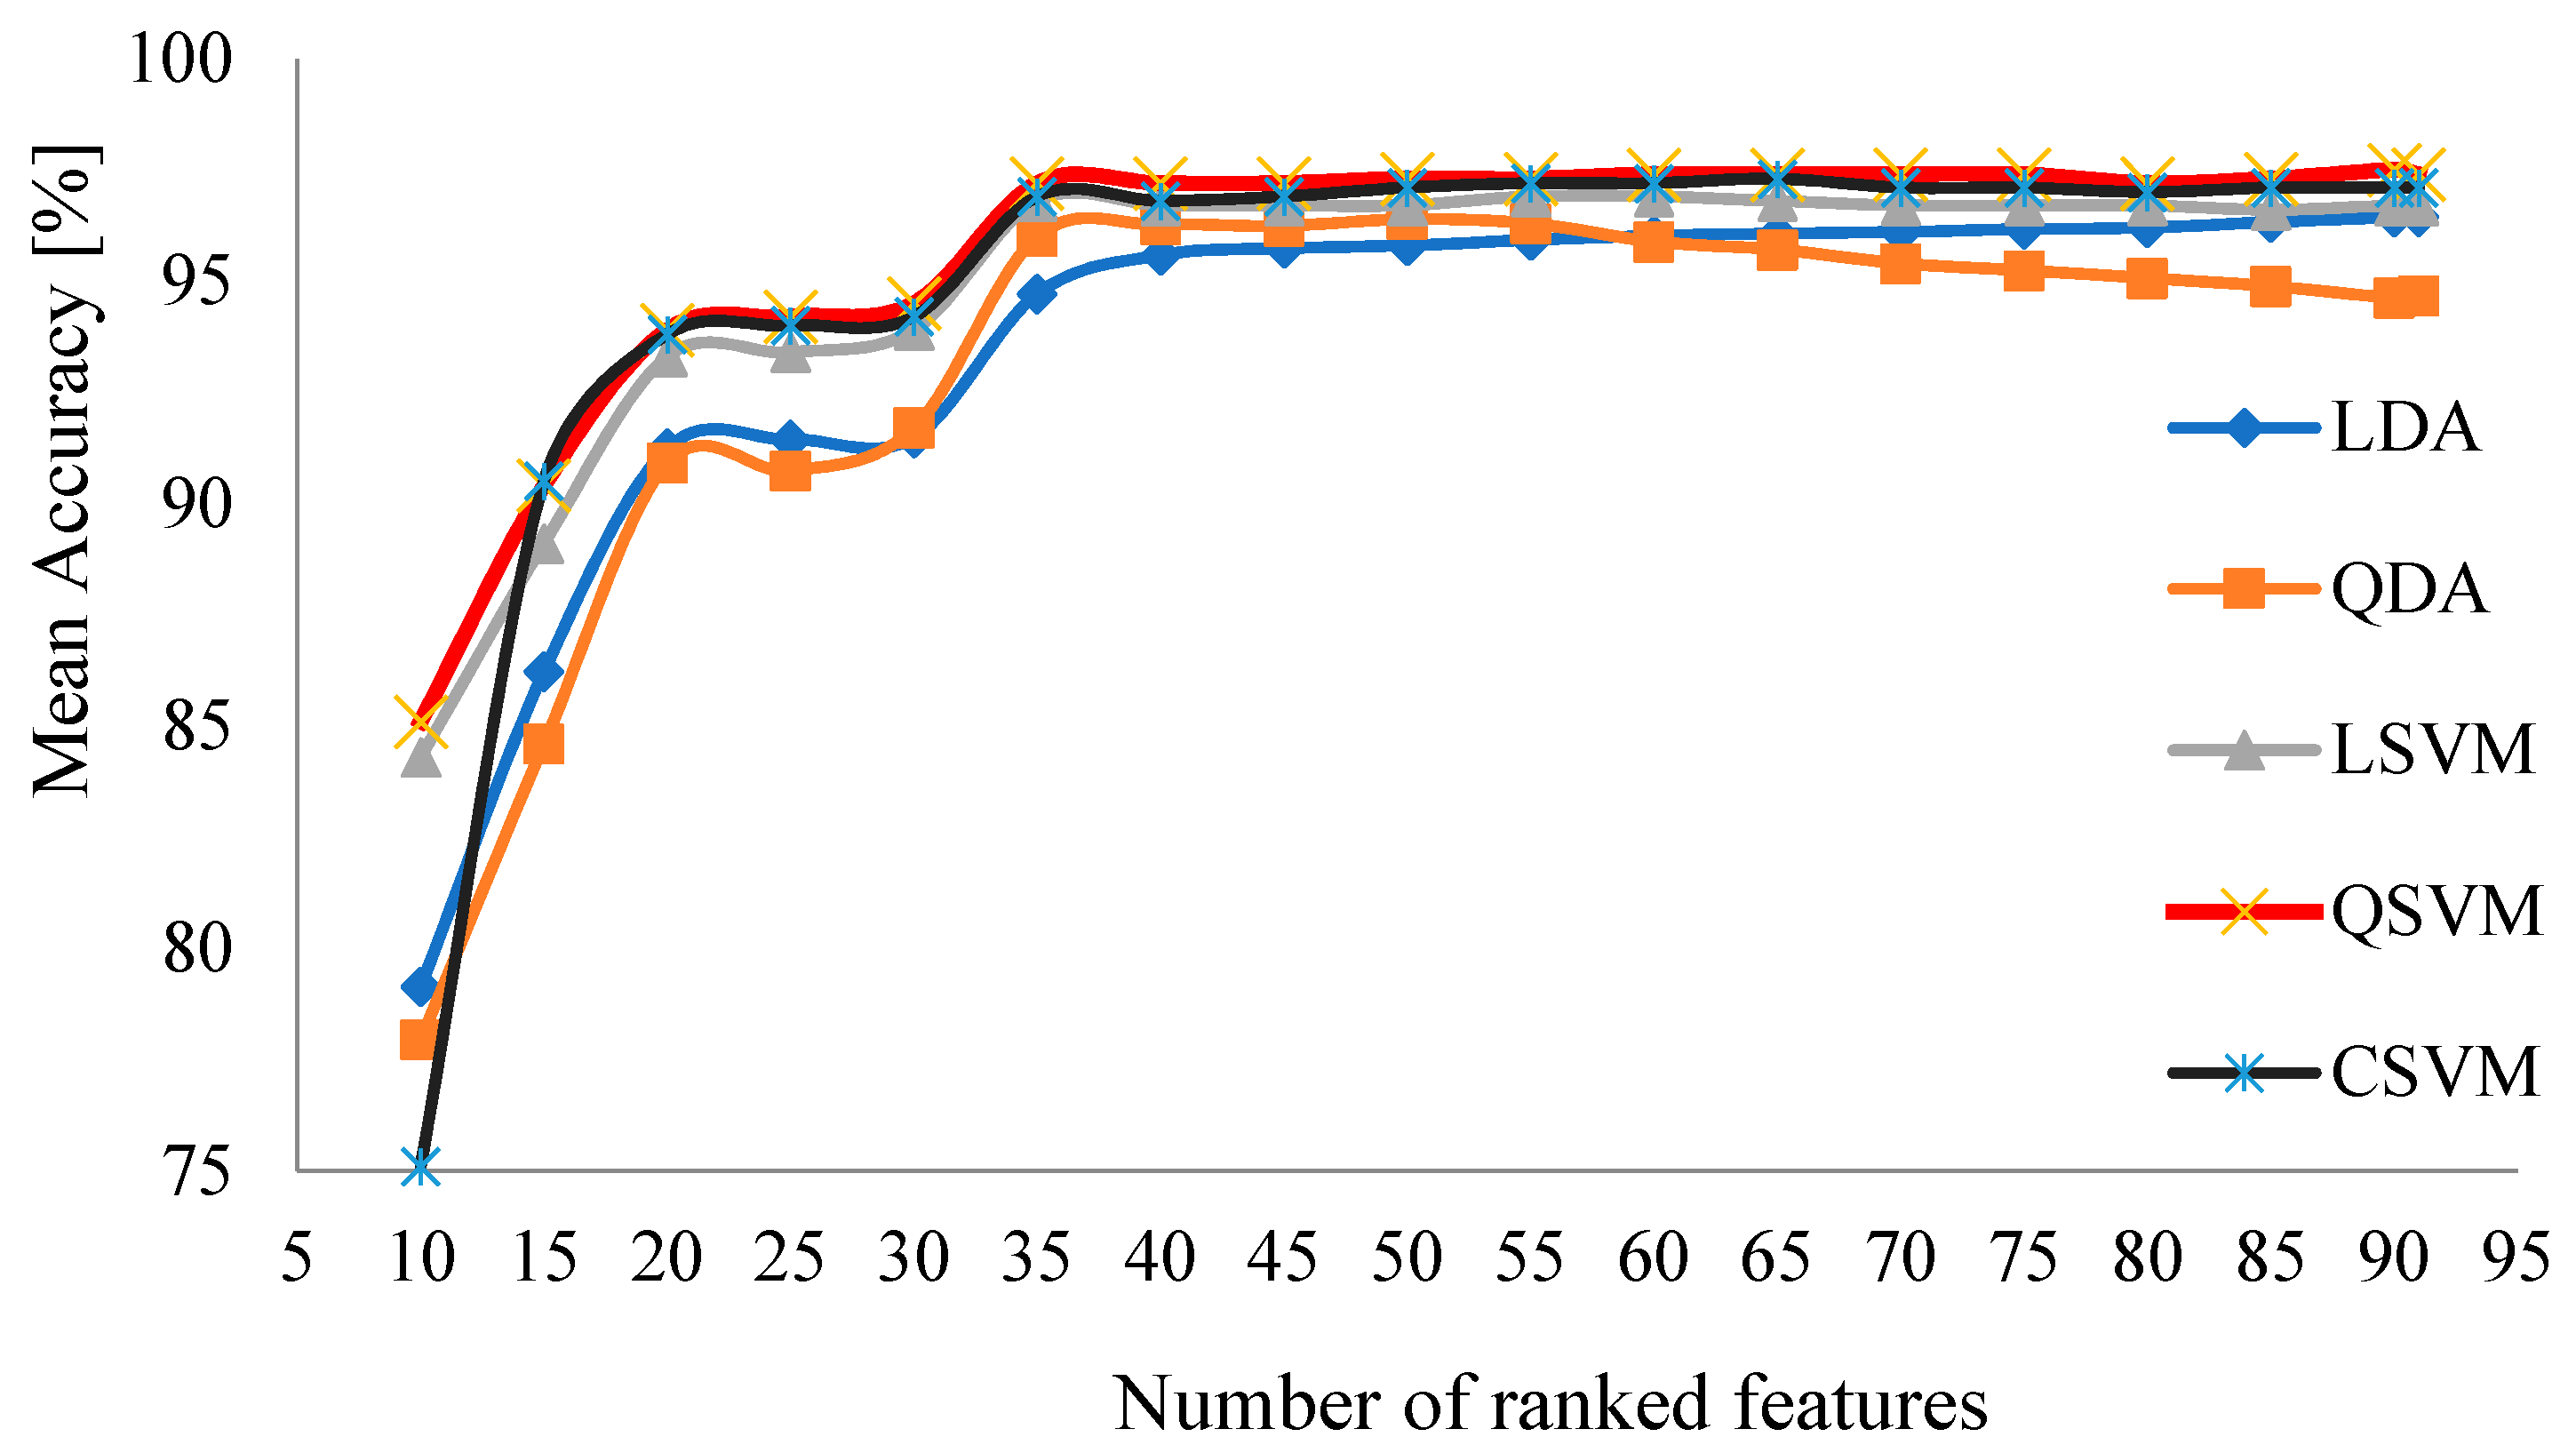
2.7. Ranking Features
2.8. Preparing Classification Models
3. Results
4. Discussion and Conclusions
Author Contributions
Funding
Institutional Review Board Statement
Informed Consent Statement
Data Availability Statement
Conflicts of Interest
References
- Venora, G.; Grillo, O.; Saccone, R. Quality assessment of durum wheat storage centres in Sicily: Evaluation of vitreous, starchy and shrunken kernels using an image analysis system. J. Cereal Sci. 2009, 49, 429–440. [Google Scholar] [CrossRef]
- Dubey, B.P.P.; Bhagwat, S.G.G.; Shouche, S.P.P.; Sainis, J.K.K. Potential of Artificial Neural Networks in Varietal Identification using Morphometry of Wheat Grains. Biosyst. Eng. 2006, 95, 61–67. [Google Scholar] [CrossRef]
- Pazoki, A.; Pazoki, Z.; Sorkhilalehloo, B. Rain fed barley seed cultivars identification using neural network and different neurons number. World Appl. Sci. J. 2013, 22, 755–762. [Google Scholar] [CrossRef]
- Pourreza, A.; Pourreza, H.; Abbaspour-Fard, M.H.; Sadrnia, H. Identification of nine Iranian wheat seed varieties by textural analysis with image processing. Comput. Electron. Agric. 2012, 83, 102–108. [Google Scholar] [CrossRef]
- Zapotoczny, P.; Zielinska, M.; Nita, Z. Application of image analysis for the varietal classification of barley: Morphological features. J. Cereal Sci. 2008, 48, 104–110. [Google Scholar] [CrossRef]
- Zapotoczny, P. Discrimination of wheat grain varieties using image analysis: Morphological features. Eur. Food Res. Technol. 2011, 233, 769–779. [Google Scholar] [CrossRef] [Green Version]
- Majumdar, S.; Jayas, D.S. Classification of cereal grains using machine vision: II. Colormodels. Trans. ASAE 2000, 43, 1677–1680. [Google Scholar] [CrossRef]
- Delwiche, S.R.; Yang, I.C.; Graybosch, R.A. Multiple view image analysis of freefalling U.S. wheat grains for damage assessment. Comput. Electron. Agric. 2013, 98, 62–73. [Google Scholar] [CrossRef]
- Paliwal, J.; Visen, N.S.; Jayas, D.S.; White, N.D.G. Comparison of a neural network and a non-parametric classifier for grain kernel identification. Biosyst. Eng. 2003, 85, 405–413. [Google Scholar] [CrossRef]
- Savakar, D. Recognition and Classification of Similar Looking Food Grain Images using Artificial Neural Networks. J. Appl. Comput. Sci. Math. 2012, 13, 61–65. [Google Scholar]
- Guevara-Hernandez, F.; Gomez-Gil, J. A machine vision system for classification of wheat and barley grain kernels. Span. J. Agric. Res. 2011, 9, 672–680. [Google Scholar] [CrossRef]
- Shrestha, B.L.; Kang, Y.M.; Baik, O.D. A two-camera machine vision in predicting alpha-amylase activity in wheat. J. Cereal Sci. 2016, 71, 28–36. [Google Scholar] [CrossRef]
- Mahesh, S.; Manickavasagan, A.; Jayas, D.S.; Paliwal, J.; White, N.D.G. Feasibility of near-infrared hyperspectral imaging to differentiate Canadian wheat classes. Biosyst. Eng. 2008, 101, 50–57. [Google Scholar] [CrossRef]
- Majumdar, S.; Jayas, D.S. Classification of Cereal Grains Using Machine Vision: IV. Combined Morphology, Color, and Texture Models. Trans. ASAE 2000, 43, 1689–1694. [Google Scholar] [CrossRef]
- Gonzalez, R.C.; Woods, R.E.; Eddins, S.L. Digital Image Processing Using MATLAB; Gatesmark Publishing: Knoxville, TN, USA, 2004. [Google Scholar]
- Majumdar, S.; Jayas, D.S. Classification of cereal grains using machine vision: I. Morphology Models. Trans. ASAE 2000, 43, 1669–1675. [Google Scholar] [CrossRef]
- Robnik-Šikonja, M.; Kononenko, I. Theoretical and Empirical Analysis of ReliefF and RReliefF. Mach. Learn. 2003, 53, 23–69. [Google Scholar] [CrossRef] [Green Version]
- Iva, S.; Oscar, G.; Marie, B.; Martin, P.; Gianfranco, V. Phenotypic evaluation of flax seeds by image analysis. Ind. Crops Prod. 2013, 47, 232–238. [Google Scholar] [CrossRef]
- Hsu, C.W.; Lin, C.-J. A comparison of methods for multi-class support vector machines. IEEE Trans. Neural Netw. 2002, 13, 415–425. [Google Scholar] [CrossRef] [Green Version]
- Khan, A.; Baig, A.R. Multi-Objective Feature Subset Selection using Non-dominated Sorting Genetic Algorithm. J. Appl. Res. Technol. 2015, 13, 145–159. [Google Scholar] [CrossRef] [Green Version]
- Kaur, H.; Singh, B. Classification and Grading Rice Using Multi-Class SVM. Int. J. Sci. Res. Publ. 2013, 3, 1–5. [Google Scholar]
- Olgun, M.; Onarcan, A.O.; Özkan, K.; Işik, Ş.; Sezer, O.; Özgişi, K.; Ayter, N.G.; Başçiftçi, Z.B.; Ardiç, M.; Koyuncu, O. Wheat grain classification by using dense SIFT features with SVM classifier. Comput. Electron. Agric. 2016, 122, 185–190. [Google Scholar] [CrossRef]
- Sun, C.; Liu, T.; Ji, C.; Jiang, M.; Tian, T.; Guo, D.; Wang, L.; Chen, Y.; Liang, X. Evaluation and analysis the chalkiness of connected rice kernels based on image processing technology and support vector machine. J. Cereal Sci. 2014, 60, 426–432. [Google Scholar] [CrossRef]

| Ranking | Feature | Weight | Ranking | Feature | Weight |
|---|---|---|---|---|---|
| 1 | Area Ratio (M) | 0.096 | 21 | Blue GLCM Entropy (T) | 0.05 |
| 2 | Area (M) | 0.091 | 22 | Haralik Ratio (M) | 0.047 |
| 3 | First invariant moment (M) | 0.091 | 23 | X2 GLCM Entropy (T) | 0.045 |
| 4 | Minor Axis (M) | 0.088 | 24 | X3 GLCM Entropy (T) | 0.044 |
| 5 | Mean Radius (M) | 0.087 | 25 | Sixth Fourier descriptor (M) | 0.044 |
| 6 | Major Axis (M) | 0.083 | 26 | Blue GLCM Correlation (T) | 0.044 |
| 7 | Radius Standard Deviation (M) | 0.08 | 27 | X GLCM Entropy (T) | 0.044 |
| 8 | Solidity (M) | 0.08 | 28 | Hue Mean (C) | 0.044 |
| 9 | Maximum Radius (M) | 0.077 | 29 | Green GLCM Entropy (T) | 0.042 |
| 10 | Perimeter (M) | 0.075 | 30 | Blue Mean (C) | 0.042 |
| 11 | Saturation Mean (C) | 0.074 | 31 | Sixth invariant moment (M) | 0.042 |
| 12 | Minimum Radius (M) | 0.073 | 32 | Red Standard Deviation (C) | 0.042 |
| 13 | First Fourier descriptor (M) | 0.071 | 33 | Green GLCM Contrast (T) | 0.041 |
| 14 | Third Fourier descriptor (M) | 0.066 | 34 | X GLCM Homogeneity (T) | 0.04 |
| 15 | Saturation Standard deviation (C) | 0.064 | 35 | Red GLCM Homogeneity (T) | 0.04 |
| 16 | Red Mean (C) | 0.061 | 36 | X1 GLCM Entropy (T) | 0.04 |
| 17 | Green Mean (C) | 0.061 | 37 | Red Varians (C) | 0.04 |
| 18 | Saturation Variance (C) | 0.059 | 38 | X1 GLCM Homogeneity (T) | 0.04 |
| 19 | Red GLCM Contrast (T) | 0.055 | 39 | X1GLCM Contrast (T) | 0.04 |
| 20 | Red GLCM Entropy (T) | 0.053 | 40 | Green GLCM homogeneity (T) | 0.039 |
| Classification Models | Kernel Classes | Mean of Classifyication Accuracy | ||||||
|---|---|---|---|---|---|---|---|---|
| a | b | c | d | e | f | g | ||
| LDA | 99.7 | 93.7 | 99.7 | 95.7 | 98.7 | 94.7 | 83 | 95 |
| QDA | 98 | 98.3 | 100 | 98 | 98.3 | 97.7 | 86.3 | 96.7 |
| LSVM | 99 | 98 | 100 | 98 | 98.7 | 98.3 | 90 | 97.4 |
| QSVM | 98.7 | 98 | 100 | 97.3 | 99 | 99.3 | 90.7 | 97.6 |
| CSVM | 99 | 97.7 | 100 | 98 | 99 | 99.3 | 87.7 | 97.2 |
| Target Classes | Test Samples | Output Classes | Classification Accuracy | ||||||
|---|---|---|---|---|---|---|---|---|---|
| a | b | c | d | e | f | g | |||
| a | 300 | 296 | 2 | 0 | 0 | 1 | 0 | 1 | 98.7 |
| b | 300 | 0 | 294 | 0 | 0 | 0 | 0 | 6 | 98 |
| c | 300 | 0 | 0 | 300 | 0 | 0 | 0 | 0 | 100 |
| d | 300 | 0 | 0 | 3 | 292 | 3 | 0 | 2 | 97.3 |
| e | 300 | 1 | 1 | 0 | 1 | 297 | 0 | 0 | 99 |
| f | 300 | 0 | 0 | 0 | 0 | 0 | 298 | 2 | 99.3 |
| g | 300 | 3 | 13 | 0 | 5 | 2 | 5 | 272 | 90.7 |
Publisher’s Note: MDPI stays neutral with regard to jurisdictional claims in published maps and institutional affiliations. |
© 2022 by the authors. Licensee MDPI, Basel, Switzerland. This article is an open access article distributed under the terms and conditions of the Creative Commons Attribution (CC BY) license (https://creativecommons.org/licenses/by/4.0/).
Share and Cite
Fazel-Niari, Z.; Afkari-Sayyah, A.H.; Abbaspour-Gilandeh, Y.; Herrera-Miranda, I.; Hernández-Hernández, J.L.; Hernández-Hernández, M. Quality Assessment of Components of Wheat Seed Using Different Classifications Models. Appl. Sci. 2022, 12, 4133. https://doi.org/10.3390/app12094133
Fazel-Niari Z, Afkari-Sayyah AH, Abbaspour-Gilandeh Y, Herrera-Miranda I, Hernández-Hernández JL, Hernández-Hernández M. Quality Assessment of Components of Wheat Seed Using Different Classifications Models. Applied Sciences. 2022; 12(9):4133. https://doi.org/10.3390/app12094133
Chicago/Turabian StyleFazel-Niari, Zargham, Amir H. Afkari-Sayyah, Yousef Abbaspour-Gilandeh, Israel Herrera-Miranda, José Luis Hernández-Hernández, and Mario Hernández-Hernández. 2022. "Quality Assessment of Components of Wheat Seed Using Different Classifications Models" Applied Sciences 12, no. 9: 4133. https://doi.org/10.3390/app12094133
APA StyleFazel-Niari, Z., Afkari-Sayyah, A. H., Abbaspour-Gilandeh, Y., Herrera-Miranda, I., Hernández-Hernández, J. L., & Hernández-Hernández, M. (2022). Quality Assessment of Components of Wheat Seed Using Different Classifications Models. Applied Sciences, 12(9), 4133. https://doi.org/10.3390/app12094133