
Tea Infusions as a Source of Phenolic Compounds in the Human Diet


Department of Commodity Science and Food Analysis, The Faculty of Food Science, University of Warmia and Mazury in Olsztyn, 10-719 Olsztyn, Poland
Appl. Sci. 2022, 12(9), 4227; https://doi.org/10.3390/app12094227
Submission received: 26 February 2022
/
Revised: 2 April 2022
/
Accepted: 20 April 2022
/
Published: 22 April 2022
(This article belongs to the Special Issue Antioxidants in Foods: From Properties to Applications)
Abstract
:Phenolic compounds are components with proven beneficial effects on the human body, primarily due to their antioxidant activity. In view of the high consumption of tea and the numerous factors that affect the nutritional value of its infusions, the aim of this study was to identify the effects of tea type and duration of leaf extraction with water on the levels of phenolic compounds and other components that determine biological activity (oxalates, Ca, Na, Cu, and Mn). Based on assays, infusions of red tea prepared for 20 min were found to be the best source of phenolics (202.9 mg/100 mL), whereas the lowest level of these compounds was determined in infusions of black tea extracted from leaves for 30 min (46.9 mg/100 mL). The highest degree of increase in polyphenol content (by approx. 50%) was noted in red and green tea infused for between 10 and 20 min, whereas for black tea, polyphenol levels decreased with time. The biological activity of tea infusions appears to be determined to the greatest extent by the interactions between phenolic compounds and oxalates (r = 0.6209), calcium (r = 0.8516), and sodium (0.8045). A daily intake of three to four mugs (1 L) of tea infusions provides the human body the entire amount of phenolics recommended for health reasons (as regards red tea, this is possible at 1/3 of the volume) and covers the daily requirement for manganese, as well as (partially) copper.
1. Introduction
Tea (Camelia sinensis) is a beverage consumed in large quantities worldwide and is associated with both sensory characteristics and nutritional value. Among the most important chemical components found in tea leaves are phenolic compounds, the health-promoting effects of which are mainly due to their strong antioxidant effects [1,2]. The prevention of oxidative reactions is important because oxidative stress, which generates free radicals, underlies the development and progression of many diseases, particularly those classified as lifestyle diseases [3]. The phenolic compounds found in tea primarily include tannins and catechins, as well as their derivatives. The predominant compounds found in tea leaves are flavan-3-ols, the levels and structure of which change during processing [4,5,6]. The main phenolics found in green tea are monomeric catechins, including epicatechin, epigallocatechin, epicatechin gallate, and epigallocatechin gallate; during the fermentation processes, these compounds can be partially oxidized to dimers, such as theasinensins, theaflavins, and other high-molecular-weight polyphenols [5,7].
Epidemiological studies indicate the occurrence of statistically significant correlational relationships between polyphenol intake and the reduced incidence of certain types of neoplasms and other chronic diseases, e.g., cardiovascular or neurogenerative diseases and type II diabetes [3,5]. Polyphenols can also exhibit antimutagenic, antiatherosclerotic, antiostereoporotic, antiallergic, antiviral, and antibacterial action [2,8]. They can also decrease sugar levels in blood, reduce body weight, and regulate cholesterol levels and also exhibit an antidepressant effect and reduced mortality due to COVID-19 [3,9,10].
Many authors report that the antioxidant activity of phenolic compounds is largely due to the content of minerals, particularly copper and manganese [5,11,12]. The interactions occurring between polyphenolics and minerals can result in an increase in mutual activity, but they can also reduce such activity by forming insoluble bonds. The direction of interaction is determined by the levels of these compounds and the chemical forms they take, as well as the contents of other components found in foodstuffs, particularly oxalates, phytates, and polyphosphates [13,14]. Of all the compounds mentioned above, it appears that the interactions between polyphenols (particularly those of the tannin fraction), oxalic acid, and certain minerals are of particular importance in tea infusions.
Oxalic acid is a bicarboxylic acid that, by forming insoluble salts with divalent and trivalent metals, reduces their utilization from food [15,16]. In plant tissues, this occurs in two forms: soluble (including sodium and potassium oxalates) and insoluble (including calcium and magnesium salts). An excessive supply of these compounds can cause many conditions, the most common of which is kidney stone disease [17]. Studies have demonstrated that tea, although containing oxalates, has an inhibitory effect on the formation of kidney stones, as the oxalates found in tea are hardly absorbed from the gastrointestinal tract, and epigallocatechin gallate, which is found in the tea leaves in large quantities, has an inhibitory effect on the formation of kidney stones [18,19,20]. Most researchers claim that for an average tea consumption at a level of 1 L per day, the levels of oxalic acid and its salts found in tea infusions pose no hazard to human health, and due to the high content of phenolic compounds and certain elements, tea should be regarded as a product with a very high nutritional value [17,20,21,22,23].
The contents of components found in the tea leaves are determined by many factors, e.g., the region and method of tea plant cultivation (soil type, fertilization, climatic conditions, etc.), the time and form of leaf harvest (including the leaf position on the plant), unit operations they undergo, and the duration of storage [12,23,24,25,26,27]. The market offers tea leaves that are minimally processed (e.g., white, yellow, or green tea), partially fermented (e.g., red tea), and fully fermented (e.g., black teas). The degree of processing has a significant effect on the nutritional value of infusions, and many studies indicate that the least processed teas are the best source of components that have a positive effect on human health, which is particularly noticeable for phenolic compounds [28,29,30,31]. A previous study by Klepacka et al. [5] conducted on 33 tea samples with different degrees of leaf processing showed that the polyphenolics content was almost twice as high in infusions of unfermented green tea compared to fully fermented black tea. Studies by other authors [3,9,10,16,20,24,29,32] have also confirmed the high content of phenolic compounds in green tea.
Oxalate levels appear to be most affected by the anatomical part of the tea plant from which they originate [33,34]. Most of these compounds occur in old and hard, low-positioned leaves (used to produce poorer-quality teas), whereas few are found in the small leaves on the top of the plant with the addition of top buds and new leaf primordia (used to produce higher-quality teas) [13,15,17]. Savage and Klunklin [35] reported that in various types of tea leaves of different quality offered on the market, the oxalate content can range from 300 to 2000 mg/100 g fresh leaves, whereas much smaller differences in the levels of these compounds are noted when analyzing the effect of the factors related to the infusion method [33,36].
Consumers prepare tea infusions in different ways by extracting tea leaves with water at different temperatures and leaving it in contact with the tea leaves for different lengths of time; some consumers brew the same leaves several times. Each of these infusion methods has a significant effect on the degree of extraction of the compounds found in the tea leaves, which results in varying nutritional values of the infusions [26,37]. Almeida et al. [32] and Chang et al. [1] indicate the significance of the temperature of the water used to make tea infusions, whereas Cabrera et al. [24] are of the opinion that water hardness is also of importance. Mehra and Baker [38] noted the effect of the number of leaf extractions with water, and Nordin et al. [4] and Erdemir [39] believe that the most important factor affecting the nutritional value of tea infusions is the duration of contact between the leaves and water.
In view of the widespread consumption of tea, its significant role in people’s daily diet, and the occurrence of numerous factors that affect the nutritional value of its infusions, the aim of this study was to identify the effects of tea type and time of tea leaf extraction with water on phenolic compound levels. An additional aim of the study was to determine the relationships between the contents of these compounds and the levels of oxalates and selected minerals (Ca, Na, Cu, and Mn) determined in the tea infusions.
2. Materials and Methods
2.1. Food Samples
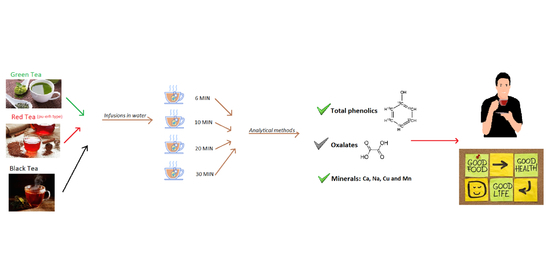
The study material comprised the leaves of three different tea types, namely green, red (pu-erh type), and black with no additives, originating from a single harvest site (Yunnan Province, Southern China) and purchased in July 2019 in a shop in Olsztyn (Warmia and Mazury region, Poland) belonging to a chain of specialized tea shops.
The infusions were prepared by pouring 100 mL boiling deionized water (obtained in a Millipore Simplicity water purification system; Merck, Darmstadt, Germany) into 2.0 g of a tea material. After 6, 10, 20, and 30 min of brewing under cover, infusions were mixed and filtered through paper filters (Eurochem BGD, Tarnów, Poland), and from the obtained solutions, samples were immediately used for further research. All assays were performed in triplicate.
2.2. Determination of Total Content of Phenolic Compounds
The total phenolics were determined spectrophotometrically according to the Ribereau-Gayon method [40] and the modifications by Singleton et al. [41] and Guo et al. [42] via the addition of 0.5 mL of Folin–Ciocalteu reagent (Aktyn, Suchy Las, Poland) and 3 mL of 14% sodium carbonate (Stanlab, Lublin, Poland) to tea infusions (0.04 mL) and after 1 h measurement of the absorbance at a wavelength of 720 nm against the reference sample (Thermo Scientific, Helios Zeta UV-VIS, Madison, WI, USA). The results were expressed as gallic acid equivalent with a reference curve plotted for this acid (y = 0.007x − 0.0066, R2 = 0.999).
2.3. Determination of Oxalate Content
The soluble oxalate content was determined by titration [13] using 10 mL of the prepared infusions, which were transferred to a centrifuge tube, to which 5 mL of 5% calcium chloride solution (Standard, Lublin, Poland) and 5 mL of acetone (Standard, Poland) were added. Then, solutions were cooled at 6 °C for 30 min and centrifuged at 3000× g for 15 min (MPW-350R, MPW Med. Instruments, Warszawa, Poland). The sediment was dissolved in a 10% sulfuric acid solution (Chempur, Piekary Śląskie, Poland) and was titrated with a 0.02 M potassium permanganate solution (Tarchem, Tarnowskie Góry, Poland).
2.4. Determination of Calcium, Copper, and Manganese
The contents of individual minerals were determined by flame atomic absorption spectrometry (acetylene/air flame) using a Thermo iCE 3000 Series (Waltham, MA, USA) atomic absorption spectrometer with a Glite data station, background correction (deuterium lamp), and appropriate cathode lamps [43]. For calcium determination, a 10% aqueous solution of lanthanum chloride was added to all measured solutions in a quantity ensuring a final La+3 concentration of 1%. Determination of the selected elements was performed at the following wavelengths: 422.7 (Ca), 324.8 nm (Cu), and 279.5 nm (Mn).
The method was validated by a simultaneous analysis of reference material (INCT-TL-1, tea leaves) with an accuracy for Ca, Cu, and Mn of 99.1%, 99.0%, and 96.8%, respectively.
2.5. Determination of Sodium
The concentration of sodium was determined by the emission technique (acetylene/air flame). The analyses were performed using a Thermo iCE 3000 Series atomic absorption spectrometer (Waltham, MA, USA) equipped with a Glite data station operating in an emission system. Determination was carried out at a wavelength of 589.0 nm.
The method was validated by a simultaneous analysis of reference material (INCT-TL-1, tea leaves) with an accuracy for Na of 101.6%.
2.6. Statistical Data Analysis
The data were analyzed using the Statistica 13.3 software package (StatSoft, Kraków, Poland, 2017). Significant differences were calculated according to the ANOVA analysis and Duncan’s multiple range test. Differences at the 5% level were considered statistically significant. Correlation coefficients between analyzed components were determined by Pearson’s correlation analysis at the p < 0.05 confidence level. Hierarchical cluster analysis was carried out using the amalgamation rule with the Euclidean distance measure. The results are presented as a hierarchical tree graph with single bonds.
3. Results and Discussion
The infusions of the analyzed tea were found to be a very good source of phenolic compounds, the content of which, depending on the tea type and leaf extraction time, ranged from 46.9 to 202.9 mg/100 mL (Table 1). Many authors have determined the phenolic compounds in tea infusions at a similar level [4,5,32,37].
Red tea infusions proved to be the best source of these components, as they contained, during each analyzed brewing time, larger amounts of phenolic compounds than the infusions obtained from the other teas (Table 1, Figure 1). These differences became particularly noticeable as the duration of leaf extraction with water increased, as evidenced by the fact that briefly prepared red tea infusions contained phenolics at levels almost twice as high as the infusions made from the other tea types, and after 20 min of contact between the leaves and water, these differences were more than four times greater.
The high polyphenolic content in red tea infusions was confirmed by Garbowska et al. [16], who concluded that they contain phenolic compounds at levels up to 199.8 mg/100 mL (which confirms the values determined by the author of the current study for pu-erh tea infusions prepared for longer than 20 min). Many authors argue that the best source of polyphenols are unfermented green teas [5,44,45,46], although depending on their origin and type of leaves, some contain lower levels of these compounds [9,16,47]. Figure 2 shows the classification of plant phenolics with the indication of their types that are most important in the case of tea leaves and which changes occurring during their processing determine the properties of tea infusions to the greatest extent. Such a high phenolic compound content in red tea leaves may be due to the considerable changes that occur in individual fractions of these compounds under the influence of the fermentation process conducted for this kind of tea. For most tea types, this process is carried out by polyphenol oxidase, which occurs naturally in tea plant leaves. However, during the production of red (pu-erh) tea, this enzyme is inactivated, and the fermentation process is carried out by a variety of microorganisms (e.g., Aspergillus niger, Penicillium, Rhizopus, Aspergillus glaucus, Saccharomyces, and Bacterium). Depending on the fermentation conditions (how the leaves are arranged, temperature, time, moisture content, etc.), the proportion of individual strains varies, which gives pu-erh tea specific sensory characteristics but also results in considerable changes in its chemical composition [48]. During such a fermentation process, catechins and their gallate derivatives are oxidized to complex phenolic tea pigments, including theaflavins, thearubigins, and theabrownins (Figure 2). Theaflavins undergo further oxidation to form more polymerized thearubigins, which are then condensed to theabrownins [44,49]. These changes result, e.g., in changes in the bonds formed by phenolic compounds with other components found in tea leaves, which leads to changes in their solubility and can result in greater quantities of these compounds being transferred to red tea water infusions.
Pu-erh tea infusions were also found to be the best source of calcium and sodium, the contents of which, compared to the other tea types, were up to five times higher and, depending on the duration of infusion, ranged from 250.3 to 282.2 µg/100 mL (for calcium) and from 260.12 to 262.13 µg/100 mL (for sodium). The particularly high content of these elements in red tea infusions was confirmed by the author’s previous study [5] and research by Garbowska et al. [16], who reported that red tea infusions contain calcium levels three times higher than those found in green or black tea. A study by the same team also demonstrated a particularly high sodium level in red tea leaves, with levels 20 times higher than in other tea types, which authors attributed to the high salinity of the soil in which the tea plants were cultivated.
In red tea infusions, oxalates were also found in rather large quantities, with the highest level determined in infusions prepared for 20 and 30 min (29.05 and 28.71 mg/100 mL). These values were not significantly different from those detected in green tea; infusions prepared for 30 min contained oxalates at the level of 30.88 mg/100 mL. A high oxalate content in red tea was also indicated by Charrier et al. [15] and Garbowska et al. [16], who reported that its infusions contained these compounds at a level of 28 mg/100 mL. The differences in oxalate content observed between the analyzed infusions were not as noticeable as those for phenolic compounds. In black tea infusions with the lowest oxalate content, they were present at concentrations of 17.19 to 19.93 mg/100 mL, which is in line with the results obtained by other authors [13,33,36]. What is puzzling is that the lowest oxalate content was found in black tea infusions, as compared to the other types of tea. According to technological assumptions, the leaves used most commonly for the production of black tea are older and harder than those used for the production of green tea, which is expected to result in an increased oxalic acid content [33,35]. Some authors have confirmed the trend towards the highest oxalate content being found in black teas [13,16], whereas others claim that green tea contains these compounds at higher levels [19,33]. The source of the discrepancies in the results published by different authors may be the varying size and structure of tea leaves used as raw material, different conditions of tea plant cultivation, and different time and methods of harvesting leaves, as well as the duration, conditions, and method of storage [13,14,23].
There was also little variation in copper levels in the tea infusions under analysis. Depending on the type and method of fermentation of the analyzed tea leaves and the time of their extraction, copper content ranged from 2.30 µg/100 mL (determined in a red tea infusion prepared for 20 min) to 8.42 µg/100 mL (determined in black tea leaves extracted for 6 min). The low variation in copper levels in tea leaves is also indicated by a study by Konieczyński et al. [27], who detected no statistically significant differences in the levels of this element among differently cultivated leaves of the same type of tea and between leaves processed by different methods.
The analyzed tea infusions were a rich source of manganese, with its best source being the leaves of green tea, which contained the element at levels ranging from 370.8 to 560.2 µg/100 mL. They contained the largest quantity of manganese as compared to the infusions of the other types of tea for each of the analyzed brewing times; the differences found were, in certain cases, more than two-fold. This trend was also confirmed by a previous study conducted by the author of the current paper [5], which demonstrated that the average content of this element, determined for 16 different green tea types, amounted to 512 µg/100 mL, whereas for black teas (n = 11), its content was at a level of 286 µg/100 mL and, for red teas (n = 2), at a level of 219 µg/100 mL.
Having analyzed the effect of the duration of tea infusion preparation on the content of analyzed compounds, it can be stated that as the leaf extraction time increased to 20 min, the total content of phenolic compounds in the green and red tea infusions increased, and the highest pace of this process was noted between 10 and 20 min (Table 1 and Table 2). Over the next 10 min of the leaf contact with water, the level of these compounds in green tea infusions decreased by 30% and, for red tea, remained at the same level. The phenolic compound content in black tea decreased steadily with duration of infusion. Many authors reported changes in phenolics content under the influence of different methods of making infusions [1,12,24,26,46]. Almeida et al. [32] linked this to the change in the temperature of water used for phenolic compound extraction and reported that for green tea leaves, the largest increase in these components occurred when the water temperature dropped from 100 °C to 90 °C. These authors also observed a trend toward a steady decrease in the polyphenol levels in black tea infusions as the temperature of water used for the extraction decreased. Nordin et al. [4] linked the greater transfer of phenolic compounds to freshly prepared tea infusions to the fact that pouring boiling water over the leaves reduces viscosity and surface tension, which promotes their solubility and explains the reduction in their level with increased duration of leaf contact with water by the degradation of these compounds. Another factor that impedes the transfer of polyphenols to black tea infusions may be the structure of these compounds. For this type of tea, the production process involves the complete fermentation of the leaves, during which catechins are converted, under the influence of polyphenol oxidase, into compounds of higher molecular weight that can be difficult to extract from the tea leaves with water [50].
One of the components whose content in the infusions of all analyzed tea types increased steadily over the entire duration of leaf extraction with water was calcium, the levels of which in black tea infusions prepared for 30 min were higher by almost 60% as compared to infusions prepared for 6 min. An almost two times lower increase in the content of this element was observed during the prolonged leaf extraction process in green tea infusions, whereas an almost five times lower rate of increase was determined in red tea infusions. Differences in the levels of calcium passing from the leaves to the infusions of different tea types were also noted by Brzezicha-Cirocka et al. [13], who attributed them primarily to leaf structure and age (black tea is produced using older and harder leaves), whereas Pongrac et al. [51] additionally linked this phenomenon to the distribution of calcium in individual leaf tissues.
A clear increasing trend with increased time of leaf contact with water was also observed for oxalates and manganese. Red tea infusions prepared for 20 and 30 min contained almost two times more oxalates than the 6 min infusions, with the smallest (15%) increase in the content of these compounds noted in black tea infusions. A similar degree of increase in oxalate content in tea infusions prepared for a longer time was also indicated in a study by Honow et al. [19]. Moreover, Brzezicha-Cirocka et al. [13] confirmed the particularly high content of these compounds in red tea infusions, which they linked to the specific structure of red tea leaves.
Manganese content increased by almost 50% in the green and black tea infusions prepared for the longest time, whereas an almost 70% increase in the levels of this component was observed as the duration of red tea leaf extraction increased. The trend of a steady increase in manganese with duration of leaf contact with water was also confirmed by Erdemir [39], who demonstrated that depending on the analyzed tea type, the level of this element can increase by 20–49% of its initial quantity.
As for copper, no clear dependencies could be demonstrated as regards the change in its content as the time of extraction of the various types of tea leaves increased. Increased duration of green tea leaf contact with water resulted in increased levels of copper by 57% after 20 min of infusion, remaining almost unchanged for another 10 min. Different trends were observed for black tea, in which the copper content decreased with increased leaf extraction time, with the changes being the most intense at the beginning of the process. Initially, the level of this element in the red tea infusions increased (by almost 30% between 6 and 10 min of leaf contact with water); then, it decreased by almost 30%, finally increasing by approximately 10%. Mehra and Baker [38] confirmed the dependence of a greater quantity of copper passing from the leaves to the green tea infusions as compared to black tea, which they attribute to the formation of different species of this element in different tea types. These authors also believe that the polymerized phenolic compounds found in black tea can form soluble and insoluble bonds with the metals contained in the leaves, which contributes to the different rates and degrees of extraction with water.
It appears to be particularly important to identify the correlation relationships between the phenolic compound content and the levels of other components occurring in tea. Directly proportional correlation relationships were found between the total phenolics content and the oxalate, calcium, and sodium levels (Table 3). This means that as the oxalate, calcium, and sodium contents increase, the level of polyphenols found in tea infusions increases, which may indicate the similarity of chemical bonds formed by these compounds between one another and/or with other tea components. Areusz and Wesołowski [11] also demonstrated significant relationships between phenolic compounds and certain elements related to their similar chemical connections and interactions, which is important, especially during the metabolic processes occurring in the plants.
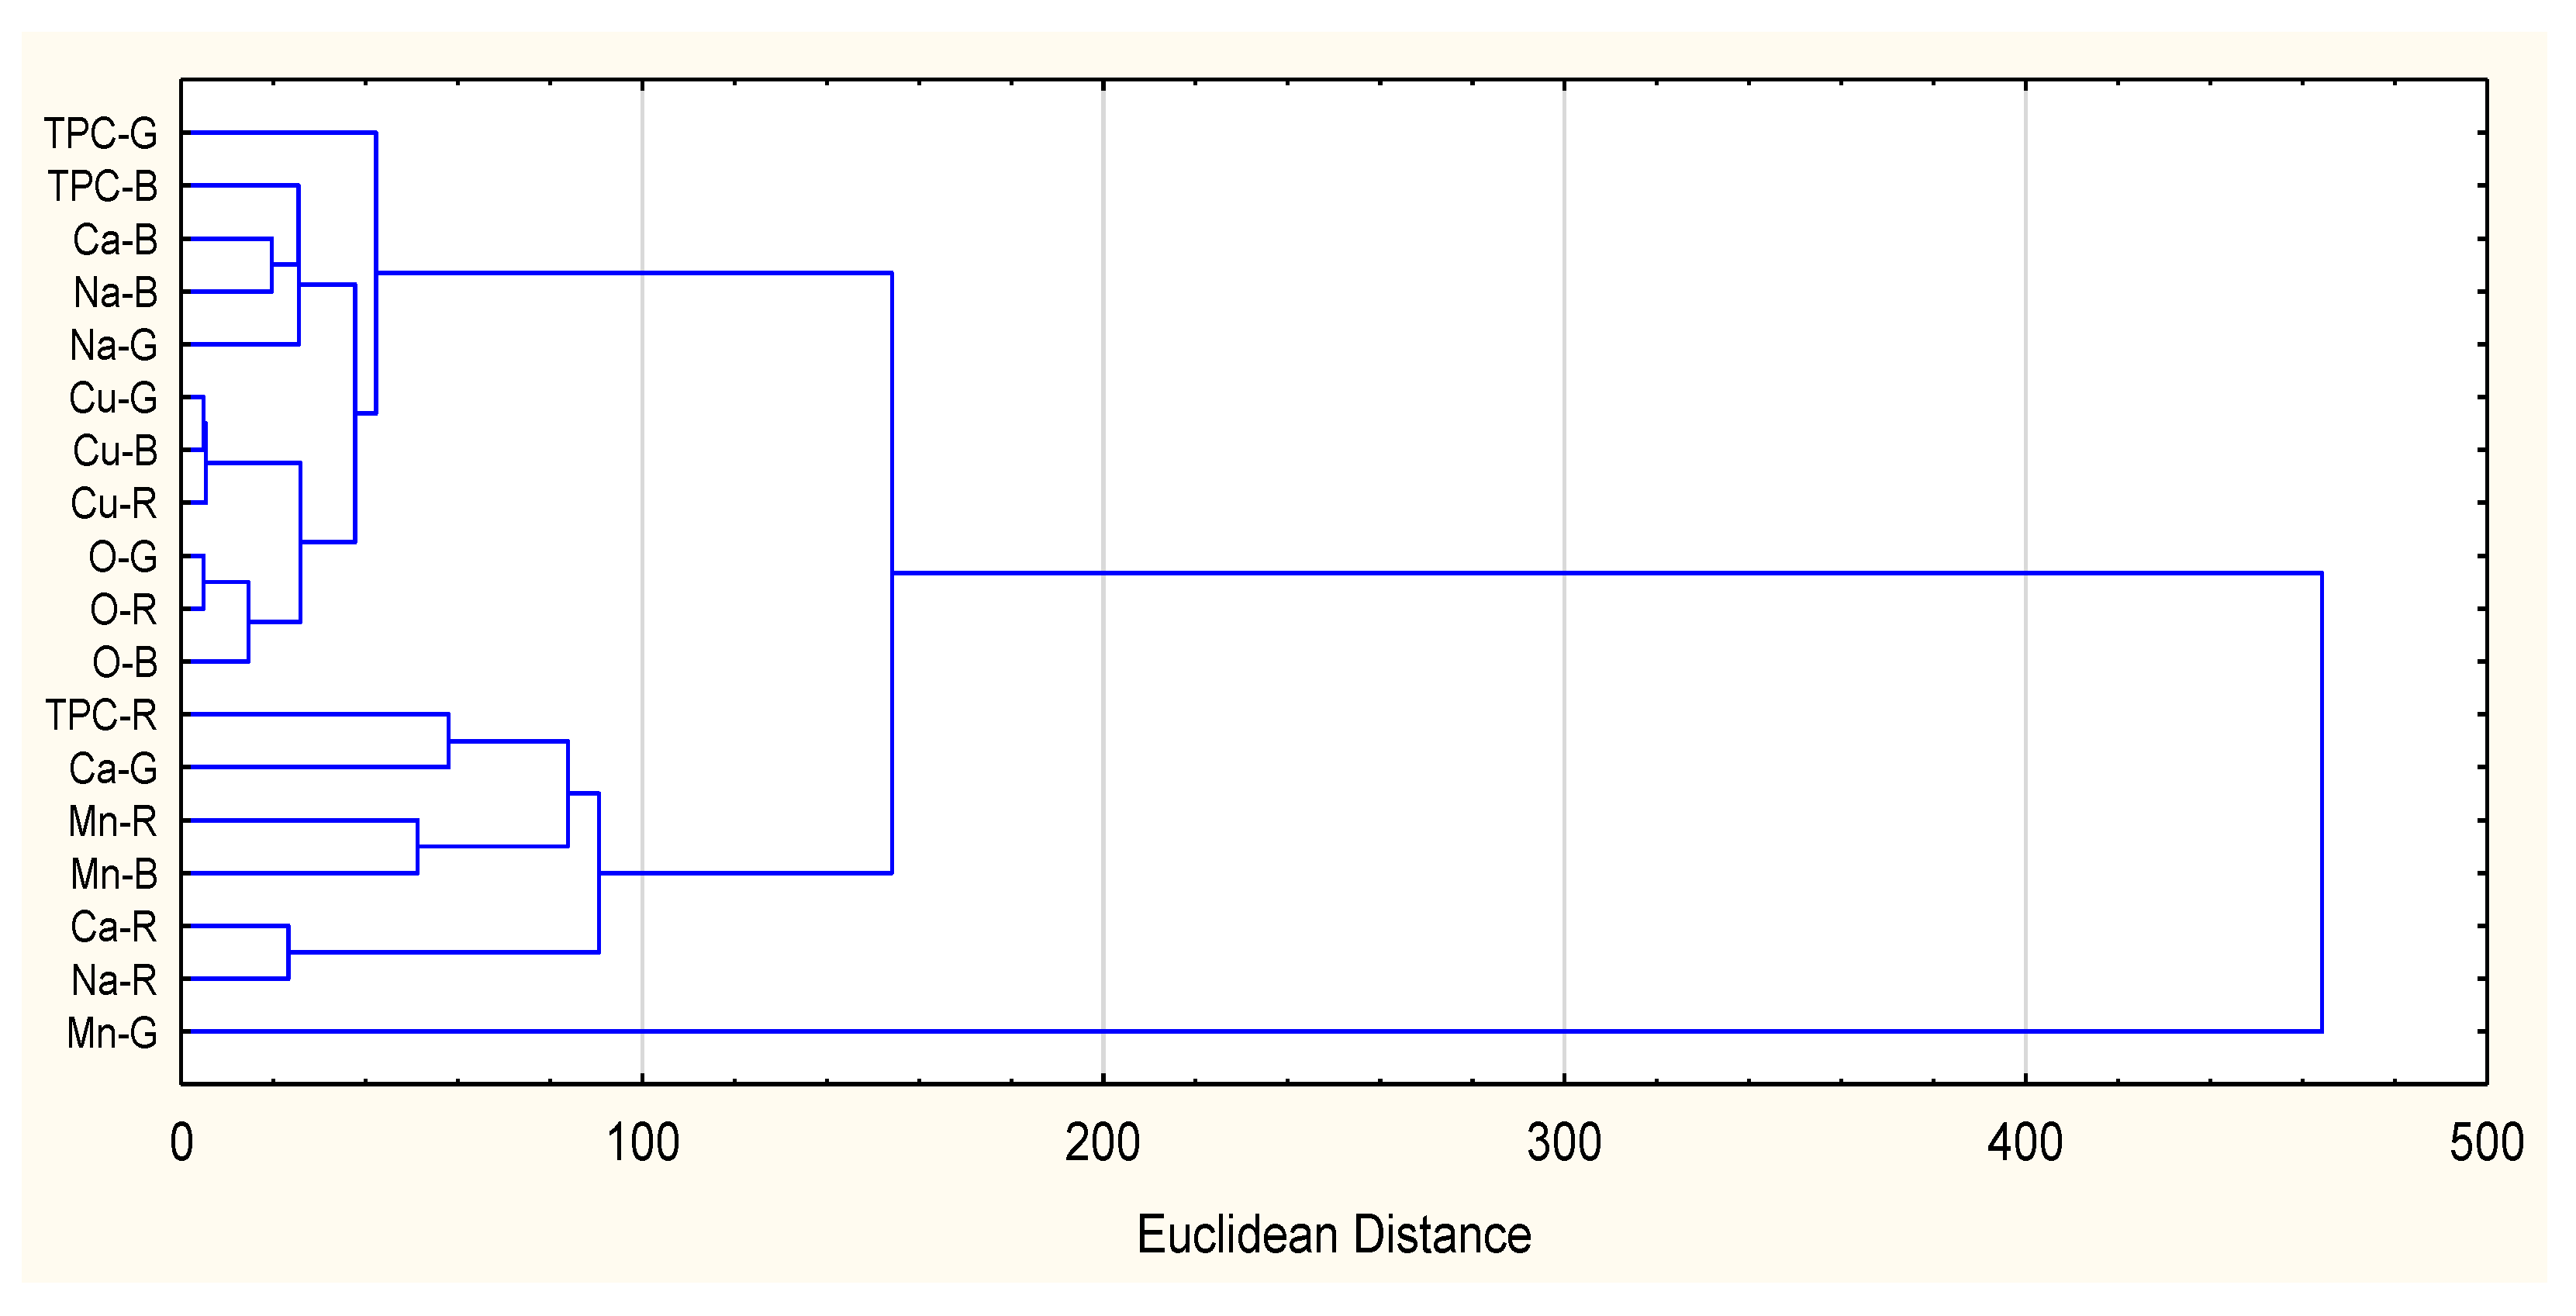
The relationship between polyphenols and oxalates (r = 0.6209, Table 3) is also confirmed by Figure 3, which shows that particular relationships between these components are found in green and black tea infusions. Strong correlation relationships were also observed between phenolic compounds, calcium, and sodium, for which the determined correlation coefficients amount to r = 0.8516 and r = 0.8045, respectively (Table 3). The data presented in Figure 3 indicate the exceptional significance of these relationships in black and red tea infusions and a much weaker relationship in green tea. The relationships between phenolic compounds and minerals were also indicated by Konieczyński et al. [27] and Erdemir [39], who stated that the direction of these relationships is determined by the phenolic compound type. In most of the cases analyzed by the authors, flavonoids formed inversely proportional relationships with mineral elements, whereas phenolic acids formed directly proportional relationships.
The data presented in Figure 3 show that during the preparation of black tea infusions, the relationships between the phenolic compound levels and the calcium and sodium contents appear to be of particular importance. Certain relationships were also found between the polyphenolics content and the manganese, calcium, and sodium contents in red tea infusions. The relationships noted between phenolic compounds and the sodium and copper contents found in green tea infusions appear to be only slightly significant.
Analysis of the dendrogram also enables the conclusion that the oxalate level demonstrates close relationships with, primarily, the analyzed type of tea leaves and their of copper content and can be related to phenolics content, primarily in black and green tea infusions. The fact that there are various dependencies observed between the components present in infusions prepared from different types of tea confirms the considerable impact of technological leaf treatment on the level and properties of their components [12,23,26,37].
Based on the individual component levels determined in this study, it is also important to identify the effect of average tea consumption, assumed to be three to four mugs (1 L) per day, on human health.
The components that raise many doubts are oxalates. According to the American Dietetic Association, the levels of oxalates in people with increased risk of kidney stones should not exceed 40–50 mg per day (of bioavailable compounds) [23]. The literature provides different levels of the determined bioavailability of oxalates from tea, although in most studies, it ranges from 4% to 9% [23,35,52]. Taking into account the highest level of these components, determined in green tea infusions prepared for 30 min (30.88 mg/100 mL, Table 1) and assuming the bioavailability of oxalates at a 9% level, it must be concluded that the intake of 1 L of the analyzed tea would result in absorption of oxalates at a level of 27.79 mg, which poses no threat to human health. The safety of tea associated with the level of these compounds appears to be even greater when considering the acceptable daily intake (ADI) established for these compounds, which amounts to 250 mg per person per day [30,53].
The tea components with the greatest health-promoting effect on the human body are phenolic compounds for which no specific daily requirements are established, as their intake is regarded as a recommended dietary pattern. Del Bo’ et al. [2] analyzed the literature data published over ten years and identified a relationship between the average intake of these compounds in an average diet consumed in various parts of the world and the incidence of specified diseases. Their study demonstrated that the lowest susceptibility to various illnesses was observed for polyphenol intake at a level of more than 500 mg and, in certain cases, 900 mg per day, as such doses determined the occurrence of a beneficial biological effect of their action. Based on the data provided in Table 1, it must be stated that with the average intake of all the analyzed tea infusions assumed to be three to four mugs (1 L) per day, it is possible to obtain beneficial health-promoting effects of phenolic compounds in relation to the provision of the lowest of the recommended levels of these compounds (500 mg). When consuming red tea infusions in which the time of leaf contact with water ranges from 10 to 30 min, it is possible to provide the body with a quantity of these compounds significantly exceeding both levels recommended for consumption.
It is also important to identify the contribution of tea infusions to the provision of the minerals for the body, the adequate level of which determine the correct course of many physiological processes. Table 4 presents the demand for individual mineral components and the degree to which it is satisfied by the consumption of 1 L of the analyzed infusions per day. For the analysis, selected infusions prepared for such duration at which the level of the determined components was the highest.
It was demonstrated that when applying leaf extraction with water longer than 10 min, the consumption of 1 L of infusions of all the analyzed tea types per day satisfies the daily requirement for manganese. Green tea infusions achieve this to the greatest extent, as it suffices to drink 300–400 mL of these infusions to satisfy the requirement for this element. This is important because of the health-promoting significance of manganese that is incorporated into a number of metalloenzymes [38] and is also involved in the growth and reproduction processes, in addition to stabilizing blood sugar levels [25]. Its deficiency not only results in delayed physical development, impaired fertility, and reduced glucose tolerance but can also result in skin lesions, impaired motor coordination, and a variety of neurological changes [25,54]. Such a high manganese level in tea infusions appears to pose no threat to human health, as no adverse health effects are observed when its intake is at a level of 8–9 mg per day [55].
The analyzed tea infusions were also found to be quite a good source of copper, the highest quantities of which were determined in black and green tea (Table 1). Drinking one liter of black tea satisfies the almost 9% daily requirement for this element (Table 4), which proves that black tea infusions can be a valuable supplement to the copper provided with the daily diet.
4. Conclusions
Tea infusions are a very good source of phenolic compounds in the everyday diet, and the levels of these components are determined by tea type, i.e., the properties of the tea leaves and the method of their processing. It is also important to remember that not only green tea and other non-fermented types of tea leaves can be a significant source of these compounds (as reported by many authors); it is also worth paying attention to red tea in this context. When making tea infusions, attention should be paid to the time of contact between the tea leaves and water, as prolonging this time to 6–20 min is particularly beneficial to the nutritional value of red and green tea. As regards black tea, a factor beneficial to the phenolics levels is the shortest possible contact of the leaves with water, which is probably due to the different structures of the phenolic compounds found in black tea. Phenolics found in black tea probably show the highest solubility during the initial 6 min of the leaves contact with water, and they can be degraded as the process is extended.
The levels of phenolic compounds found in tea infusions appear to be particularly affected by their interactions with oxalates, calcium, and sodium, as evidenced by the statistical significance of the correlation coefficients determined between them. It has also been found that the nature of the interaction between these ingredients depends on the way the tea leaves are processed, which affects the content and chemical properties of these compounds.
A daily intake of three to four mugs (1 L) of tea infusions provides the entire quantity of phenolics recommended for health reasons and covers the daily requirement for manganese, as well as (partially) copper, which confirms that the beneficial effects of tea on human health are primarily due to its significant antioxidant activity.
Funding
This project was financially supported by the Minister of Education and Science in the scope of the program entitled “Regional Initiative of Excellence” for the years 2019–2022; project No. 010/RID/2018/19; amount of funding: PLN 12.000.000.
Institutional Review Board Statement
Not applicable.
Informed Consent Statement
Not applicable.
Acknowledgments
I would like to thank Elżbieta Tońska for many years of friendship (not only in the field of work) and help with the analytical part of this study. I would also like to thank Ryszard Rafałowski for help in creating Figure 2.
Conflicts of Interest
The author declares no conflict of interest.
References
- Chang, M.Y.; Lin, Y.Y.; Chang, Y.C.; Huang, W.Y.; Lin, W.S.; Chen, C.Y.; Huang, S.L.; Lin, Y.S. Effects of Infusion and Storage on Antioxidant Activity and Total Phenolic Content of Black Tea. Appl. Sci. 2020, 10, 2685. [Google Scholar] [CrossRef] [Green Version]
- Del Bo’, C.; Bernardi, S.; Marino, M.; Porrini, M.; Tucci, M.; Guglielmetti, S.; Cherubini, A.; Carrieri, B.; Kirkup, B.; Kroon, P.; et al. Systematic review on polyphenol intake and health outcomes: Is there sufficient evidence to define a health-promoting polyphenol-rich dietary pattern? Nutrients 2019, 11, 1355. [Google Scholar] [CrossRef] [Green Version]
- Kandyliari, A.; Elmaliklis, I.N.; Kontopoulou, O.; Tsafkopoulou, M.; Komninos, G.; Ntzatha, C.; Petsas, A.; Karantonis, H.C.; Koutelidakis, A. An epidemiological study report on the antioxidant and phenolic content of selected mediterranean functional foods, their consumption association with the Body Mass Index, and consumers purchasing behavior in a sample of healthy Greek adults. Appl. Sci. 2021, 11, 7818. [Google Scholar] [CrossRef]
- Nordin, N.H.; Molan, A.L.; Chua, W.H.; Kruger, M.C. Total phenolic contents and antioxidant activities of selenium-rich black tea versus regular black tea. Am. J. Life Sci. Res. 2017, 5, 40–50. [Google Scholar]
- Klepacka, J.; Tońska, E.; Rafałowski, R.; Czarnowska-Kujawska, M.; Opara, B. Tea as a source of biologically active compounds in the human diet. Molecules 2021, 26, 1487. [Google Scholar] [CrossRef]
- Wang, J.Q.; Fu, Y.Q.; Chen, J.X.; Wang, F.; Feng, Z.H.; Yin, J.F.; Zeng, L.; Xu, Y.Q. Effects of baking treatment on the sensory quality and physicochemical properties of green tea with different processing methods. Food Chem. 2022, 380, 132217. [Google Scholar] [CrossRef]
- Paiva, L.; Lima, E.; Motta, M.; Marcone, M.; Baptista, J. Influence of seasonal and yearly variation on phenolic profiles, caffeine, and antioxidant activities of green tea (Camellia sinensis (L.) Kuntze) from Azores. Appl. Sci. 2021, 11, 7439. [Google Scholar] [CrossRef]
- Nardini, M. Phenolic compounds in food: Characterization and health benefits. Molecules 2022, 27, 783. [Google Scholar] [CrossRef]
- Nobari, H.; Saedmocheshi, S.; Chung, L.H.; Suzuki, K.; Maynar-Mariño, M.; Pérez-Gómez, J. An overview on how exercise with green tea consumption can prevent the production of reactive oxygen species and improve sports performance. Int. J. Environ. Res. Public Health 2022, 19, 218. [Google Scholar] [CrossRef]
- Yonekura, Y.; Terauchi, M.; Hirose, A.; Odai, T.; Kato, K.; Miyasaka, N. Daily coffee and green tea consumption is inversely associated with body mass index, body fat percentage, and cardio-ankle vascular index in middle-aged Japanese women: A cross-sectional study. Nutrients 2020, 12, 1370. [Google Scholar] [CrossRef]
- Arceusz, A.; Wesołowski, M. Essential metals and phenolic acids in commercial herbs and spices. Multivariate analysis of correlations among them. Open Chem. 2015, 13, 1196–1208. [Google Scholar] [CrossRef] [Green Version]
- Choi, S.H.; Kim, I.D.; Dhungana, S.K.; Kim, D.G. Comparison of quality characteristic and antioxidant potential of cultivated pu-erh and gushu pu-erh tea extracts at two temperatures. J. Pure Appl. Microbiol. 2018, 12, 1155–1161. [Google Scholar] [CrossRef]
- Brzezicha-Cirocka, J.; Grembecka, M.; Szefer, P. Oxalate, magnesium and calcium content in selected kinds of tea: Impact on human health. Eur. Food Res. Technol. 2016, 242, 383–389. [Google Scholar] [CrossRef] [Green Version]
- Brzezicha-Cirocka, J.; Grembecka, M.; Szefer, P. Analytical assessment of bio- and toxic elements distribution in pu-erh and fruit teas in view of chemometric approach. Biol. Trace Elem. Res. 2016, 174, 240–250. [Google Scholar] [CrossRef] [Green Version]
- Charrier, M.J.S.; Savage, G.P.; Vanhanen, L. Oxalate content and calcium binding capacity of tea and herbal teas. Asia Pac. J. Clin. Nutr. 2002, 11, 298–301. [Google Scholar] [CrossRef]
- Garbowska, B.; Wieczorek, J.K.; Polak-Śliwińska, M.; Wieczorek, Z.J. The content of minerals, bioactive compounds and anti-nutritional factors in tea infusions. J. Elem. 2017, 23, 369–380. [Google Scholar] [CrossRef]
- Jabłońska-Ryś, E. Effect of brewing method various tea types on content of soluble oxalates. Żywność Nauka Technol. Jakość 2012, 1, 187–195. (In Polish). Available online: https://agro.icm.edu.pl/agro/element/bwmeta1.element.agro-9ba88d48-90e3-4984-aca9-7b00aa5c0082?q=bwmeta1.element.agro-75c458ae-44d0-43ed-9b11-b35bc96076ca;6&qt=CHILDREN-STATELESS (accessed on 25 February 2022). (In Polish).
- Barghouthy, Y.; Corrales, M.; Doizi, S.; Somani, B.K.; Traxer, O. Tea and coffee consumption and pathophysiology related to kidney stone formation: A systematic review. World J. Urol. 2021, 39, 2417–2426. [Google Scholar] [CrossRef]
- Honow, R.; Gu, K.L.R.; Hesse, A.; Siener, R. Oxalate content of green tea of different origin, quality, preparation and time of harvest. Urol. Res. 2010, 38, 377–381. [Google Scholar] [CrossRef]
- Kanlaya, R.; Thongboonkerd, V. Protective effects of epigallocatechin-3-gallate from green tea in various kidney diseases. Adv. Nutr. 2019, 10, 112–121. [Google Scholar] [CrossRef]
- Gaeini, Z.; Bahadoran, Z.; Mirmiran, P.; Azizi, F. Tea, coffee, caffeine intake and the risk of cardio-metabolic outcomes: Findings from a population with low coffee and high tea consumption. Nutr. Metab. 2019, 16, 28. [Google Scholar] [CrossRef] [PubMed]
- Yagin, N.L.; Mahdavi, R.; Nikniaz, Z. Oxalate content of different drinkable dilutions of tea infusions after different brewing times. Health Promot. Perspect. 2012, 2, 218–222. [Google Scholar] [CrossRef] [Green Version]
- Chowaniak, M.; Niemiec, M.; Zhu, Z.; Rashidov, N.; Gródek-Szostak, Z.; Szeląg-Sikora, A.; Sikora, J.; Kuboń, M.; Fayzullo, S.A.; Mahmadyorzoda, U.M.; et al. Quality assessment of wild and cultivated green tea from different regions of China. Molecules 2021, 26, 3620. [Google Scholar] [CrossRef] [PubMed]
- Cabrera, M.; Taher, F.; Llantada, A.; Do, Q.; Sapp, T.; Sommerhalter, M. Effect of Water Hardness on Catechin and Caffeine Content in Green Tea Infusions. Molecules 2021, 26, 3485. [Google Scholar] [CrossRef] [PubMed]
- Karak, T.; Kutu, F.R.; Nath, J.R.; Sonar, I.; Paul, R.K.; Boruah, R.K.; Sanyal, S.; Sabhapondit, S.; Dutta, A.K. Micronutrients (B, Co, Cu, Fe, Mn, Mo and Zn) content in made tea (Camellia sinensis L.) and tea infusion with health prospect: A critical review. Crit. Rev. Food Sci. Nutr. 2017, 57, 2996–3034. [Google Scholar] [CrossRef] [PubMed]
- Kilic, C.; Can, Z.; Yilmaz, A.; Yildiz, S.; Turna, H. Antioxidant properties of same herbal teas (green tea, senna, corn silk, rosemary) brewed at different temperatures. Int. J. Second. Metab. 2017, 4, 142–148. [Google Scholar] [CrossRef]
- Konieczynski, P.; Viapiana, A.; Wesolowski, M. Comparison of infusions from black and green teas (Camellia sinensis L. Kuntze) and Erva-mate (Ilex paraguariensis A. St.-Hil.) based on the content of essential elements, secondary metabolites, and antioxidant activity. Food Anal. Methods 2017, 10, 3063–3070. [Google Scholar] [CrossRef] [Green Version]
- Zhao, C.-N.; Tang, G.-Y.; Cao, S.-Y.; Xu, X.-Y.; Gan, R.-Y.; Liu, Q.; Mao, Q.-Q.; Shang, A.; Li, H.-B. Phenolic profiles and antioxidant activities of 30 tea infusions from green, black, oolong, white, yellow and dark teas. Antioxidants 2019, 8, 215. [Google Scholar] [CrossRef] [Green Version]
- Prasanth, M.I.; Sivamaruthi, B.S.; Chaiyasut, C.; Tencomnao, T. A review of the role of green tea (Camellia sinensis) in antiphotoaging, stress resistance, neuroprotection, and autophagy. Nutrients 2019, 11, 474. [Google Scholar] [CrossRef] [Green Version]
- Rode, J.; Bazin, D.; Dessombz, A.; Benzerara, Y.; Letavernier, E.; Tabibzadeh, N.; Hoznek, A.; Tligui, M.; Traxer, O.; Daudon, M.; et al. Daily green tea infusions in hypercalciuric renal stone patients: No evidence for increased stone risk factors or oxalate-dependent stones. Nutrients 2019, 11, 256. [Google Scholar] [CrossRef] [Green Version]
- Safdar, N.; Sarfaraz, A.; Kazmi, Z.; Yasmin, A. Ten different brewing methods of green tea: Comparative antioxidant study. J. Appl. Biol. 2016, 4, 033–040. [Google Scholar] [CrossRef] [Green Version]
- Almeida, T.S.; Araujo, M.E.M.; Rodriguez, L.G.; Julio, A.; Mendes, B.G.; dos Santos, R.M.B.; Simoes, J.A.M. Influence of preparation procedures on the phenolic content, antioxidant and antidiabetic activities of green and black teas. Braz. J. Pharm. Sci. 2019, 55, 7695. [Google Scholar] [CrossRef]
- Rocha, D.P.; Pinto, G.F.; Silva, S.M.; Squissato, A.L.; Silva, S.G. A multi-pumping flow system for spectrophotometric determination of oxalate in tea. Microchem. J. 2020, 157, 104938. [Google Scholar] [CrossRef]
- Savage, G.; Klunklin, W. Oxalates are Found in Many Different European and Asian Foods-Effects of Cooking and Processing. J. Food Res. 2018, 7, 76–81. [Google Scholar] [CrossRef]
- Savage, G.; Charrier, M.; Vanhanen, L. Bioavailability of soluble oxalate from tea and the effect of consuming milk with the tea. Eur. J. Clin. Nutr. 2003, 57, 415–419. [Google Scholar] [CrossRef] [Green Version]
- Siener, R.; Seidler, A.; Voss, S.; Hesse, A. Oxalate content of beverages. J. Food Comps. Anal. 2017, 63, 184–188. [Google Scholar] [CrossRef]
- Zaguła, G.; Bajcar, M.; Saletnik, B.; Czernicka, M.; Puchalski, C.; Kapusta, I.; Oszmiański, J. Comparison of the effectiveness of water-based extraction of substances from dry tea leaves with the use of magnetic field assisted extraction techniques. Molecules 2017, 22, 1656. [Google Scholar] [CrossRef] [Green Version]
- Mehra, A.; Baker, C.L. Leaching and bioavailability of aluminium, copper and manganese from tea (Camellia sinensis). Food Chem. 2007, 100, 1456–1463. [Google Scholar] [CrossRef]
- Erdemir, U.S. Contribute of tea (Camellia sinensis L.) to recommended daily intake of Mg, Mn, and Fe: An in vitro bioaccessibility assessment. J. Food Compos. Anal. 2018, 69, 71–77. [Google Scholar] [CrossRef]
- Ribereau-Gayon, P. Plant Phenolics; Hafner Publishing Company: New York, NY, USA, 1972. [Google Scholar]
- Singleton, V.L.; Orthofer, R.; Lamuela-Raventós, R.M. Analysis of total phenols and other oxidation substrates and antioxidants by means of folin-ciocalteu reagent. Methods Enzymol. 1999, 299, 152–178. [Google Scholar]
- Guo, X.D.; Ma, Y.J.; Parry, J.; Gao, J.M.; Yu, L.L.; Wang, M. Phenolics content and antioxidant activity of tartary buckwheat from different locations. Molecules 2011, 16, 9850–9867. [Google Scholar] [CrossRef] [PubMed] [Green Version]
- Whiteside, P.; Miner, B. Pye Unicam Atomic Absorption Data Book; Pye Unicam Ltd.: Cambridge, UK, 1984. [Google Scholar]
- Chupeerach, C.; Aursalung, A.; Watcharachaisoponsiri, T.; Whanmek, K.; Thiyajai, P.; Yosphan, K.; Sritalahareuthai, V.; Sahasakul, Y.; Santivarangkna, C.; Suttisansanee, U. The effect of steaming and fermentation on nutritive values, antioxidant activities, and inhibitory properties of tea leaves. Foods 2021, 10, 117. [Google Scholar] [CrossRef] [PubMed]
- Alam, M.; Ali, S.; Ashraf, G.M.; Bilgrami, A.L.; Yadav, D.K.; Hassan, M.I. Epigallocatechin 3-gallate: From green tea to cancer therapeutics. Food Chem. 2022, 379, 132135. [Google Scholar] [CrossRef] [PubMed]
- Pinto, G.; Illiano, A.; Carpentieri, A.; Spinelli, M.; Melchiorre, C.; Fontanarosa, C.; di Serio, M.; Amoresano, A. Quantification of polyphenols and metals in Chinese tea infusions by Mass Spectrometry. Foods 2020, 9, 835. [Google Scholar] [CrossRef]
- Ma, B.; Wang, J.; Xu, C.; Wang, Z.; Yin, D.; Zhou, B.; Ma, C. Interrelation analysis between phenolic compounds and in vitro antioxidant activities in Pu-erh tea. LWT 2022, 158, 113117. [Google Scholar] [CrossRef]
- Lv, H.; Zhang, Y.; Lin, Z.; Liang, Y. Processing and chemical constituents of Pu-erh tea: A review. Food Res. Int. 2013, 53, 608–618. [Google Scholar] [CrossRef]
- Huang, F.; Zheng, X.; Ma, X.; Jiang, R.; Zhou, W.; Zhou, S.; Zhang, Y.; Lei, S.; Wang, S.; Kuang, J.; et al. Theabrownin from Pu-erh tea attenuates hypercholesterolemia via modulation of gut microbiota and bile acid metabolism. Nat. Commun. 2019, 10, 4971. [Google Scholar] [CrossRef] [Green Version]
- Zhang, S.; Ohland, C.; Jobin, C.; Sang, S. Degradation of black tea theaflavin through C-ring cleavage by gut microbiota. Food Sci. Hum. 2022, 11, 598–605. [Google Scholar] [CrossRef]
- Pongrac, P.; Tolra, R.; Hajiboland, R.; Vogel-Mikus, K.; Kelemen, M.; Vavpetic, P.; Pelicon, P.; Bercelo, J.; Regvar, M.; Poschenrieder, C. Contrasting allocation of magnesium, calcium and manganese in leaves of tea (Camellia sinensis (L.) Kuntze) plants may explain their different extraction efficiency into tea. Food Chem. Toxicol. 2020, 135, 110974. [Google Scholar] [CrossRef]
- Siener, R.; Hesse, A. Effect of black tea consumption on urinary risk factors for kidney stone formation. Nutrients 2021, 13, 4434. [Google Scholar] [CrossRef]
- Jaeger, P.; Robertson, W.G. Role of dietary intake and intestinal absorption of oxalate in calcium stone formation. Nephron Physiol. 2004, 98, 64–71. [Google Scholar] [CrossRef] [PubMed]
- Martins, A.C.; Morcillo, P.; Ijomone, O.M.; Venkataramani, V.; Harrison, F.E.; Lee, E.; Bowman, A.B.; Aschner, M. New insights on the role of manganese in Alzheimer’s disease and Parkinson’s disease. Int. J. Environ. Res. 2019, 16, 3546. [Google Scholar] [CrossRef] [PubMed]
- Jarosz, M. Nutrition Standards for the Polish Population; Food and Nutrition Institute: Warszawa, Poland, 2017; ISBN 978-83-86060-89-4. [Google Scholar]
- Podwika, W.; Kleszcz, K.; Krośniak, M.; Zagrodzki, P. Copper, Manganese, Zinc, and Cadmium in Tea Leaves of Different Types and Origin. Biol. Trace Elem. Res. 2018, 183, 389–395. [Google Scholar] [CrossRef] [PubMed] [Green Version]
- Brzezicha-Cirocka, J.; Grembecka, M.; Szefer, P. Monitoring of essential and heavy metals in green tea from different geographical origins. Environ. Monit. Assess. 2016, 188, 183. [Google Scholar] [CrossRef] [Green Version]
Figure 1.
The total content of phenolic compounds in tea infusions extracted with water for 6, 10, 20, and 30 min. a–c—values denoted by the same letters are not statistically different in the analyzed type of tea at p < 0.05.
Figure 1.
The total content of phenolic compounds in tea infusions extracted with water for 6, 10, 20, and 30 min. a–c—values denoted by the same letters are not statistically different in the analyzed type of tea at p < 0.05.
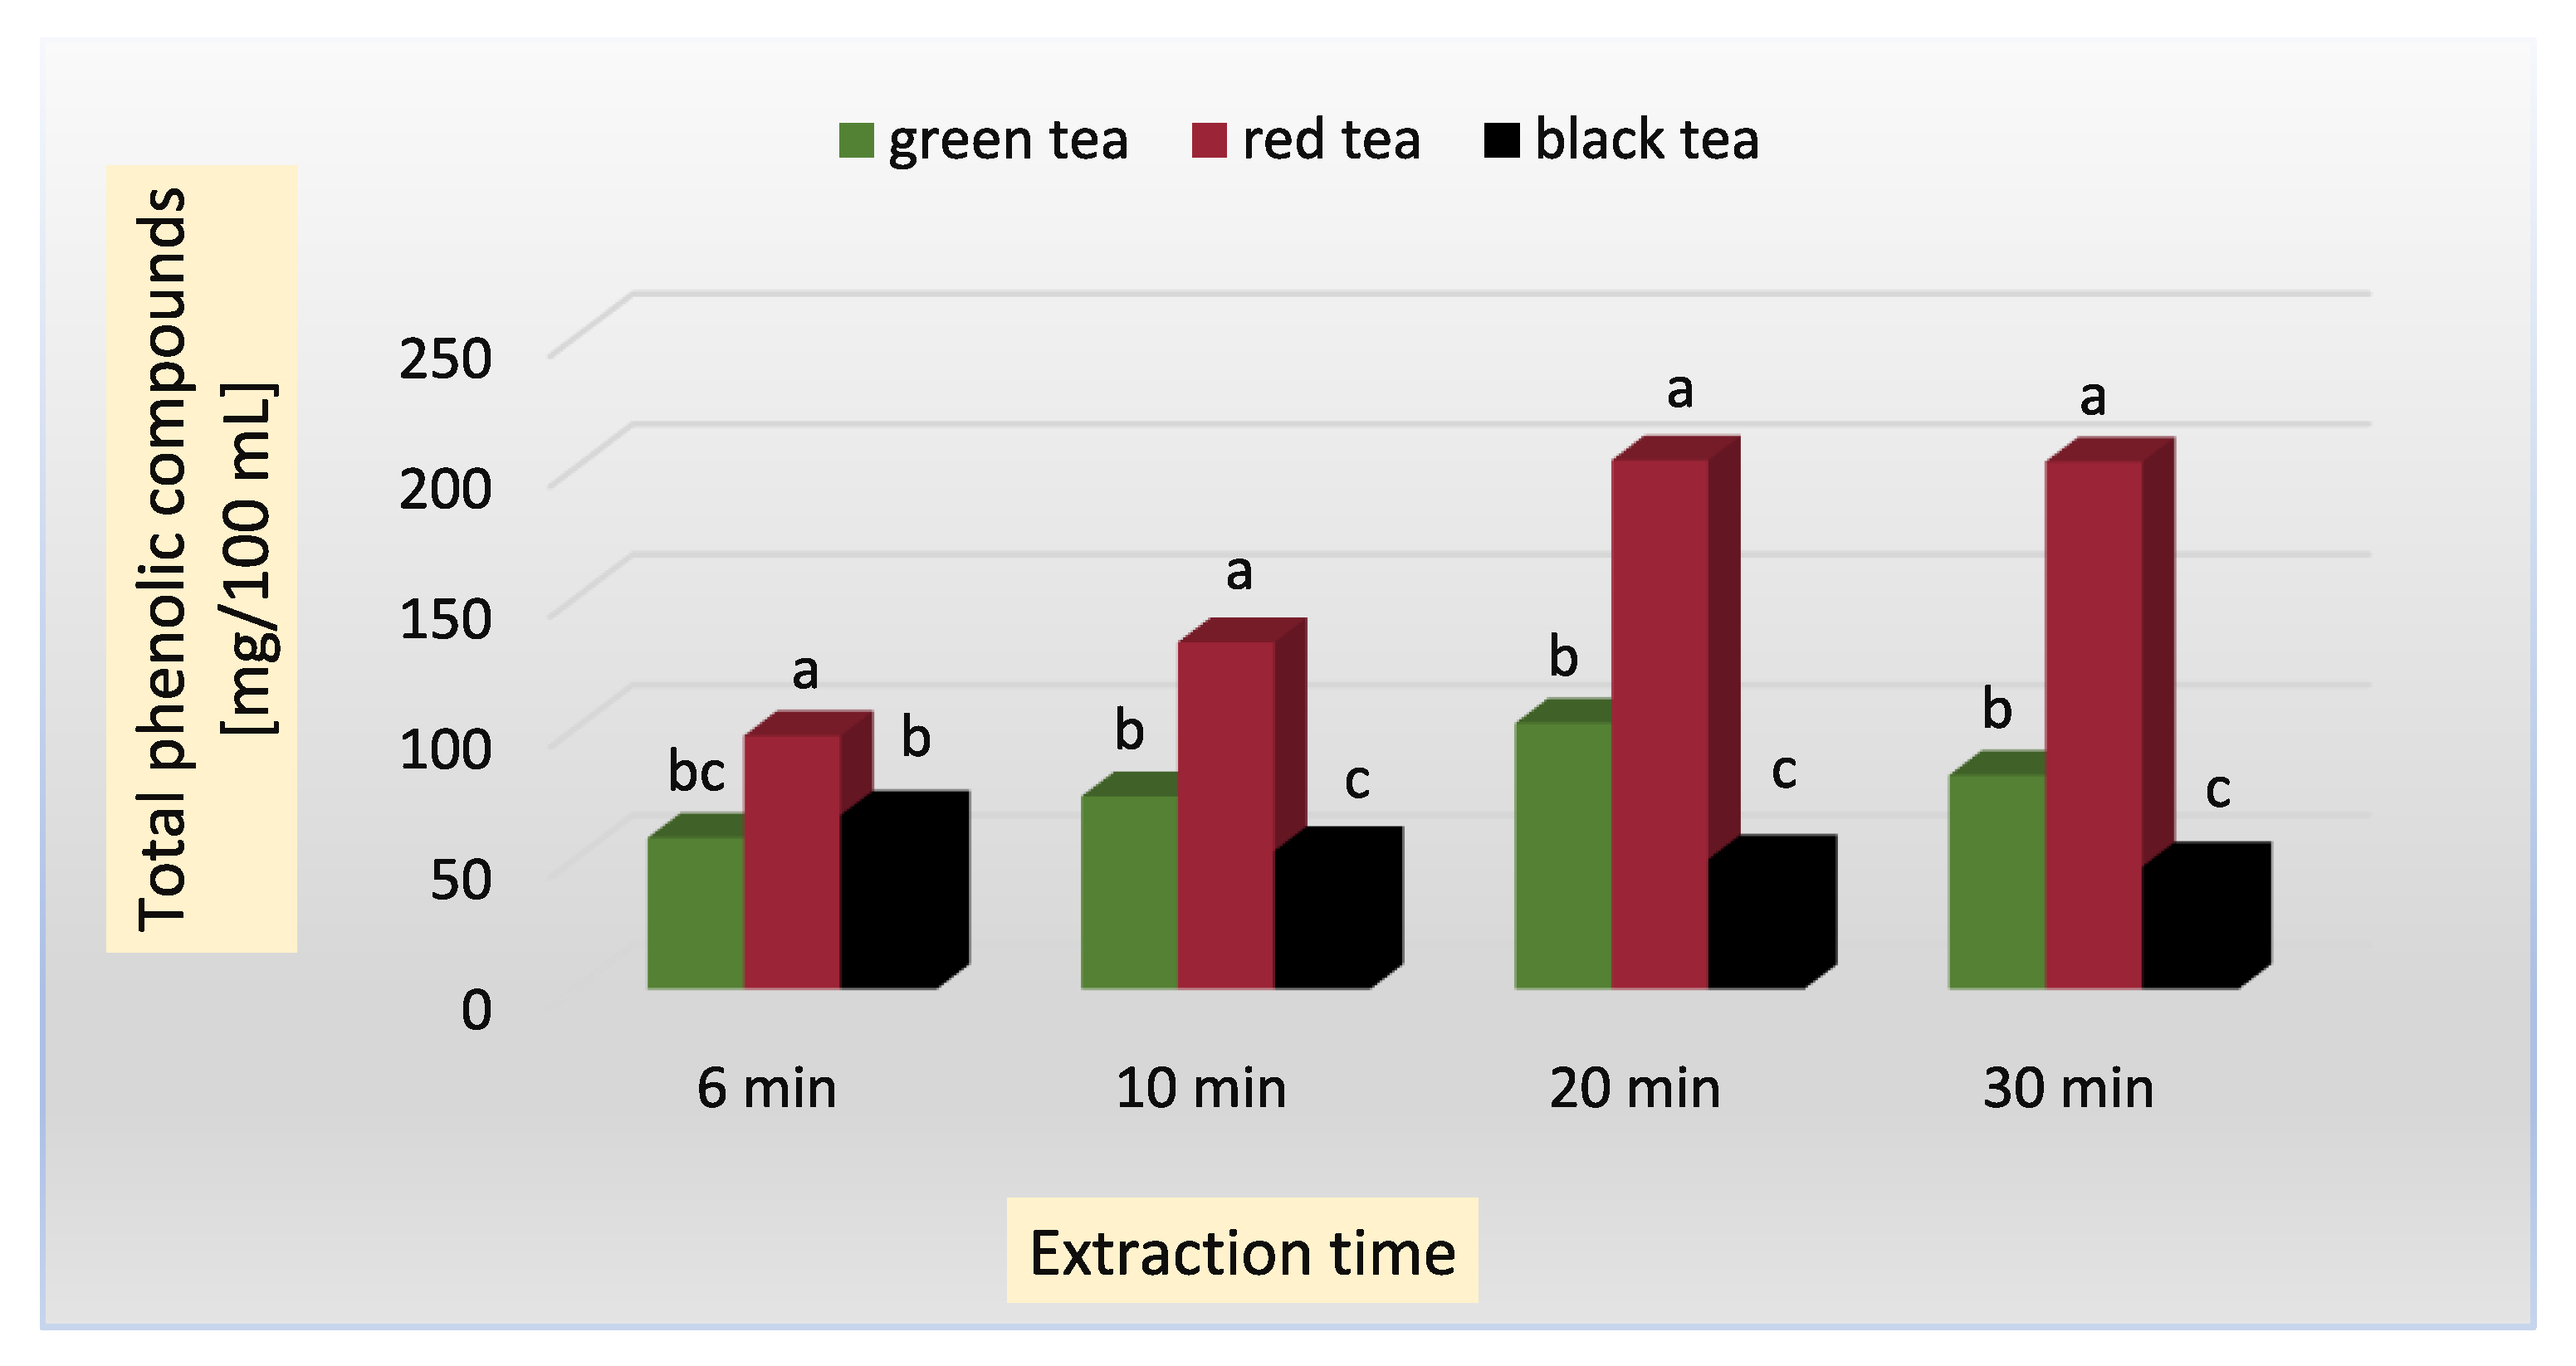
Figure 2.
Classification and the best sources of phenolic compounds, as well as the most important changes occurring in processed tea leaves.
Figure 2.
Classification and the best sources of phenolic compounds, as well as the most important changes occurring in processed tea leaves.
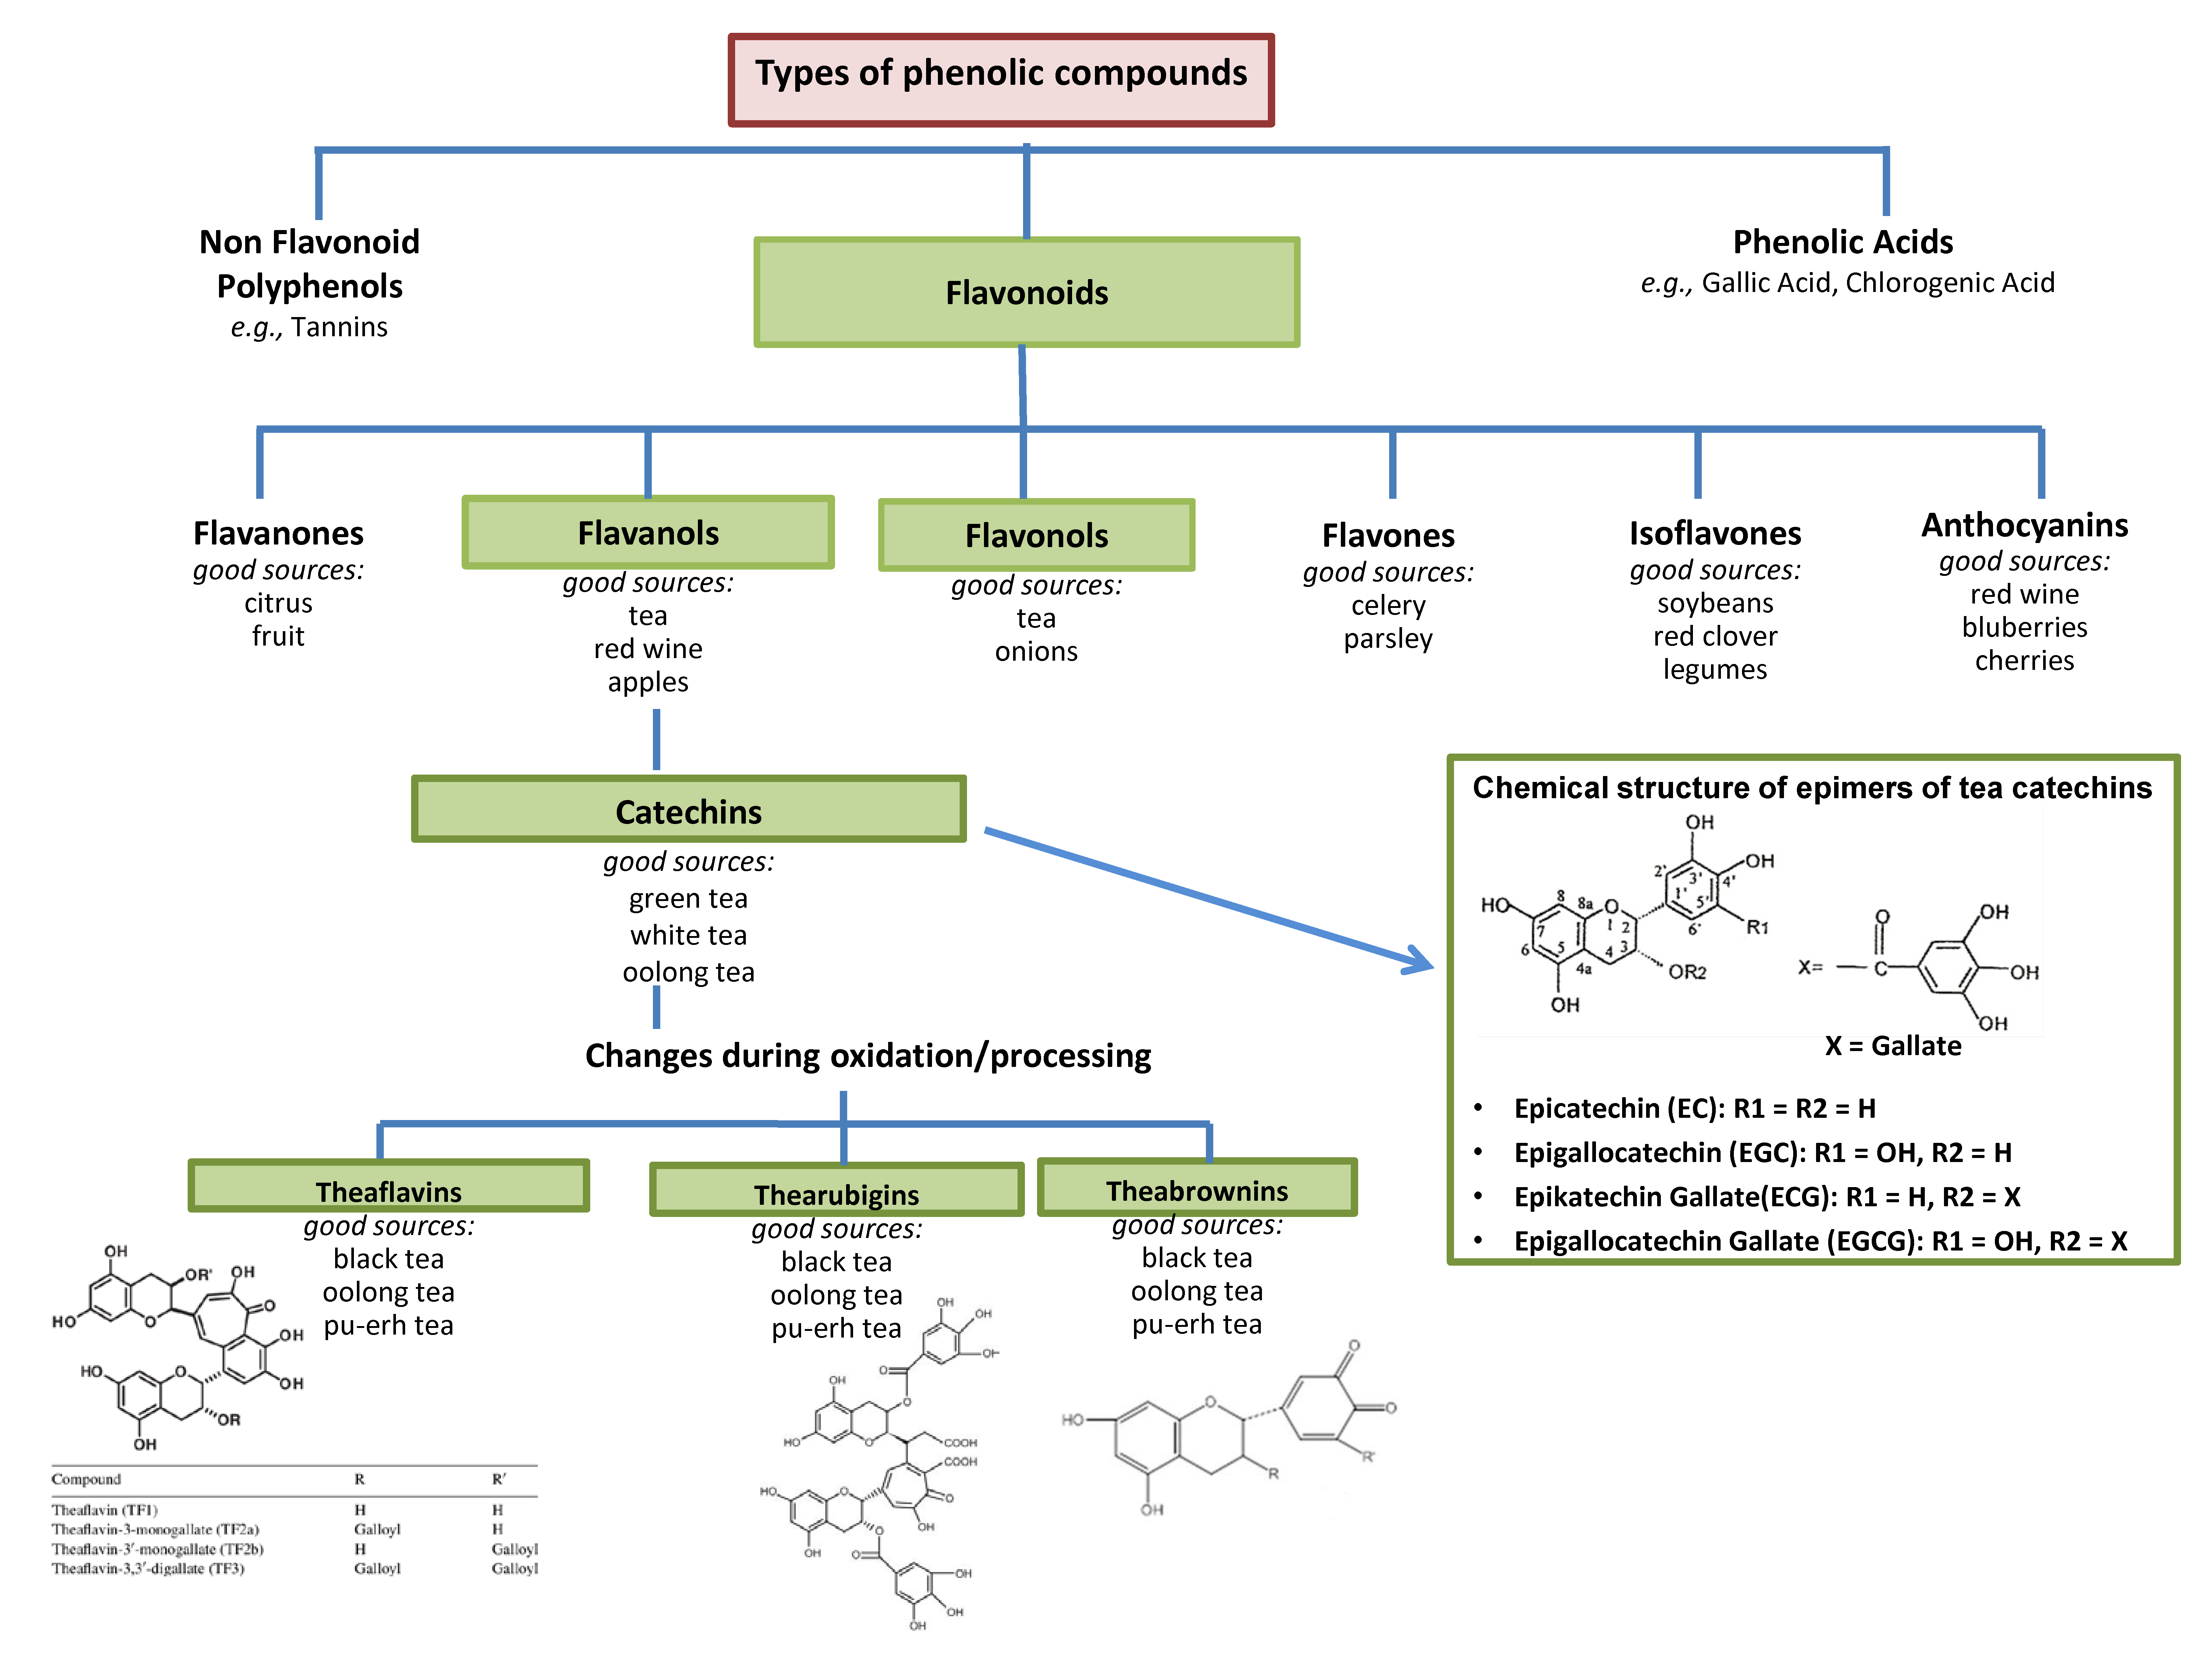
Figure 3.
Dendrogram of different tea infusions according to cluster analysis of similarity based on phenolic content, oxalates, and some minerals (Ca, Na, Cu, Mn). TPC—total phenolic compounds; O—oxalates; G, R, B—green, red (pu-erh), and black tea, respectively.
Figure 3.
Dendrogram of different tea infusions according to cluster analysis of similarity based on phenolic content, oxalates, and some minerals (Ca, Na, Cu, Mn). TPC—total phenolic compounds; O—oxalates; G, R, B—green, red (pu-erh), and black tea, respectively.

Table 1.
The content of biologically active compounds in tea infusions extracted with water for 6, 10, 20, and 30 min.
Table 1.
The content of biologically active compounds in tea infusions extracted with water for 6, 10, 20, and 30 min.
| Tea Type | Extraction Time [min] | Total Phenolic Compounds [mg/100 mL] | Oxalates [mg/100 mL] | Mineral Elements [µg/100 mL] | |||
|---|---|---|---|---|---|---|---|
| Ca | Na | Cu | Mn | ||||
| green | 6 | 58.0 ± 0.81 fg | 18.00 ± 0.00 fg | 132.1 ± 1.89 g | 44.83 ± 0.04 c | 3.90 ± 0.03 c | 370.8 ± 0.03 c |
| 10 | 73.9 ± 1.57 de | 24.24 ± 2.30 cd | 144.1 ± 2.14 f | 42.88 ± 0.11 c | 4.10 ± 0.04 c | 470.1 ± 2.16 b | |
| 20 | 102.0 ± 0.98 c | 26.96 ± 1.77 b | 164.2 ± 2.06 e | 42.10 ± 0.16 c | 6.12 ± 0.11 b | 560.2 ± 2.46 a | |
| 30 | 82.0 ± 2.30 d | 30.88 ± 1.35 a | 179.3 ± 1.99 d | 42.15 ± 0.10 c | 5.86 ± 0.22 b | 539.1 ± 3.19 a | |
| red (pu-erh) | 6 | 97.2 ± 2.26 c | 15.06 ± 0.74 g | 250.3 ±2.45 c | 260.12 ± 1.06 a | 2.40 ± 0.03 f | 140.4 ± 2.22 f |
| 10 | 133.0 ± 3.17 b | 21.80 ± 0.24 de | 255.1 ± 2.87 bc | 261.37 ± 2.04 a | 3.09 ± 0.02 c | 190.2 ± 4.11 e | |
| 20 | 202.9 ± 3.00 a | 29.05 ± 0.14 ab | 262.2 ± 2.88 b | 261.00 ± 1.11 a | 2.30 ± 0.04 f | 230.1 ± 0.09 d | |
| 30 | 202.3 ± 5.74 a | 28.71 ± 0.64 ab | 282.2 ± 1.66 a | 262.13 ± 0.22 a | 2.60 ± 0.07 e | 236.3 ± 1.42 d | |
| black | 6 | 66.6 ± 1.42 ef | 17.19 ± 0.78 fg | 49.3 ± 0.22 k | 61.12 ± 1.70 b | 8.42 ± 0.55 a | 172.4 ± 3.14 e |
| 10 | 52.9 ± 4.41 gh | 17.54 ± 0.74 fg | 55.7 ± 0.67 j | 63.22 ± 2.34 b | 4.14 ± 0.21 c | 223.1 ± 2.03 d | |
| 20 | 49.7 ± 1.18 gh | 18.50 ± 0.90 f | 65.1 ± 0.76 i | 64.11 ± 0.66 b | 4.30 ± 0.20 c | 240.1± 2.89 d | |
| 30 | 46.9 ± 0.98 h | 19.93 ± 1.11 e | 78.1 ± 0.11 h | 64.28 ± 0.53 b | 5.40 ± 0.04 b | 257.0 ± 3.11 d | |
a–j—values in columns denoted by the same letters are not statistically different in the analyzed type of tea at p < 0.05; data are expressed as mean values ± standard deviations (SDs) of three samples (n = 3). The significance of differences was determined using Duncan’s test.
Table 2.
Changes in the content of analyzed compounds occurring with increased duration of leaf extraction with water.
Table 2.
Changes in the content of analyzed compounds occurring with increased duration of leaf extraction with water.
| Tea Type | Extraction Time [min] | Total Phenolic Compounds [%] * | Oxalates [%] * | Mineral Elements [%] * | |||
|---|---|---|---|---|---|---|---|
| Ca | Na | Cu | Mn | ||||
| green | 6 | * | * | * | * | * | * |
| 10 | ↑ 27 | ↑ 34 | ↑ 9 | ↓ 5 | ↑ 5 | ↑ 27 | |
| 20 | ↑ 75 | ↑ 49 | ↑ 24 | ↓ 6 | ↑ 57 | ↑ 51 | |
| 30 | ↑ 41 | ↑ 71 | ↑ 35 | ↓ 6 | ↑ 50 | ↑ 45 | |
| red | 6 | * | * | * | * | * | * |
| 10 | ↑ 36 | ↑ 45 | ↑ 2 | - ** | ↑ 29 | ↑ 35 | |
| 20 | ↑ 108 | ↑ 93 | ↑ 5 | - ** | ↓ 4 | ↑ 64 | |
| 30 | ↑ 108 | ↑ 91 | ↑ 13 | - ** | ↑ 8 | ↑ 68 | |
| black | 6 | * | * | * | * | * | * |
| 10 | ↓ 21 | ↑ 2 | ↑ 13 | ↑ 3 | ↓ 50 | ↑ 29 | |
| 20 | ↓ 25 | ↑ 7 | ↑ 32 | ↑ 5 | ↓ 49 | ↑ 39 | |
| 30 | ↓ 30 | ↑ 15 | ↑ 58 | ↑ 5 | ↓ 36 | ↑ 49 | |
* All values were determined in relation to the content of individual components determined after 6 min of leaf extraction; “↑” means an increase in the content of analyzed compounds and “↓” means a decrease in their content; ** “-” this graphic symbol means “without changes”.
Table 3.
Correlations between analyzed discriminants.
| TPC | Oxalates | Ca | Na | Cu | |
| Oxalates | 0.6209 * | ||||
| Ca | 0.8516 * | 0.5126 | |||
| Na | 0.8045 * | 0.1357 | 0.8322 * | ||
| Cu | −0.5482 | −0.0901 | −0.6807 * | −0.7211 * | |
| Mn | −0.1678 | 0.5703 | −0.0532 | −0.5869 * | 0.3125 |
* TPC—total phenolic compounds; numbers denoted by * and bold type indicate correlation coefficients significant at p ≤ 0.05. Correlation coefficients were estimated for n = 12 cases.
Table 4.
Coverage of the demand for selected minerals for adults 19–75 years old after consuming 1 L (1000 mL) of tea infusions.
Table 4.
Coverage of the demand for selected minerals for adults 19–75 years old after consuming 1 L (1000 mL) of tea infusions.
| Type of Tea | |||
|---|---|---|---|
| Average Content of Minerals Determined in Tea Groups, RDA *, DDC *, and AI * | Green | Red | Black |
| Ca (mg/L) | 1.79 | 2.82 | 0.78 |
| Selected brewing time (min) * | 30 | 30 | 30 |
| RDA (mg/person) | 1000–1200 | 1000–1200 | 1000–1200 |
| DDC (%) | 0.15–0.18 | 0.24–0.28 | 0.07–0.08 |
| Na (mg/L) | 0.44–0.42 | 2.60–2.62 | 0.61–0.64 |
| Selected brewing time * | 6–30 | 6–30 | 6–30 |
| AI (mg/person) | 1300–1500 | 1300–1500 | 1300–1500 |
| DDC (%) | 0.03 | 0.17–0.20 | 0.04–0.05 |
| Cu (mg/L) | 0.06 | 0.03 | 0.08 |
| Selected brewing time * | 20–30 | 10 | 6 |
| RDA (mg/person) | 0.90 | 0.90 | 0.90 |
| DDC (%) | 6.66 | 3.33 | 8.88 |
| Mn (mg/L) | 5.60–5.39 | 2.30–2.36 | 2.23–2.57 |
| Selected brewing time * | 20–30 | 20–30 | 10–30 |
| AI (mg/person) | 1.8–2.3 | 1.8–2.3 | 1.8–2.3 |
| DDC (%) | 243–311 | 102–131 | 111–142 |
* RDA—recommended daily allowance (mg/person); AI—adequate intake (mg/person); DDC—daily demand coverage. The RDA and AI values come from the nutritional standards developed for the Polish population by Jarosz 2017 [55]. The DDC values were calculated based on the data presented in Table 1. “Selected brewing time” means the duration of infusions at which the content of individual minerals was the highest (in some cases, the time range is given in which the level of the determined component was statistically the same).
Publisher’s Note: MDPI stays neutral with regard to jurisdictional claims in published maps and institutional affiliations. |
© 2022 by the author. Licensee MDPI, Basel, Switzerland. This article is an open access article distributed under the terms and conditions of the Creative Commons Attribution (CC BY) license (https://creativecommons.org/licenses/by/4.0/).
Share and Cite
MDPI and ACS Style
Klepacka, J. Tea Infusions as a Source of Phenolic Compounds in the Human Diet. Appl. Sci. 2022, 12, 4227. https://doi.org/10.3390/app12094227
AMA Style
Klepacka J. Tea Infusions as a Source of Phenolic Compounds in the Human Diet. Applied Sciences. 2022; 12(9):4227. https://doi.org/10.3390/app12094227
Chicago/Turabian StyleKlepacka, Joanna. 2022. "Tea Infusions as a Source of Phenolic Compounds in the Human Diet" Applied Sciences 12, no. 9: 4227. https://doi.org/10.3390/app12094227
Note that from the first issue of 2016, this journal uses article numbers instead of page numbers. See further details here.