
Optimization of Carbon Fiber Reinforced Plastic Curing Parameters for Aerospace Application


Abstract
:1. Introduction
- is maximum stress in the skin patch (MPa);
- β is a plate dimensions ratio (dimension less);
- q is uniformly distributed aerodynamic pressure on the skin of the selected portion (MPa);
- b is a short dimension of the skin patch (mm);
- t is the thickness of the skin patch (mm).
2. Materials and Methods
2.1. Selection of Curing Parameter Levels
2.1.1. Curing Temperature Levels
2.1.2. Curing Time Levels
2.1.3. Autoclave Pressure Levels
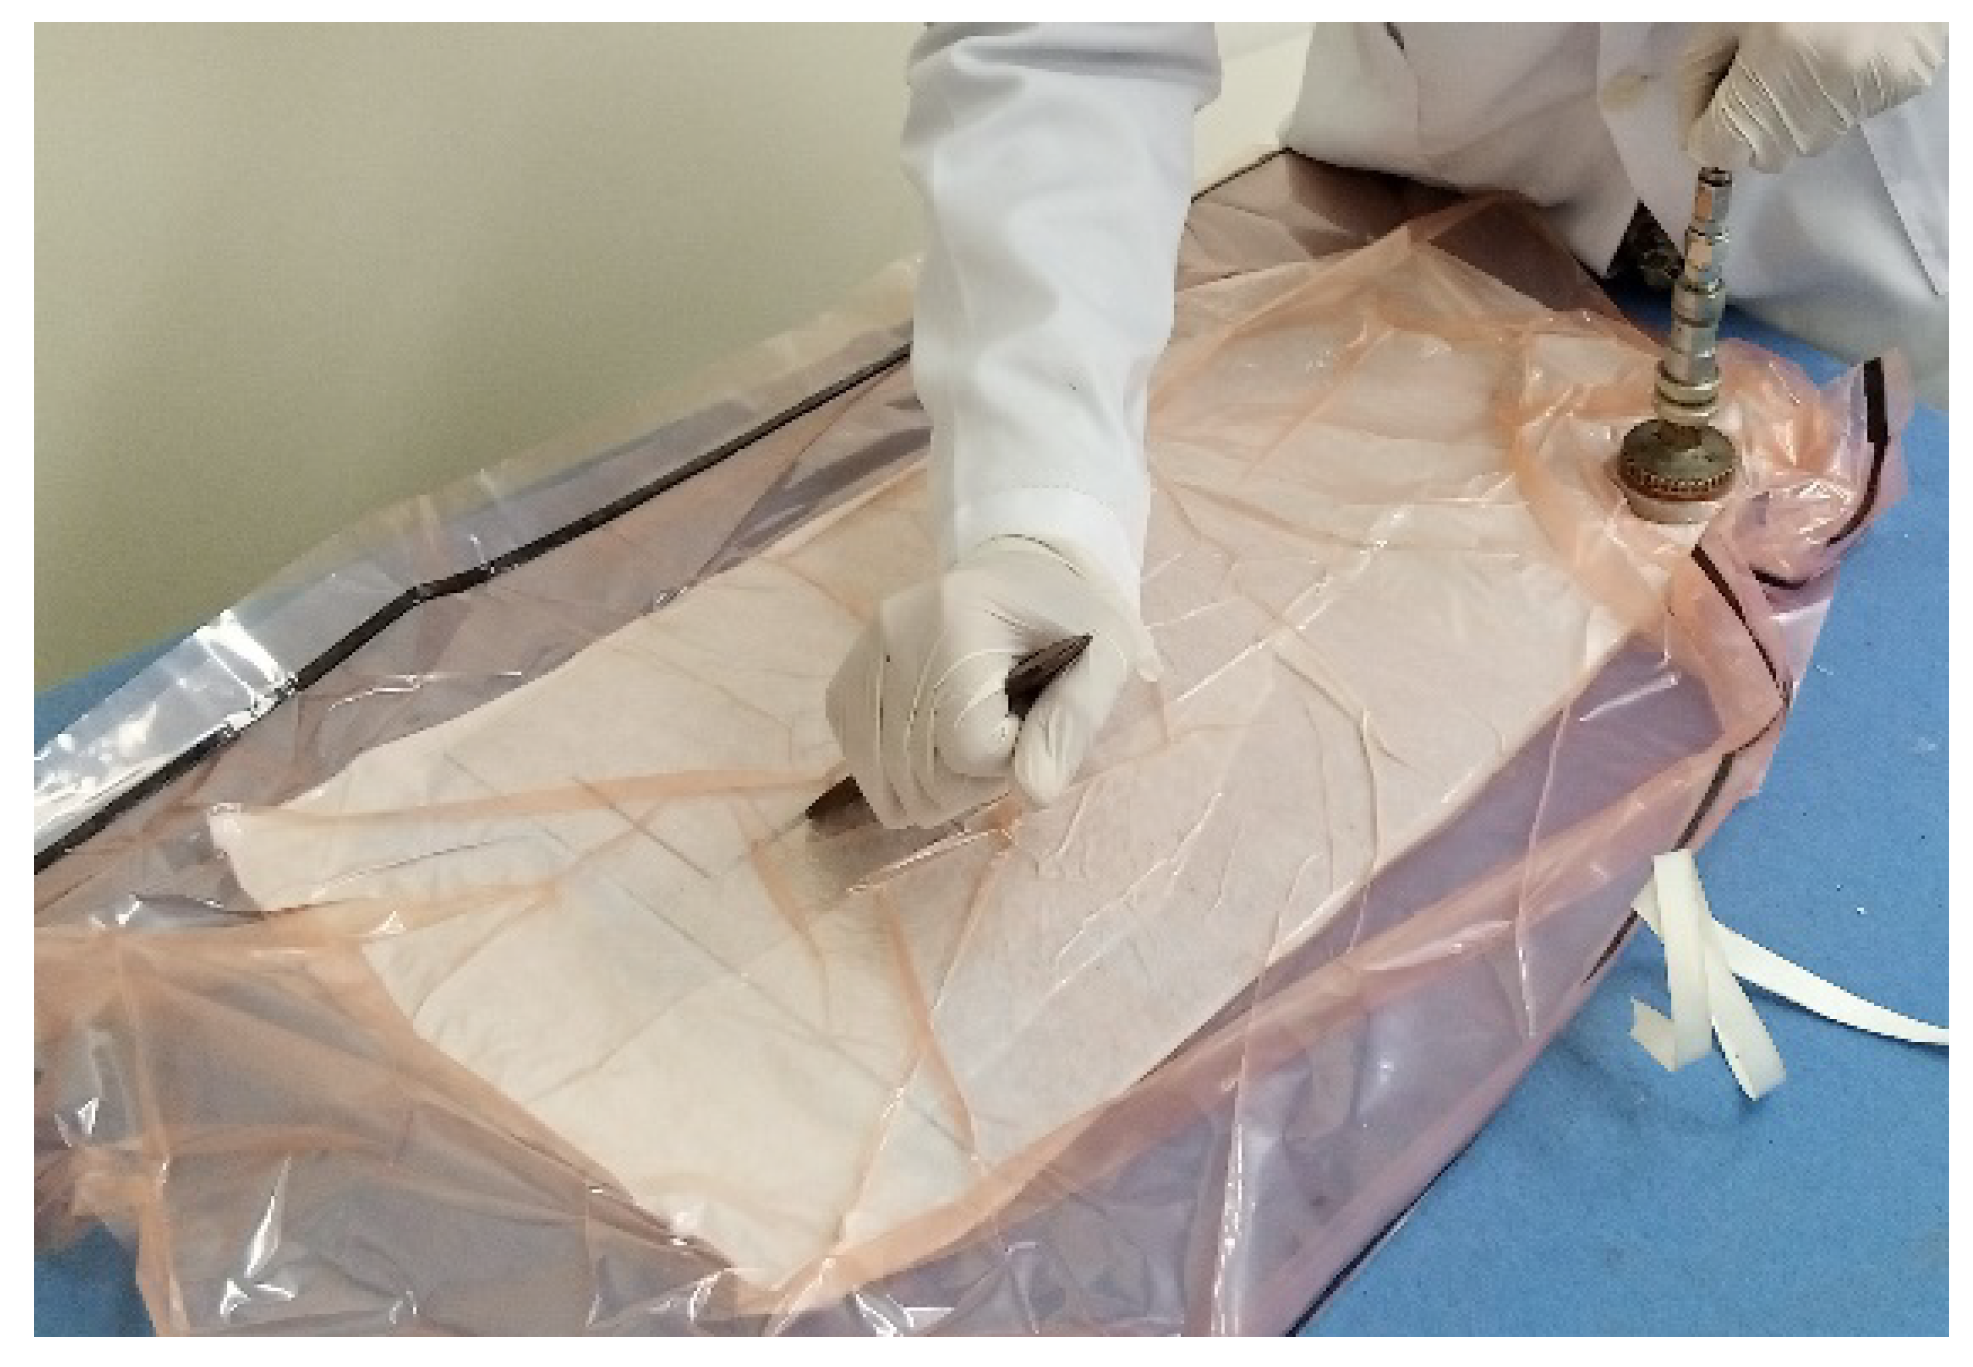
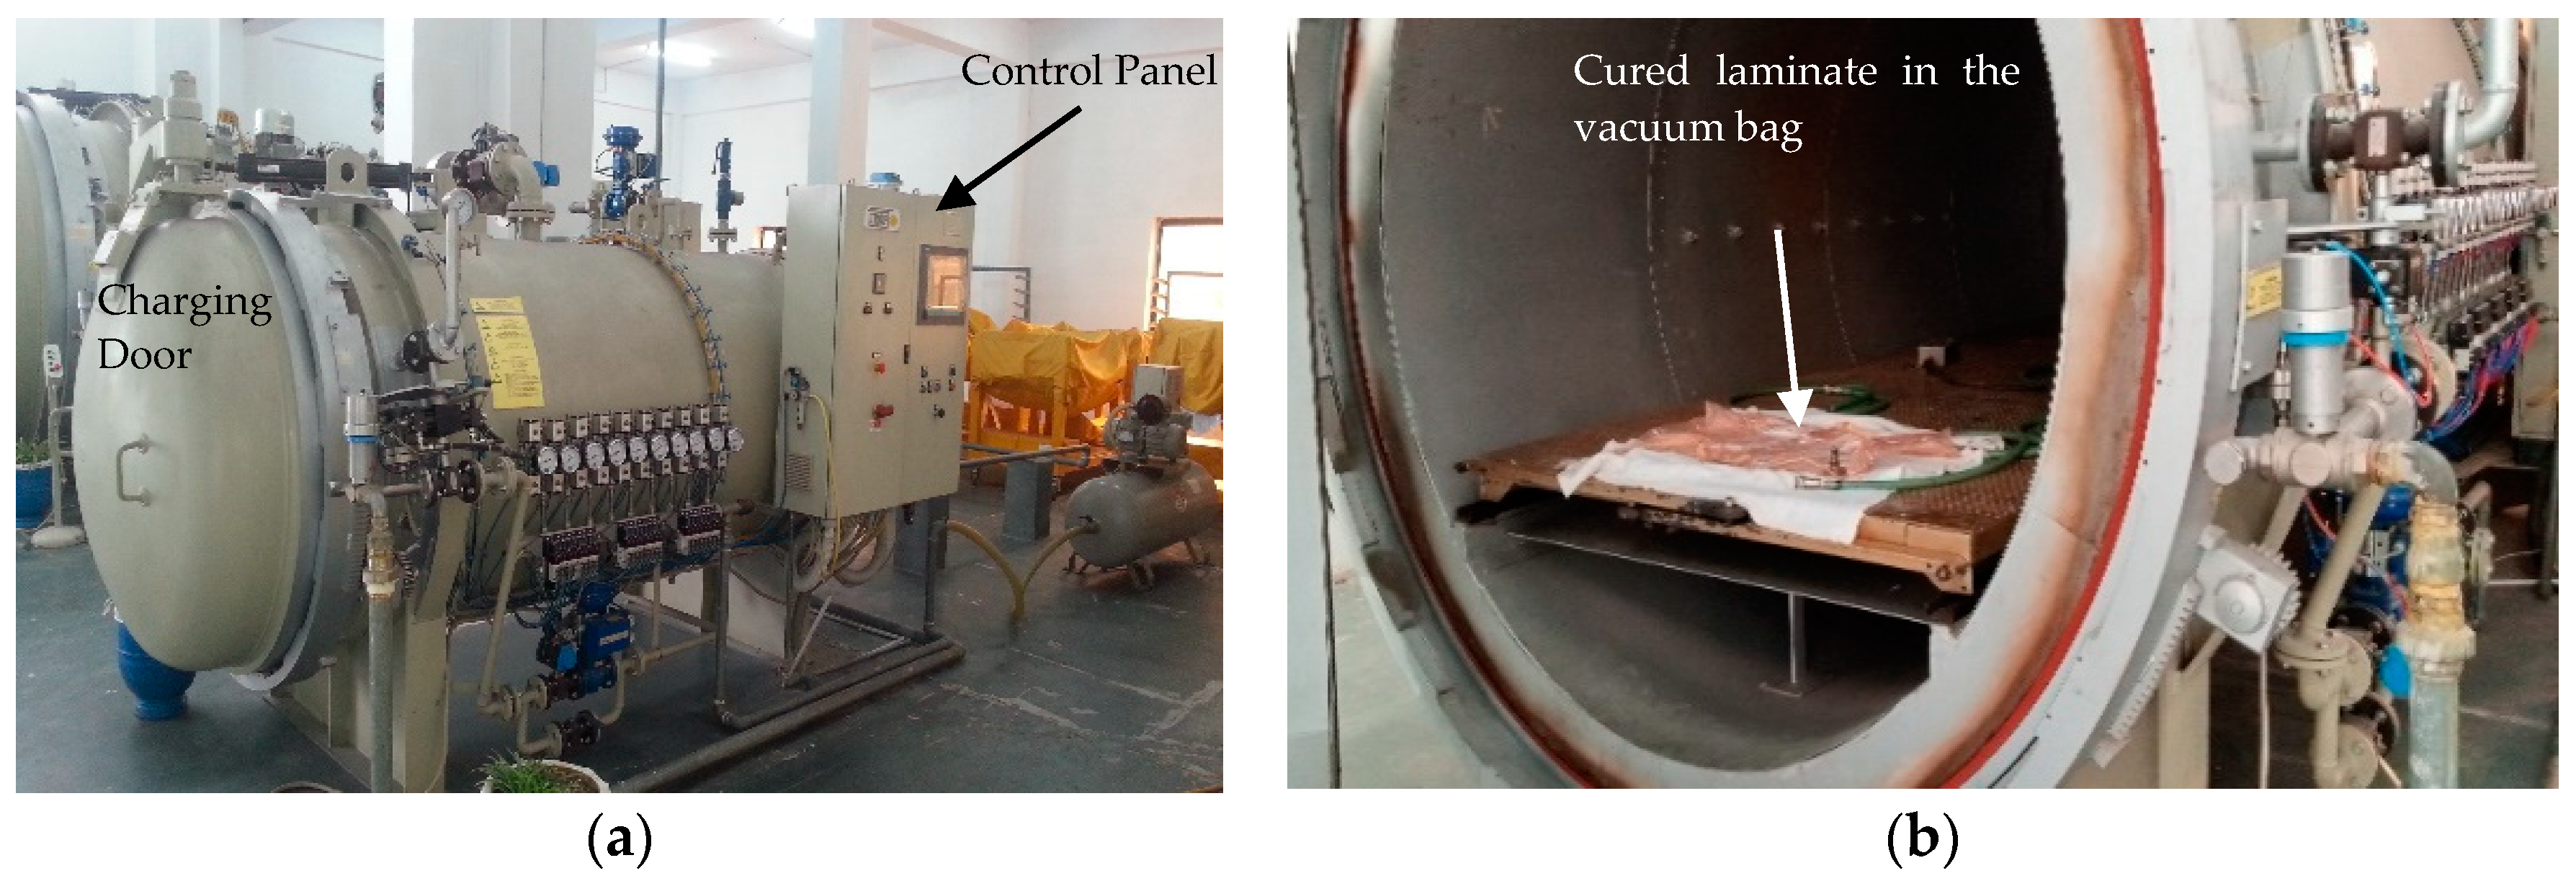
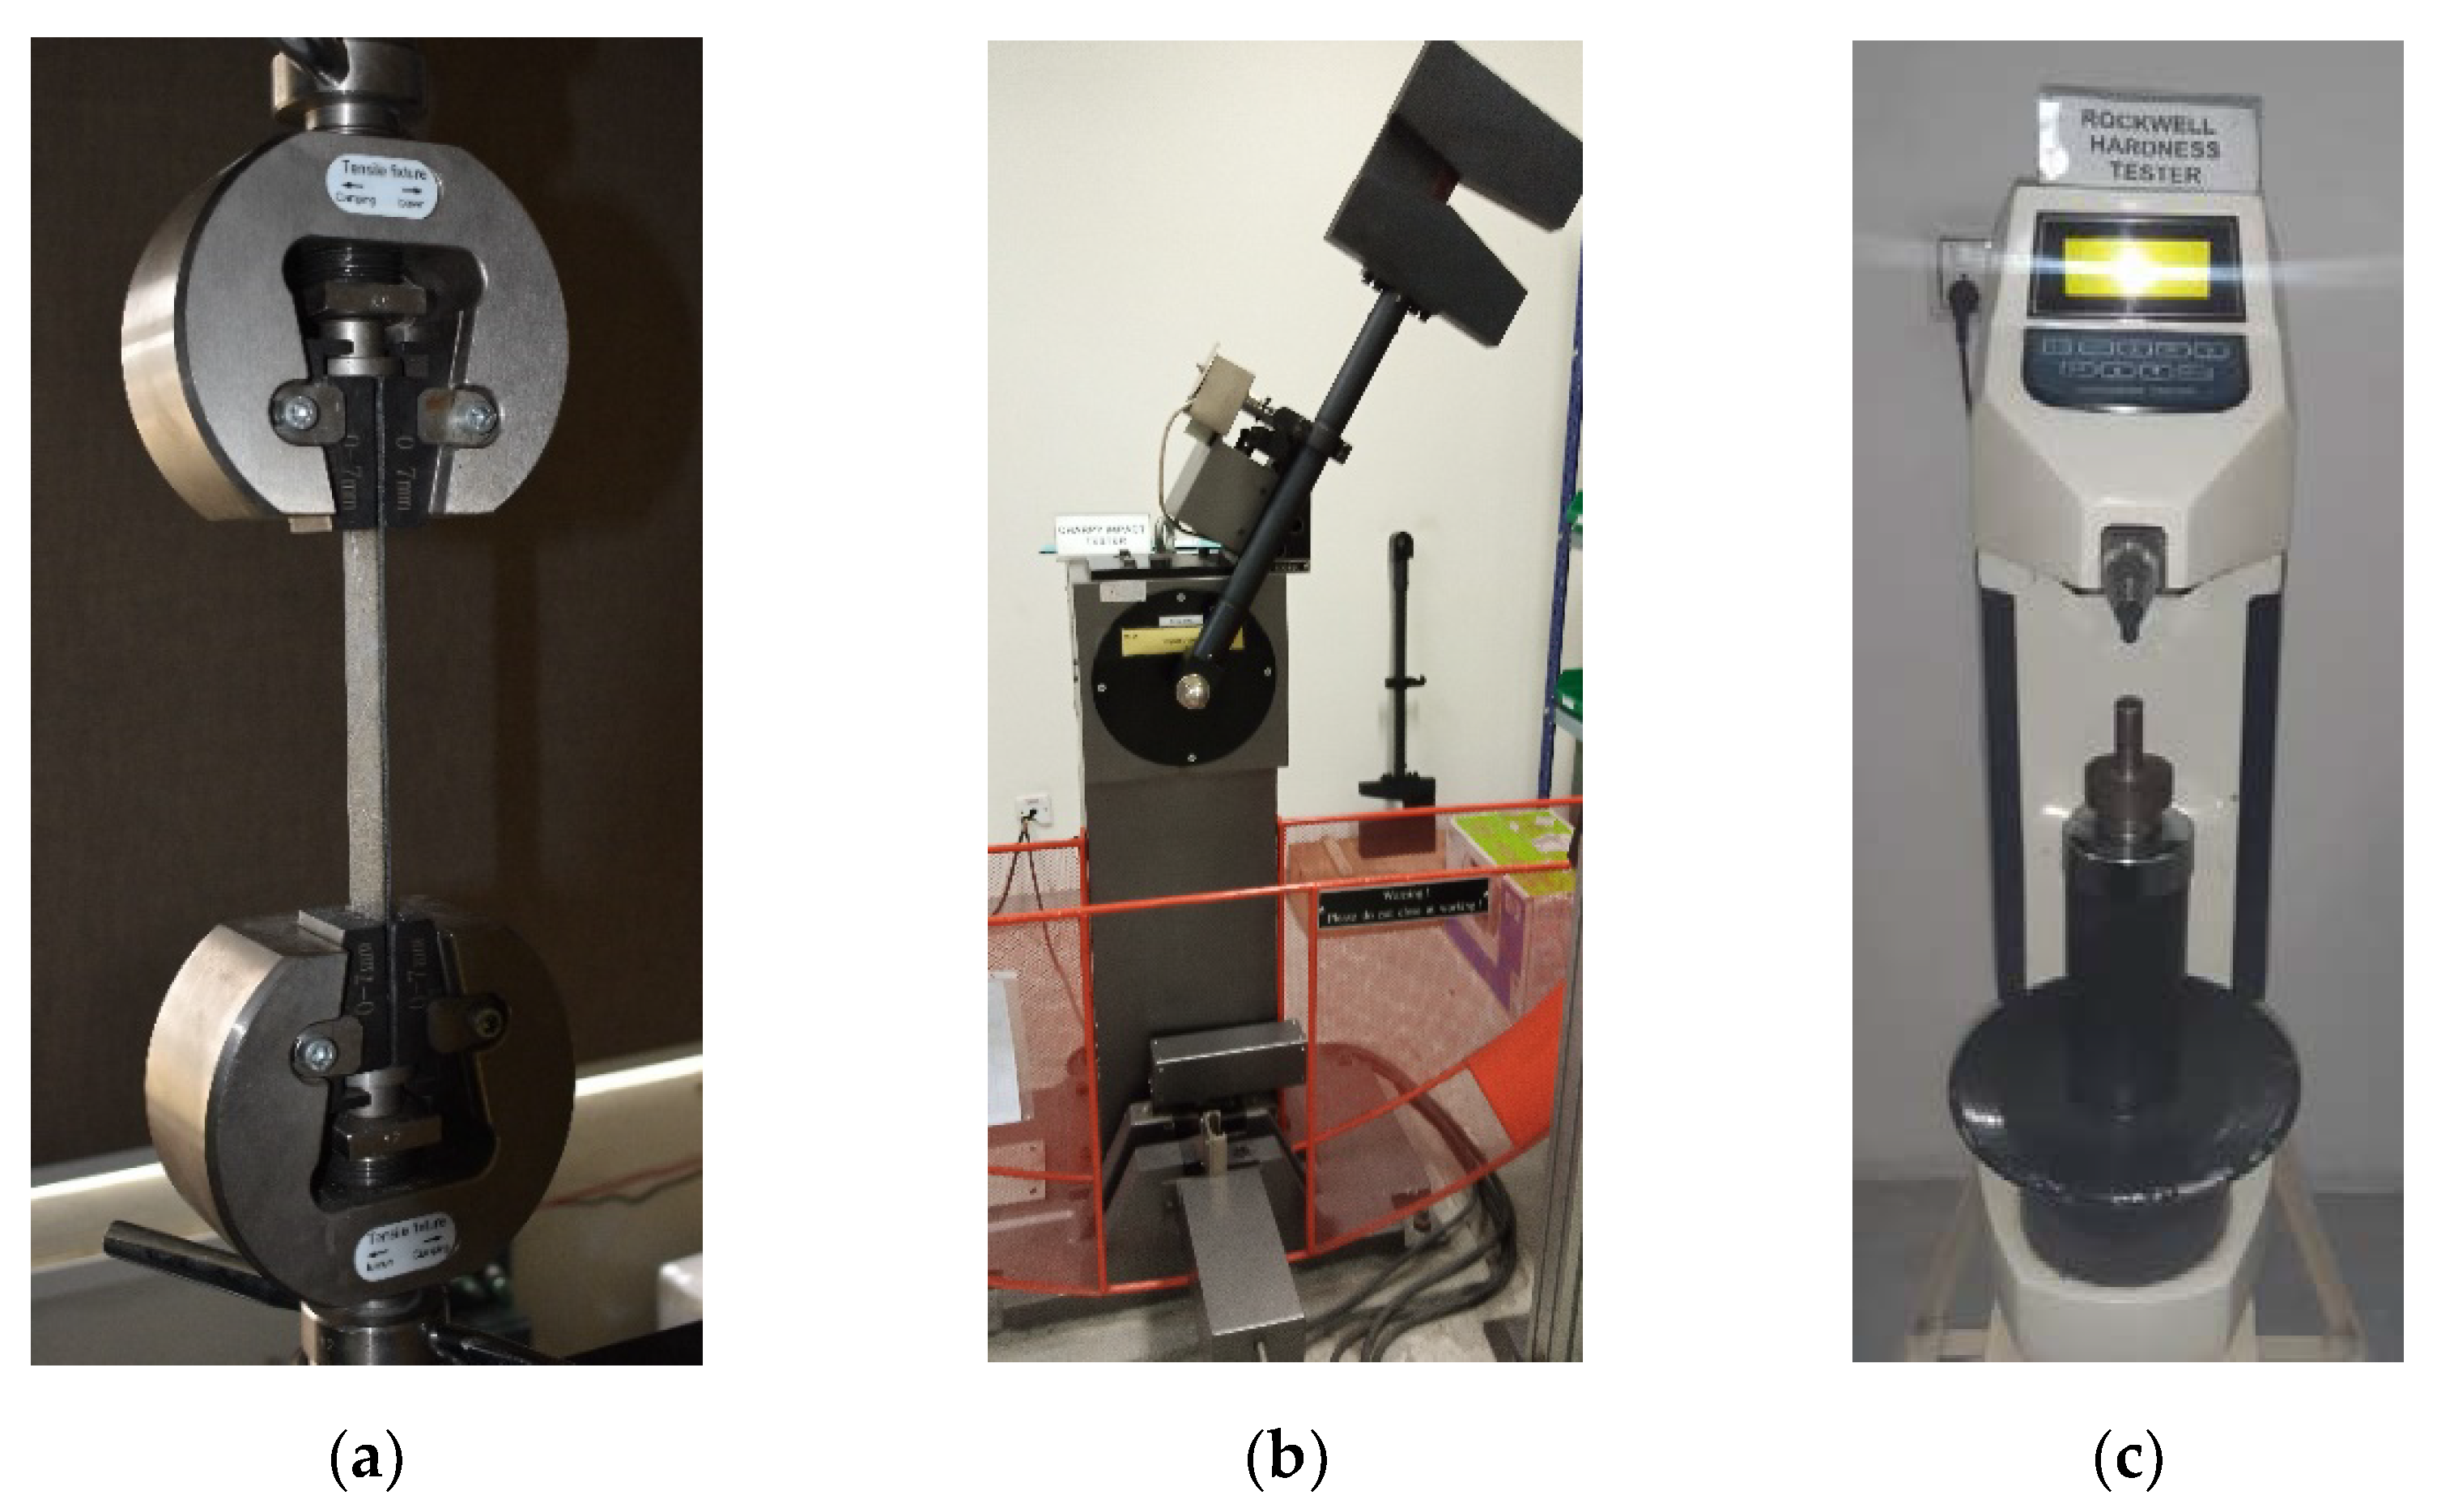
2.2. Samples Preparation and Experimentations
3. Results and Discussions
3.1. Analysis of Variance (ANOVA)
3.2. Surface Plots
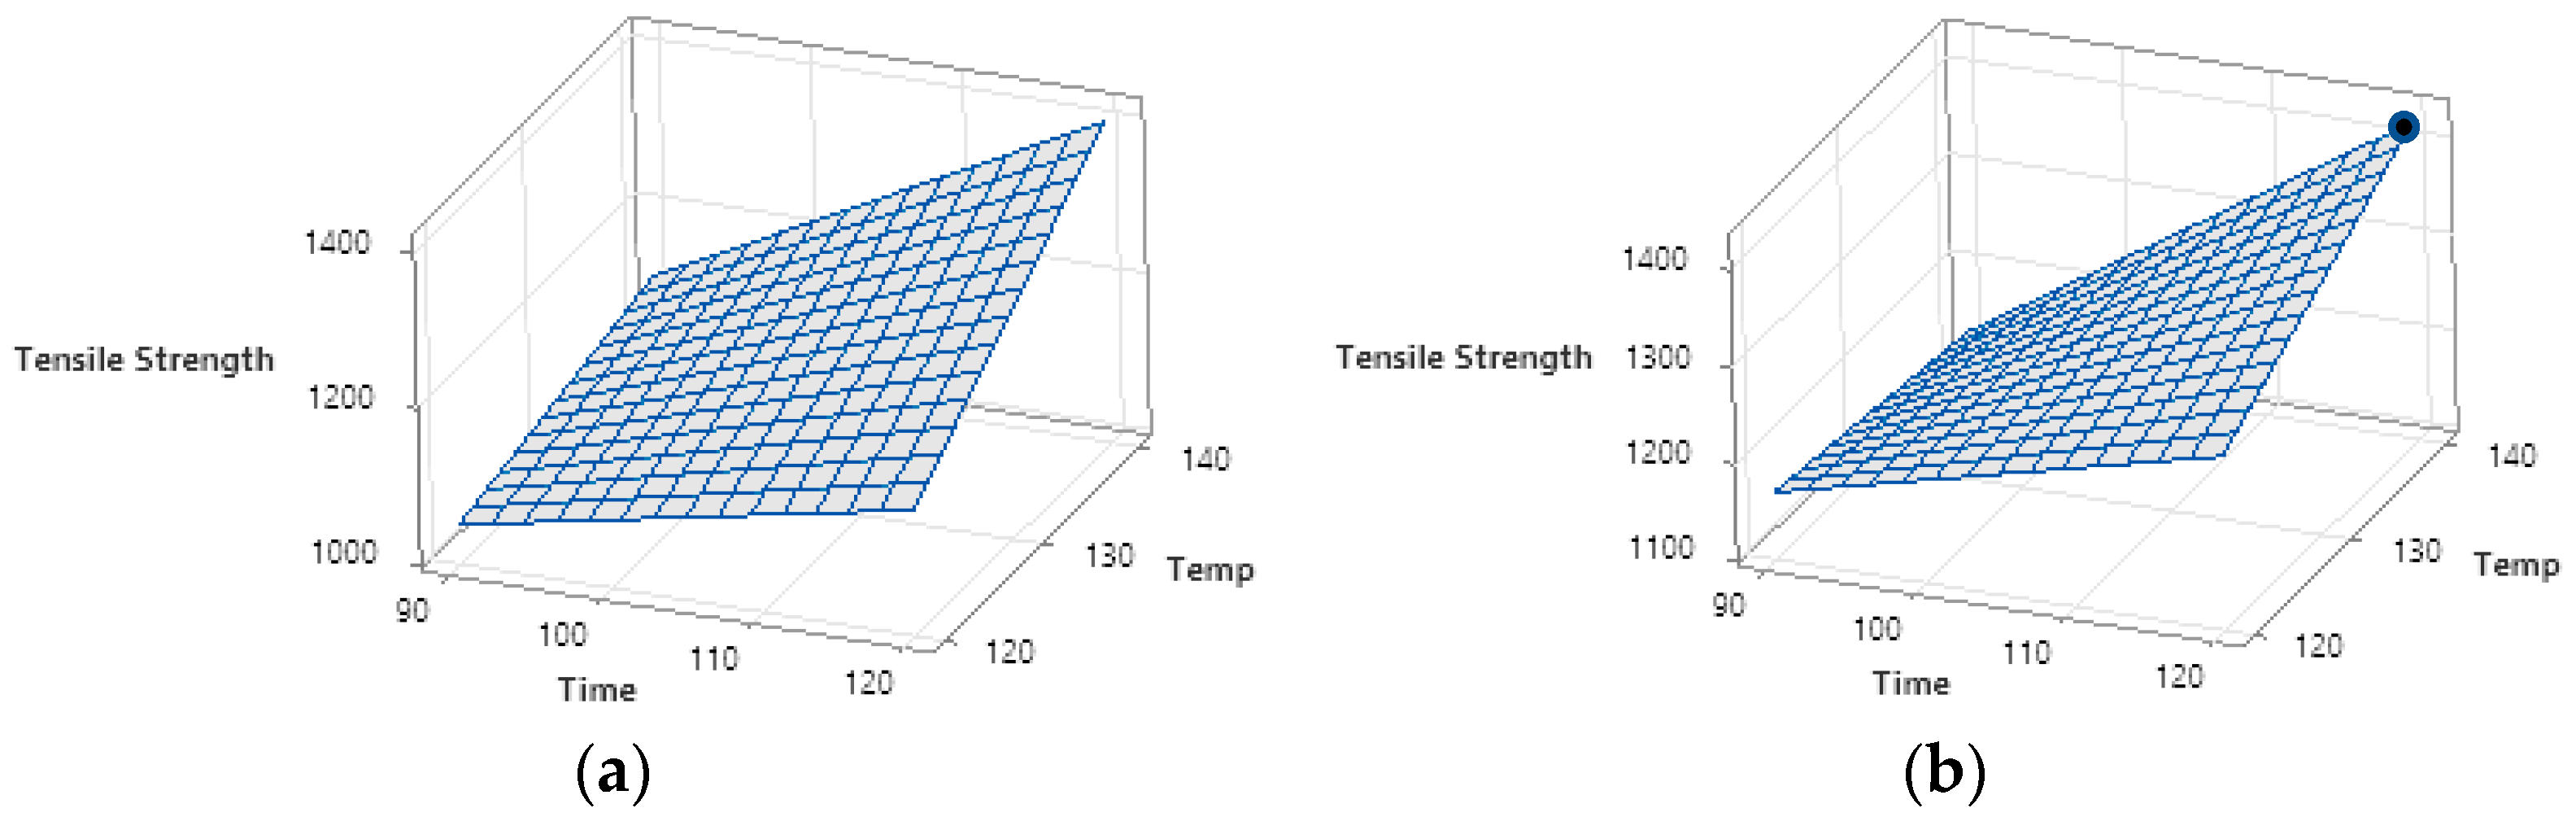
3.2.1. Optimum Tensile Strength
3.2.2. Optimum Impact Toughness
3.2.3. Optimum Hardness
3.3. Multi-Response Optimization of CFRP Mechanical Properties
- di is the desirability of an individual response,
- yi is the actual property value,
- L is the lower bound of the property,
- T is the target property value,
- wi is the weight of the desirability function.
- D is the composite desirability,
- n is the number of responses.
4. Conclusions
5. Future Work
Author Contributions
Funding
Institutional Review Board Statement
Informed Consent Statement
Acknowledgments
Conflicts of Interest
Acronyms
| CFRP | Carbon fiber reinforced plastic |
| PMC | Polymer matrix composite |
| DGEBA | Di-glycidyl ether of bisphenol A |
| DOE | Design of experiments |
| RSM | Response surface methodology |
| ANN | Artificial neural networking |
| UD | Uni-directional |
| ANOVA | Analysis of variance |
| α | Significance level |
| CC | Curing cycle |
| MRCC | Manufacturer-recommended cure cycle |
| Adj SS | Adjusted sum of squares |
| Adj MS | Adjusted mean of squares |
| DF | Degree of freedom |
| p-value | Probability value |
| Tc | Curing temperature |
| tc | Curing time |
| Tg∞ | Glass transition temperature with the maximum degree of conversion |
| Pau | Autoclave pressure |
| TS | Tensile strength |
| IT | Impact toughness |
| HD | Rockwell hardness (B) |
| RJ | Ryan–Joiner |
Appendix A
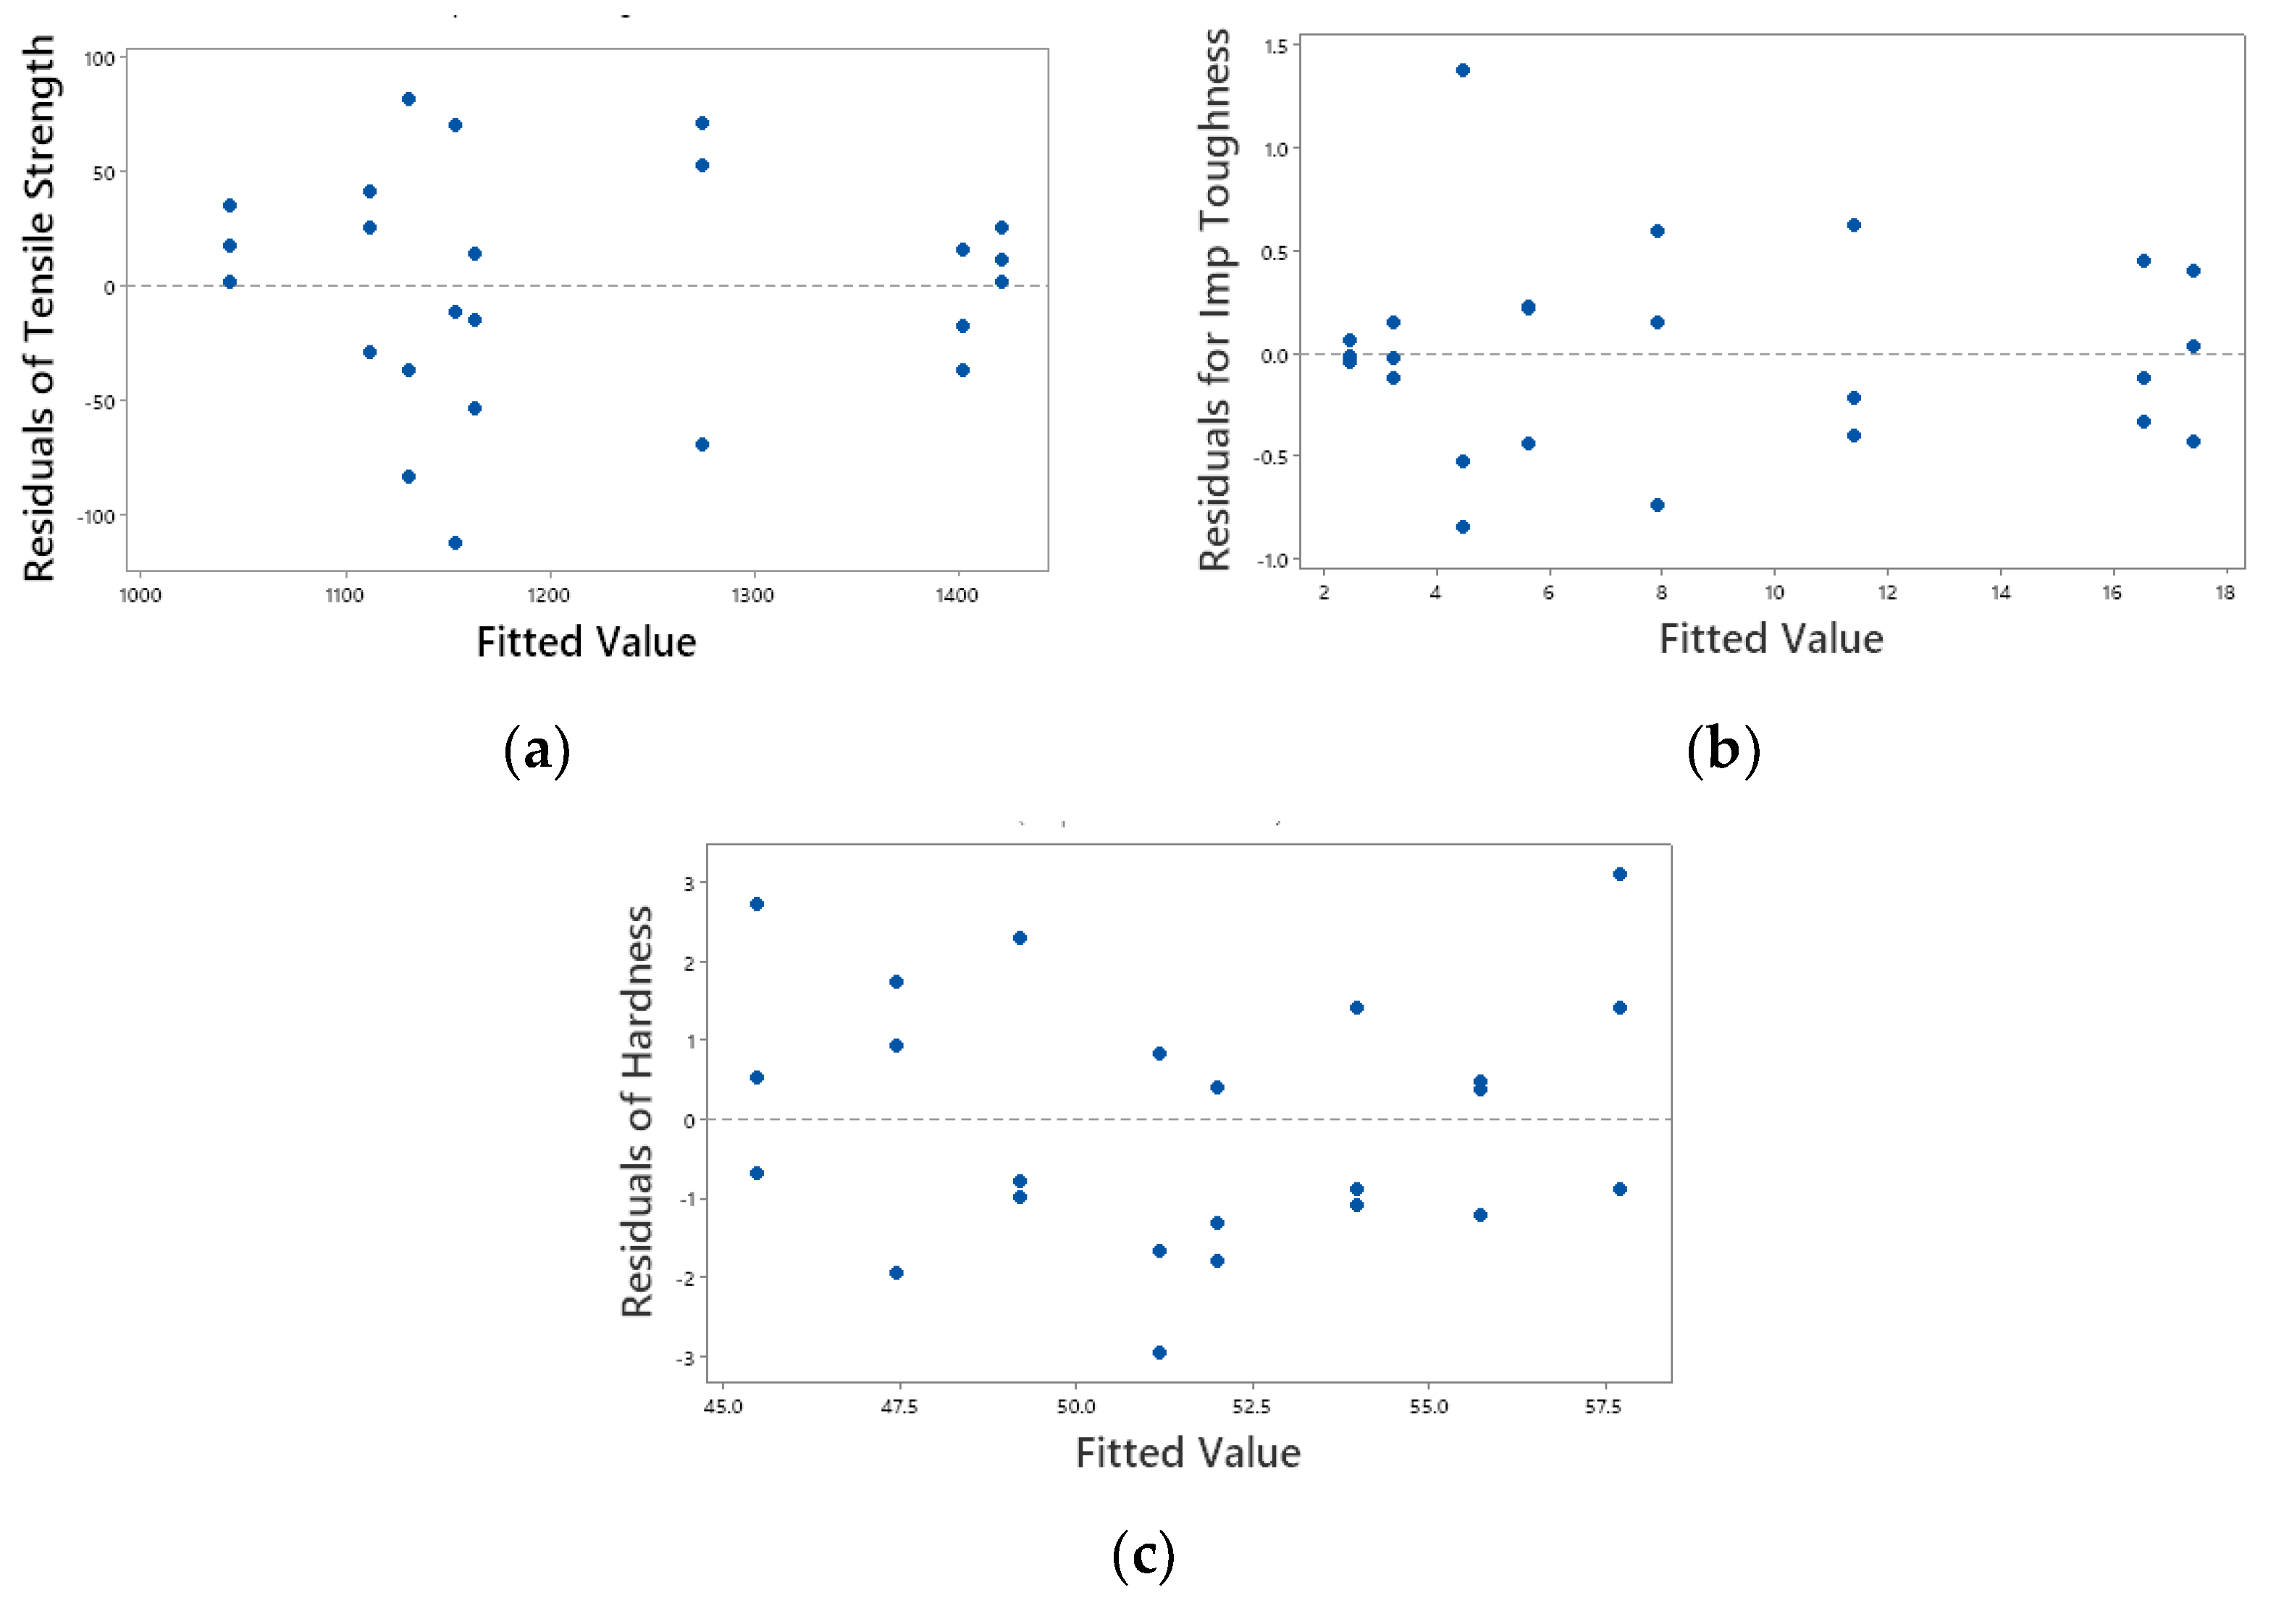
Model Validation

| Curing Parameters | Regression Results | Experimental Results | % Experimental Error | |||||||||
|---|---|---|---|---|---|---|---|---|---|---|---|---|
| Phase I CC | Tc (°C) | tc (min) | Pau (bar) | Tensile Strength (MPa) | Impact Toughness (J) | Hardness (HRB) | Tensile Strength (MPa) | Impact Toughness (J) | Hardness (HRB) | Tensile Strength (MPa) | Impact Toughness (J) | Hardness (HRB) |
| 1 | 130 | 100 | 4 | 1161.98 | 6.75 | 50.48 | 1112.56 | 6.91 | 52.84 | 4.25 | 2.30 | 4.66 |
| 2 | 130 | 100 | 5 | 1179.40 | 7.03 | 50.97 | 1204.56 | 6.89 | 52.06 | 2.13 | 2.02 | 2.12 |
| 3 | 130 | 100 | 6 | 1196.82 | 7.31 | 51.47 | 1126.51 | 7.11 | 49.57 | 5.87 | 2.74 | 3.69 |
| 4 | 135 | 110 | 4 | 1269.37 | 11.41 | 53.35 | 1211.21 | 11.04 | 56.37 | 4.58 | 3.30 | 5.65 |
| 5 | 135 | 110 | 5 | 1280.46 | 11.55 | 53.84 | 1214.59 | 11.2 | 51.85 | 5.14 | 3.04 | 3.70 |
| 6 | 135 | 110 | 6 | 1291.55 | 11.68 | 54.34 | 1333.58 | 12.15 | 52.62 | 3.23 | 3.97 | 3.16 |
| 7 | 140 | 120 | 4 | 1406.56 | 17.12 | 56.22 | 1356.79 | 16.34 | 54.81 | 3.53 | 4.60 | 2.50 |
| 8 | 140 | 120 | 5 | 1411.32 | 16.91 | 56.71 | 1347.65 | 16.46 | 53.99 | 4.51 | 2.71 | 4.80 |
| 9 | 140 | 120 | 6 | 1416.08 | 16.71 | 57.20 | 1460.18 | 17.47 | 59.57 | 3.11 | 4.54 | 4.12 |
References
- Chandrathilaka, E.; Gamage, J.; Fawzia, S. Mechanical characterization of CFRP/steel bond cured and tested at elevated temperature. Compos. Struct. 2018, 207, 471–477. [Google Scholar] [CrossRef]
- Kim, K.W.; Kim, D.K.; Kim, B.S.; An, K.H.; Park, S.J.; Rhee, K.Y.; Kim, B.J. Cure behaviors and mechanical properties of carbon fiber-reinforced nylon6/epoxy blended matrix composites. Compos. Part B Eng. 2017, 112, 15–21. [Google Scholar] [CrossRef]
- Nayak, N.V. Composite Materials in aerospace applications. Int. J. Sci. Res. Publ. 2014, 4, 1–10. [Google Scholar]
- Yu, Z.; Li, R.; Peng, Z.; Tang, Y. Carbon Fiber Reinforced Epoxy Resin Matrix Composites. Mater. Sci. Adv. Compos. Mater. 2017. [Google Scholar] [CrossRef]
- Mrazova, M. Advanced composite materials of the future. INCAS Bull. 2013, 5, 139–150. [Google Scholar]
- Kalanchiam, M. Advantages of composites materials in aircraft structures. Int. J. Aerosp. Mech. Eng. 2012, 6, 2428. [Google Scholar]
- Young, W.C.; Budynas, R.G. Roark’s Formulas for Stress and Strains, 7th ed.; McGraw Hill: New York, NY, USA, 2002. [Google Scholar]
- Niu, M.C.Y. Airframe Stress Analysis and Sizing, 2nd ed.; Hong Kong Conmilit Press Ltd.: Hong Kong, 1999. [Google Scholar]
- Cantwell, W.; Morton, J. The impact resistance of composite materials—A review. Composites 1991, 22, 347–362. [Google Scholar] [CrossRef]
- Hong, S.W.; Ahn, S.S. Charpy impact fracture characteristics of CFRP composite materials according to variations of fiber array direction and temperature. Int. J. Precis. Eng Manuf. 2013, 14, 253–258. [Google Scholar] [CrossRef]
- Hou, M.; Ye, L.; Mai, Y.-W. Effect of Moulding Temperature on Flexure, Impact Strength and Interlaminar Fracture Toughness of CF/PEI Composite. J. Reinf. Plast. Compos. 1996, 15, 1117–1130. [Google Scholar] [CrossRef]
- Gao, L.; Zhang, Q.; Guo, J.; Li, H.; Wu, J.; Yang, X. Effects of the amine/epoxy stoichiometry on the curing behavior and glass transition temperature of MWCNTs-NH2/epoxy nanocomposites. Thermochim. Acta 2016, 639, 98–107. [Google Scholar] [CrossRef]
- Fu, Y.; Zhong, W.-H. Cure kinetics behavior of a functionalized graphitic nanofiber modified epoxy resin. Thermochim. Acta 2011, 516, 58–63. [Google Scholar] [CrossRef]
- Johnson, J.B.; Owston, C.N. The Effect of Cure Cycle on the Mechanical Properties of CFRP. Composites 1973, 4, 111–117. [Google Scholar] [CrossRef]
- Esposito, L.; Sorrentino, L.; Penta, F.; Bellini, C. Effect of curing overheating on interlaminar shear strength and its modelling in thick FRP laminates. Int. J. Adv. Manuf. Technol. 2016, 87, 2213–2220. [Google Scholar] [CrossRef]
- Boey, F.; Lye, S. Void reduction in autoclave processing of thermoset composites: Part 2: Void reduction in a microwave curing process. Composites 1992, 23, 266–270. [Google Scholar] [CrossRef]
- Guo, Z.-S.; Liu, L.; Zhang, B.-M.; Du, S. Critical Void Content for Thermoset Composite Laminates. J. Compos. Mater. 2006, 43, 1775–1790. [Google Scholar] [CrossRef]
- Olivier, P.; Cottu, J.P.; Ferret, B. Effects of cure cycle pressure and voids on some mechanical properties of carbon/epoxy laminates. Compos. Part A Appl. Sci. Manuf. 1995, 26, 500–515. [Google Scholar]
- Li, W. Effect of Cure Pressure on Woven Carbon Fibre Epoxy Composite. Ph.D. Thesis, The University of New South Wales, Sydney, Australia, 2003. [Google Scholar]
- Davies, L.; Day, R.; Bond, D.; Nesbitt, A.; Ellis, J.; Gardon, E. Effect of cure cycle heat transfer rates on the physical and mechanical properties of an epoxy matrix composite. Compos. Sci. Technol. 2007, 67, 1892–1899. [Google Scholar] [CrossRef]
- Pittroff, R.R. Relationship between the Physical Properties and Curing System of an Epoxy Matrix. Master’s Thesis, Tshwane University of Technology, Pretoria, South Africa, 2007. [Google Scholar]
- Seretis, G.; Kouzilos, G.; Manolakos, D.; Provatidis, C. Multi-Objective Curing Cycle Optimization for Glass Fabric/Epoxy Composites Using Poisson Regression and Genetic Algorithm. Mater. Res. 2018, 21. [Google Scholar] [CrossRef]
- Sultania, M.; Rai, J.; Srivastava, D. Process modeling, optimization and analysis of esterification reaction of cashew nut shell liquid (CNSL)-derived epoxy resin using response surface methodology. J. Hazard. Mater. 2011, 185, 1198–1204. [Google Scholar] [CrossRef]
- Kumar, D.S.; Shukla, M.J.; Mahato, K.K.; Rathore, D.; Prusty, R.K.; Ray, B.C. Effect of post-curing on thermal and mechanical behavior of GFRP composites. IOP Conf. Ser. Mater. Sci. Eng. 2015, 75, 012012. [Google Scholar] [CrossRef] [Green Version]
- Aruniit, A.; Jaan, K.E.R.S.; Krumme, A.; Poltimäe, T.; Kaspar, T.A.L.L. Preliminary Study of the Influence of Post Curing Parameters to the Particle Reinforced Composite’s Mechanical and Physical Properties. Mater. Sci. 2021, 18, 256–261. [Google Scholar] [CrossRef] [Green Version]
- Khan, L.A. Cure Optimization of 977-2A Carbon/Epoxy Composites for Quickstep Processing. Ph.D. Thesis, The University of Manchester, Manchester, UK, 2010. [Google Scholar]
- Alavi, S. Thermal, Rheological, and Mechanical Properties of a Polymer Composite Cured at Staged Cure Cycles. Ph.D. Thesis, Wichita State University, Wichita, KS, USA, 2010. [Google Scholar]
- Nele, L.; Caggiano, A.; Teti, R. Autoclave Cycle Optimization for High Performance Composite Parts Manufacturing. Procedia CIRP 2016, 57, 241–246. [Google Scholar] [CrossRef]
- Tang, J.M.; Lee, W.I.; Springer, G.S. Effects of cure pressure on resin flow, voids, and mechanical properties. J. Compos. Mater. 1987, 21, 421–440. [Google Scholar] [CrossRef]
- Campbell, F. Manufacturing Processes for Advanced Composites; Elsevier Advanced Technology: London, UK, 2004. [Google Scholar] [CrossRef]
- Hamdan, B.; Lafi, S.; Hassan, N.M. Optimizing the Manufacturing Processes of Carbon Fiber Epoxy Resin Composite Panels. J. Manuf. Sci. Eng. 2017, 140, 011003. [Google Scholar] [CrossRef]
- Fukunaga, H.; Vanderplaats, G. Strength optimization of laminated composites with respect to layer thickness and/or layer orientation angle. Comput. Struct. 1991, 40, 1429–1439. [Google Scholar] [CrossRef]
- Singh, S.; Vummadisetti, S.; Chawla, H. Influence of curing on the mechanical performance of FRP laminates. J. Build. Eng. 2018, 16, 1–19. [Google Scholar] [CrossRef]
- Xiao, G.; Zhu, Z. Friction materials development by using DOE/RSM and artificial neural network. Tribol. Int. 2010, 43, 218–227. [Google Scholar] [CrossRef]
- Parida, K.A.; Routara, B.C.; Bhuyan, R.K. Surface roughness model and parametric optimization in machining of GFRP composite Taguchi and Response surface methodology approach. Mater. Today 2015, 2, 3065–3074. [Google Scholar] [CrossRef]
- Pelletier, J.L.; Vel, S.S. Multi-objective optimization of fiber reinforced composite laminates for strength, stiffness and minimal mass. Comput. Struct. 2006, 84, 2065–2080. [Google Scholar] [CrossRef]
- Ghosal, A.; Manna, A. Response surface method based optimization of ytterbium fiber laser parameter during machining of Al/Al2O3-MMC. Opt. Laser Technol. 2013, 46, 67–76. [Google Scholar] [CrossRef]
- Casalino, G.; Campanelli, S.L.; Contuzzi, N.; Ludovico, A.D. Experimental investigation and statistical optimisation of the selective laser melting process of a maraging steel. Opt. Laser Technol. 2015, 65, 151–158. [Google Scholar] [CrossRef]
- Derringer, G.; Suich, R. Simultaneous Optimization of Several Response Variables. J. Qual. Technol. 1980, 12, 214–219. [Google Scholar] [CrossRef]
- Deeying, J. Multi-objective optimization on laser solder jet bonding process. Opt. Laser Technol. 2018, 98, 158–168. [Google Scholar] [CrossRef]
- Harrington, E.C. The desirability function. Ind. Qual. Control 1965, 21, 494–498. [Google Scholar]
- Pasandideh, S.H.R.; Niaki, S.T.A. Multi-response simulation optimization using genetic algorithm within desirability function framework. Appl. Math. Comput. 2005, 175, 366–382. [Google Scholar] [CrossRef]
- Dave, R.S. Processing of Composites; Hanser Publishers: Munich, Germany, 2000. [Google Scholar]
- Aronhime, M.T.; Gillham, J.K. Time-Temperature-Transformation (TTT) cure diagram a review. Polymer 1986, 78, 83–113. [Google Scholar]
- Hernández, S.; Sket, F.; González, C.; Lorca, J.L. Optimization of curing cycle in carbon fiber-reinforced laminates: Void distribution and mechanical properties. Compos. Sci. Technol. 2013, 85, 73–82. [Google Scholar] [CrossRef] [Green Version]
- Ogunleye, O.; Salawudeen, T.; Suleyman, M.; Faridah, Y. Optimization of process parameters for enhanced mechanical properties of polypropylene ternary nanocomposites. Adv. Sci. Technol. Res. J. 2015, 9, 27–33. [Google Scholar] [CrossRef] [Green Version]
- Snee, R.D. Experimental Designs for Quadratic Models in Constrained Mixture Spaces. Technometrics 1975, 17, 149. [Google Scholar] [CrossRef]
- Sun, L.; Pang, S.S.; Sterling, A.M.; Negulescu, I.I.; Stubblefield, M.A. Thermal analysis of curing process of epoxy prepreg. J. Appl. Polym. Sci. 2002, 83, 1074–1083. [Google Scholar] [CrossRef]
- Odian, G. Principles of Polymerization, 3rd ed.; John Wiley and Sons: New York, NY, USA, 1991. [Google Scholar]
- D’Almeida, J.; Monteiro, S. The effect of the resin/hardener ratio on the compressive behavior of an epoxy system. Polym. Test. 1996, 15, 329–339. [Google Scholar] [CrossRef]
- Koushyar, H. Effects of Variation in Autoclave Pressure Cure Temp and Vacuum Application Time on Porosity and Mechanical Properties of Carbon Epoxy Composite. Master’s Thesis, Wichita State University, Wichita, KS, USA, 2011. [Google Scholar]
- Asp, L.; Brandt, F. Effects of pores and voids on the interlaminar delamination toughness of a carbon/epoxy composite. Presented at the Paper presented at 11th International Conference on Composite Materials, Gold Coast, Australia, 14–18 July 1997. [Google Scholar]
- Morioka, Y.T.K. Effect of lay-up sequences on mechanical properties and fracture behavior of CFRP laminate composites. Mater. Charact. 2000, 45, 125–136. [Google Scholar] [CrossRef]
- Myers, R.H.; Montgomery, D.C. Response Surface Methodology, 3rd ed.; John Wiley and Sons: Hoboken, NJ, USA, 2009. [Google Scholar]
- Kataria, R.; Kumar, J. A comparison of the different multiple response optimization techniques for turning operation of AISI O1 tool steel. J. Eng. Res. 2014, 2, 1–24. [Google Scholar] [CrossRef]
- del Castillo, E.; Montgomery, D.C.; McCarville, D.R. Modified desirability functions for multiple response optimization. J. Qual. Technol. 1996, 28, 337–345. [Google Scholar] [CrossRef]


| Parameters | Symbols (Units) | Levels | |
|---|---|---|---|
| −1 | 1 | ||
| Curing temperature | Tc (°C) | 120 | 140 |
| Curing time | tc (min) | 90 | 120 |
| Autoclave pressure | Pau (bar) | 3 | 7 |
| CC | Tc (°C) | tc (min) | Pau (bar) | Tensile Strength (MPa) | Impact Toughness (J) | Hardness (HRB) |
|---|---|---|---|---|---|---|
| 1 | 120 | 90 | 3 | 1044.8 | 02.45 | 46.0 |
| 1 | 120 | 90 | 3 | 1078.4 | 02.42 | 48.2 |
| 1 | 120 | 90 | 3 | 1060.8 | 02.53 | 44.8 |
| 2 | 140 | 90 | 3 | 1083.2 | 03.61 | 52.4 |
| 2 | 140 | 90 | 3 | 1153.6 | 05.84 | 50.7 |
| 2 | 140 | 90 | 3 | 1137.6 | 03.93 | 50.2 |
| 3 | 120 | 120 | 3 | 1041.6 | 08.08 | 48.4 |
| 3 | 120 | 120 | 3 | 1142.4 | 07.19 | 48.2 |
| 3 | 120 | 120 | 3 | 1224.0 | 08.52 | 51.5 |
| 4 | 140 | 120 | 3 | 1364.8 | 17.43 | 56.2 |
| 4 | 140 | 120 | 3 | 1417.6 | 16.97 | 54.5 |
| 4 | 140 | 120 | 3 | 1384.0 | 17.80 | 56.1 |
| 5 | 120 | 90 | 7 | 1110.4 | 03.37 | 45.5 |
| 5 | 120 | 90 | 7 | 1177.6 | 03.10 | 49.2 |
| 5 | 120 | 90 | 7 | 1148.8 | 03.20 | 48.4 |
| 6 | 140 | 90 | 7 | 1212.8 | 05.20 | 52.9 |
| 6 | 140 | 90 | 7 | 1094.4 | 05.85 | 53.1 |
| 6 | 140 | 90 | 7 | 1048.0 | 05.86 | 55.4 |
| 7 * | 120 | 120 | 7 | 1204.8 | 11.19 | 48.2 |
| 7 * | 120 | 120 | 7 | 1345.6 | 11.00 | 49.5 |
| 7 * | 120 | 120 | 7 | 1327.5 | 12.03 | 52.0 |
| 8 | 140 | 120 | 7 | 1446.4 | 16.40 | 59.1 |
| 8 | 140 | 120 | 7 | 1422.4 | 16.97 | 56.8 |
| 8 | 140 | 120 | 7 | 1432.0 | 16.19 | 60.8 |
| Source | DF | Adj SS | Adj MS | F-Value | p-Value |
|---|---|---|---|---|---|
| Model | 5 | 402,449 | 80,490 | 25.85 | 0.000 |
| Linear | 3 | 339,145 | 113,048 | 36.30 | 0.000 |
| Tc | 1 | 69,346 | 69,346 | 22.27 | 0.000 |
| tc | 1 | 240,544 | 240,544 | 77.24 | 0.000 |
| Pau | 1 | 29,255 | 29,255 | 9.39 | 0.007 |
| 2-way inter | 2 | 63,304 | 31,652 | 10.16 | 0.001 |
| Tc × tc | 1 | 47,926 | 47,926 | 15.39 | 0.001 |
| Tc × Pau | 1 | 15,378 | 15,378 | 4.94 | 0.039 |
| Error | 18 | 56,054 | 3114 | ||
| Lack-of-Fit | 2 | 5895 | 2947 | 0.94 | 0.411 |
| Pure Error | 16 | 50,159 | 3135 | ||
| Total | 23 | 458,503 | |||
| R-sq = 88%, R-sq(adj) = 84%, R-sq(pred) = 78% | |||||
| Source | DF | Adj SS | Adj MS | F-Value | p-Value |
|---|---|---|---|---|---|
| Model | 7 | 722.798 | 103.257 | 304.35 | 0.000 |
| Linear | 3 | 669.428 | 223.143 | 657.72 | 0.000 |
| Tc | 1 | 135.233 | 135.233 | 398.60 | 0.000 |
| tc | 1 | 526.500 | 526.500 | 1551.88 | 0.000 |
| Pau | 1 | 7.695 | 7.695 | 22.68 | 0.000 |
| 2-Way inter | 3 | 44.813 | 14.938 | 44.03 | 0.000 |
| Tc × tc | 1 | 38.837 | 38.837 | 114.47 | 0.000 |
| Tc × Pau | 1 | 5.812 | 5.812 | 17.13 | 0.001 |
| tc × Pau | 1 | 0.165 | 0.165 | 0.49 | 0.496 |
| 3-Way inter | 1 | 8.556 | 8.556 | 25.22 | 0.000 |
| Tc × tc × Pau | 1 | 8.556 | 8.556 | 25.22 | 0.000 |
| Error | 16 | 5.428 | 0.339 | ||
| Total | 23 | 728.226 | |||
| R-sq = 99%, R-sq(adj) = 99%, R-sq(pred) = 98% | |||||
| Source | DF | Adj SS | Adj MS | F-Value | p-Value |
|---|---|---|---|---|---|
| Model | 3 | 361.37 | 120.456 | 41.20 | 0.000 |
| Linear | 3 | 361.37 | 120.456 | 41.20 | 0.000 |
| Tc | 1 | 255.45 | 255.454 | 87.37 | 0.000 |
| tc | 1 | 82.51 | 82.51 | 28.22 | 0.000 |
| Pau | 1 | 23.4 | 23.404 | 8.00 | 0.010 |
| Error | 20 | 58.48 | 2.924 | ||
| Lack-of-Fit | 4 | 14.25 | 3.561 | 1.29 | 0.316 |
| Pure Error | 16 | 44.23 | 2.765 | ||
| Total | 23 | 419.85 | |||
| R-sq = 86.1%, R-sq(adj) = 84%, R-sq(pred) = 80% | |||||
| Non-Optimal Curing Parameter | Non-Optimum Properties | Optimal Curing Parameters | Optimum Properties | Improvement (%) | |
|---|---|---|---|---|---|
| Tensile Strength (MPa) | 120 °C 120 min 7 bar (MRCC/CC7) | 1274.8 | 140 °C 120 min 7 bar (CC8) | 1420 | 11.4 |
| Impact Toughness (J) | 10.9 | 140 °C 120 min 3 bar (CC4) | 17.4 | 59.6 | |
| Hardness (HRB) | 51.2 | 140 °C 120 min 7 bar (CC8) | 57.6 | 12.5 |
| CCs | Desirability Value of TS | Desirability Value of IT | Desirability Value of HD | Composite Desirability Value |
|---|---|---|---|---|
| 1 | 0.008 | 0.002 | 0.075 | 0.000 |
| 1 | 0.091 | 0.000 | 0.213 | 0.000 |
| 1 | 0.047 | 0.007 | 0.000 | 0.000 |
| 2 | 0.103 | 0.077 | 0.475 | 0.001 |
| 2 | 0.277 | 0.222 | 0.369 | 0.008 |
| 2 | 0.237 | 0.098 | 0.338 | 0.003 |
| 3 | 0.000 | 0.368 | 0.225 | 0.000 |
| 3 | 0.249 | 0.310 | 0.213 | 0.005 |
| 3 | 0.451 | 0.397 | 0.419 | 0.025 |
| 4 | 0.798 | 0.976 | 0.713 | 0.185 |
| 4 | 0.929 | 0.946 | 0.606 | 0.178 |
| 4 | 0.846 | 1.000 | 0.706 | 0.199 |
| 5 | 0.170 | 0.062 | 0.044 | 0.000 |
| 5 | 0.336 | 0.044 | 0.275 | 0.001 |
| 5 | 0.265 | 0.051 | 0.225 | 0.001 |
| 6 | 0.423 | 0.181 | 0.506 | 0.013 |
| 6 | 0.130 | 0.223 | 0.519 | 0.005 |
| 6 | 0.016 | 0.224 | 0.663 | 0.001 |
| 7 * | 0.403 | 0.570 | 0.213 | 0.016 |
| 7 * | 0.751 | 0.558 | 0.294 | 0.041 |
| 7 * | 0.706 | 0.625 | 0.450 | 0.066 |
| 8 | 1.000 | 0.909 | 0.894 | 0.271 |
| 8 | 0.941 | 0.946 | 0.750 | 0.222 |
| 8 | 0.964 | 0.895 | 1.000 | 0.288 |
| Option | Tc (°C) | tc (min) | Pau (bar) | Tensile Strength (MPa) | Impact Toughness (J) | Hardness (HRB) | Average Composite Desirability |
|---|---|---|---|---|---|---|---|
| CC8 * | 140 | 120 | 7 | 1420 †,‡ | 16.5 † | 57.6 †,‡ | 0.260 |
| CC4 | 140 | 120 | 3 | 1400 | 17.4 ‡ | 55.7 | 0.187 |
Publisher’s Note: MDPI stays neutral with regard to jurisdictional claims in published maps and institutional affiliations. |
© 2022 by the authors. Licensee MDPI, Basel, Switzerland. This article is an open access article distributed under the terms and conditions of the Creative Commons Attribution (CC BY) license (https://creativecommons.org/licenses/by/4.0/).
Share and Cite
Ahmad, F.; Awadh, M.A.; Abas, M.; Noor, S.; Hameed, A. Optimization of Carbon Fiber Reinforced Plastic Curing Parameters for Aerospace Application. Appl. Sci. 2022, 12, 4307. https://doi.org/10.3390/app12094307
Ahmad F, Awadh MA, Abas M, Noor S, Hameed A. Optimization of Carbon Fiber Reinforced Plastic Curing Parameters for Aerospace Application. Applied Sciences. 2022; 12(9):4307. https://doi.org/10.3390/app12094307
Chicago/Turabian StyleAhmad, Fareed, Mohammed Al Awadh, Muhammad Abas, Sahar Noor, and Asad Hameed. 2022. "Optimization of Carbon Fiber Reinforced Plastic Curing Parameters for Aerospace Application" Applied Sciences 12, no. 9: 4307. https://doi.org/10.3390/app12094307