
Reliability Prediction Method for Low-Cycle Fatigue Life of Compressor Disks Based on the Fusion of Simulation and Zero-Failure Data

Abstract
:1. Introduction
2. Reliability Assessment Method Based on Fusion of Simulation and Test Data
2.1. Life Reliability Assessment Method for Zero-Failure Data
2.1.1. Bayes Estimation Method for Failure Probability
2.1.2. Calculation of Life Confidence Limits
- 1.
- Normal distribution
- 2.
- Weibull distribution
2.2. Reliability Assessment Method for Fusion of Simulation and Test Data
2.2.1. Lifetime Reliability Simulation Test Method
2.2.2. Lifetime Reliability Prediction Method Based on Data Fusion
- 1.
- Normal distribution
- 2.
- Weibull distribution
3. Numerical Example
4. Reliability Analysis of Compressor Disks
4.1. Low-Cycle Fatigue Test of Compressor Disks
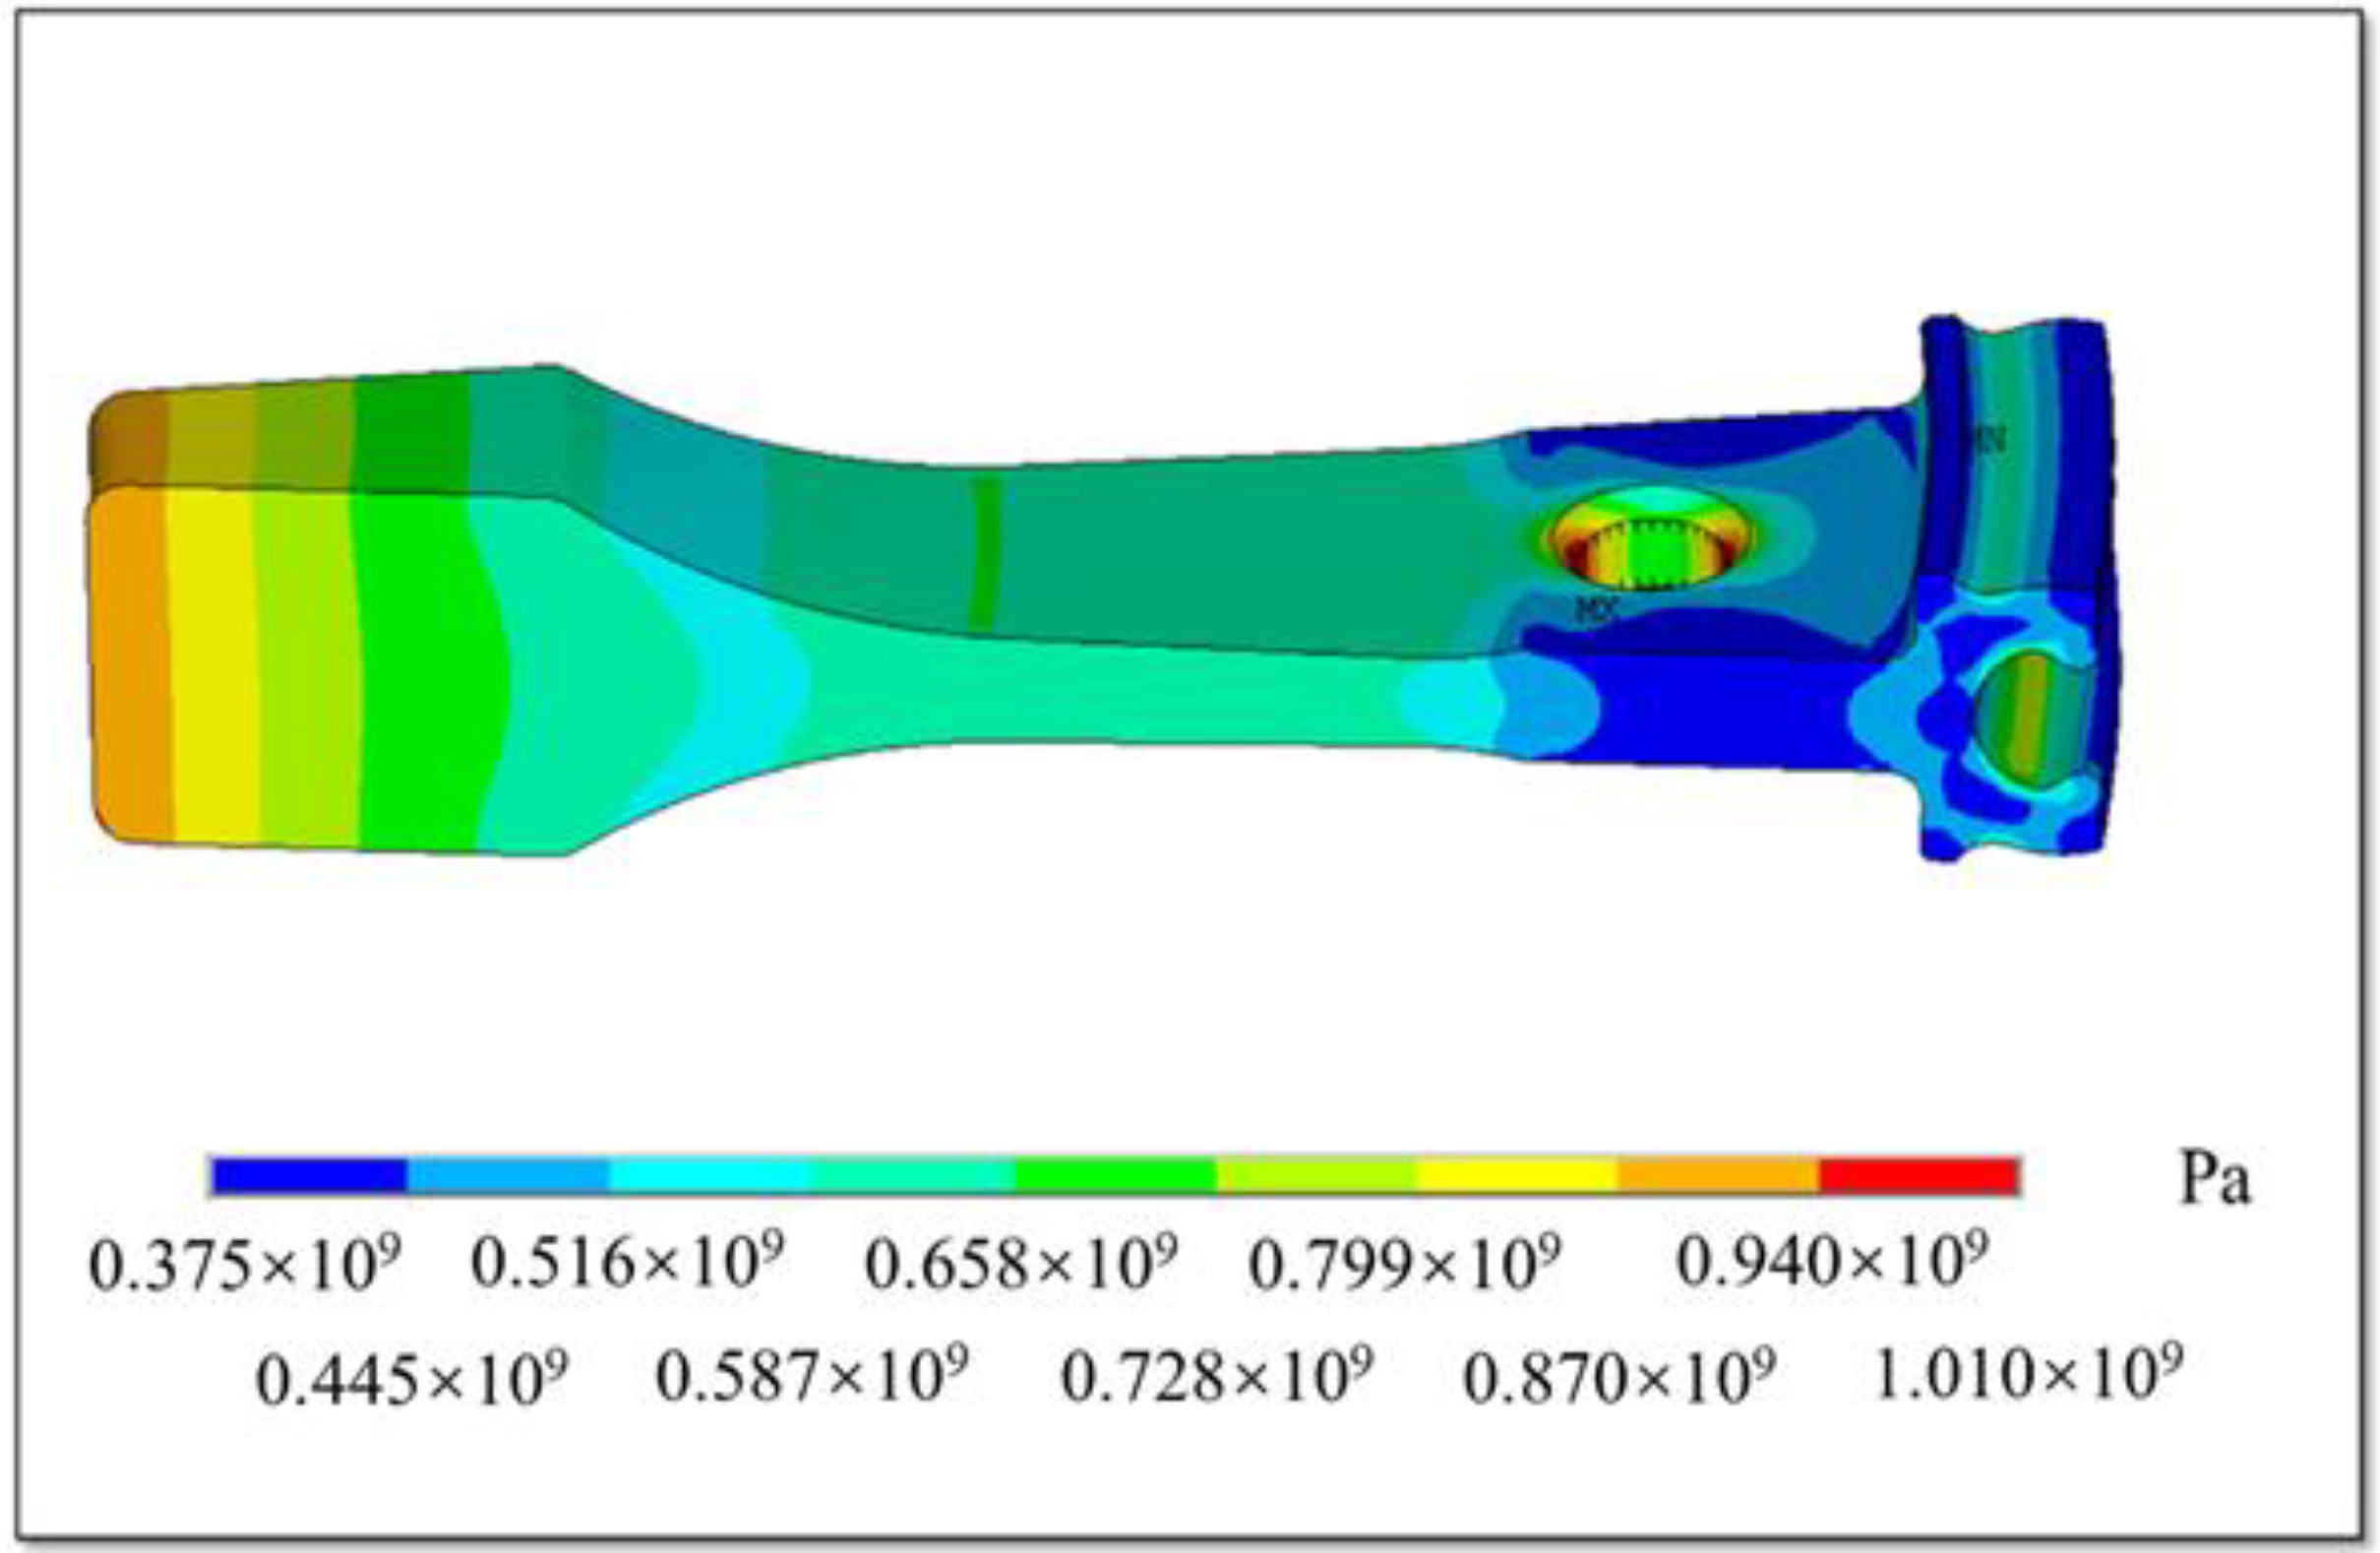
4.2. Simulation-Based Uncertainty Analysis of Compressor Disks
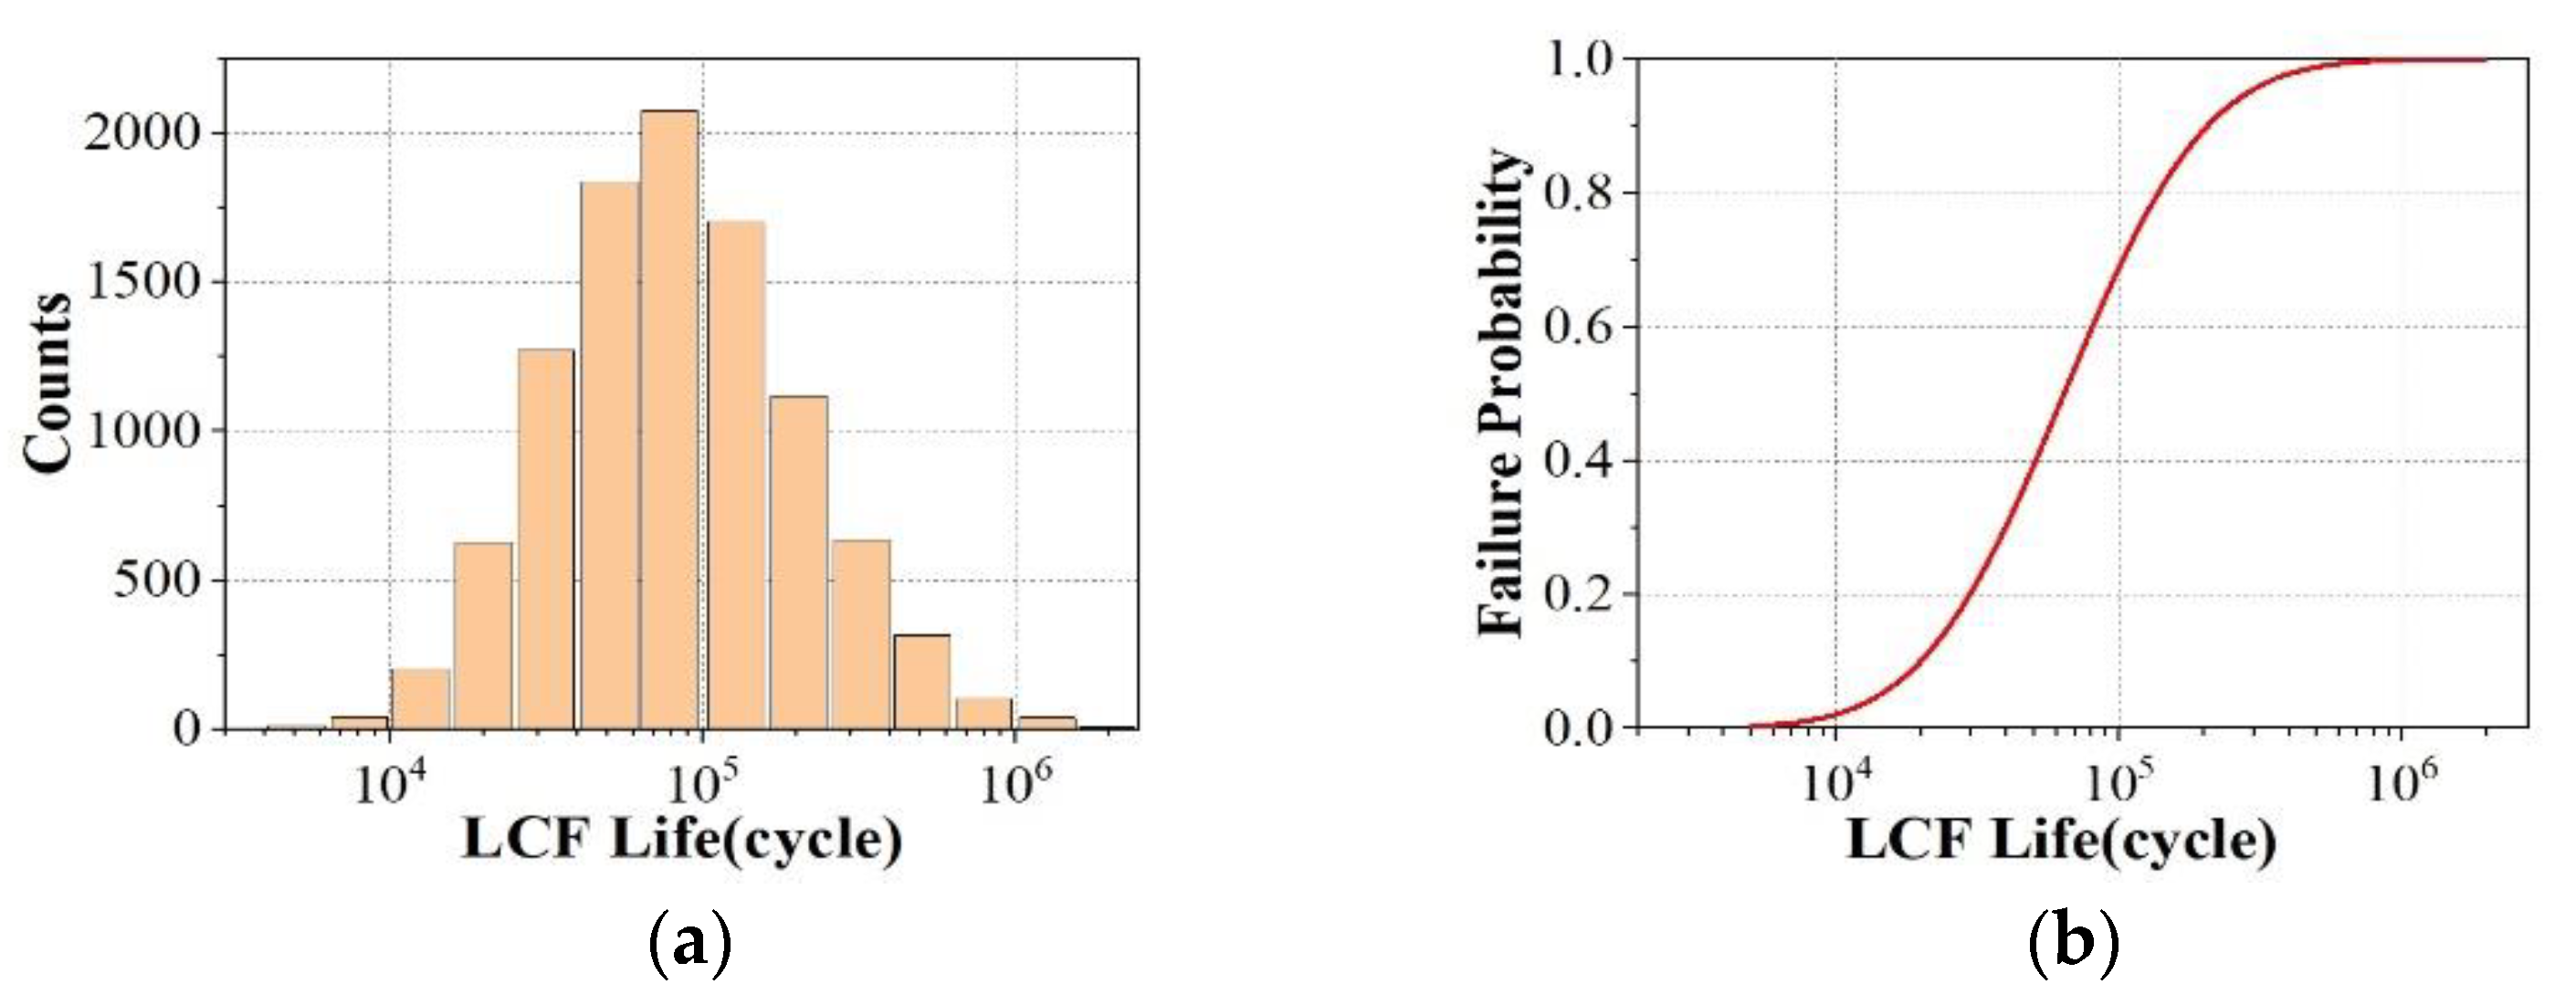
4.3. Life Reliability Assessment
5. Conclusions
- A reliability assessment method involving the fusion of simulation and test data, as well as a simulation evaluation method, was proposed. On the basis of the Bayesian method for zero-failure data, a reliability life prediction method based on data fusion theory was proposed that involves the fusion of test and simulation data. According to the principle of “high probability”, we developed a method for stimulating the life and reliability testing through confidence limits. This method can solve problems of non-normal distributions such as the Weibull distribution, which is commonly used in engineering.
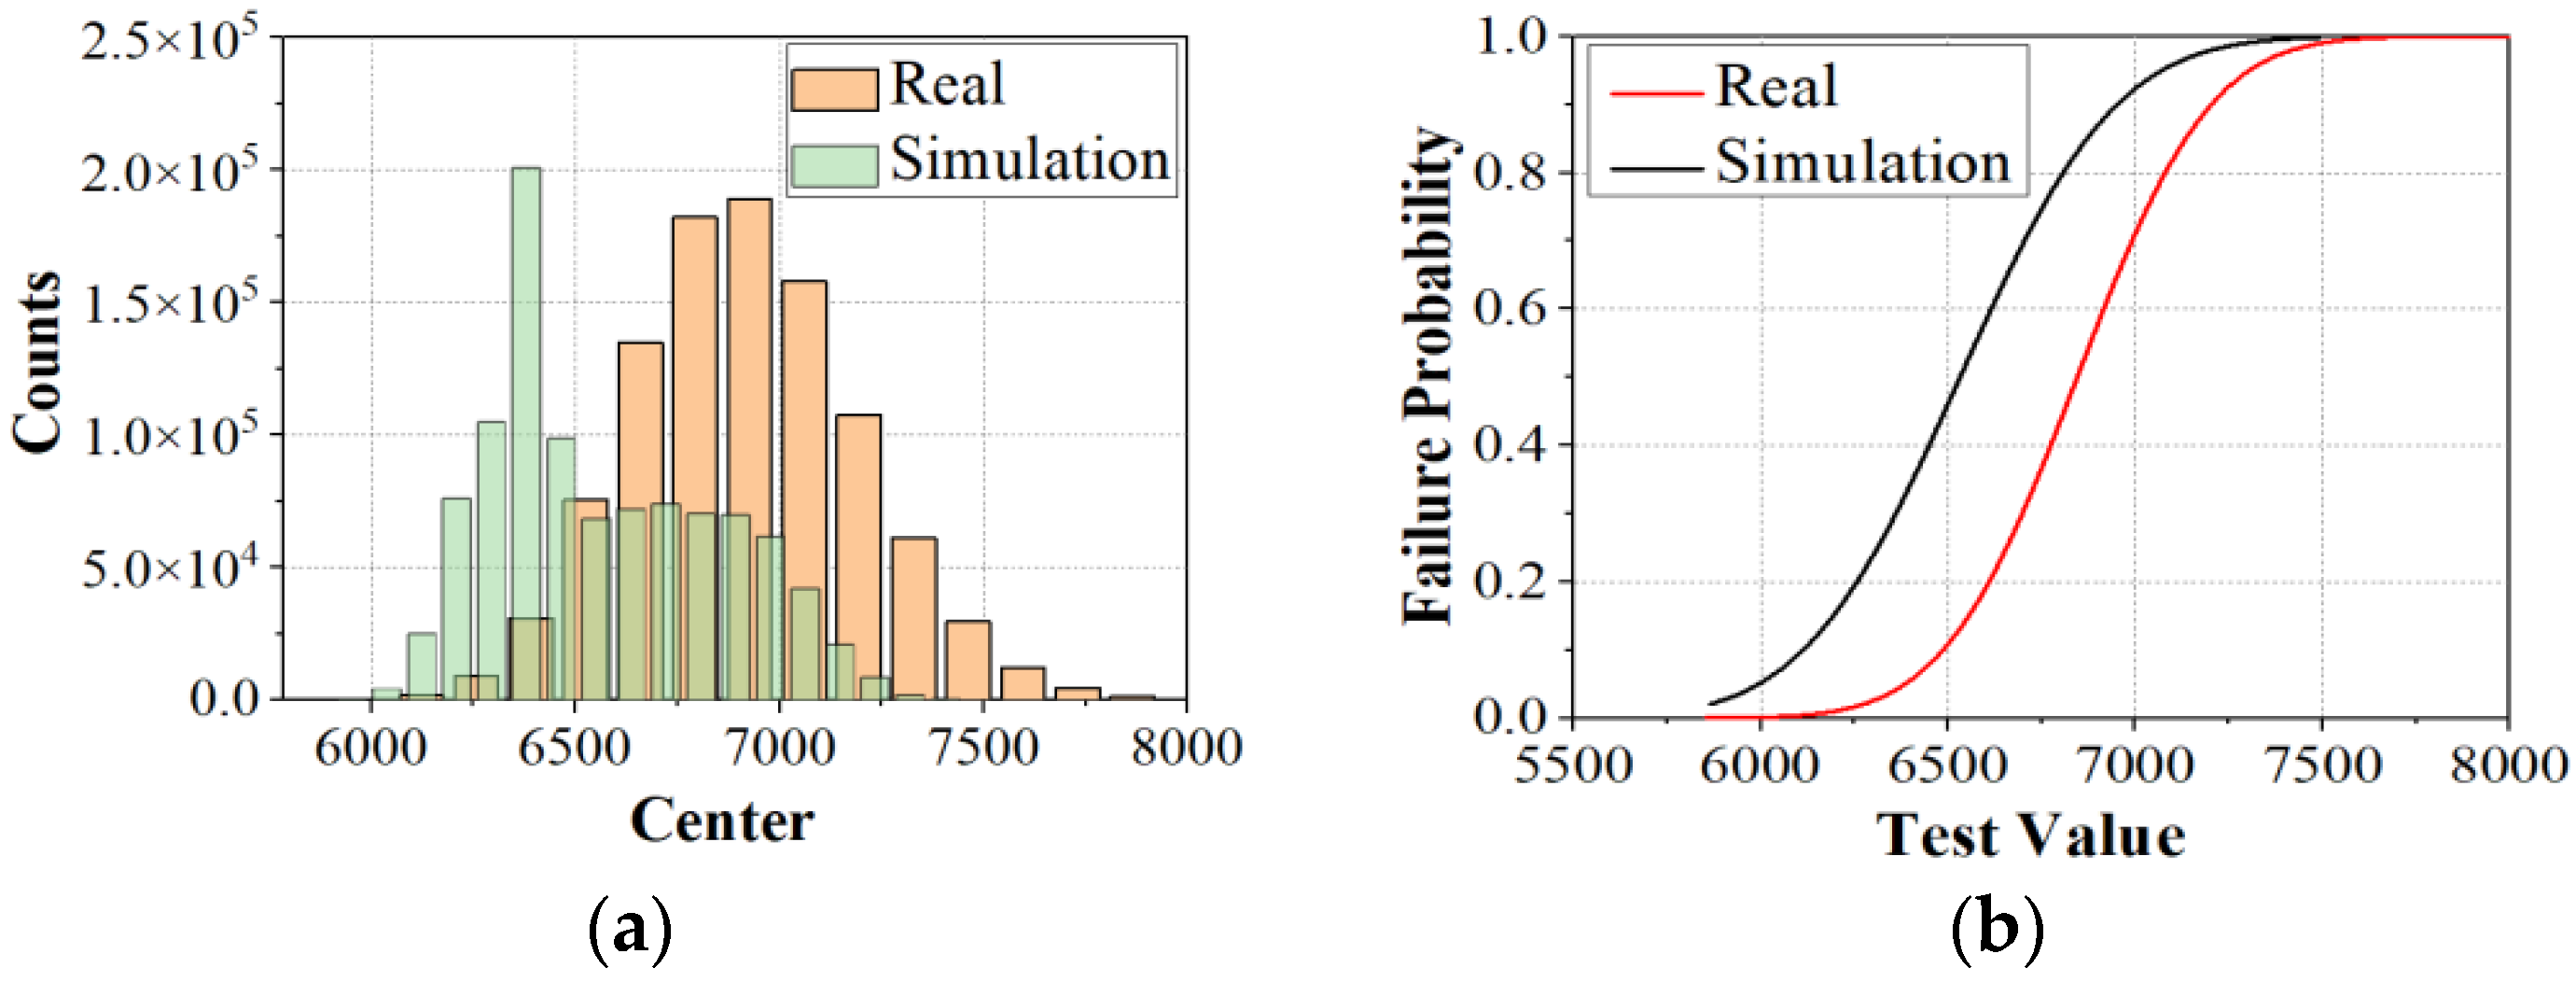
- The proposed simulation and test data fusion method was validated by a numerical example. The results indicated that the error of the predicted life was reduced by 10.9% compared with that obtained using the original method under reasonable simulation conditions.
- An LCF life reliability assessment was conducted for an aero-engine compressor disk, taking advantage of zero-failure data from the test and the simulation reliability assessment. Multiple sources of uncertainty were fully considered and quantified, such as the geometry, model parameters, and discrete errors. The uncertainties were quantified via geometric measurements of 13 actual compressor disks and fatigue test data of 42 specimens.
- An LCF life reliability analysis of compressor disks was performed using the proposed reliability assessment method based on the fusion of test and simulation data. The results indicated that the lower confidence limit of the life predicted via the method using the fusion of test and simulation data was 6.02% higher than that of the evaluation method based on zero-failure test data at a reliability of 99.87% and a confidence level of γ = 0.95.
Author Contributions
Funding
Data Availability Statement
Conflicts of Interest
Abbreviations
| Symbols | Meaning |
| Truncated time | |
| Failure probability | |
| The total number of specimens without failure at | |
| Upper limit of prior failure probability | |
| The mean of the normal distribution | |
| Standard deviation of normal distribution | |
| Weibull distribution shape parameter | |
| Weibull distribution scale parameter | |
| confidence coefficient | |
| Reliability | |
| the Q-percentile life | |
| The lower bound formula of the Q-percentile life | |
| The upper bound formula of the Q-percentile life | |
| Predicted life from simulated | |
| Predicted life from test | |
| Predicted fe from data fusion | |
| The zero-failure data with sample sizes obtained from the test | |
| The zero-failure data with sample sizes obtained from the simulation | |
| The zero-flure data with sample sizes obtained from the groups of previous test results | |
| The total sample sizes of zero-failure data |
References
- Wang, F. Low-cycle fatigue life prediction and experimental verification of a turbine disk. Mach. Manuf. Auto-Mation 2018, 47, 4. [Google Scholar]
- Wang, W.P. Validation and Verification of Simulation Model Validit; National University of Defense Technology: Changsha, China, 1998. [Google Scholar]
- Qian, X.C. Research on Simulation Model Validation and Calibration Methods Considering the Influence of Uncertainty. Ph.D. Thesis, Harbin Institute of Technology, Harbin, China, 2016. [Google Scholar]
- Fu, H.M.; Liang, C.H. Theory of confidence comparison test. Mech. Strength 2003, 25, 413–419. [Google Scholar]
- Jardine, A.; Lin, D.; Banjevic, D. A review on machinery diagnostics and prognostics implementing condition-based maintenance. Mech. Syst. Signal Processing 2006, 20, 1483–1510. [Google Scholar] [CrossRef]
- He, J.; Sun, Y.Z. A multi-source reliability data fusion method based on expert scoring. Aircr. Des. 2012, 32, 54–57. [Google Scholar]
- Liu, X.R. Research on the Reliability Assessment Method of Aero-Engine Wheel. Ph.D. Thesis, Nanjing University of Aeronautics and Astronautics, Nanjing, China, 2011. [Google Scholar]
- Xia, M.; Zhan, X.; Xia, M.; Ma, J. Information fusion based on equipment reliability prediction. In Proceedings of the 10th International Conference on Reliability, Maintainability and Safety, Guangzhou, China, 6–8 August 2014; pp. 606–609. [Google Scholar]
- Wang, D.W.; Wang, W.; Feng, Z.Y. Aero-engine reliability index assessment method based on grey theory. Propuls. Technol. 2014, 35, 874–881. [Google Scholar]
- Byington, C.S.; Watson, M.; Edwards, D. Data-driven neural network methodology to remaining life predictions for aircraft actuator components. In Proceedings of the 2004 IEEE Aerospace Conference Proceedings, Big Sky, MT, USA, 6–13 March 2004; pp. 3581–3589. [Google Scholar]
- Zhang, C.-J.; He, G.; Liang, S.-H.; Chen, G.-J. Fault diagnosis of analog circuits based on neural network information fusion. J. Circuits Syst. 2007, 12, 25–29. [Google Scholar]
- Liu, Y.J. Improved Neural Network-Based Fault Diagnosis and Performance Prediction for Civil Aircraft Engines. Ph.D. Thesis, Nanjing University of Aeronautics and Astronautics, Nanjing, China, 2012. [Google Scholar]
- Guo, L.; Li, N.; Jia, F.; Lei, Y.; Lin, J. A recurrent neural network based health indicator for remaining useful life prediction of bearings. Neurocomputing 2017, 240, 98–109. [Google Scholar] [CrossRef]
- Huang, H.Z.; Cui, P.L.; Peng, W.; Gao, H.Y.; Wang, H.-K. Fatigue life assessment of aircraft engine disk via multi-source information fusion. Int. J. Turbo Jet-Engines 2014, 31, 167–174. [Google Scholar] [CrossRef]
- Ma, J.; Ye, M.; Chao, D.H.; Chen, S.Y.; Yu, M. Reliability estimation of fiber optic gyro based on multi-source information fusion technique. Chin. J. Inert. Technol. 2012, 20, 759–764. [Google Scholar]
- Fang, G.H. Research on Multi-Source Information Fusion Technology in Product Reliability Assessment. Ph.D. Thesis, Hefei University of Technology, Hefei, China, 2006. [Google Scholar]
- Fu, H.M. Fuzzy Regression Analysis and Data Fusion. China Saf. Sci. J. 2002, 12, 4. [Google Scholar]
- Guida, M.; Pulcini, G.; Vianello, M. Early inference on reliability of upgraded automotive components by using past data and technical information. J. Stat. Plan. Inference 2009, 139, 1604–1618. [Google Scholar] [CrossRef]
- Qian, Z.; Jia, X.; Guo, B.; Cheng, Z. Real-time Bayes estimation of residual life based on multisource information fusion. In Proceedings of the Prognostics and System Health Management Conference, Chongqing, China, 26–28 October 2018; pp. 215–222. [Google Scholar]
- Qian, Z.; Jia, X.; Guo, B. Bayesian estimation of residual life for Weibull distributed products based on the fusion of different forms of expert information. In Proceedings of the 19th International Conference on Software Quality, Reliability and Security Companion (QRS-C), Sofia, Bulgaria, 22–26 July 2019; pp. 260–267. [Google Scholar]
- Ma, Z.B.; Zhu, J.S.; Xu, N.X. A reliability assessment method using multiple information sources. Comput. Phys. 2003, 20, 391–398. [Google Scholar]
- Chai, J.; Shi, Y.M.; Wei, J.Q.; Li, X.C. A fusion method for prior distribution under multiple sources of prior information. Sci. Technol. Eng. 2005, 5, 1479–1481. [Google Scholar]
- Liu, D.D.; Fu, H.M. A New data fusion method. Chin. J. Saf. Sci. 1998, 8, 4. [Google Scholar]
- Zhang, Z. Statistical analysis about zero-failure data. Math. Theory Appl. Probab. 1995, 1, 94–101. [Google Scholar]
- Mao, S.S.; Guan, W.Q. Handling of zero-failure data in bearing life tests. Appl. Probabilistic Stat. 1993, 9, 326–331. [Google Scholar]
- Zhang, Z.Z.; Yang, Z.H. Invalidation-free data processing. Math. Stat. Appl. Probab. 1989, 4, 507–516. [Google Scholar]
- Fu, H.M.; Wang, P.H. Reliability assessment and life prediction without failure data. Mech. Strength 2004, 26, 260–264. [Google Scholar]
- Fu, H.M.; Liang, C.H. Confidence testing theory. J. Aerodyn. 2003, 18, 167–174. [Google Scholar]
- Liu, X. Research on the Reliability Analysis and Design Method of Multi-Failure Mode Wheel Based on Uncertainty Theory. Ph.D. Thesis, Beijing University of Aeronautics and Astronautics, Beijing, China, 2020. [Google Scholar]
- Leslie, G.P.; Mary, P.W. Foundations of Clinical Research: Applications to Practice, Prentice Hall Health; Pearson/Prentice Hall: Upper Saddle River, NJ, USA, 2015. [Google Scholar]
- Roy, C.J.; Oberkampf, W.L. A comprehensive framework for verification, validation, and uncertainty quantification in scientific computing. Comput. Methods Appl. Mech. Eng. 2011, 200, 2131–2144. [Google Scholar] [CrossRef]
- Smith, K.N.; Watson, P.; Topper, T.H. Stress-strain functions for the fatigue of metals. J. Mater. 1970, 4, 767. [Google Scholar]


| Conditions | Conclusions |
|---|---|
| The simulation was found to be incorrect at confidence level γ The simulation is more adventurous than the real situation and is dangerous for engineering applications. | |
| The simulation was found to be incorrect at confidence level γ However, because the simulation is more conservative and safer than the real situation, it can be applied in engineering. | |
| When , the confidence level 2γ − 1 determines that the simulation is correct, i.e., , at the given accuracy δ. | |
| When , additional testing with additional specimens is needed to determine the reliability. |
| Number | Zero-Failure Value | |||
|---|---|---|---|---|
| 1 | 5995 | 15 | 42 | 0.0116 |
| 2 | 6015 | 12 | 27 | 0.0332 |
| 3 | 6030 | 9 | 15 | 0.0528 |
| 4 | 6050 | 6 | 6 | 0.0681 |
| Bayes Method Prediction Results | Simulation Prediction Results | Fusion Method Predicted Results | True Results | |
|---|---|---|---|---|
| Value | 6000 | 5994 | 6042 | 6385 |
| Error | 385 | 391 | 343 | 0 |
| Parameter | Unit | Distribution Type | Mean Value | Lower Bound of the Mean Value | Upper Bound of the Mean Value | Coefficient of Variation |
|---|---|---|---|---|---|---|
| r1 | mm | normal distribution | 67.15 | 67.13 | 67.18 | 4.77 × 10⁻⁴ |
| r2 | mm | normal distribution | 209.32 | 209.25 | 209.39 | 4.26 × 10⁻⁴ |
| w1 | mm | normal distribution | 29.00 | 28.99 | 29.01 | 2.76 × 10⁻⁴ |
| w7 | mm | normal distribution | 23.00 | 22.99 | 23.01 | 4.35 × 10⁻⁴ |
| ra7 | mm | normal distribution | 10.00 | 9.99 | 10.00 | 3.00 × 10⁻⁴ |
| MPa | lognormal distribution | 7.0712 | 0.0242 | |||
| b | - | normal distribution | −0.0197 | −0.628 | ||
| - | normal distribution | 1.8230 | 0.445 | |||
| c | - | normal distribution | −3.5230 | −0.106 | ||
| A | mm | normal distribution | 6.4013 | 0.195 | ||
| B | - | normal distribution | −3.5146 | −0.0818 | ||
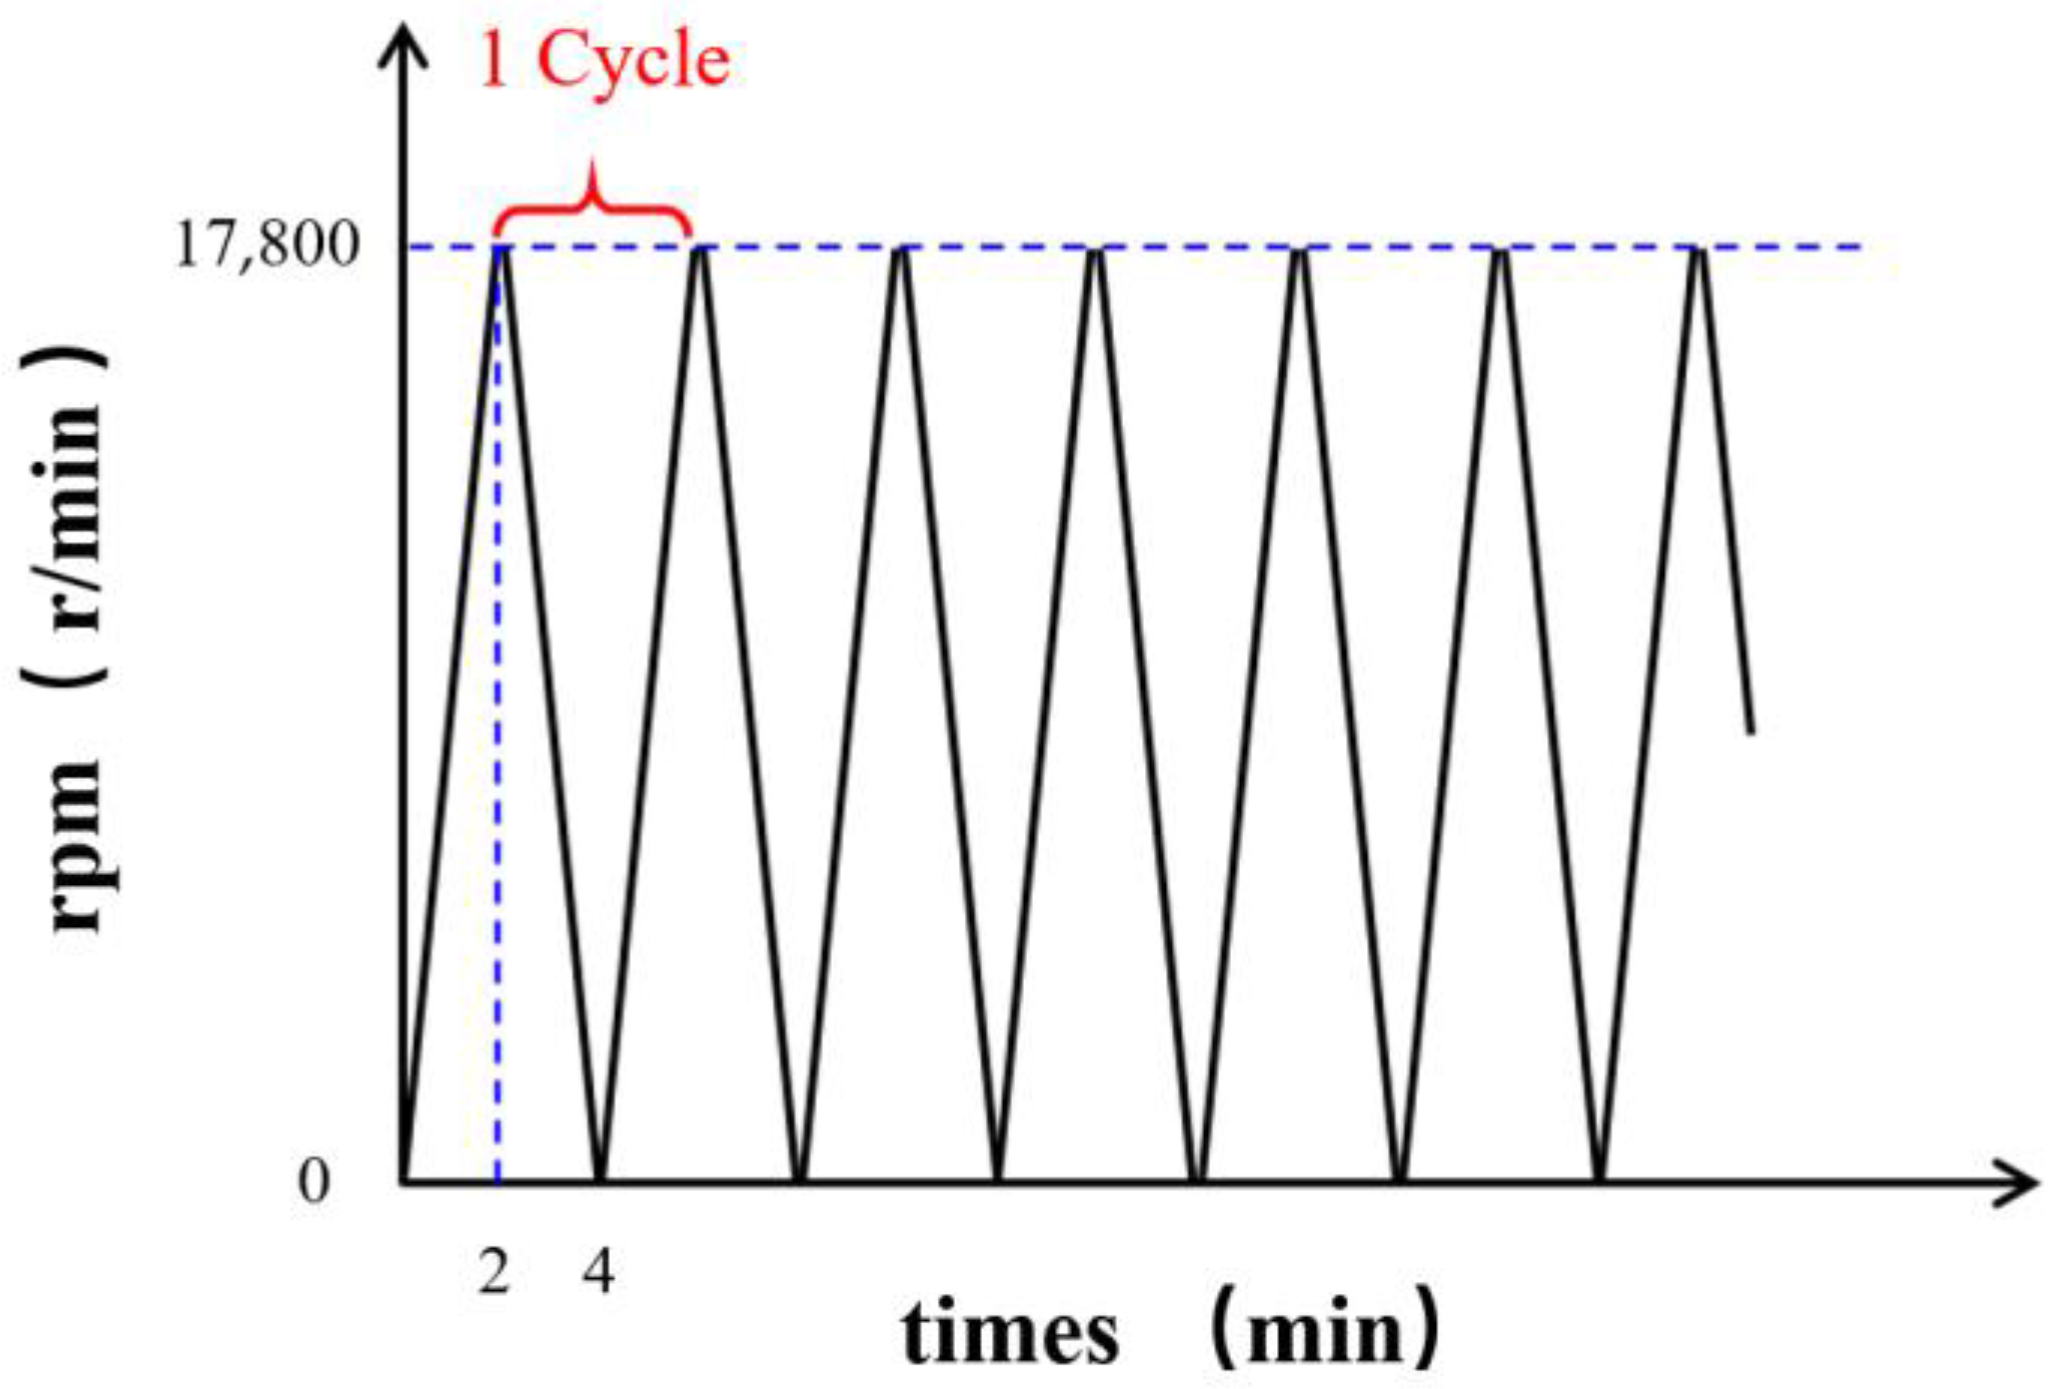
| Angular velocity | r/min | normal distribution | 17,800 | 0.020 | ||
| Temperature | °C | normal distribution | 600 | 0.020 |
| Number | Zero-Failure Value | |||
|---|---|---|---|---|
| 1 | 33,012 | 5 | 13 | 0.0357 |
| 2 | 33,997 | 3 | 8 | 0.0536 |
| 3 | 34,415 | 3 | 5 | 0.0639 |
| 4 | 36,265 | 2 | 2 | 0.0712 |
| Test Prediction Results | Simulation Prediction Results | Fusion Predicted Results | Percentage Increase of Lower Confidence Limit for Reliable Life |
|---|---|---|---|
| 16,340 | 16,251 | 17,324 | 6.02% |
Publisher’s Note: MDPI stays neutral with regard to jurisdictional claims in published maps and institutional affiliations. |
© 2022 by the authors. Licensee MDPI, Basel, Switzerland. This article is an open access article distributed under the terms and conditions of the Creative Commons Attribution (CC BY) license (https://creativecommons.org/licenses/by/4.0/).
Share and Cite
Chen, R.; Chen, G.; Liu, X.; Ai, X.; Zhu, H. Reliability Prediction Method for Low-Cycle Fatigue Life of Compressor Disks Based on the Fusion of Simulation and Zero-Failure Data. Appl. Sci. 2022, 12, 4318. https://doi.org/10.3390/app12094318
Chen R, Chen G, Liu X, Ai X, Zhu H. Reliability Prediction Method for Low-Cycle Fatigue Life of Compressor Disks Based on the Fusion of Simulation and Zero-Failure Data. Applied Sciences. 2022; 12(9):4318. https://doi.org/10.3390/app12094318
Chicago/Turabian StyleChen, Ruoqi, Gaoxiang Chen, Xi Liu, Xing Ai, and Haiyan Zhu. 2022. "Reliability Prediction Method for Low-Cycle Fatigue Life of Compressor Disks Based on the Fusion of Simulation and Zero-Failure Data" Applied Sciences 12, no. 9: 4318. https://doi.org/10.3390/app12094318
APA StyleChen, R., Chen, G., Liu, X., Ai, X., & Zhu, H. (2022). Reliability Prediction Method for Low-Cycle Fatigue Life of Compressor Disks Based on the Fusion of Simulation and Zero-Failure Data. Applied Sciences, 12(9), 4318. https://doi.org/10.3390/app12094318