
Experiment Investigation on Dynamic Failure Characteristics of Water-Saturated Frozen Cement Mortar with Transfixion Joint under Confining Pressure

Abstract
:1. Introduction
2. Materials and Methods
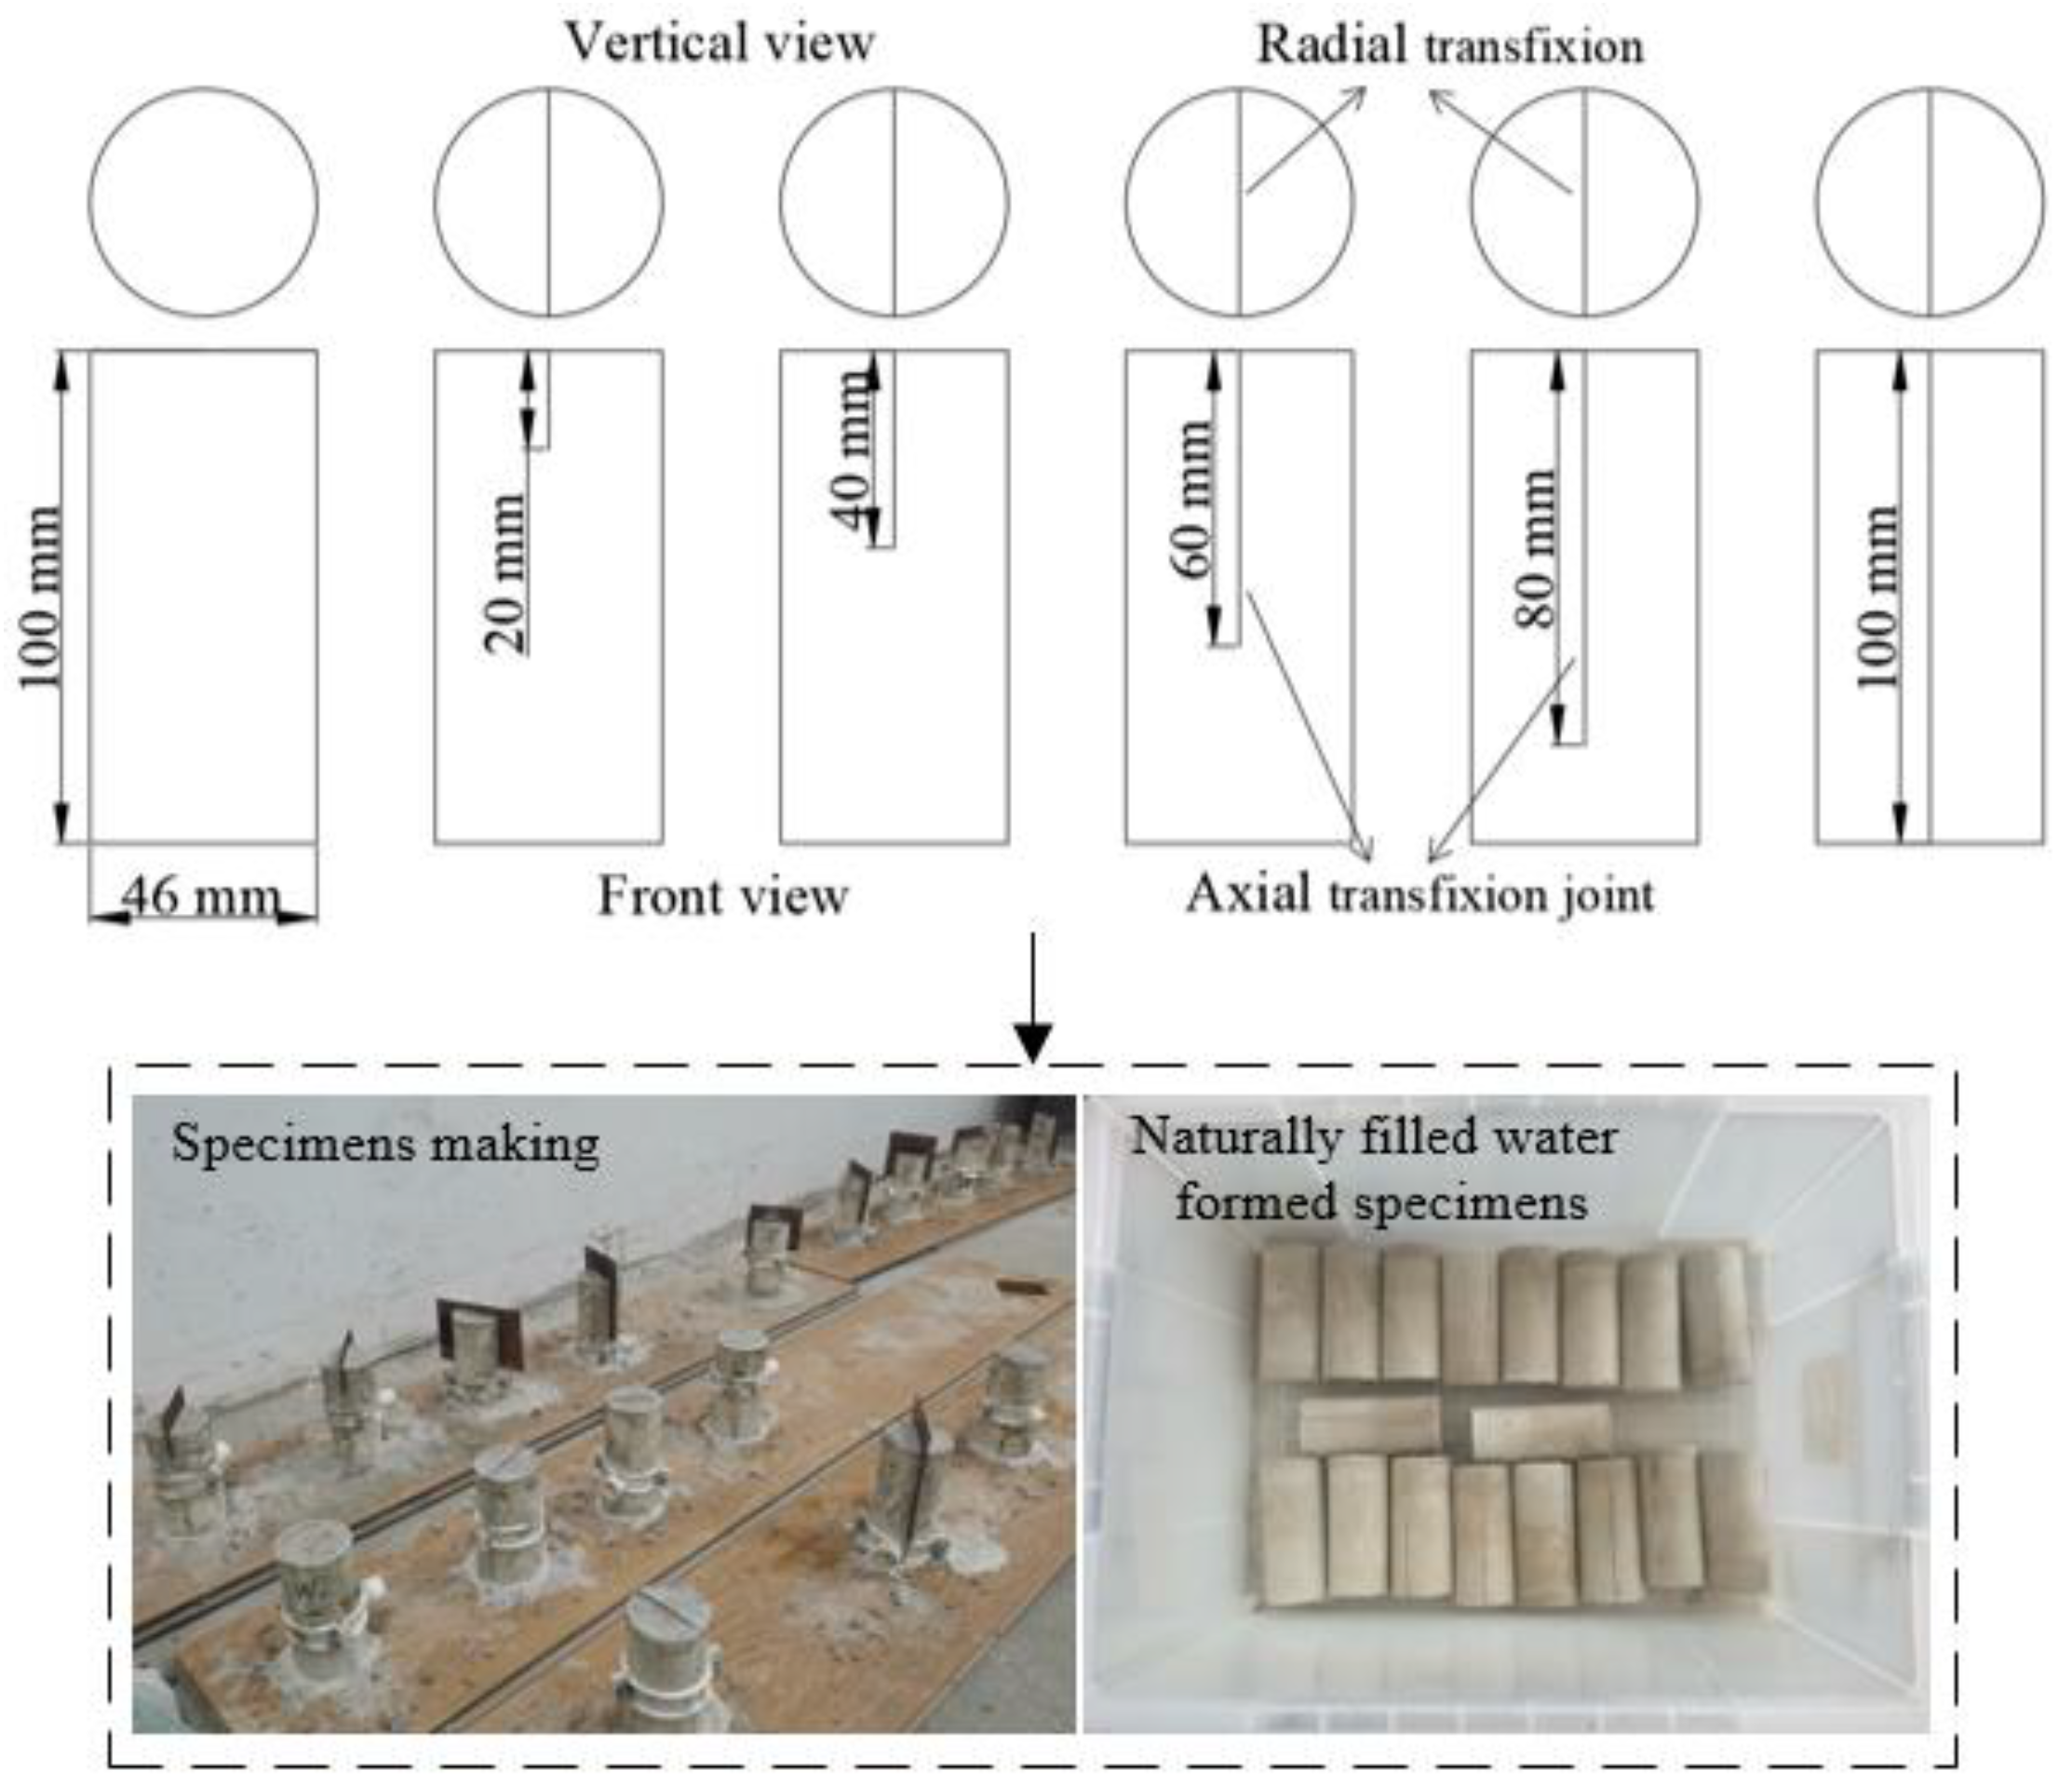
2.1. Cement Mortar Specimen Preparation
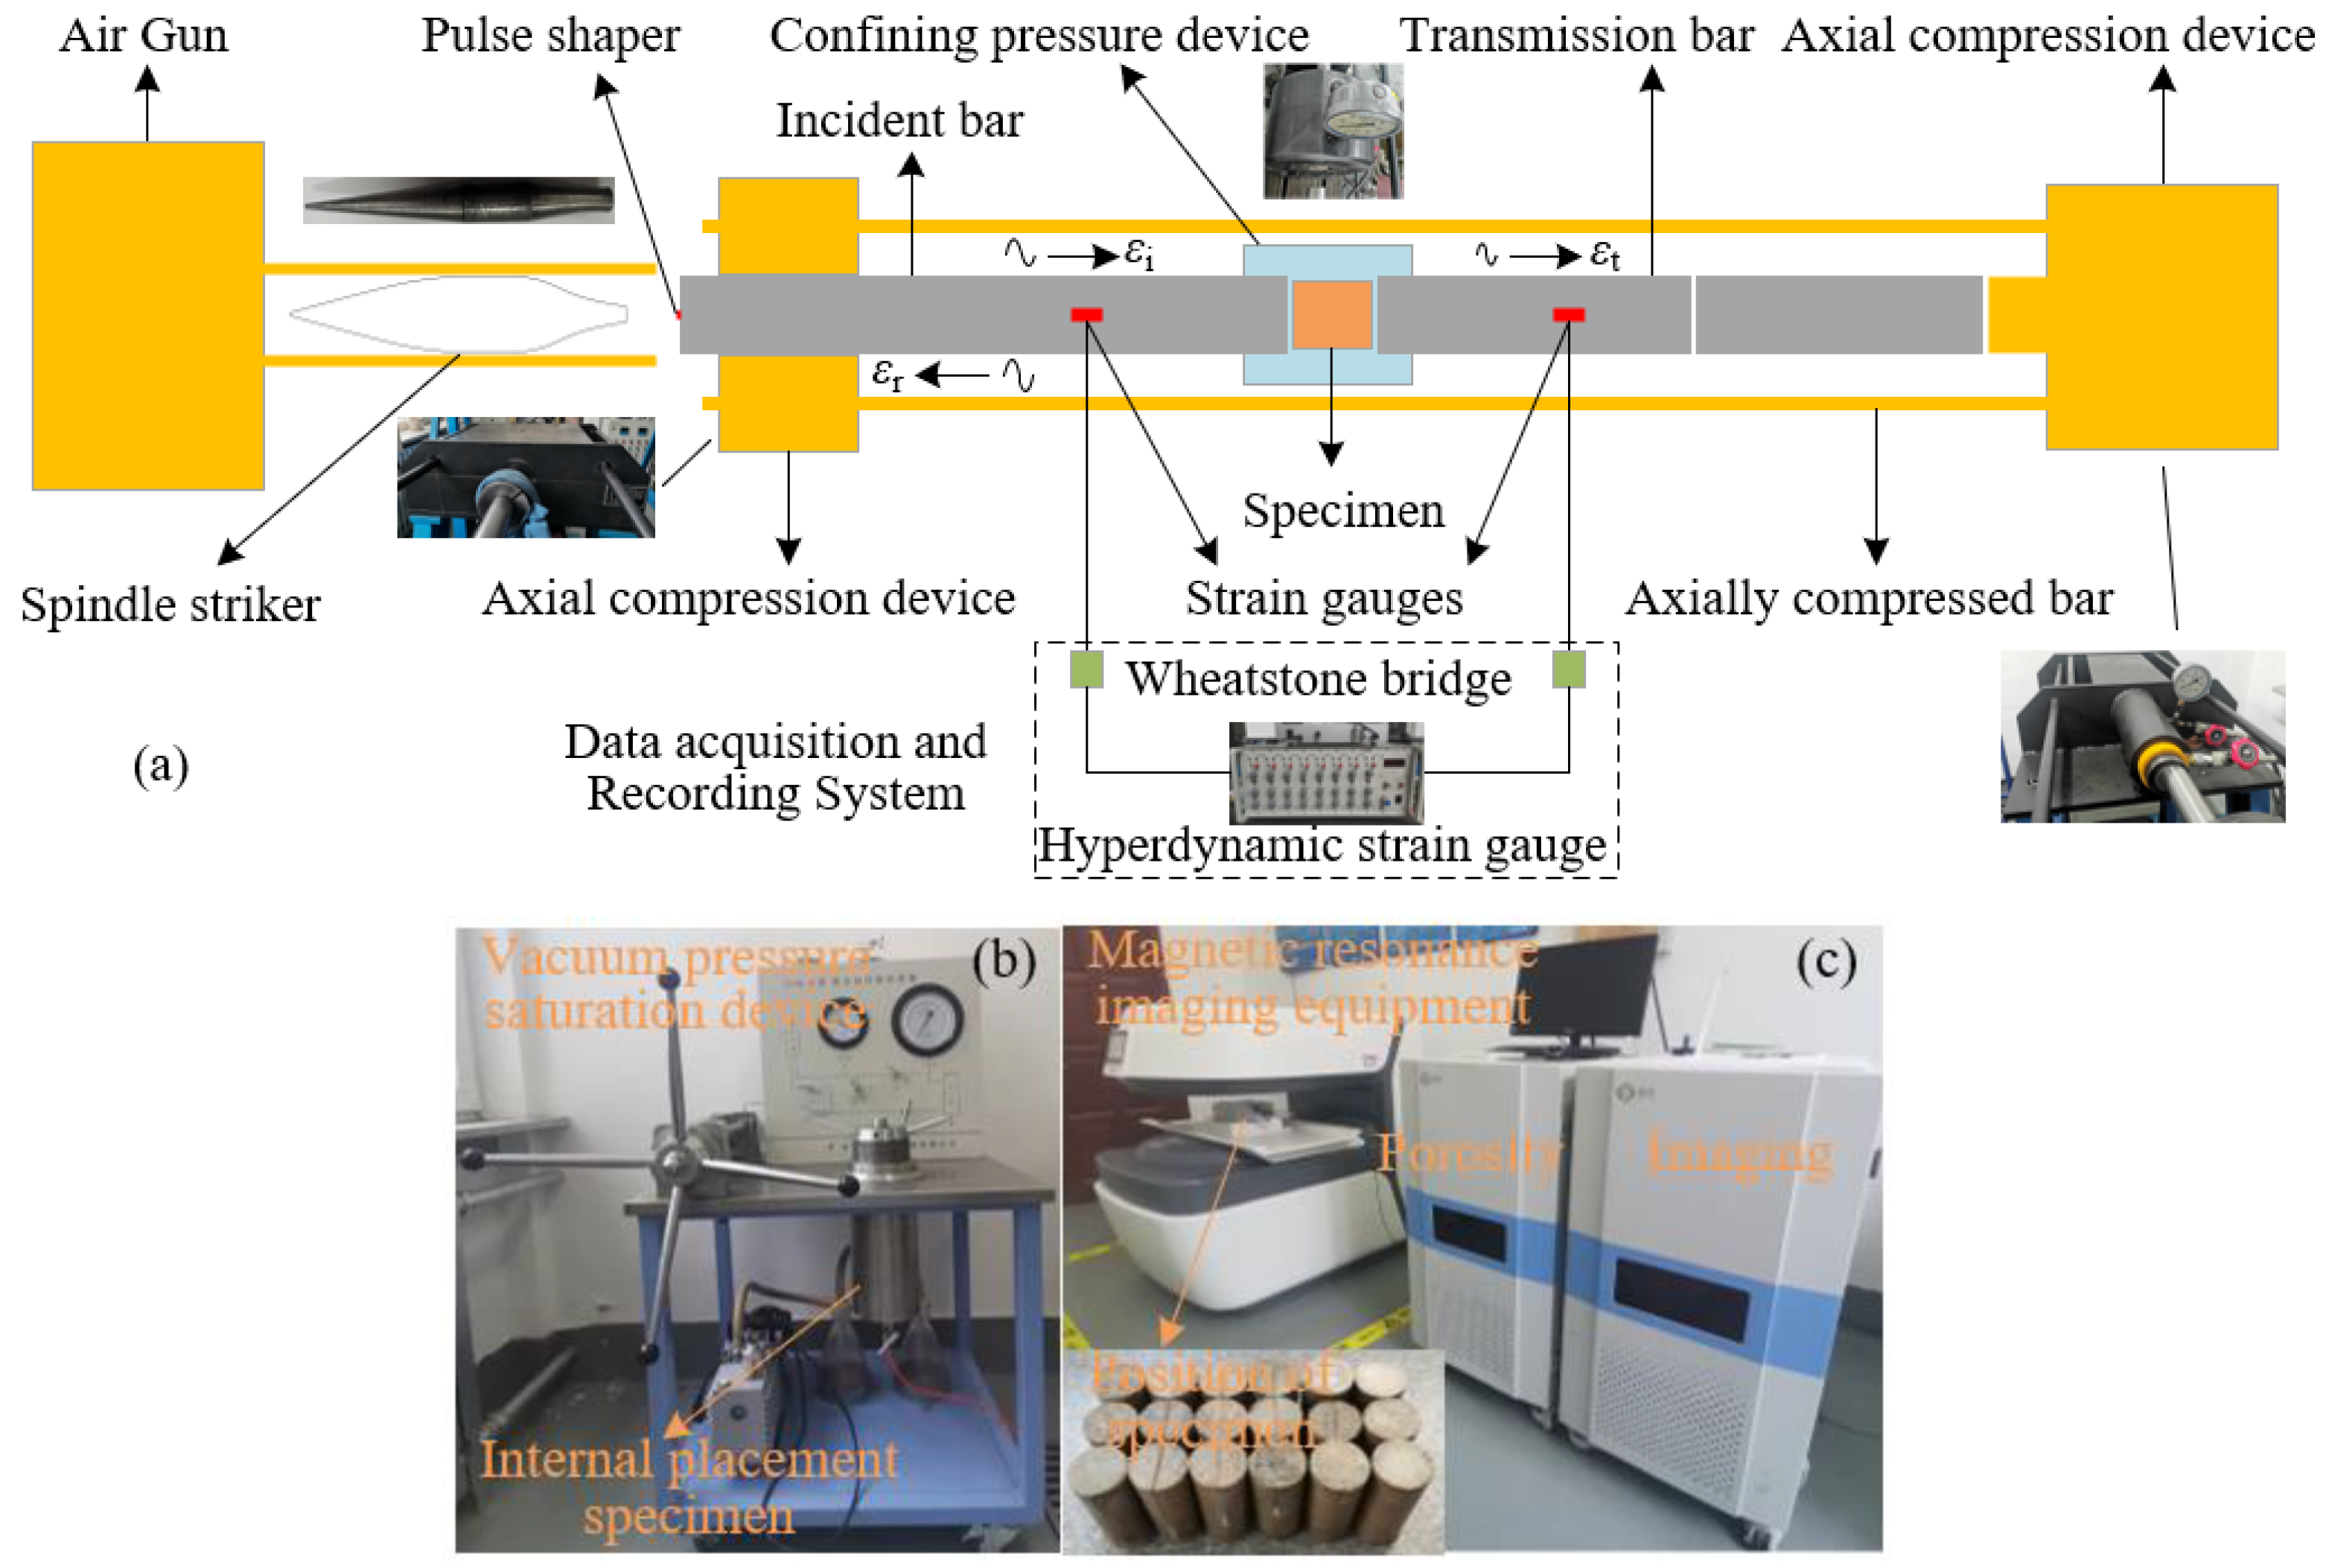
2.2. Test System and Test Content
3. Effect of Axial Joint Transfixion Degree on Dynamic Strength
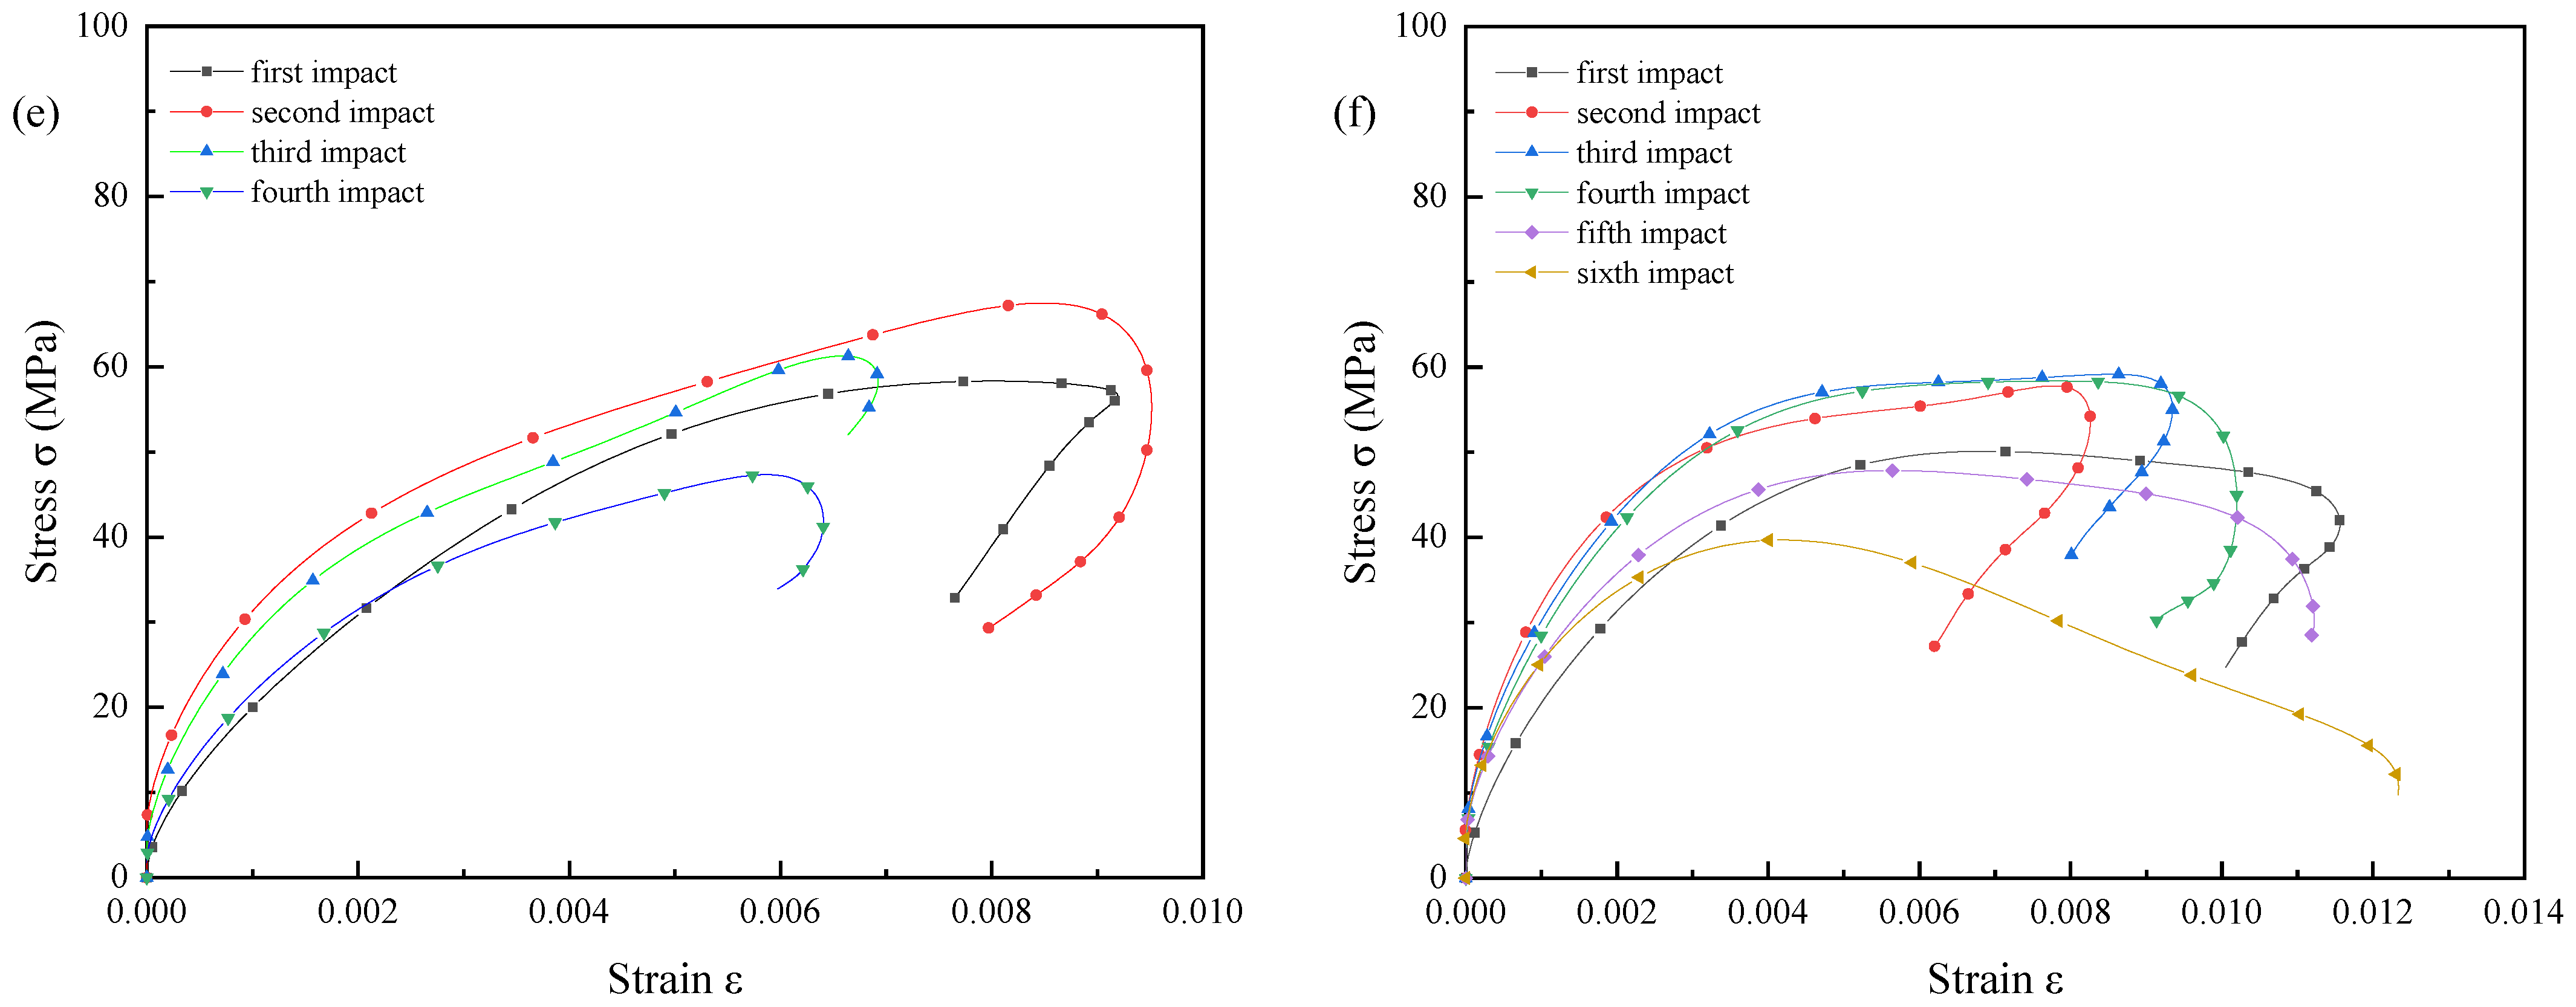
3.1. Stress-Strain Curve
3.2. Peak Strength
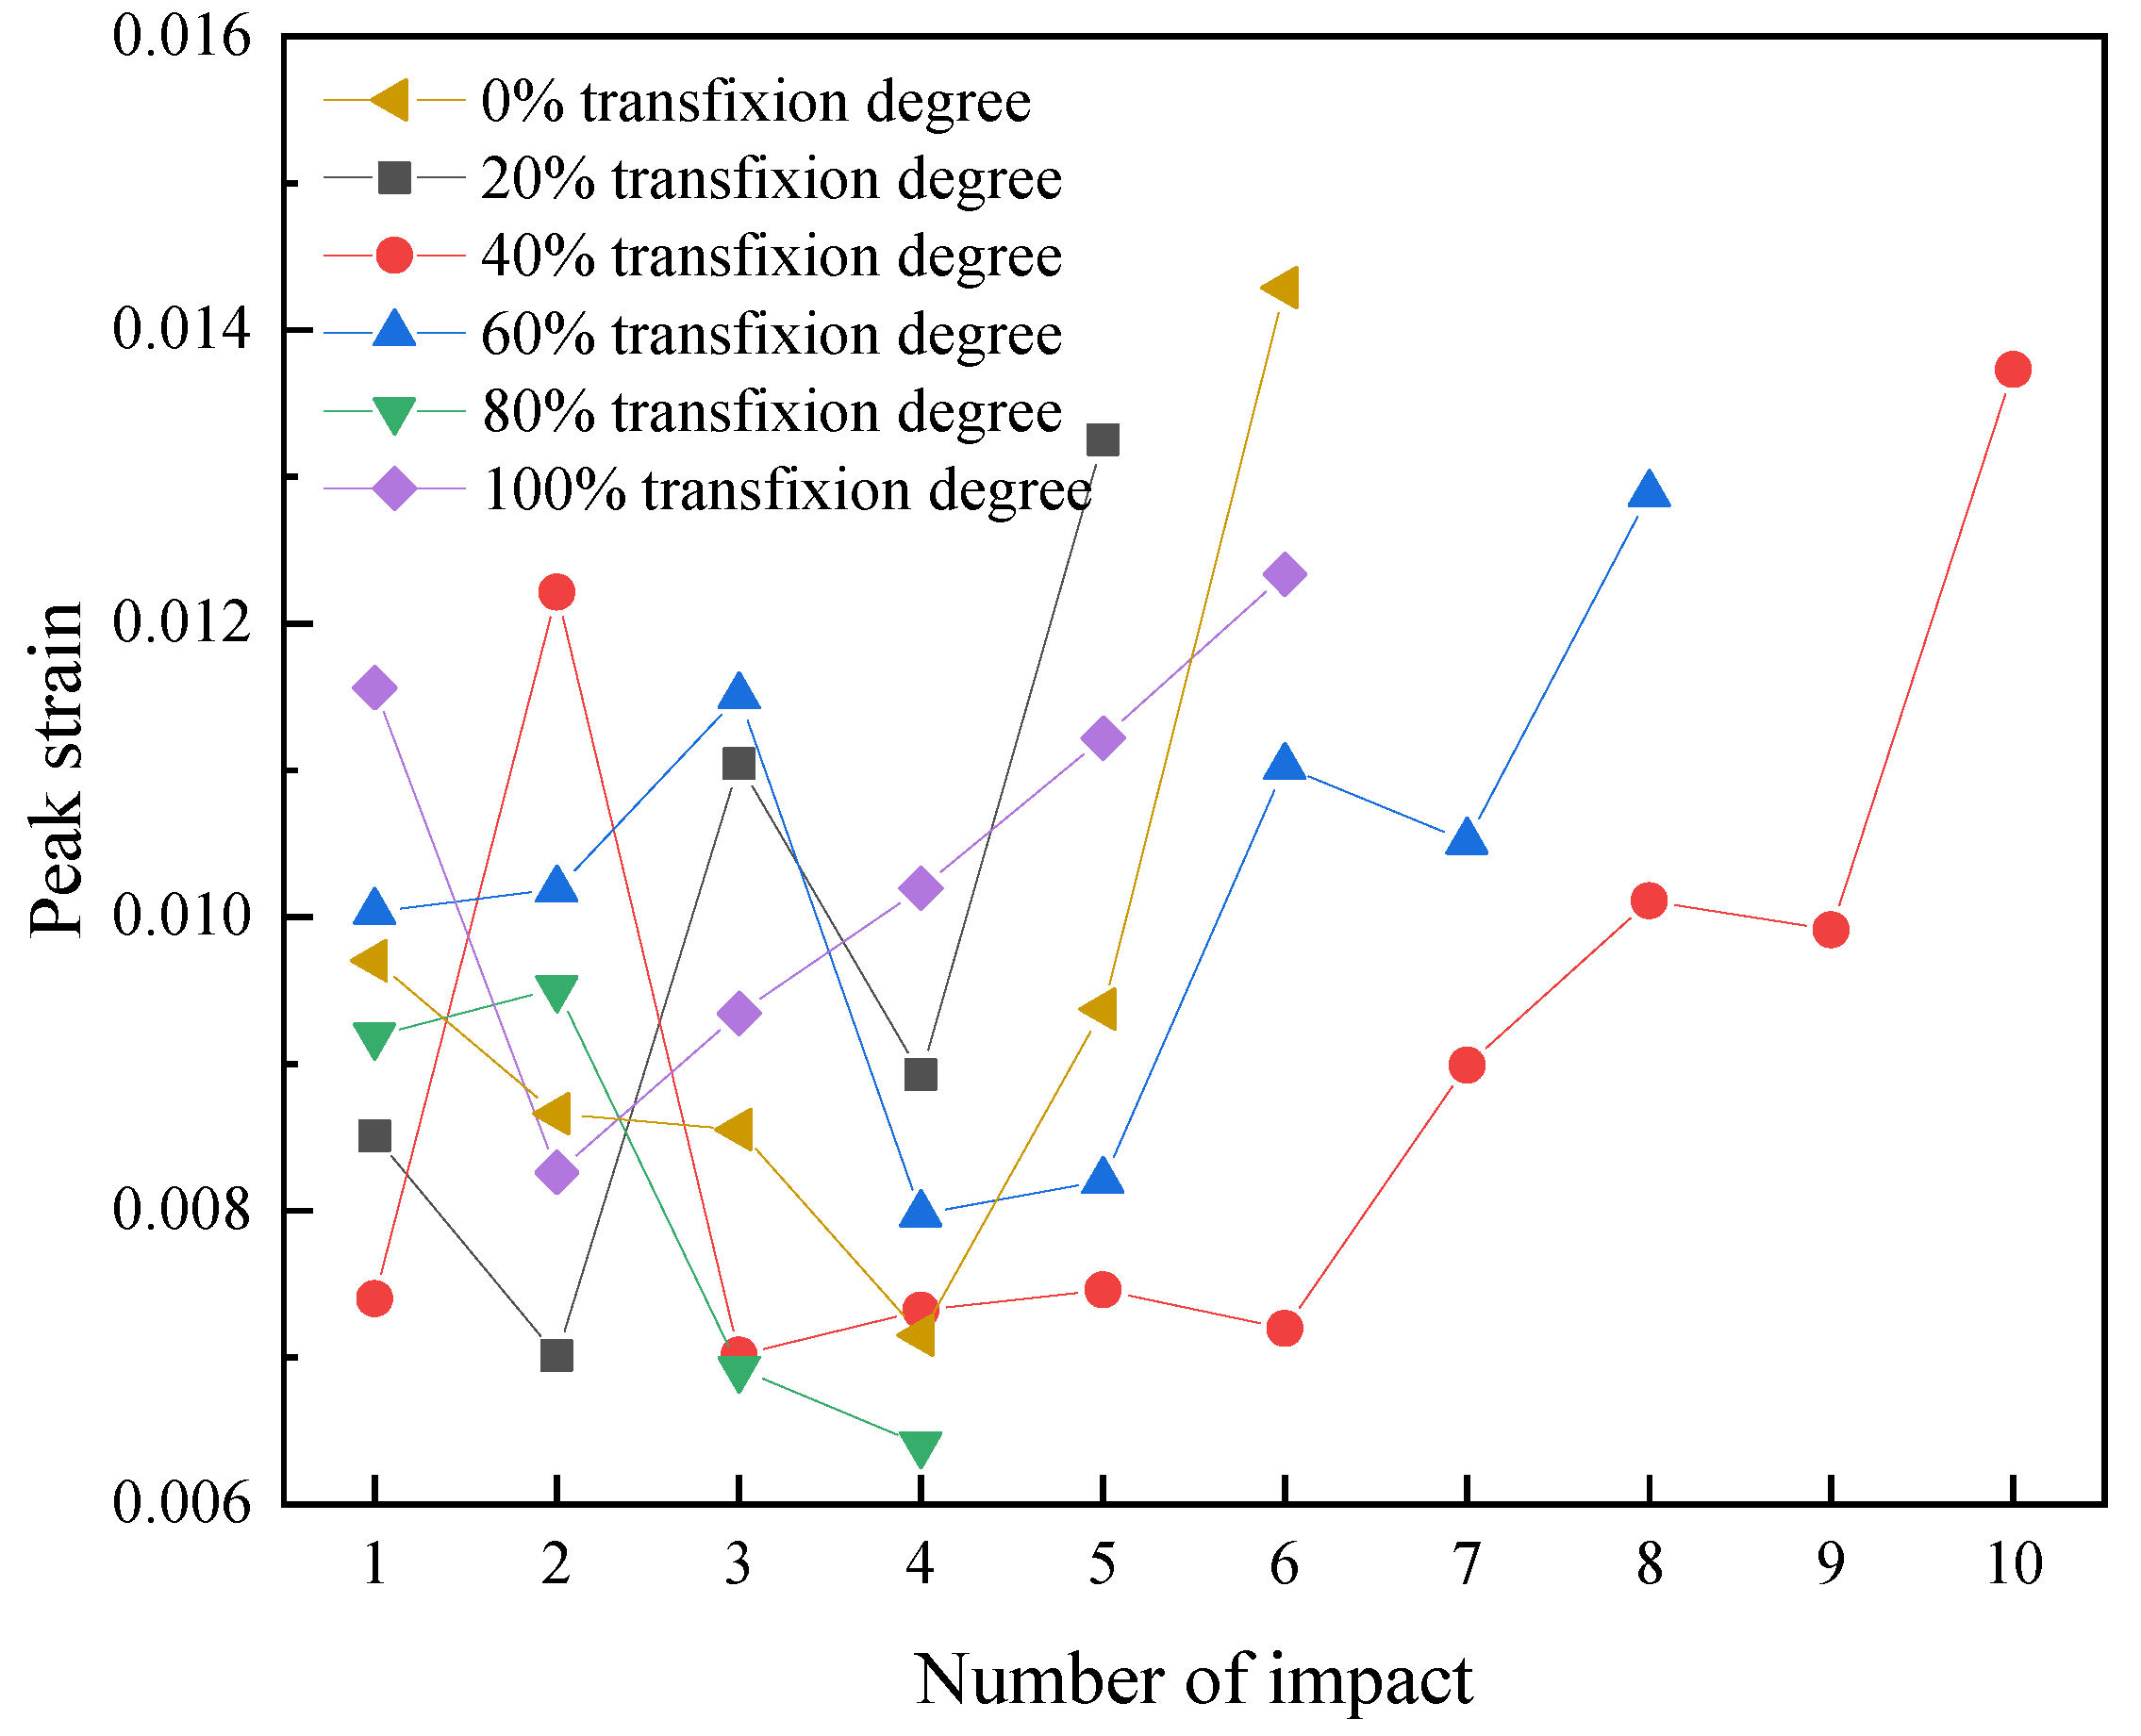
3.3. Peak Strain
4. Influence of Axial Joint Transfixion Degree on Energy Dissipation
4.1. Energy Density per Unit Time
4.2. Analysis of Energy Composition
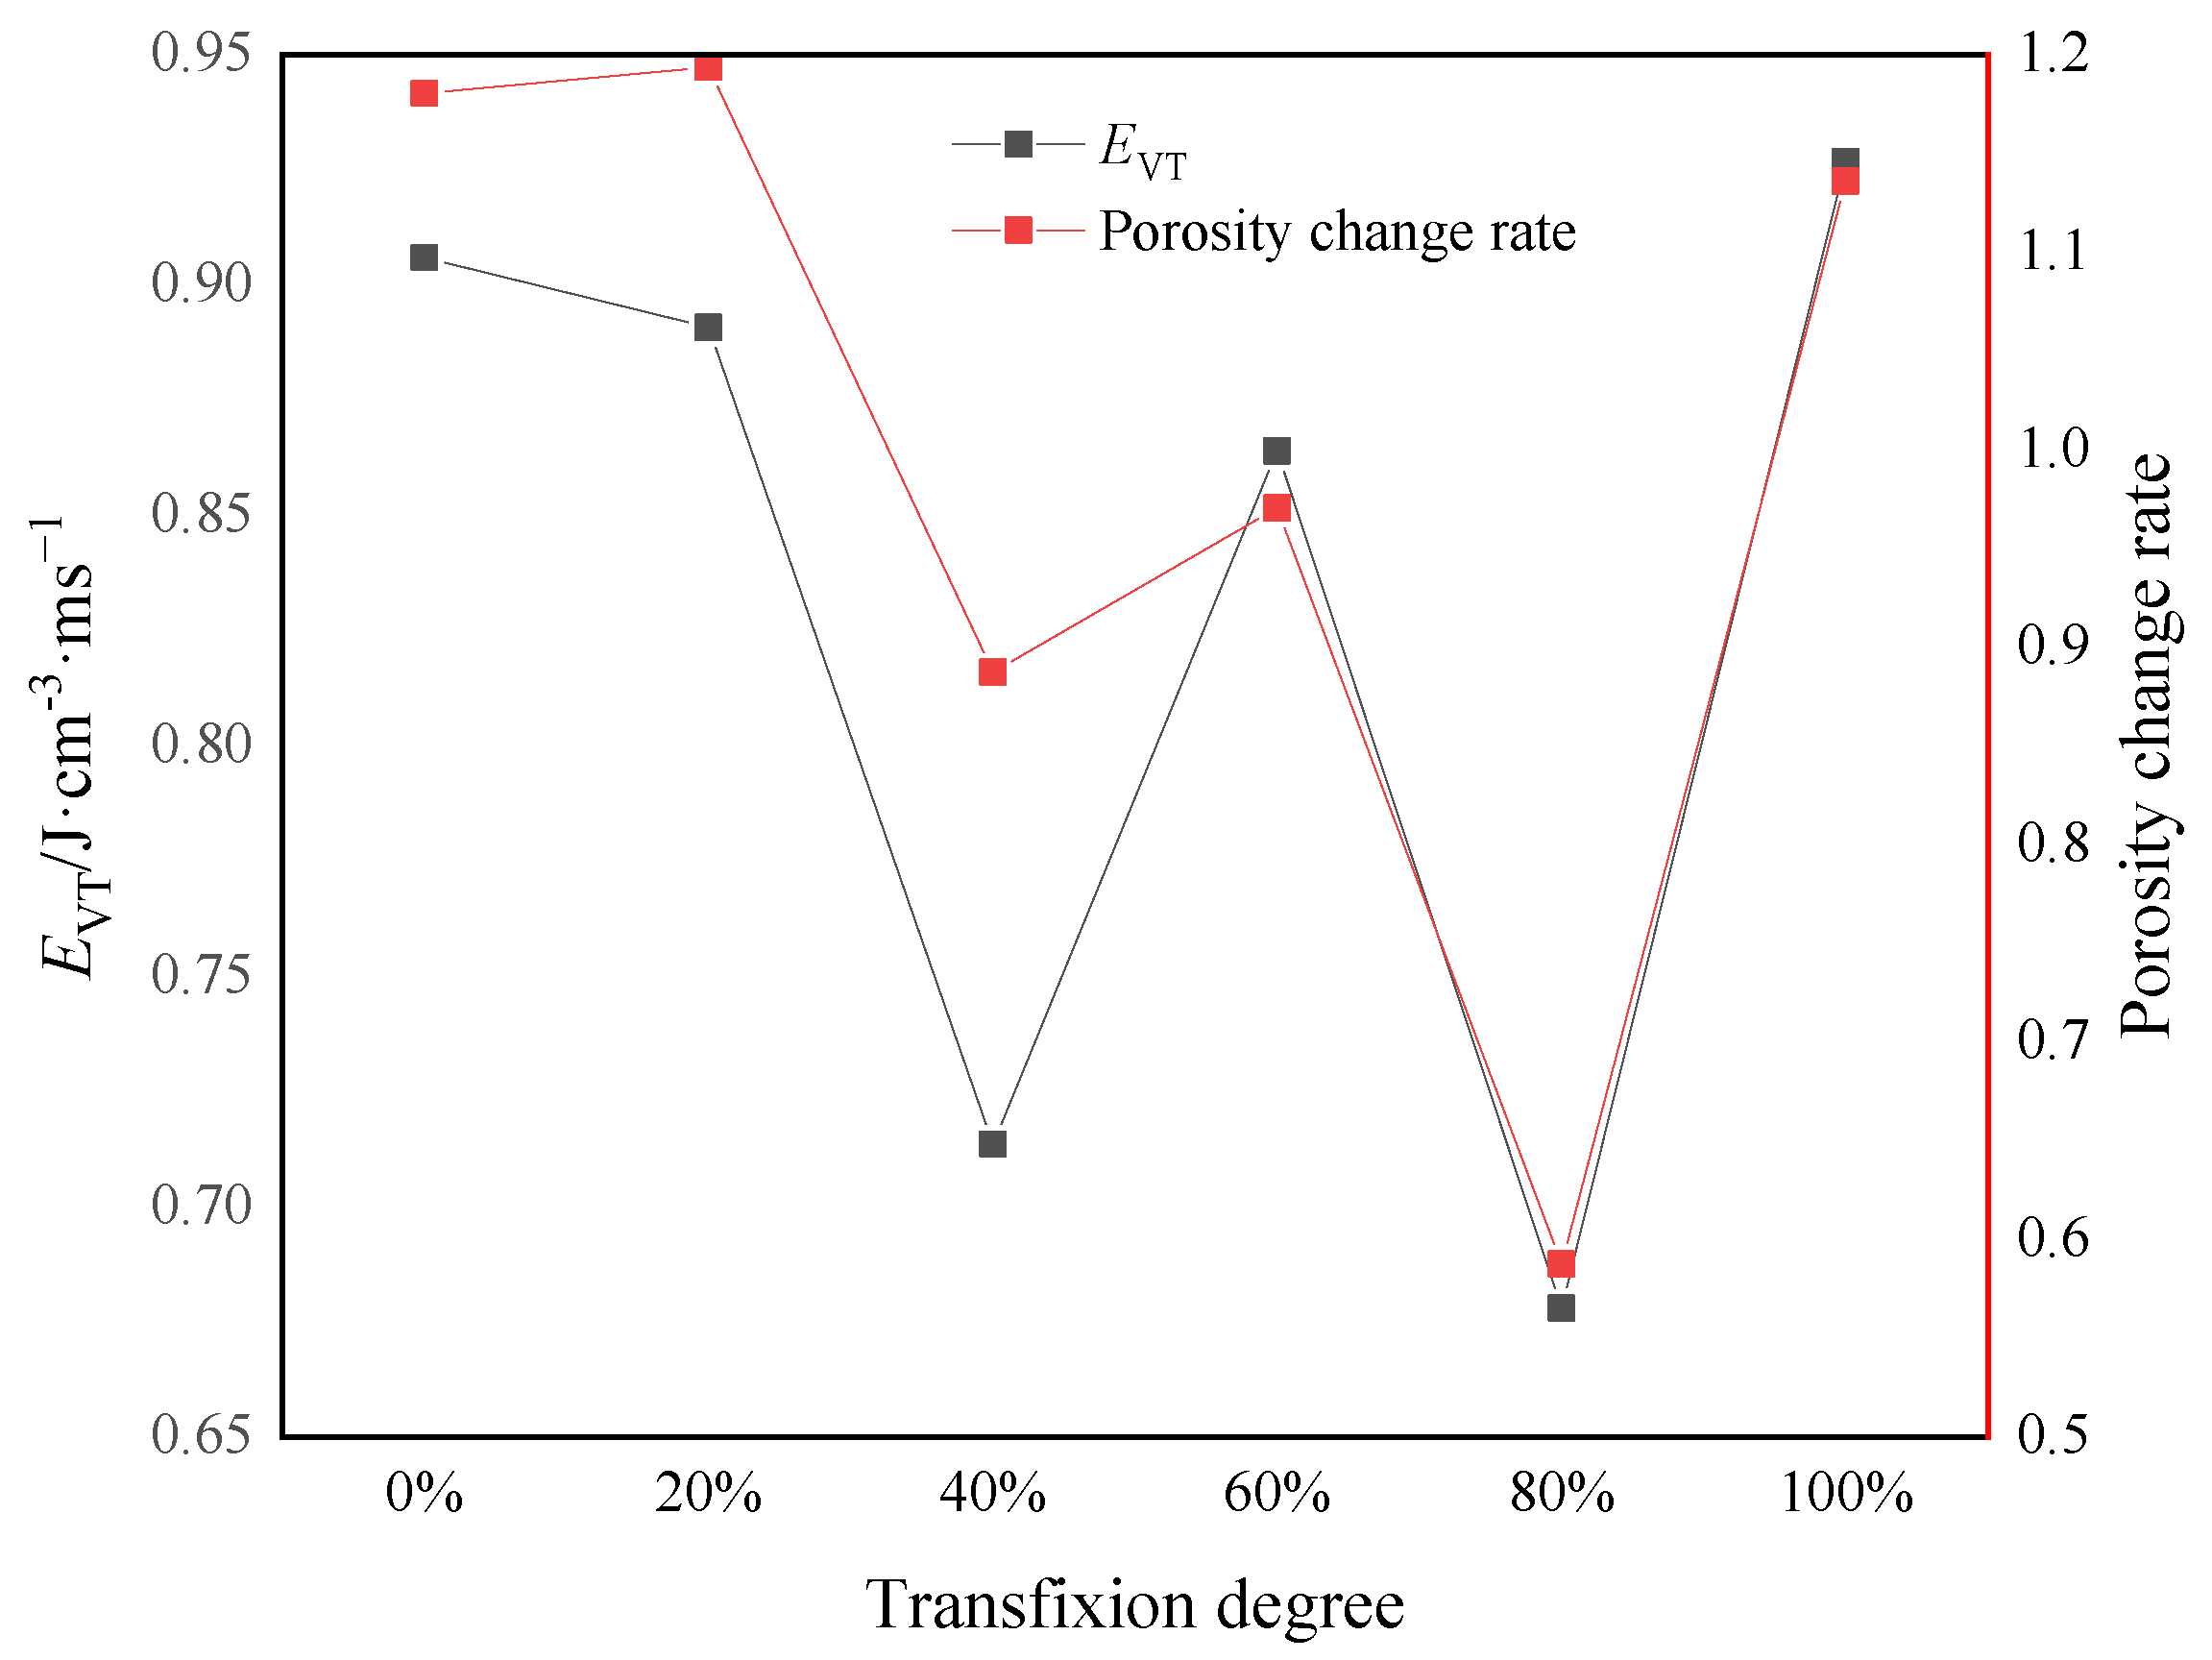
4.3. Analysis of the Relationship between Energy Absorption and Porosity Change
5. Influence of Axial Joint Transfixion Degree on Specimen Damage
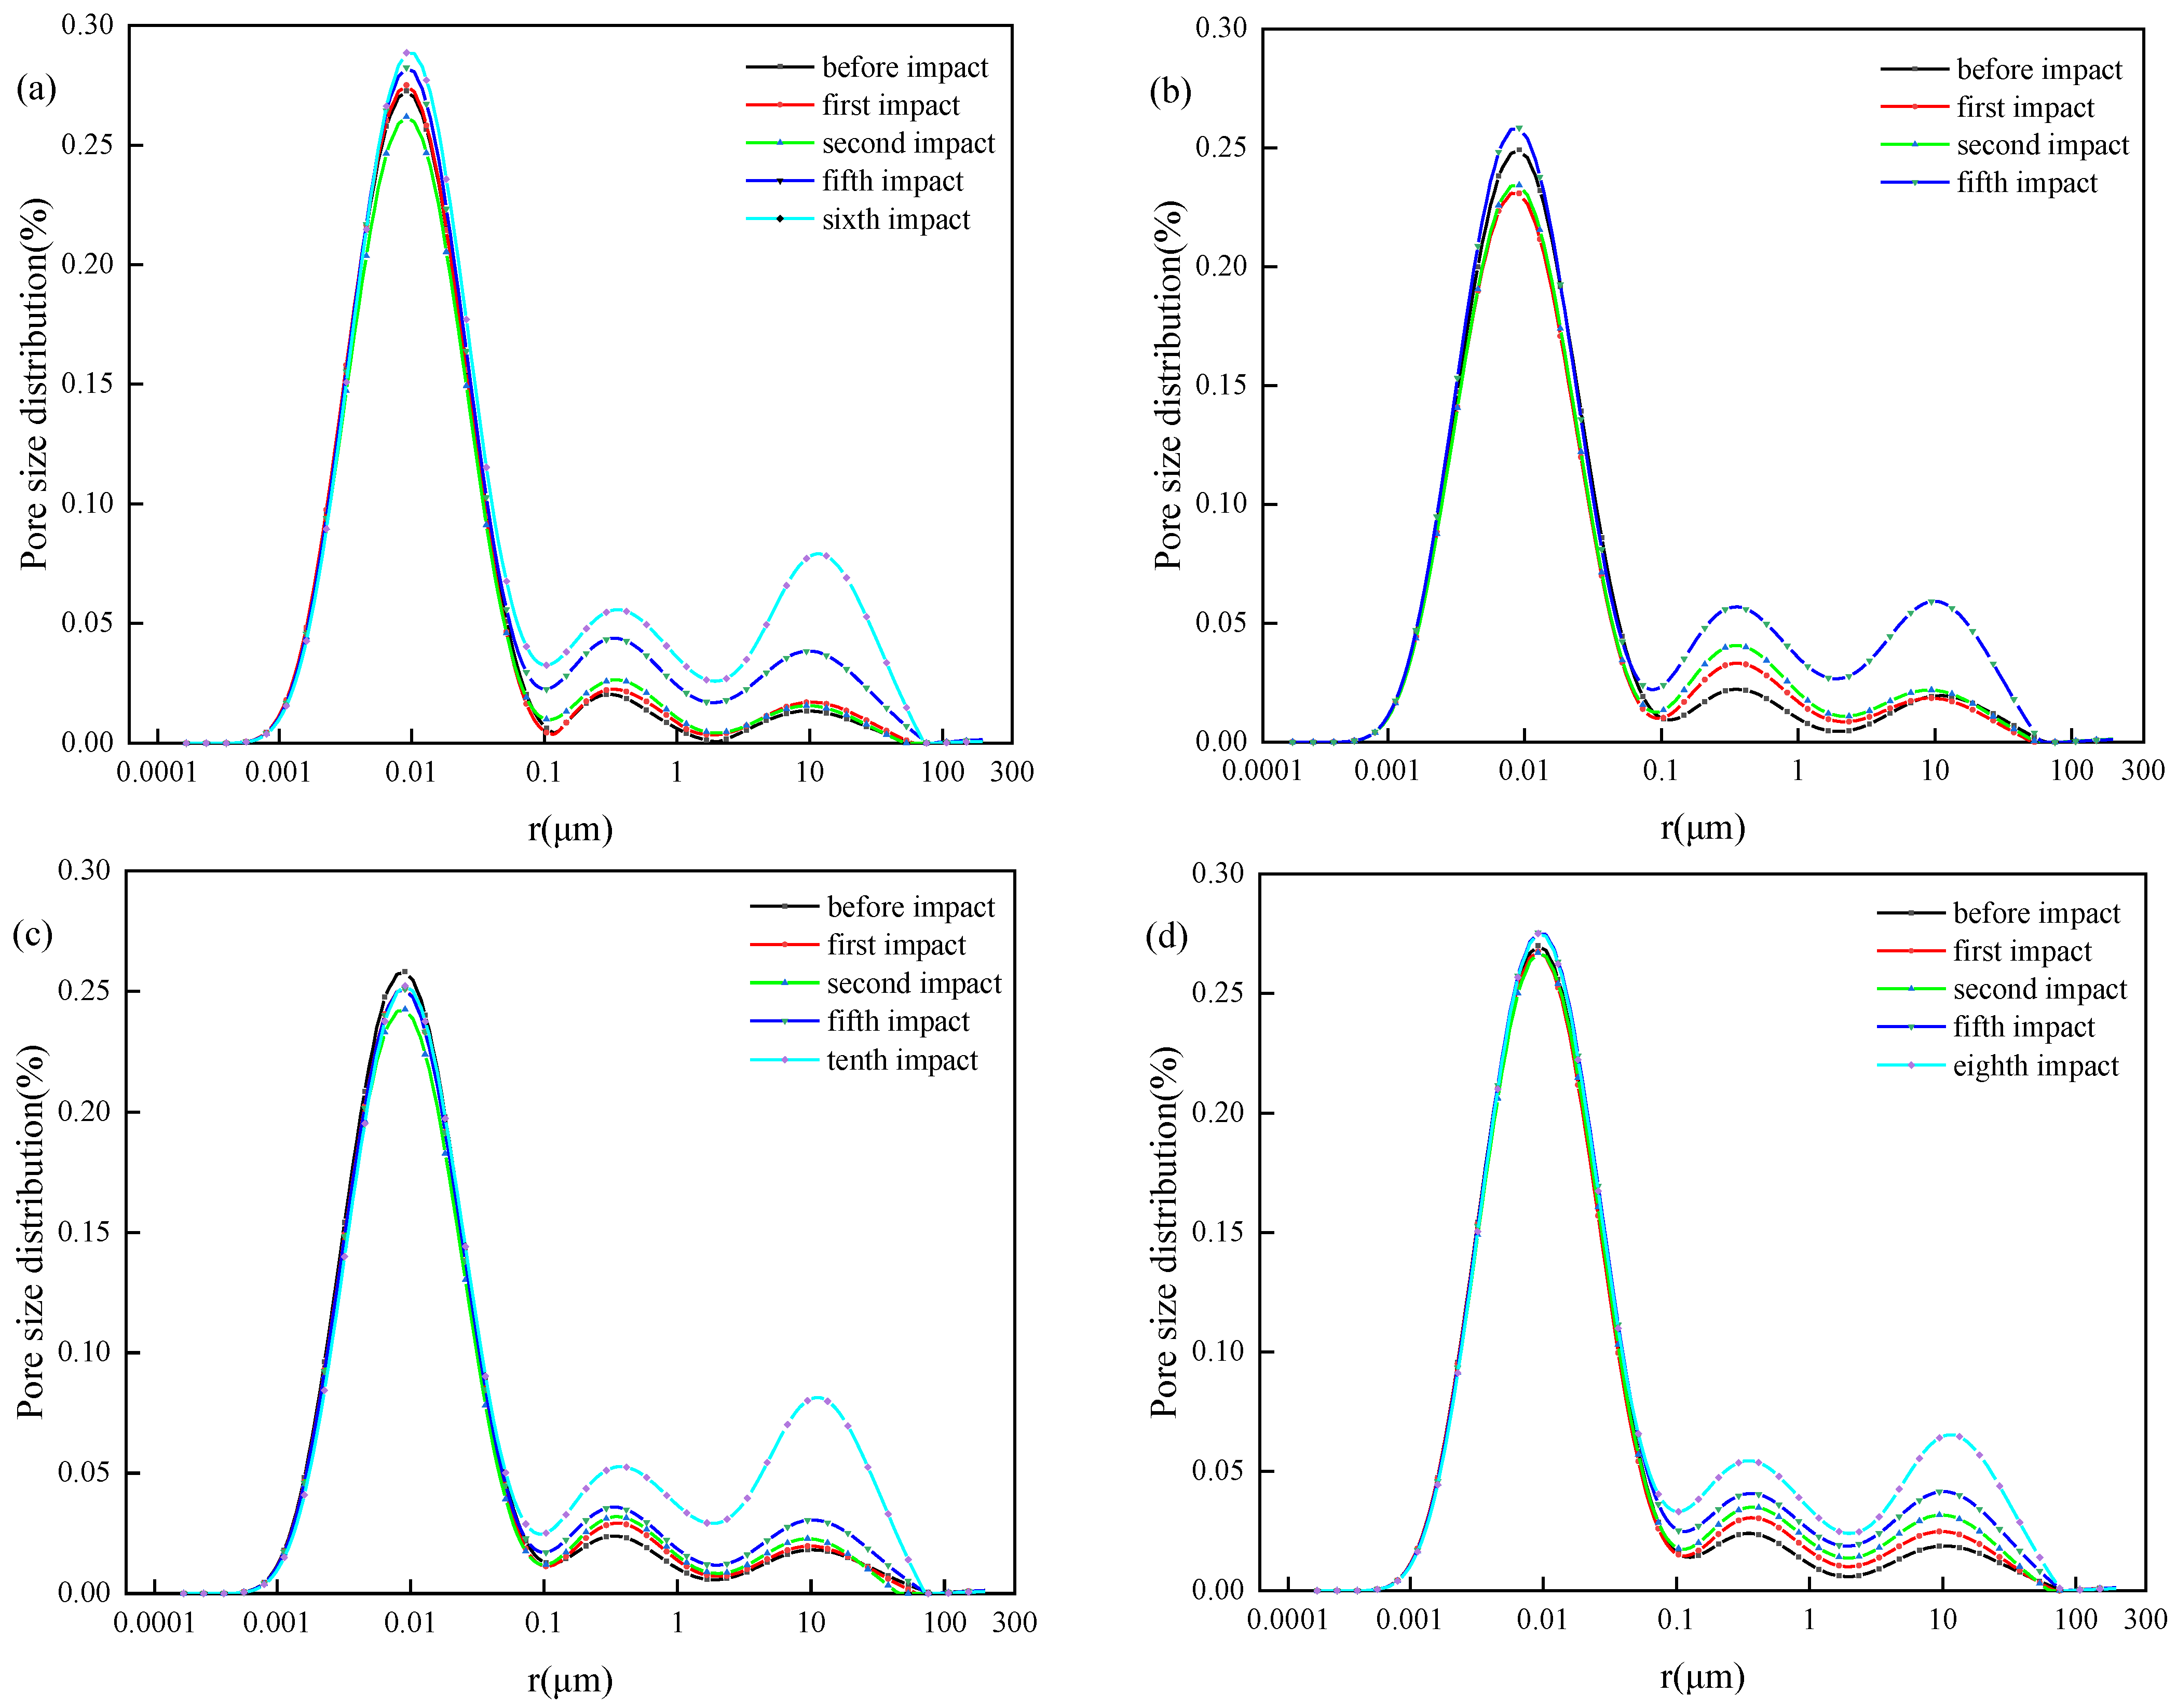
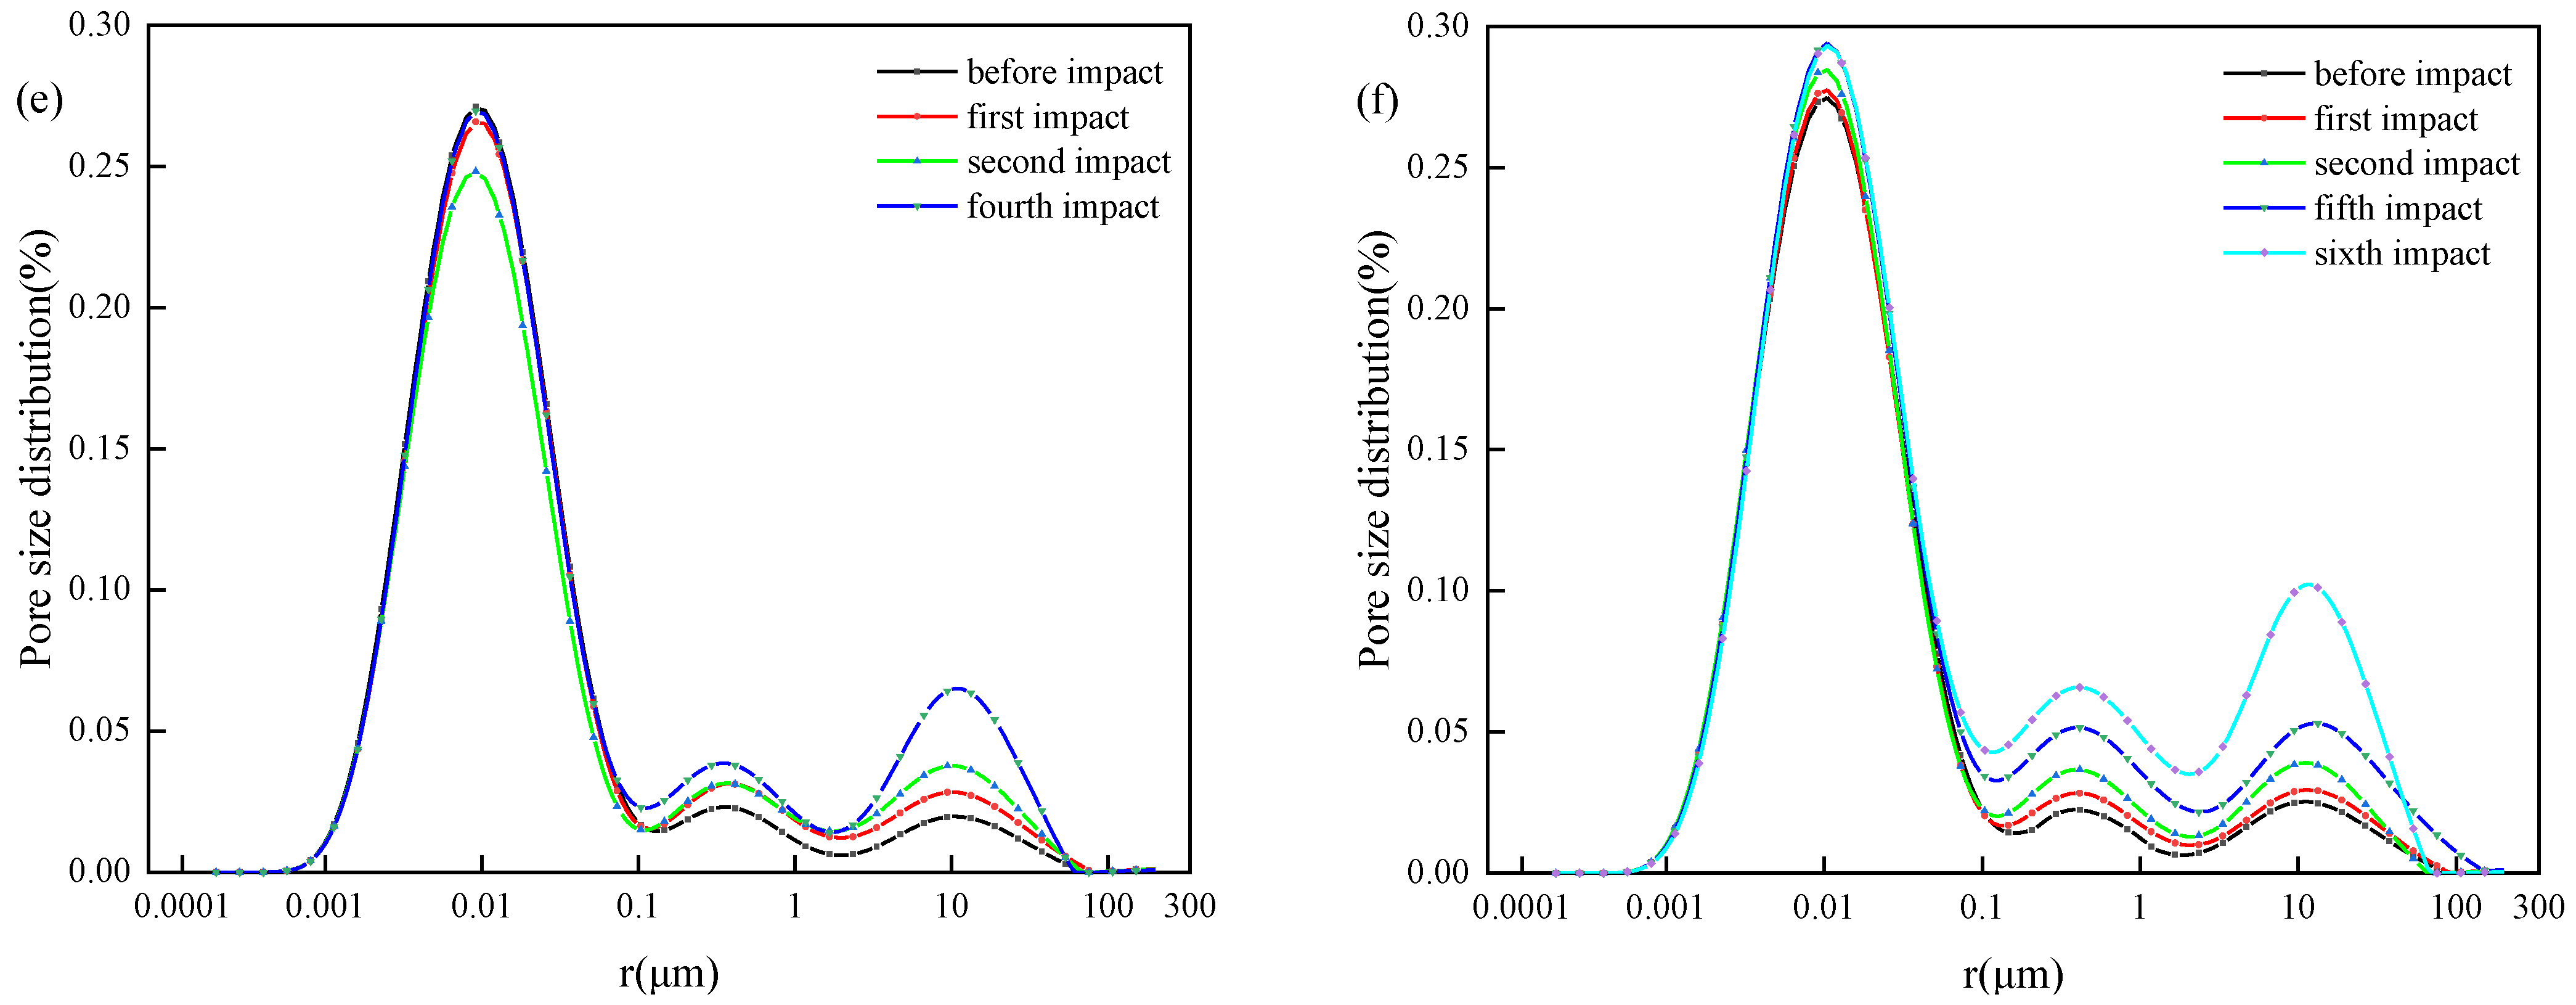
5.1. Analysis of Pore Size Distribution
5.2. Analysis of Microstructural Damage Imaging
6. Conclusions
Author Contributions
Funding
Institutional Review Board Statement
Informed Consent Statement
Data Availability Statement
Acknowledgments
Conflicts of Interest
References
- Yang, Y.; Yang, R.S.; Wang, J.G. Simulation material experiment on dynamic mechanical properties of jointed rock affected by joint thickness. J. China Univ. Min. Technol. 2016, 45, 211–216+309. [Google Scholar]
- Liu, B.; Sun, Y.D.; Yuan, Y.F.; Liu, X.C.; Bai, X.T.; Fang, T.J. Strength characteristics of frozen sandstone with different water content and its strengthening mechanism. J. China Univ. Min. Technol. 2020, 49, 1085–1093+1127. [Google Scholar]
- Gong, F.Q.; Si, X.F.; Li, X.B.; Wang, S.H. Dynamic triaxial compression tests on sandstone at high strain rates and low confining pressures with split Hopkinson pressure bar. Int. J. Rock Mech. Min. Sci. 2019, 113, 211–219. [Google Scholar] [CrossRef]
- Shan, R.L.; Yang, H.; Guo, Z.M.; Liu, X.D.; Song, L.W. Experimental study of strength characters of saturated red sandstone on negative temperature under triaxial compression. Chin. J. Rock Mech. Eng. 2014, 33, 3657–3664. [Google Scholar]
- Chen, X.; Liao, Z.H.; Li, D.J. Experimental study of effects of joint inclination angle and connectivity rate on strength and deformation properties of rock masses under uniaxial compression. Chin. J. Rock Mech. Eng. 2011, 30, 781–789. [Google Scholar]
- Zhao, A.P.; Feng, C.; Guo, R.K.; Li, S.H.; Jia, J.J. Effect of joints on blasting and stress wave propagation. Chin. J. Rock Mech. Eng. 2018, 37, 2027–2036. [Google Scholar]
- Zou, C.J.; Wong, L.N.Y.; Loo, J.L.; Gan, B.S. Different mechanical and cracking behaviors of single-flawed brittle gypsum specimens under dynamic and quasi-static loadings. Eng. Geol. 2016, 201, 71–84. [Google Scholar] [CrossRef]
- Li, D.Y.; Liu, M.; Han, Z.Y.; Zhou, Z.L. Dynamic compressive mechanical properties of bedding sandstone with preexisting hole. J. China Coal Soc. 2019, 44, 1349–1358. [Google Scholar]
- Li, J.C.; Li, N.N.; Li, H.B.; Zhao, J. An SHPB test study on wave propagation across rock masses with different contact area ratios of joint. Int. J. Impact Eng. 2017, 105, 109–116. [Google Scholar] [CrossRef]
- Li, J.C.; Ma, G.W. Analysis of blast wave interaction with a rock joint. Rock Mech. Rock Eng. 2010, 43, 777–787. [Google Scholar] [CrossRef]
- Li, J.C.; Rong, L.F.; Li, H.B.; Hong, S.N. An SHPB test study on stress wave energy attenuation in jointed rock masses. Rock Mech. Rock Eng. 2019, 52, 403–420. [Google Scholar] [CrossRef]
- Liu, Q.S.; Huang, S.B.; Kang, Y.S.; Chui, X.Z. Advance and review on freezing-thawing damage of fractured rock. Chin. J. Rock Mech. Eng. 2015, 24, 452–471. [Google Scholar]
- Xi, J.M.; Yang, G.S.; Pang, L.; Lv, X.T.; Liu, F.L. Experimental study on basic mechanical behaviors of sandy mudstone under low freezing temperature. J. China Coal Soc. 2014, 39, 1262–1268. [Google Scholar]
- Xu, G.M.; Liu, Q.S.; Peng, W.W.; Chang, X.X. Experimental study on basic mechanical behaviors of rocks under low temperatures. Chin. J. Rock Mech. Eng. 2006, 25, 2502–2508. [Google Scholar]
- Shan, R.L.; Zhang, L.; Yang, H.; Zhang, J.X.; Guo, Z.M. Experimental study of freeze-thaw properties of saturated red sandstone. J. China Univ. Min. Technol. 2016, 45, 923–929. [Google Scholar]
- Yang, Y.; Li, X.L.; Yang, R.S.; Wang, J.G. Study on Fractal Characteristics and Fracture Mechanism of Frozen Rocks. J. Trans. Beijing Inst. Technol. 2020, 40, 632–639+682. [Google Scholar]
- Lv, N.; Wang, H.B.; Zong, Q.; Wang, M.X.; Cheng, B. Dynamic Tensile Properties and Energy Dissipation of High-Strength Concrete after Exposure to Elevated Temperatures. Materials 2020, 13, 5313. [Google Scholar] [CrossRef]
- Li, Y.; Zhai, Y.; Liu, X.Y.; Liang, W.B. Research on Fractal Characteristics and Energy Dissipation of Concrete Suffered Freeze-Thaw Cycle Action and Impact Loading. Materials 2019, 12, 2585. [Google Scholar] [CrossRef] [Green Version]
- Huang, Z.Y.; Sui, L.L.; Wang, F.; Du, S.L.; Zhou, Y.W.; Ye, J.Q. Dynamic compressive behavior of a novel ultra-lightweight cement composite incorporated with rubber powder. Compos. Struct. 2020, 244, 112300. [Google Scholar] [CrossRef]
- Ping, Q.; Wu, M.J.; Yuan, P.; Zhang, H. Experimental study on dynamic mechanical properties of high temperature sandstone under impact loads. Chin. J. Rock Mech. Eng. 2019, 38, 782–792. [Google Scholar]
- Zuo, J.P.; Xie, H.P.; Zhou, H.W.; Fang, Y.; Fan, X. Fractography of sandstone failure under temperature-tensile stress coupling effects. Chin. J. Rock Mech. Eng. 2007, 26, 2444–2457. [Google Scholar]
- Liu, M.X.; Liu, E.L. Dynamic mechanical properties of artificial jointed rock samples subjected to cyclic triaxial loading. Int. J. Rock Mech. Min. Sci. 2017, 98, 54–66. [Google Scholar] [CrossRef]
- Abrams, D.A. Effect of rate of application of load on the compressive strength of concrete. Am. Soc. Test Mater. J. 1917, 17, 364–377. [Google Scholar]
- Li, W.G.; Luo, Z.Y.; Wu, C.Q.; Duan, W.H. Impact performances of steel tube-confined recycled aggregate concrete (STCRAC) after exposure to elevated temperatures. Cem. Concr. Compos. 2018, 86, 87–97. [Google Scholar] [CrossRef]
- Chen, L.J.; Zhang, X.X.; Liu, G.M. Analysis of dynamic mechanical properties of sprayed fiber-reinforced concrete based on the energy conversion principle. Constr. Build. Mater. 2020, 254, 119167. [Google Scholar] [CrossRef]
- Cai, H.D.; Yuan, B.; Yang, F.; Chen, L.; Feng, W.H.; Liang, Y.W. Dynamic three-point flexural performance of unsaturated polyester polymer concrete at different curing ages. J. Build. Eng. 2022, 45, 103449. [Google Scholar] [CrossRef]
- Wang, L.; Su, H.M.; Qin, Y.; Chen, S.G. Study on Dynamic Constitutive Model of Weakly Consolidated Soft Rock in Western China. Shock. Vib. 2020, S2, 1–13. [Google Scholar] [CrossRef]
- Chang, S.; Xu, J.Y.; Bai, E.L.; Zhen, G.H.; Lv, X.C. Static and dynamic mechanical properties and deterioration of bedding sandstone subjected to freeze-thaw cycles: Considering bedding structure effect. Sci. Rep. 2020, 10, 12790. [Google Scholar] [CrossRef]
- Lv, T.H.; Chen, X.W.; Chen, G. The 3D meso-scale model and numerical tests of split Hopkinson pressure bar of concrete specimen. Constr. Build. Mater. 2018, 160, 744–764. [Google Scholar] [CrossRef]
- Zhang, F.L.; Zhu, Z.W.; Fu, T.T.; Jia, J.X. Damage mechanism and dynamic constitutive model of frozen soil under uniaxial impact loading. Mech. Mater. 2020, 140, 103217.1–103217.12. [Google Scholar] [CrossRef]
- Li, Y.; Zhai, Y.; Liang, W.B.; Li, Y.B.; Dong, Q.; Meng, F.D. Dynamic Mechanical Properties and Visco-Elastic Damage Constitutive Model of Freeze-Thawed Concrete. Materials 2020, 13, 4056. [Google Scholar] [CrossRef] [PubMed]
- Pan, B.; Wang, X.G.; Xu, Z.Y.; Guo, L.J.; Li, X.S. Research on the effect of joint angle on the dynamic response of rock materials. Chin. J. Rock Mech. Eng. 2021, 40, 566–575. [Google Scholar]
- Pan, B.; Wang, X.G.; Xu, Z.Y.; Guo, L.J.; Wang, X.S. Experimental and Numerical Study of Fracture Behavior of Rock-Like Material Specimens with Single Pre-Set Joint under Dynamic Loading. Materials 2021, 14, 2690. [Google Scholar] [CrossRef] [PubMed]
- Zhao, G.Y.; Li, Z.Y.; Wu, H.; Wang, E.J.; Liu, L.L. Dynamic failure characteristics of sandstone with non-penetrating cracks. Rock Soil Mech. 2019, 40, 73–81. [Google Scholar]
- Li, X. Rock Dynamics: Fundamentals and Applications; Science Press: Beijing, China, 2014; pp. 258–287. [Google Scholar]
- Li, X.S. Study on the Effect of Joint Characteristics on Impact Crushing Effect of Rock; University of Science and Technology Liaoning: Anshan, China, 2020. (In Chinese) [Google Scholar]
- Wang, M.; Wang, H.; Zong, Q. Experimental study on energy dissipation of mudstone in coal mine under impact loading. J. China Coal Soc. 2019, 44, 1716–1725. [Google Scholar]
- Li, J.L.; Zhu, L.Y.; Zhou, K.P.; Liu, H.W.; Cao, S.P. Damage characteristics of sandstone pore structure under freeze-thaw cycles. Rock Soil Mech. 2019, 40, 3524–3532. [Google Scholar]


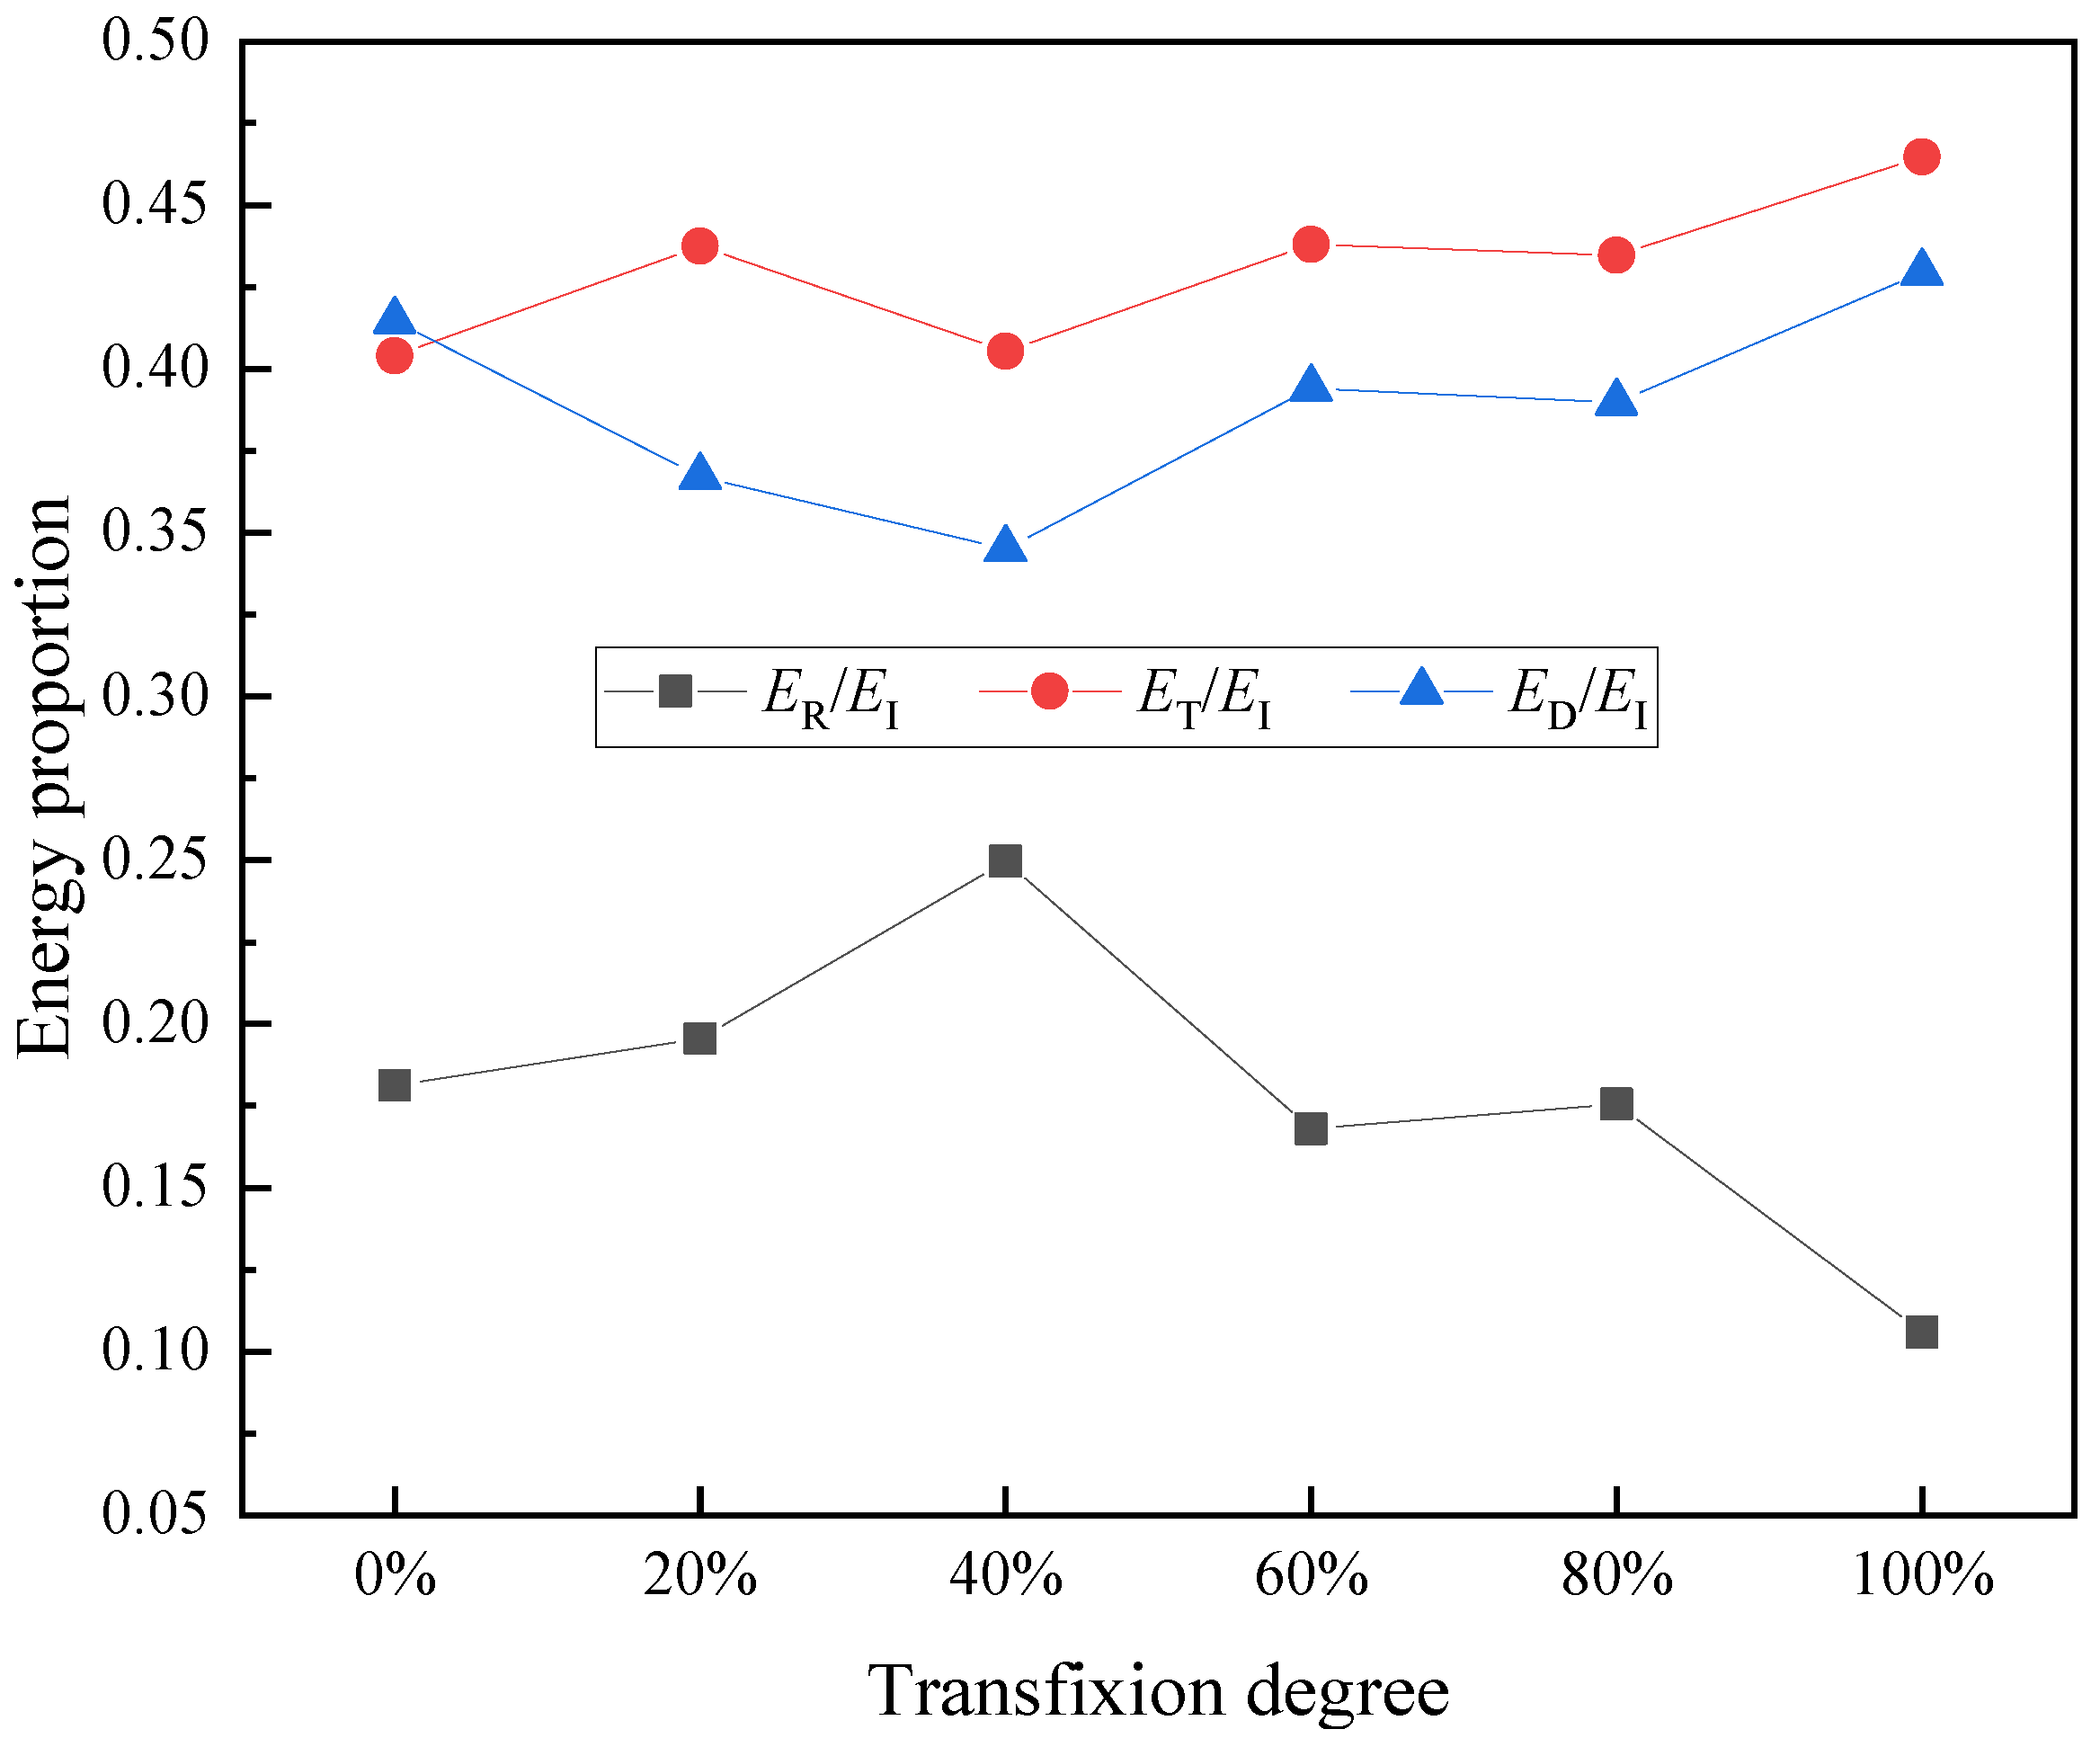
| Group | EI | ER | ET | ED | ER/EI | ET/EI | ED/EI | |||
|---|---|---|---|---|---|---|---|---|---|---|
| Measured | Average | Measured | Average | Measured | Average | |||||
| 0% | 124.34 | 28.97 | 60.79 | 34.58 | 0.2330 | 0.1813 | 0.4889 | 0.4040 | 0.2781 | 0.4147 |
| 123.07 | 31.61 | 51.90 | 39.56 | 0.2569 | 0.4217 | 0.3214 | ||||
| 102.71 | 21.54 | 39.60 | 41.57 | 0.2097 | 0.3856 | 0.4047 | ||||
| 75.04 | 16.16 | 25.75 | 33.12 | 0.2154 | 0.3432 | 0.4414 | ||||
| 103.43 | 12.27 | 33.48 | 57.68 | 0.1186 | 0.3237 | 0.5577 | ||||
| 111.61 | 6.07 | 51.45 | 54.09 | 0.0544 | 0.4610 | 0.4846 | ||||
| 20% | 82.78 | 13.14 | 35.16 | 34.47 | 0.1588 | 0.1955 | 0.4248 | 0.4375 | 0.4165 | 0.3670 |
| 96.92 | 28.38 | 39.81 | 28.73 | 0.2928 | 0.4107 | 0.2964 | ||||
| 166.44 | 34.78 | 74.61 | 57.04 | 0.2090 | 0.4483 | 0.3427 | ||||
| 139.52 | 35.42 | 55.58 | 48.51 | 0.2539 | 0.3984 | 0.3477 | ||||
| 89.01 | 5.62 | 44.96 | 38.43 | 0.0632 | 0.5051 | 0.4317 | ||||
| 40% | 83.58 | 23.42 | 35.66 | 24.49 | 0.2803 | 0.2496 | 0.4267 | 0.4054 | 0.2931 | 0.3450 |
| 101.92 | 10.60 | 39.85 | 51.47 | 0.1040 | 0.3910 | 0.5050 | ||||
| 85.76 | 25.26 | 36.55 | 23.94 | 0.2946 | 0.4262 | 0.2792 | ||||
| 86.25 | 24.57 | 39.34 | 22.34 | 0.2849 | 0.4561 | 0.2590 | ||||
| 106.37 | 32.99 | 43.00 | 30.38 | 0.3101 | 0.4042 | 0.2856 | ||||
| 101.21 | 33.51 | 42.79 | 24.91 | 0.3311 | 0.4227 | 0.2462 | ||||
| 99.59 | 29.30 | 31.52 | 38.77 | 0.2942 | 0.3165 | 0.3893 | ||||
| 125.70 | 35.76 | 45.19 | 44.75 | 0.2845 | 0.3595 | 0.3560 | ||||
| 111.13 | 29.80 | 38.36 | 42.96 | 0.2682 | 0.3452 | 0.3866 | ||||
| 90.80 | 4.00 | 45.89 | 40.92 | 0.0441 | 0.5054 | 0.4506 | ||||
| 60% | 105.79 | 16.41 | 58.80 | 30.58 | 0.1551 | 0.1681 | 0.5558 | 0.4380 | 0.2891 | 0.3940 |
| 139.19 | 25.86 | 62.12 | 51.20 | 0.1858 | 0.4463 | 0.3679 | ||||
| 166.52 | 29.85 | 75.14 | 61.53 | 0.1792 | 0.4512 | 0.3695 | ||||
| 84.35 | 19.07 | 36.01 | 29.27 | 0.2261 | 0.4269 | 0.3470 | ||||
| 81.87 | 16.66 | 40.74 | 24.48 | 0.2035 | 0.4976 | 0.2990 | ||||
| 114.69 | 17.39 | 39.12 | 58.17 | 0.1517 | 0.3411 | 0.5072 | ||||
| 103.20 | 18.67 | 32.59 | 51.94 | 0.1809 | 0.3158 | 0.5032 | ||||
| 86.16 | 5.34 | 40.40 | 40.42 | 0.0620 | 0.4689 | 0.4691 | ||||
| 80% | 94.05 | 16.51 | 47.09 | 30.46 | 0.1755 | 0.1756 | 0.5007 | 0.4347 | 0.3238 | 0.3897 |
| 111.07 | 16.23 | 45.33 | 49.50 | 0.1461 | 0.4081 | 0.4457 | ||||
| 68.18 | 14.08 | 25.65 | 28.45 | 0.2066 | 0.3762 | 0.4173 | ||||
| 50.86 | 8.85 | 23.09 | 18.92 | 0.1740 | 0.4540 | 0.3720 | ||||
| 100% | 120.44 | 12.44 | 67.16 | 40.84 | 0.1033 | 0.1059 | 0.5576 | 0.4647 | 0.3391 | 0.4294 |
| 87.00 | 17.84 | 42.78 | 26.38 | 0.2051 | 0.4917 | 0.3032 | ||||
| 103.84 | 13.62 | 38.72 | 51.50 | 0.1312 | 0.3729 | 0.4960 | ||||
| 113.06 | 11.28 | 41.74 | 60.04 | 0.0998 | 0.3692 | 0.5310 | ||||
| 111.09 | 7.42 | 49.47 | 54.20 | 0.0668 | 0.4453 | 0.4879 | ||||
| 107.14 | 3.14 | 59.07 | 44.93 | 0.0293 | 0.5513 | 0.4194 | ||||
| Group | VS (cm3) | TR (ms) | EVT (J·cm−3·ms−1) | (J·cm−3·ms−1) | K (%) | K′ (%) | |
|---|---|---|---|---|---|---|---|
| 0% | 164.39 | 0.297 | 0.6993 | 0.9060 | 10.3473 | 10.4021 | 0.0548 |
| 0.272 | 0.8736 | 10.0370 | 0.3651 | ||||
| 0.275 | 0.9079 | 12.3047 | 2.2677 | ||||
| 0.291 | 0.6836 | ||||||
| 0.296 | 1.1704 | ||||||
| 0.315 | 1.0314 | 14.3392 | 2.0345 | ||||
| 20% | 167.48 | 0.295 | 0.6977 | 0.8908 | 9.7431 | 9.3151 | 0.4280 |
| 0.259 | 0.6623 | 9.7563 | 0.4412 | ||||
| 0.278 | 1.2251 | 12.4683 | 2.7120 | ||||
| 0.254 | 1.1403 | ||||||
| 0.315 | 0.7284 | ||||||
| 40% | 166.31 | 0.292 | 0.5043 | 0.7135 | 10.1757 | 10.0203 | 0.1554 |
| 0.268 | 1.1548 | 9.8134 | 0.2069 | ||||
| 0.284 | 0.5069 | 10.6896 | 0.8762 | ||||
| 0.266 | 0.5050 | ||||||
| 0.257 | 0.7108 | ||||||
| 0.281 | 0.5330 | 13.0003 | 2.3107 | ||||
| 0.286 | 0.8151 | ||||||
| 0.288 | 0.9343 | ||||||
| 0.363 | 0.7116 | ||||||
| 0.324 | 0.7594 | ||||||
| 60% | 168.54 | 0.290 | 0.6257 | 0.8640 | 9.6816 | 10.9854 | 1.3038 |
| 0.265 | 1.1464 | 11.3618 | 0.3764 | ||||
| 0.275 | 1.3276 | 12.4131 | 1.0513 | ||||
| 0.291 | 0.5968 | ||||||
| 0.299 | 0.4858 | ||||||
| 0.318 | 1.0853 | 13.5635 | 1.1504 | ||||
| 0.313 | 0.9846 | ||||||
| 0.365 | 0.6571 | ||||||
| 80% | 165.58 | 0.275 | 0.6689 | 0.6779 | 10.8043 | 10.7645 | 0.0398 |
| 0.291 | 1.0273 | 11.1550 | 0.3905 | ||||
| 0.285 | 0.6029 | 12.4871 | 1.3321 | ||||
| 0.277 | 0.4125 | ||||||
| 100% | 167.83 | 0.308 | 0.7901 | 0.9268 | 11.3533 | 11.6843 | 0.3310 |
| 0.283 | 0.5554 | 12.3710 | 0.6867 | ||||
| 0.282 | 1.0881 | 14.1013 | 1.7303 | ||||
| 0.291 | 1.2294 | ||||||
| 0.292 | 1.1060 | ||||||
| 0.338 | 0.7920 | 15.8965 | 1.7952 |
| Group | Pore Type | Peak Aperture /μm (Percentage/%) | ||||
|---|---|---|---|---|---|---|
| 0% | Small pore | 0.00911 (0.2726) | 0.00911 (0.275) | 0.00911 (0.2618) | 0.00911 (0.2824) | 0.00911 (0.2886) |
| medium pore | 0.31406 (0.0204) | 0.33664 (0.0225) | 0.33664 (0.0265) | 0.33664 (0.0439) | 0.36084 (0.0558) | |
| Large pore | 9.42751 (0.0135) | 10.10526 (0.0172) | 10.10526 (0.0156) | 10.10526 (0.0385) | 10.10526 (0.0783) | |
| 20% | Small pore | 0.00911 (0.2491) | 0.00792 (0.2309) | 0.00911 (0.2343) | 0.00911 (0.2584) | - |
| medium pore | 0.36084 (0.0222) | 0.36084 (0.0332) | 0.36084 (0.0407) | 0.36084 (0.0569) | - | |
| Large pore | 11.61045 (0.0195) | 9.42751 (0.0185) | 9.42751 (0.0219) | 10.10526 (0.0592) | - | |
| 40% | Small pore | 0.00911 (0.2582) | 0.00911 (0.2511) | 0.00911 (0.2424) | 0.00911 (0.2510) | 0.00911 (0.2523) |
| medium pore | 0.33664 (0.0239) | 0.33664 (0.0292) | 0.33664 (0.0319) | 0.33664 (0.0359) | 0.33664 (0.0525) | |
| Large pore | 10.10526 (0.0182) | 10.10526 (0.0197) | 9.42751 (0.0228) | 10.10526 (0.0306) | 11.61045 (0.0592) | |
| 60% | Small pore | 0.00911 (0.2699) | 0.00911 (0.2675) | 0.00911 (0.2669) | 0.00911 (0.2755) | 0.00911 (0.275) |
| medium pore | 0.36084 (0.024) | 0.36084 (0.0306) | 0.36084 (0.035) | 0.36084 (0.0407) | 0.36084 (0.0544) | |
| Large pore | 10.10526 (0.0188) | 10.10526 (0.0248) | 10.10526 (0.0317) | 10.10526 (0.0415) | 10.10526 (0.0648) | |
| 80% | Small pore | 0.00911 (0.2711) | 0.00911 (0.2659) | 0.00911 (0.2483) | 0.00911 (0.2698) | - |
| medium pore | 0.36084 (0.0231) | 0.36084 (0.0313) | 0.36084 (0.0315) | 0.36084 (0.0386) | - | |
| Large pore | 10.83174 (0.0197) | 10.83174 (0.0283) | 10.10526 (0.0376) | 10.83174 (0.0651) | - | |
| 100% | Small pore | 0.01046 (0.2748) | 0.01046 (0.2775) | 0.01046 (0.2847) | 0.01046 (0.2941) | 0.01046 (0.2933) |
| medium pore | 0.38678 (0.0225) | 0.38678 (0.0284) | 0.38678 (0.0367) | 0.38678 (0.0516) | 0.41458 (0.0659) | |
| Large pore | 11.61045 (0.0253) | 11.61045 (0.0295) | 11.61045 (0.0391) | 12.44514 (0.0531) | 11.61045 (0.1023) | |
Publisher’s Note: MDPI stays neutral with regard to jurisdictional claims in published maps and institutional affiliations. |
© 2022 by the authors. Licensee MDPI, Basel, Switzerland. This article is an open access article distributed under the terms and conditions of the Creative Commons Attribution (CC BY) license (https://creativecommons.org/licenses/by/4.0/).
Share and Cite
Xu, Z.; Bao, S.; Guo, L.; Mo, H.; Wang, D.; Zhao, J. Experiment Investigation on Dynamic Failure Characteristics of Water-Saturated Frozen Cement Mortar with Transfixion Joint under Confining Pressure. Appl. Sci. 2022, 12, 4396. https://doi.org/10.3390/app12094396
Xu Z, Bao S, Guo L, Mo H, Wang D, Zhao J. Experiment Investigation on Dynamic Failure Characteristics of Water-Saturated Frozen Cement Mortar with Transfixion Joint under Confining Pressure. Applied Sciences. 2022; 12(9):4396. https://doi.org/10.3390/app12094396
Chicago/Turabian StyleXu, Zhenyang, Song Bao, Lianjun Guo, Hongyi Mo, Dakun Wang, and Jianyu Zhao. 2022. "Experiment Investigation on Dynamic Failure Characteristics of Water-Saturated Frozen Cement Mortar with Transfixion Joint under Confining Pressure" Applied Sciences 12, no. 9: 4396. https://doi.org/10.3390/app12094396
APA StyleXu, Z., Bao, S., Guo, L., Mo, H., Wang, D., & Zhao, J. (2022). Experiment Investigation on Dynamic Failure Characteristics of Water-Saturated Frozen Cement Mortar with Transfixion Joint under Confining Pressure. Applied Sciences, 12(9), 4396. https://doi.org/10.3390/app12094396