Article

Experiment Investigation on Dynamic Failure Characteristics of Water-Saturated Frozen Cement Mortar with Transfixion Joint under Confining Pressure

1
School of Mining Engineering, University of Science and Technology Liaoning, Anshan 114051, China
2
School of Architecture and Civil Engineering, Shenyang University of Technology, Shenyang 110870, China
*
Author to whom correspondence should be addressed.
Appl. Sci. 2022, 12(9), 4396; https://doi.org/10.3390/app12094396
Submission received: 26 March 2022 / Revised: 24 April 2022 / Accepted: 25 April 2022 / Published: 27 April 2022

Abstract

:
In order to explore the mechanical characteristics and failure characteristics of water-saturated frozen cement mortar with different transfixion degree joints under impact load, a cyclic freezing impact test was performed on six kinds of water-saturated frozen cement mortar specimens with different transfixion degrees (0%, 20%, 40%, 60%, 80%, 100%) by split Hopkinson pressure bar (SHPB), and the microscopic damage of specimens was tested by an MRI analyzer. The results show that the dynamic compressive strength of the water-saturated frozen cement mortar increases first and then decreases with the increase of the number of cycles, with the increase of joint transfixion degree the peak stress showing a clear linear downward trend. An 80% transfixion degree joint specimen has the weakest ability to carry impact loads, and the 40% transfixion degree joint specimen has the strongest ability to carry impact loads. With the increase of joint transfixion degree, there was a similar trend of first decreasing and then rising in the average change of porosity and the change of energy density per unit time index. The joint transfixion degree controls the crack development trend and the final destruction mode of the specimen. With the increase of joint transfixion degree, the failure sequence gradually evolved from pull-shear composite failure to split-tensioned failure.

1. Introduction

The discontinuous surfaces of rock are one of the causes of geological disasters [1]. Rock mass is cut vertically and horizontally by the structural surface to form a multi-fissure body with a certain structure. The deformation and failure mechanisms and mechanical characteristics of rock masses are controlled by structural surfaces [2,3]. The sharp cooling after rain in the alpine areas of the plateau, the saturated dam body in winter, and the bottom of the wading building will cause the rock mass to be frozen by water saturation [4]. There is an inseparable relationship between the different joint characteristics of rock bodies and their compactness and water-saturated freezing. The geometric parameters of the joint mainly include the joint density, joint thickness, length of transfixion joint, joint angle and joint expansion, and so on [5,6,7,8]. Li et al. [9,10,11] systematically discussed the influence of joint mechanical parameters and incident wave parameters on stress wave propagation and energy dissipation ratio in joint rock masses based on both experimental and theoretical analysis. The deformation and failure characteristics of water-saturated frozen joint rock mass are more complex than those of continuous rock mass, and its mechanical properties are significantly affected by the degree of penetration and failure mode and joint geometry parameters [12,13,14,15,16].
The mechanical properties of concrete are not only affected by joints, but also by technical factors such as aggregate composition, high-temperature treatment [17], and the freeze-thaw cycle [18], which will also enhance or decrease mechanical properties [19,20,21]. The confining pressure, axial pressure, and joint strongly influence the dynamic deformation and failure mechanism of jointed rock samples by affecting the generating of the weak zone along the joint plane and the initiation and propagation of micro-cracks [22]. As was firstly demonstrated by Abrams [23], there is a notable rate-hardening effect on the concrete strength, and extensive research has been conducted on the dynamic performances of concrete under dynamic compressive loading. Li et al. researched the dynamic mechanical properties of steel tube-confined recycled aggregate concrete at high temperatures. The results show that the fire-damaged STCRAC can maintain its integrity during impact load. However, there were evident degradations in the dynamic behavior of STCRAC after exposure to high temperatures of 500 °C and 700 °C. The ultimate impact strength, impact secant modulus, and residual impact strength of STCRAC decreased because of the damage due to high-temperature exposure [24]. Chen et al. performed dynamic compression experiments on sprayed plain concrete, polypropylene fiber-reinforced concrete, and plastic steel fiber-reinforced concrete [25]. The strain rate effect and the fiber reinforcement principle were analyzed from an energy conversion perspective. This provides a theoretical basis for further studies on how to improve the dynamic mechanical properties of fiber-reinforced concrete from an energy conversion perspective. In the paper [26], the dynamic flexural performance of unsaturated polyester polymer concrete (UPPC) is investigated. According to the characteristics of the stress-strain curves obtained by the test [27], a constitutive model considering the damaging effect, temperature effect, and strain rate effect was established. It was also found that the constitutive equation was applicable to express the dynamic mechanical properties of rock-like materials such as hard rock, soft rock, frozen soil, raw coal, and concrete. Chang et al. investigated the bedding rock’s static characteristics, impact characteristics, and damage microstructure under freezing and thawing conditions. Experimental results show that under the freeze-thaw (F-T) cycle conditions, the peak point deteriorating path of the static stress-strain curve and the post-peak strain softening curve of the vertical and parallel bedding sandstone specimens have obvious anisotropic characteristics [28]. Lv et al. had revealed the cracking mechanism of concrete specimens in the SHPB test. The accumulation of the tension strain damage in concrete is the main reason to initiate the cracks in the loading process. Under different loading conditions, due to the crushing failure and the tension breaking failure derived from the compression expansion effect play different roles, the specimen deformation and failure processes of different modes will be exhibited [29]. The dynamic mechanical properties of frozen soil at different temperatures and high strain rates were tested by using SHPB [30], and the variation of the wave impedance of the frozen soil was analyzed. Li et al. [31] proposed the dynamic mechanical properties of concrete under a freeze-thaw environment are the combined results of the F-T deterioration effect and the strain rate strengthening effect. The stress damage evolution path of concrete goes backward with the increase of F-T cycles and the development speed gradually slows down. The greater the difference in F-T cycles, the greater the difference in the stress damage path. To sum up, the characteristics of joint rock mass under impact dynamic load are studied on the influence of multi-emphasis joints on the material’s mechanical properties. There are few studies to analyze the microscopic damage of the jointed specimen under the crushing state of the specimen and the impact [32,33,34].
Directed at cement mortar suffering from different transfixion degrees (0%, 20%, 40%, 60%, 80%, 100%) and full water freezing effect, a series of impact compression tests were carried out on a Φ50-mm (i.e., the diameter of the bar is 50 mm) separated Hopkinson pressure bar (SHPB) system with the axial pressure and confining pressure were fixed at 2 MPa in this paper. Before the impact test, the test piece is pretreated with water-saturated freezing by using a low-temperature controllable refrigerator. The stress-strain curve, peak stress, peak strain, energy composition and absorption, destruction characteristics, and other dynamic mechanical properties of cement mortar were analyzed. The obtained imaging of internal microscopic damage and changes in porosity of the specimen employing nuclear magnetic resonance (NMR) imaging technology. The effects of differences in joint transfixion degree on rock dynamic strength and microscopic pore development were analyzed.

2. Materials and Methods

2.1. Cement Mortar Specimen Preparation

The main components of cement mortar and rock are silicates, which have similar mechanical properties and conform to the similarity theory. Moreover, cement mortar has the advantages of fast forming, low cost, and stable mechanical properties, so cement mortar e is selected as the material for making specimens. The raw material selected for this test is P.O 42.5 ordinary Portland cement. The fine sand particle size is not more than 0.6 mm, and the weight ratio of cement, water, and fine sand is 1:0.5:2. After stirring evenly, the mold is injected and the rubber hammer is tapped into the sidewall of the mold to vibrate to discharge the pores. The mold is released after solidification and hardening for 48 h, and the sample is placed in a saturated Ca(OH)2 aqueous solution for 28 d to obtain the cement mortar specimen. During the preparation of the specimen, it is necessary to apply mineral oil evenly on both sides of the copper sheet to prevent the copper sheet from being too tightly bonded with the cement mortar, and the copper sheet with a thickness of 0.2 mm is placed into the mold opening gap to form a prefabricated transfixion joint, and it is gently shaken and removed when the mold is released. Then we increase the specimen length appropriately to 110 mm to eliminate unevenness at the ends of the specimen. After demolding, the specimen is cut to meet the ISRM requirements.
The size of the specimens with different transfixion degrees (0%, 20%, 40%, 60%, 80%, 100%) joints obtained by the preparation of specimens is Φ46 × 100 mm. The pre-fabricated joints transfixion along is in the radial direction with axial extension, and its length corresponds to the above transfixion degree of 0 mm, 20 mm, 40 mm, 60 mm, 80 mm, 100 mm. The joint thickness is 0.2 mm, and the joint angle is 90°. The specimen design and molding sample are shown in Figure 1.
The quasi-static uniaxial compression test of no-joint specimens was completed by SAM-2000 microcomputer controlled electro-hydraulic servo triaxial testing machine. The loading speed was 0.5 kN/s and the loading rate was 0.01 mm/s. The uniaxial compressive strength of cement mortar specimen was 31.65 MPa, the elastic modulus was 24.36 GPa, the Poisson ratio was 0.30, and the density was 2140.11 kg/m3 [33].

2.2. Test System and Test Content

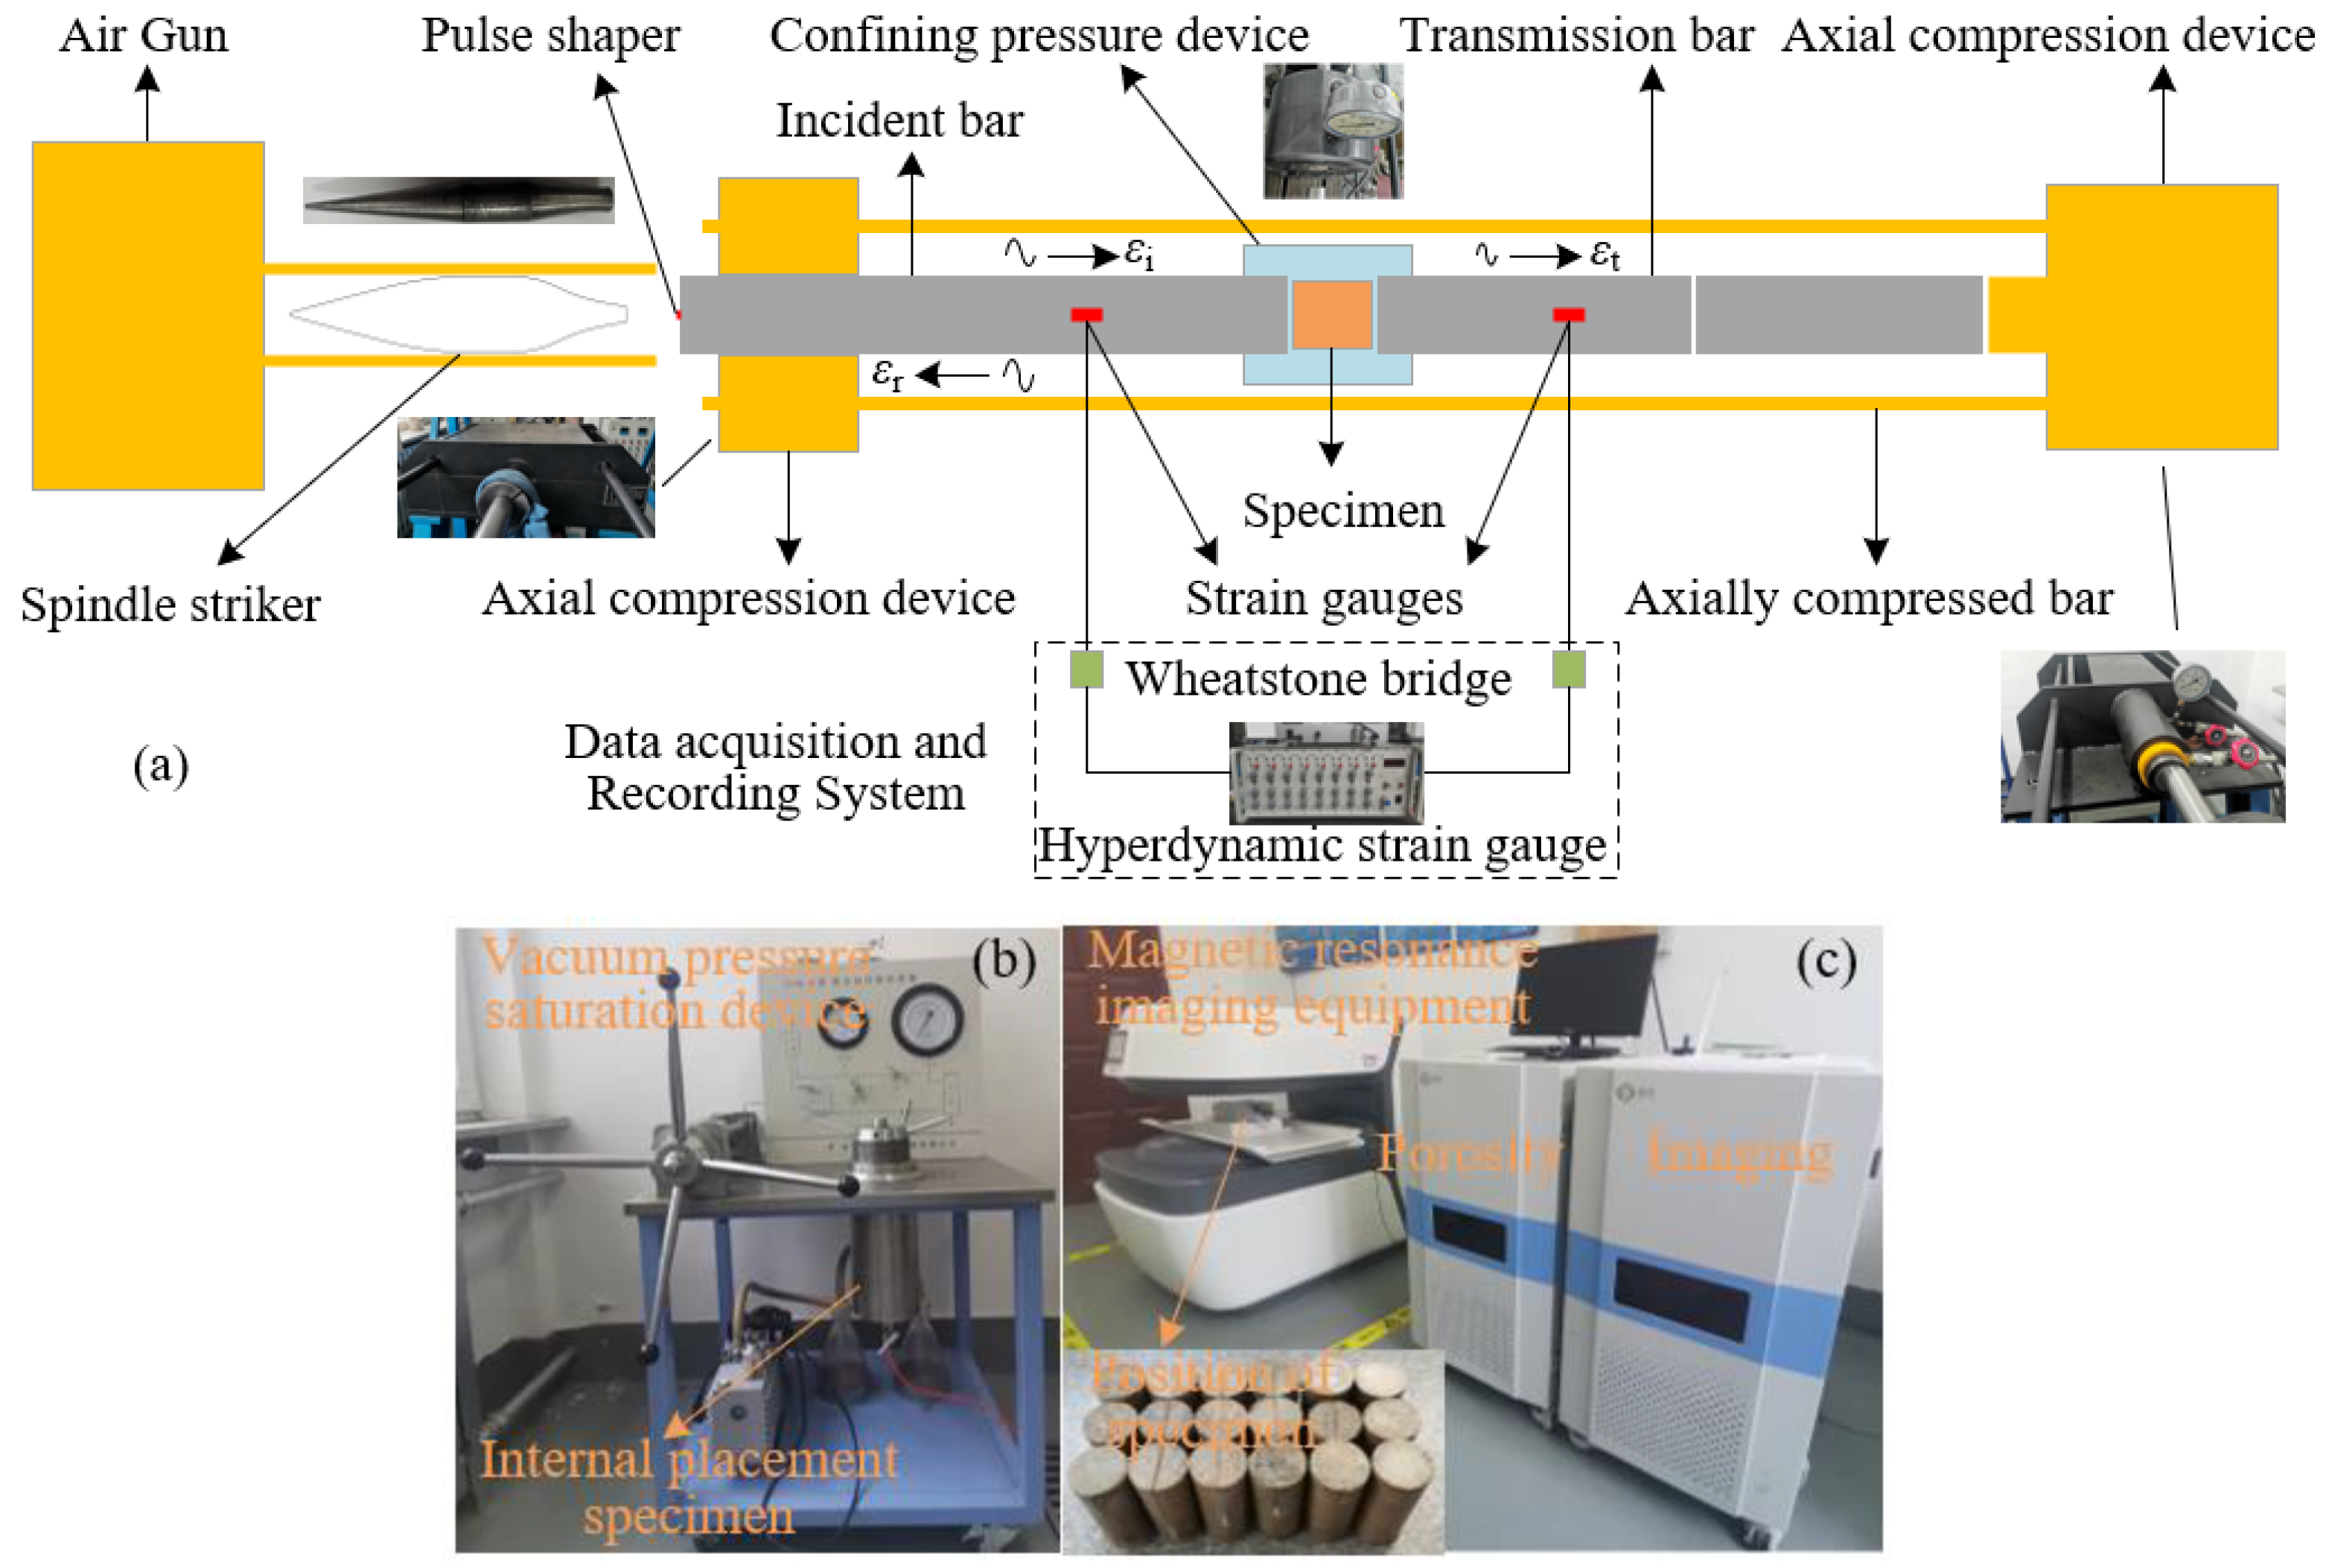
The dynamic uniaxial compression test of frozen red sandstone was carried out by the SHPB test device with axial and confining pressure devices. The main part of the pressure bar is alloy steel with a diameter of 50 mm and a length of 2000 mm. The spindle impact bullet has a length of 300 mm and a maximum rod diameter of 50 mm. The SHPB impact test is established based on one-dimensional stress wave theory and stress uniformity assumption. To realize constant strain rate loading and eliminate the wave dispersion effect, a pulse shaping technique is used, by which copper is posted on the contact surface of the incident bar and bullet, and butter is applied on both sides of the specimen to reduce the friction effect and end effect.
ZYB-Ⅱ vacuum-pressurized saturation device was used to pressurize and saturate the molded specimens, and the initial porosity test and specimen imaging were performed by MacroMR12-150H-I nuclear magnetic resonance imaging analyzer after saturation. After the test, the specimens were naturally saturated with water for 400 days. It was put into a low-temperature test chamber for more than 48 h which was temperature-controlled to −30 °C. After the completion of impact pressure and system commissioning, it was rapidly transferred and sandwiched between the incident bar and transmitted bar to complete the impact test. Finally, porosity tests and imaging were carried out after the first, second, and fifth impact tests and after the specimen was destroyed, and before the test, the specimen was placed in a container filled with normal temperature water for more than 24 h. The impact test was controlled within 30 s to reduce the heat exchange between the specimen and the environment. Before the above dynamic mechanical test (1, 2, 3, 6), the specimen is frozen with water. Experimental devices are shown in Figure 2.

3. Effect of Axial Joint Transfixion Degree on Dynamic Strength

3.1. Stress-Strain Curve

The stress-strain curve was calculated according to reference [35]. The impact test was carried out on six kinds of water-saturated frozen specimens with an axial transfixion degree of 0~100% by using a 0.11 MPa impact air pressure. The collected data were processed to obtain a stress-strain curve for dynamic mechanical property analysis.
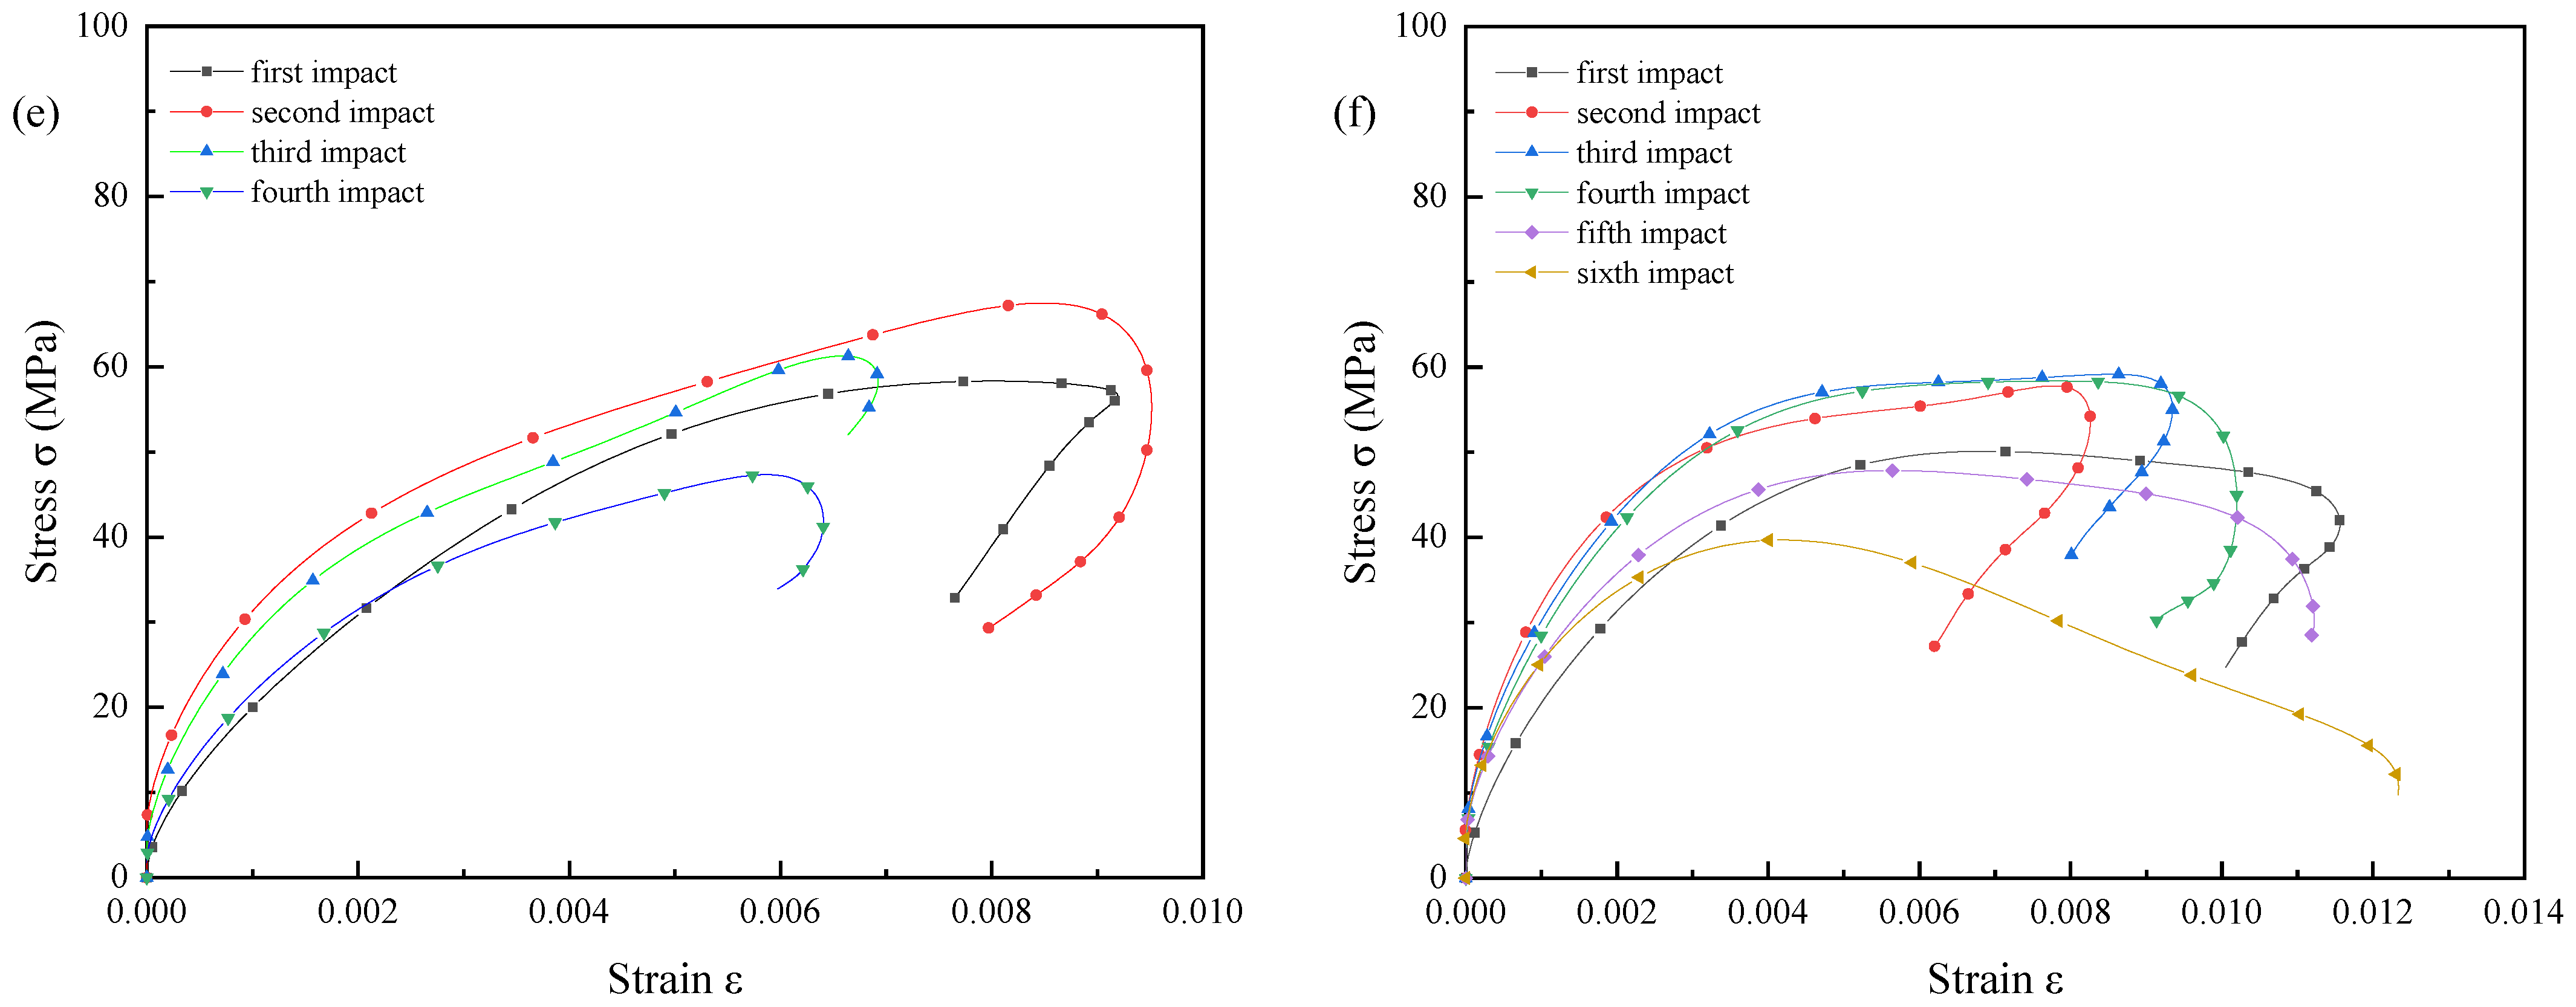
The stress-strain curve is shown in Figure 3. It can be seen that peak stress and ultimate strain have strain rate effects. The transfixion degree is 0%, 20%, and the stress-strain curve of the 40% specimen has no obvious plastic platform segment. The stress-strain curve of the 60%, 80%, and 100% transfixion degree specimen has an obvious plastic platform section. At the beginning of loading, the elastic deformation occurs under the pressure of the specimen, and all curves rise in an approximately straight line at this stage. The curve departs from the straight line to the vertex stage. The release of elastic potential energy stored inside the non-joint and different transfixion joint specimens leads to the germination and expansion of micro-fissures, and eventually plastic deformation of the specimen.
Combined with the test course and the number of dynamic load cycles, it can be seen that 80% of the transfixion joint specimens have less cement mortar materials from the end of the joints to the bottom surface of the specimen due to the long length of the joints, and when the test is carried out the fourth time, the specimen has been significantly damaged and a crack distribution has been formed. For the 20% transfixion joint specimen, the no-joint specimen, and the 100% transfixion joint specimen, due to the integrity of the specimen or the wide area of water-saturated freezing, the stress-strain curve obtained by the test shows a changing trend of first shifting left and then right, increasing first and then decreasing. For the 40% transfixion joint specimen and the 60% transfixion joint specimen, because its joint is approximately one-half of the length of the specimen, in the cycle test process, its crack expansion and water-saturated freezing effect to maintain a balanced development, increasing the strength of the specimen, the number of cycle tests increased. Compared with the previous three impact load tests, it can be seen that the stress peak and the slope of the curve increase as a whole, indicating that the internal fracture of the specimen is developed after the previous impact load, and then the dynamic compressive strength of the specimen increases transfixion of the water-saturated freezing treatment.

3.2. Peak Strength

Figure 4 shows the relationship between the peak stress of the specimen and the number of cycles. As shown in Figure 4, under the action of similar impact loads, the peak strength with the increase of the number of shocks is generally characterized by a trend of first increasing and then decreasing. The average peak strength of the no-joint specimen was 66.62 MPa. The 20% to 100% axial joint transfixion degree specimens’ average peak strength were 74.30 MPa, 69.47 MPa, 64.30 MPa, 58.60 MPa, and 52.17 MPa, respectively, and the average decay rate was 5.53 MPa. The peak intensity ratios of jointed specimens and non-joint specimens were 111.54%, 104.28%, 96.52%, 87.97%, and 78.31%, respectively. It can be seen that the peak stress of joint specimens with the increase of transfixion degree shows a significant linear downward trend, and the reason for the trend relationship is that under the action of external loads, the failure of the joint rock mass will first produce stress concentration at the end of the joint, which will cause the nascent crack to occur and extend along the tip of the primary joint by combining with the internal damage imaging of the specimen. When the transfixion degree is small, due to the small volume of water-saturated freezing of the specimen, the expansion path of the main crack is extended, and the destructive resistance is increased, these factors resulted in the limited weakening of the peak strength of the specimen. As the transfixion degree increases, the destructive resistance becomes smaller and smaller, and the energy required for the expansion of the main crack decreases accordingly, so the peak stress will further decrease rapidly. By the peak strength relationship of the specimens 20% > 40% > 0% > 60% > 80% > 100%, it can be seen that the water-saturated freezing effect increases the strength of the specimen and exceeds one-half of the length of the joint of the specimen weakens the strength of the specimen.
By compared the dynamic characteristics of similar specimens in the literature [36], it can be seen that under the same impact pressure, the cement mortar structure subjected to dynamic load should have better dynamic performance after the water-saturated freeze pre-conditioning process.

3.3. Peak Strain

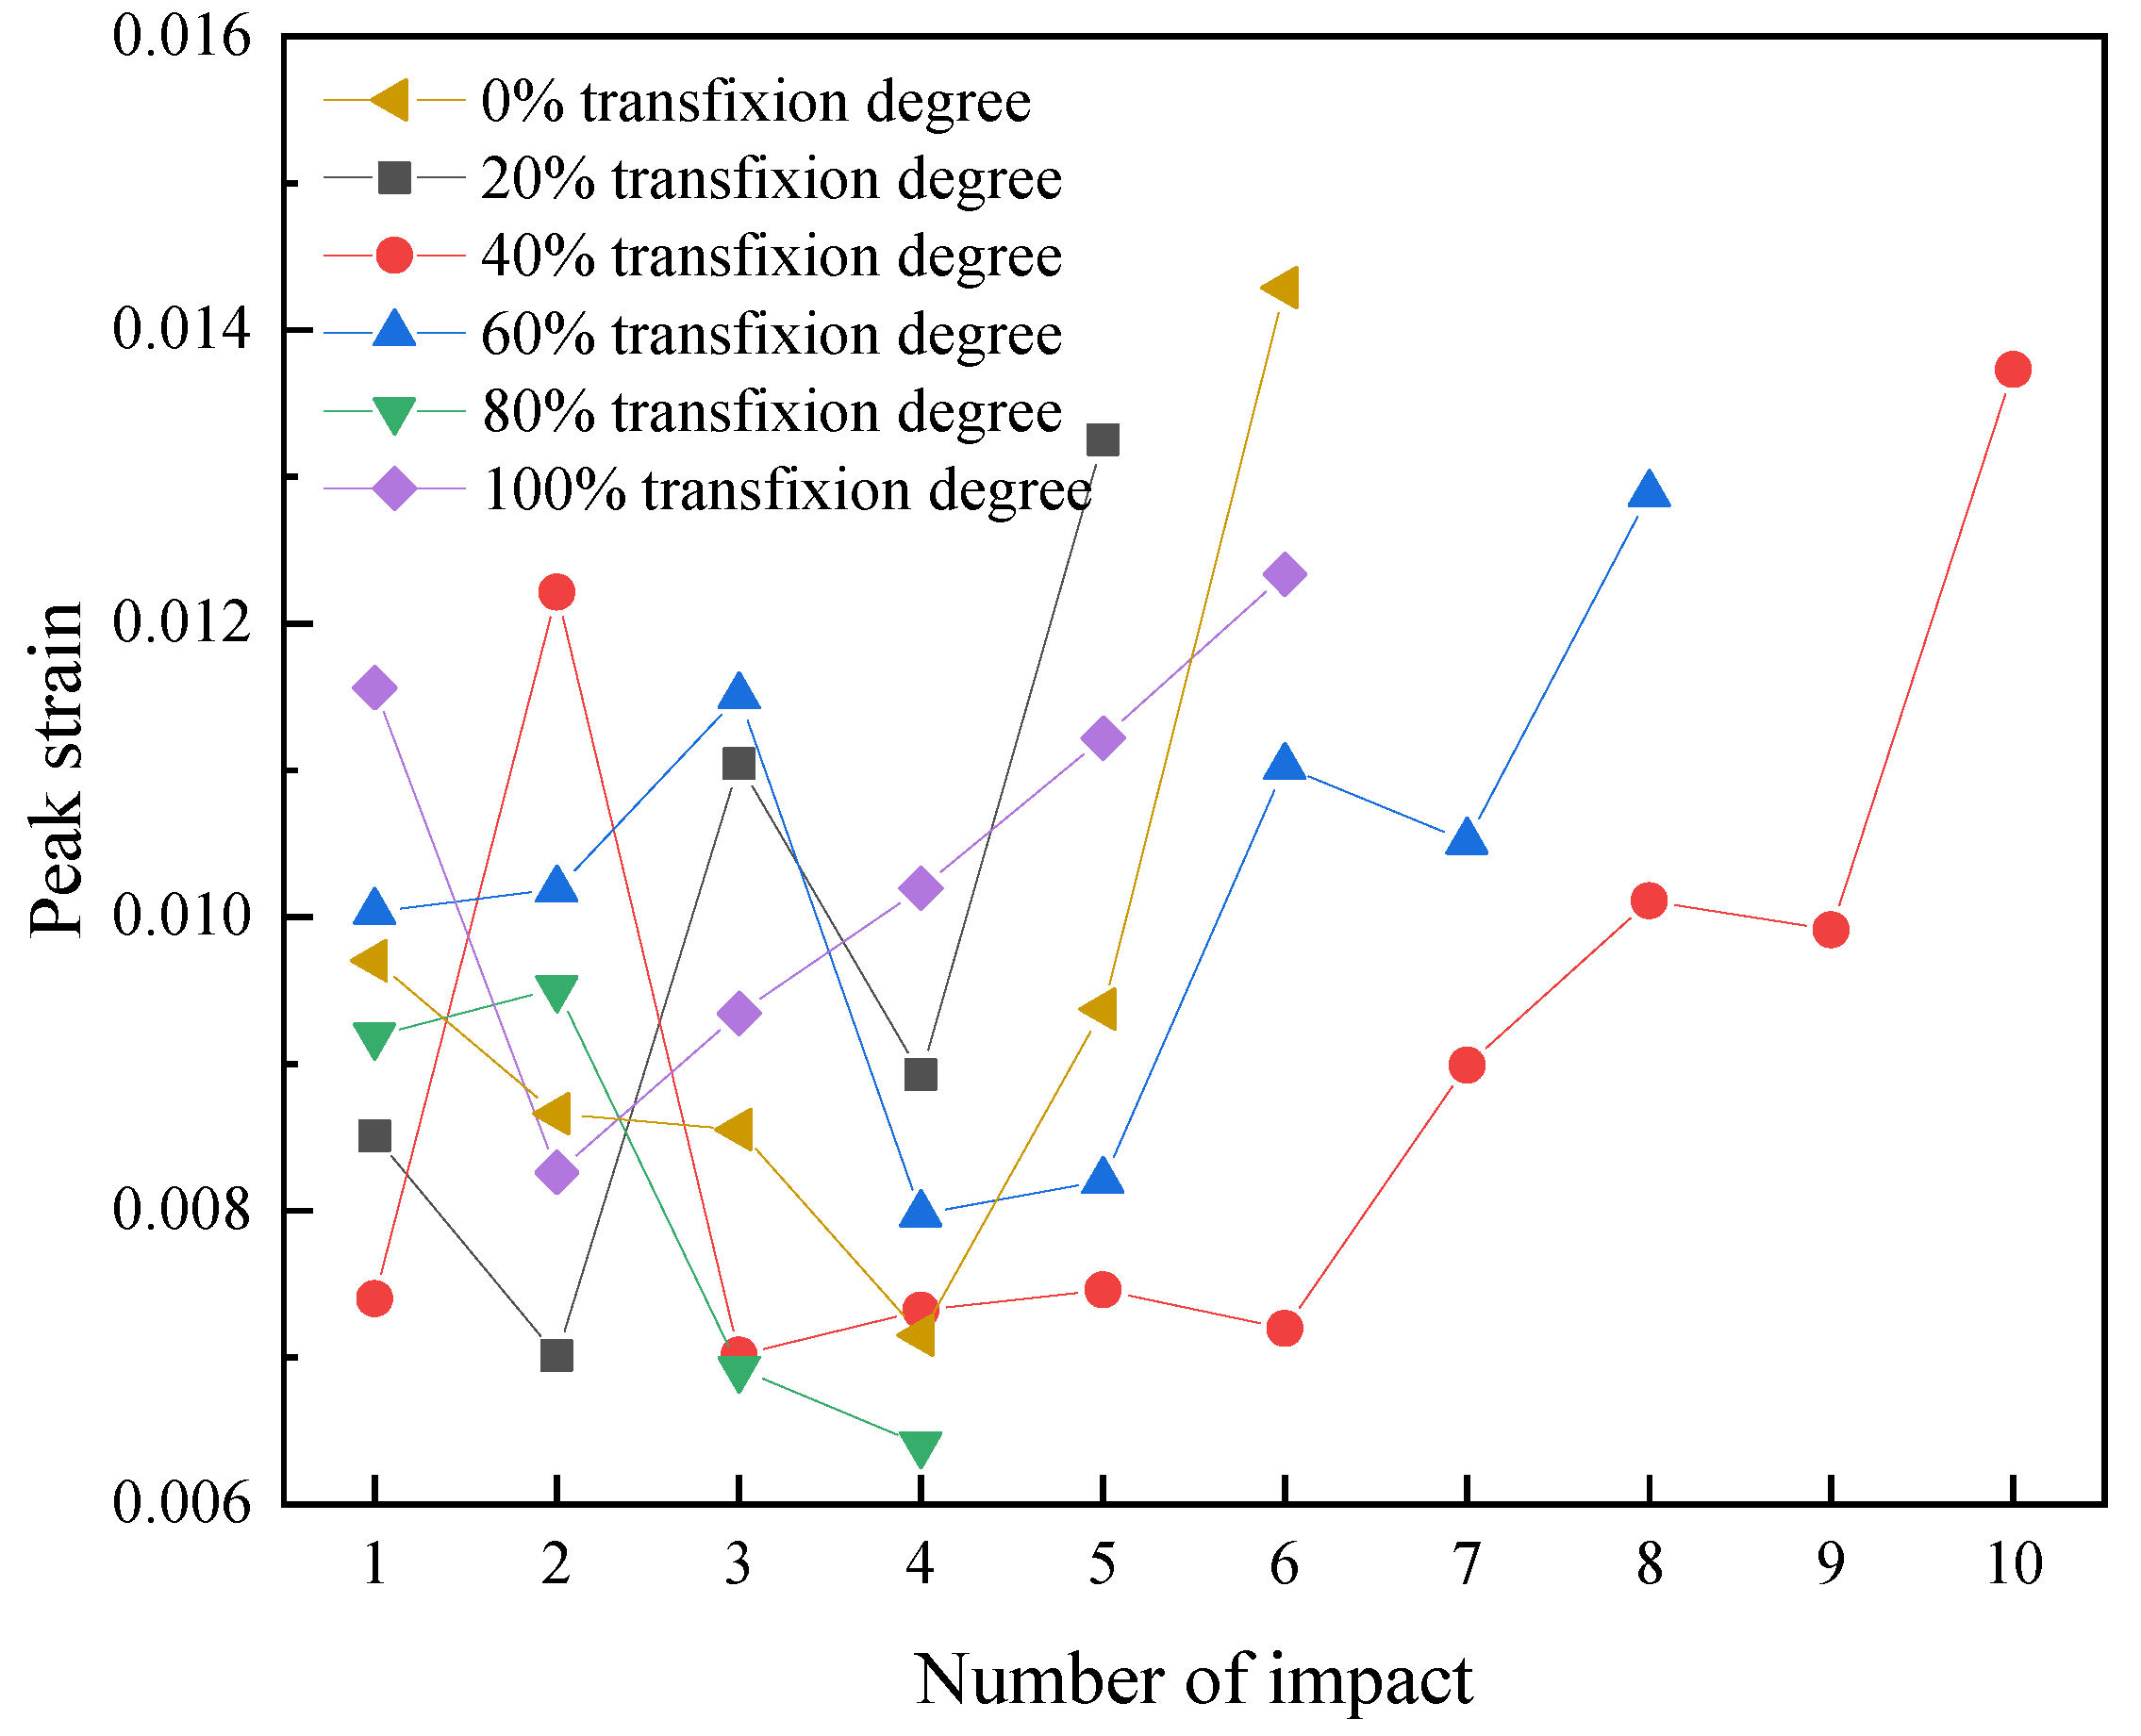
Figure 5 is the relationship curve between the peak strain of the specimen and the number of cycles. It can be concluded from the analysis of Figure 5 that the overall strain of the specimen is slowly reduced at the initial stage under the combined effect of cyclic load and water-saturated freezing, and then the strain increases with the increase of the number of cycles, indicating that the internal fracture of the specimen is unstable. The average peak strain of the no joint specimen and other specimens (20~80%) are 0.00960, 0.00975, 0.00914, 0.01030, 0.00801, and 0.01049. Among them, the average strain of 80% of the transfixion joint specimen is the smallest, which is due to the weakest ability of the specimen with a longer joint to bear the load, and the bottom of the specimen is more likely to be damaged than other specimens, so other parts are more complete and the bottom of the specimen is significantly damaged. Specimens with 60% and 100% transfixion degrees have a larger average strain due to joint length. The average strain of 0%, 20%, and 40% transfixion degree joint specimens is similar. Possible reasons for this are that the specimen is subject to water-saturated freezing, and the capacity of the cement mortar material in the no-joint transfixion parts of the specimen to carry loads does not change much.

4. Influence of Axial Joint Transfixion Degree on Energy Dissipation

4.1. Energy Density per Unit Time

The energy input of the SHPB device is realized through the impact of the impingement warhead. According to the one-dimensional stress hypothesis, the energy attenuation caused by stress wave propagation in the bar is ignored, and the energy of the incident wave EI, the reflected wave ER, and the transmitted wave ET can be expressed as below [35].
E I = A 0 C 0 E 0 0 t ε i 2 ( t ) d t
E R = A 0 C 0 E 0 0 t ε r 2 ( t ) d t
E T = A 0 C 0 E 0 0 t ε t 2 ( t ) d t
where A0 and E0 are the cross-sectional areas and Young’s modulus of the bar, and C0 is the one-dimensional longitudinal stress wave velocity of the bar, and εi, εr, and εt are collected incident wave, reflected wave, and transmitted wave strain signals.
In the process of the impact test, the energy wasted by the contact interface between the pressure bar and the specimen is generally ignored. It is considered that the energy of incident wave EI is all converted into the reflected wave energy ER, the transmitted wave energy ET, and the dissipated specimen energy ED.
E I = E R + E T + E D
To eliminate the influence of specimen size on the specimen energy dissipation, the dissipated energy by unit volume is used to characterize the energy of the stress wave absorbed by the specimen [37] and can be expressed as Equation (5). However, in addition to the specimen size, the duration of the stress wave acting on the specimen also affects the energy dissipation of the specimen. The energy dissipation per unit volume in defined unit time is used as a new index to evaluate energy dissipation of the specimen, referred to as energy density per unit time, as shown in Equation (6). Because the starting and ending time of the reflected wave and the transmitted wave are basically the same, the elapsed time of the reflected wave can be taken as the action time of the stress wave in the specimen.
E V = E D / V S
E VT = E D / ( V S T R )
where EV is the dissipated energy per unit volume, EVT is energy density per unit time, VS is the volume of the specimen, TR is the elapsed time of the reflected wave.

4.2. Analysis of Energy Composition

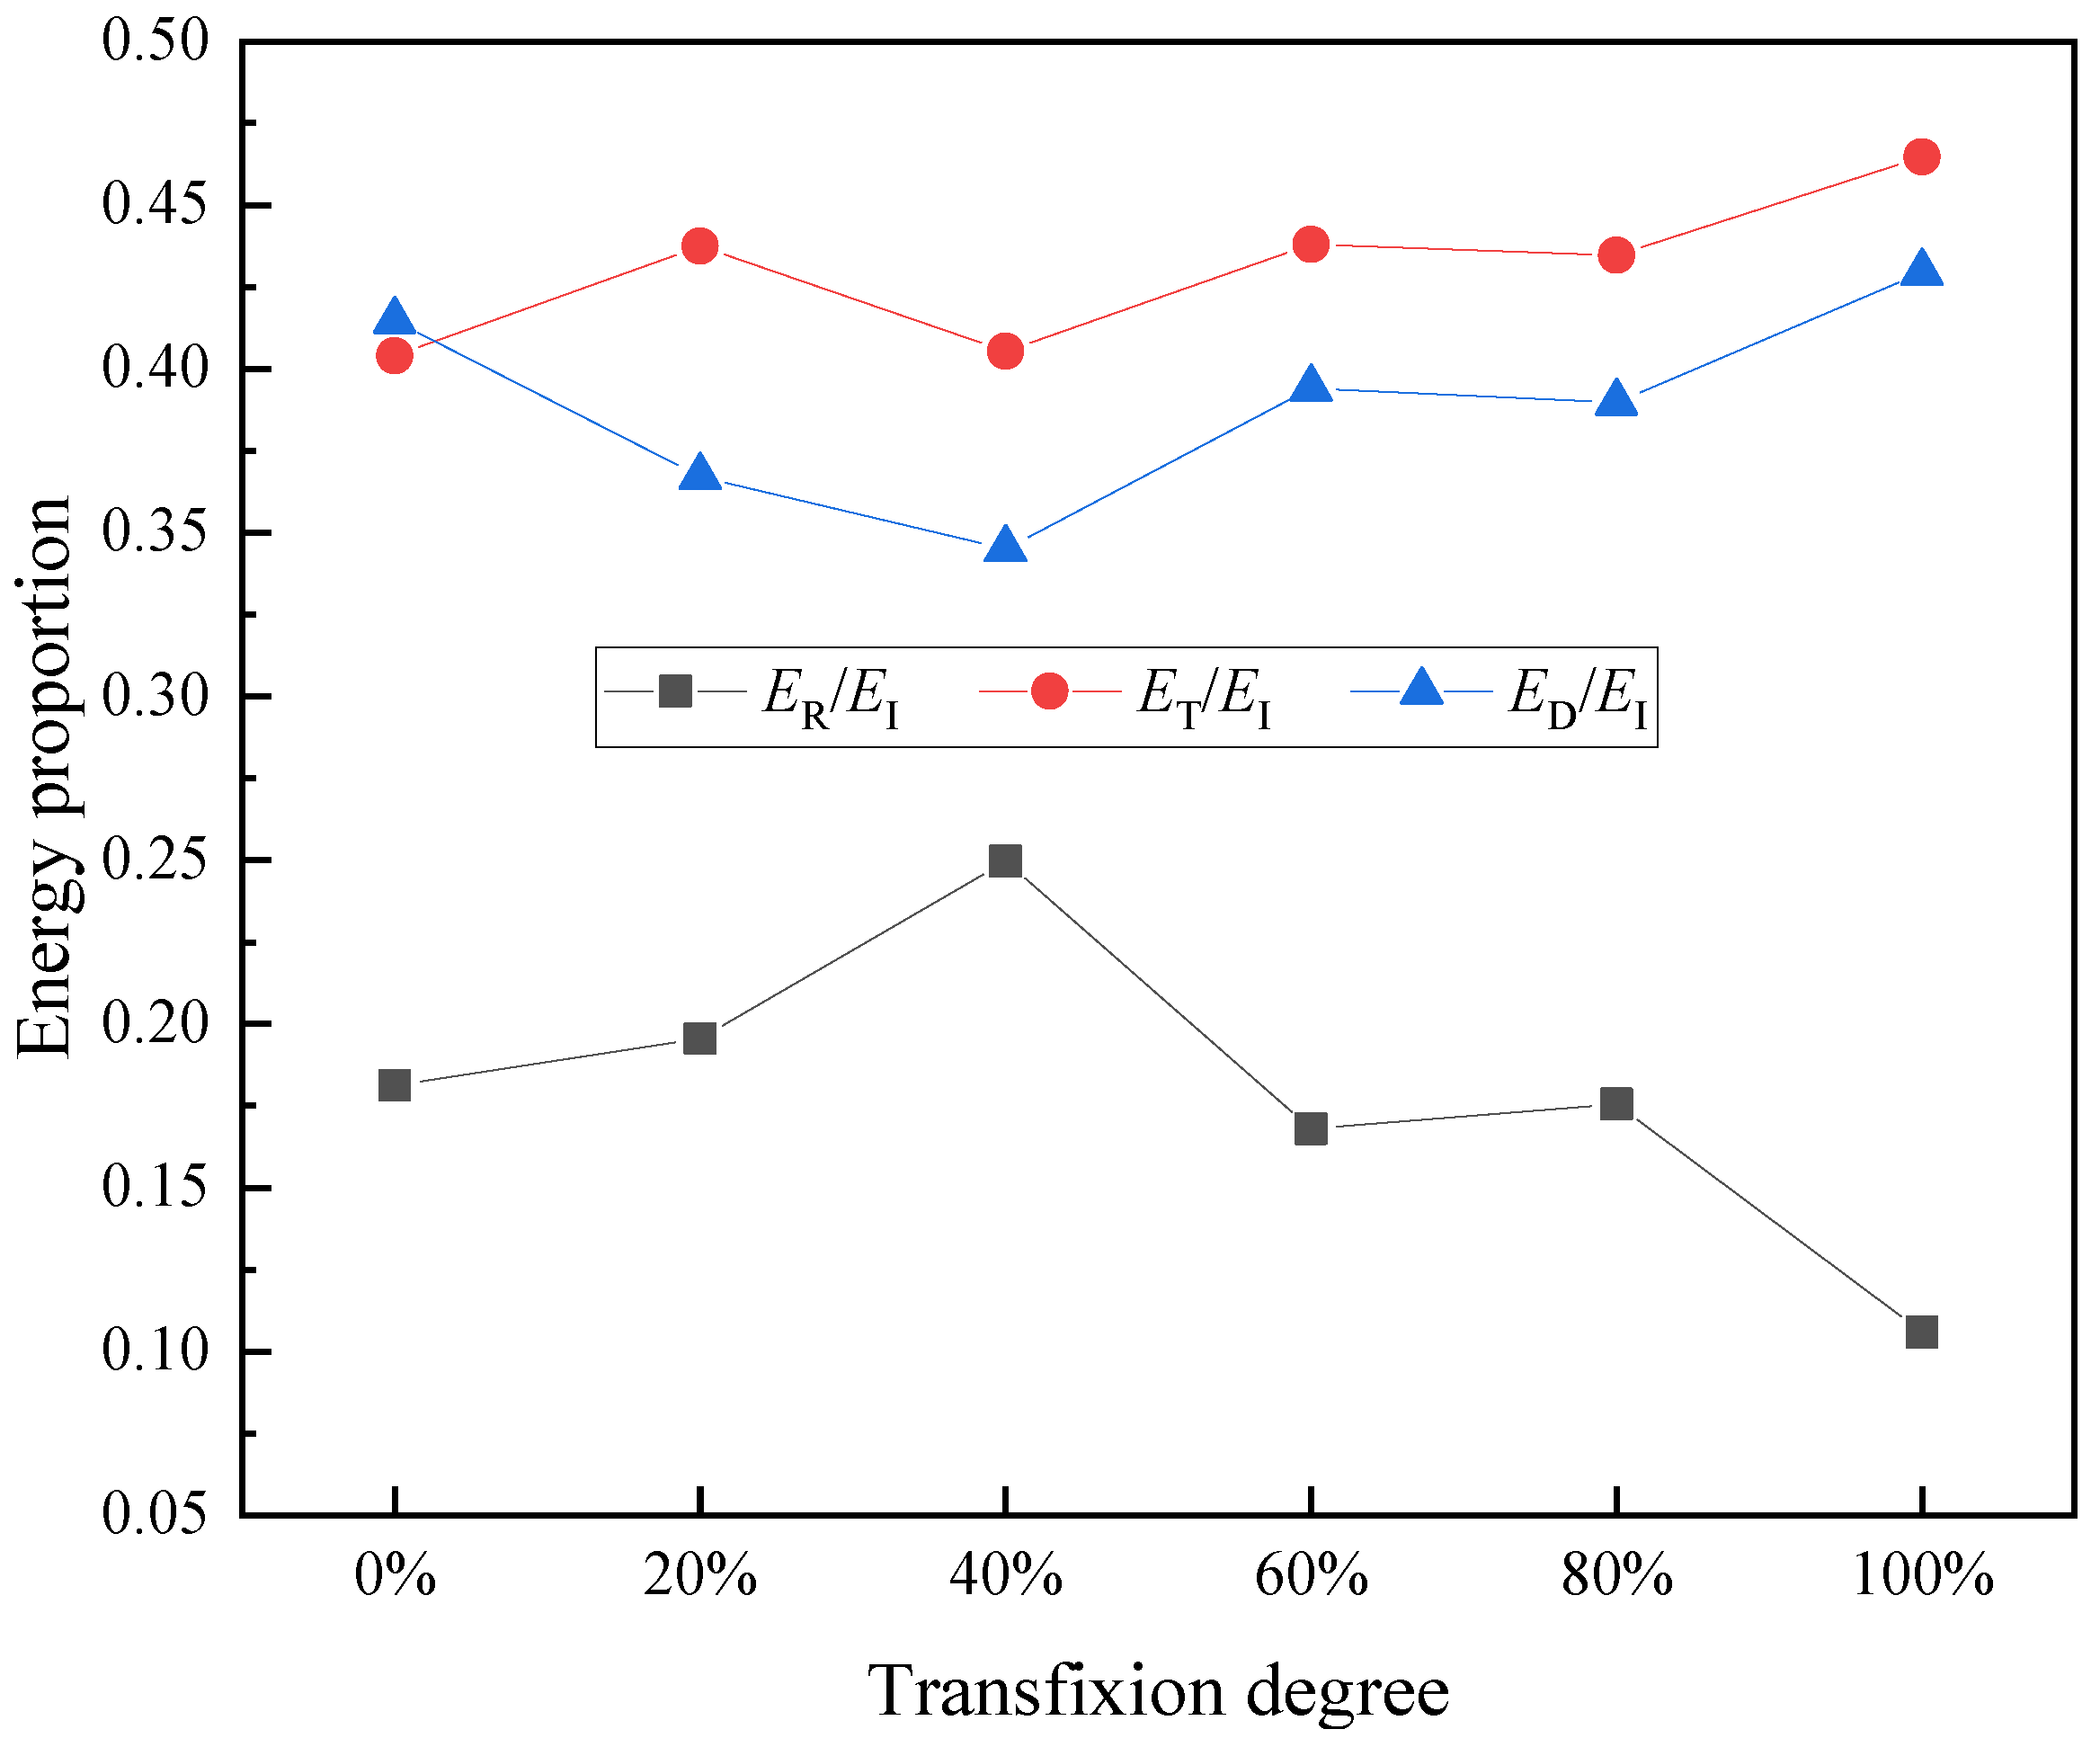
The incident energy EI, reflective energy ER, transmitted energy ET, and dissipative energy ED of different joint transfixion degree specimens obtained by the SHPB test are shown in Table 1. The relationship curve of the reflected energy, transmission energy, and dissipation energy ratio of the specimen with the joint transfixion degree is shown in Figure 6. According to the analysis in Table 1 and Figure 6, it can be seen that when the stress wave propagates in the water-saturated frozen specimen, with the increase of the transfixion degree of the axial joint, the proportion of reflection energy first increases and then decreases. The growth rate between the 0~40% transfixion degree joint specimens is less than the decay rate between the 40~100% transfixion degree joint specimens, and the proportion of reflection energy fluctuates within the range of 10~25%. However, axial joints have little effect on the penetration ability of stress waves. With the increase of joint transfixion degree, the proportion of transmission energy in ET/EI has no obvious upward or downward trend, and the proportion of transmission energy is only 40.40~46.47%. The proportion of dissipated energy shows a trend of first decreasing and then increasing with the increase of axial joint transfixion degree. Taking the dissipated energy proportion of the 40% transfixion degree specimen as the intermediate point, the decreasing rate is approximately the same as the increasing rate. The reason for no obvious change trend in the proportion of transmission energy is that the specimens are frozen with saturated water before each impact test. The water-containing area inside the specimen is in the state of ice crystals, and the transmission area of the stress wave is always cement mortar and ice crystals. The increase in the proportion of reflection energy is due to the small transfixion degree of the specimen and the enhanced load-carrying capacity after freezing in saturated water, resulting in a gradual increase in the proportion of reflection energy of the 0~40% transfixion joint specimens. The reflection energy of 40% of transfixion joint specimens accounted for the largest proportion. The reason for the gradual decrease in the proportion of reflection energy of 40~100% transfixion joint specimens is the effect of increasing transfixion degree.

4.3. Analysis of the Relationship between Energy Absorption and Porosity Change

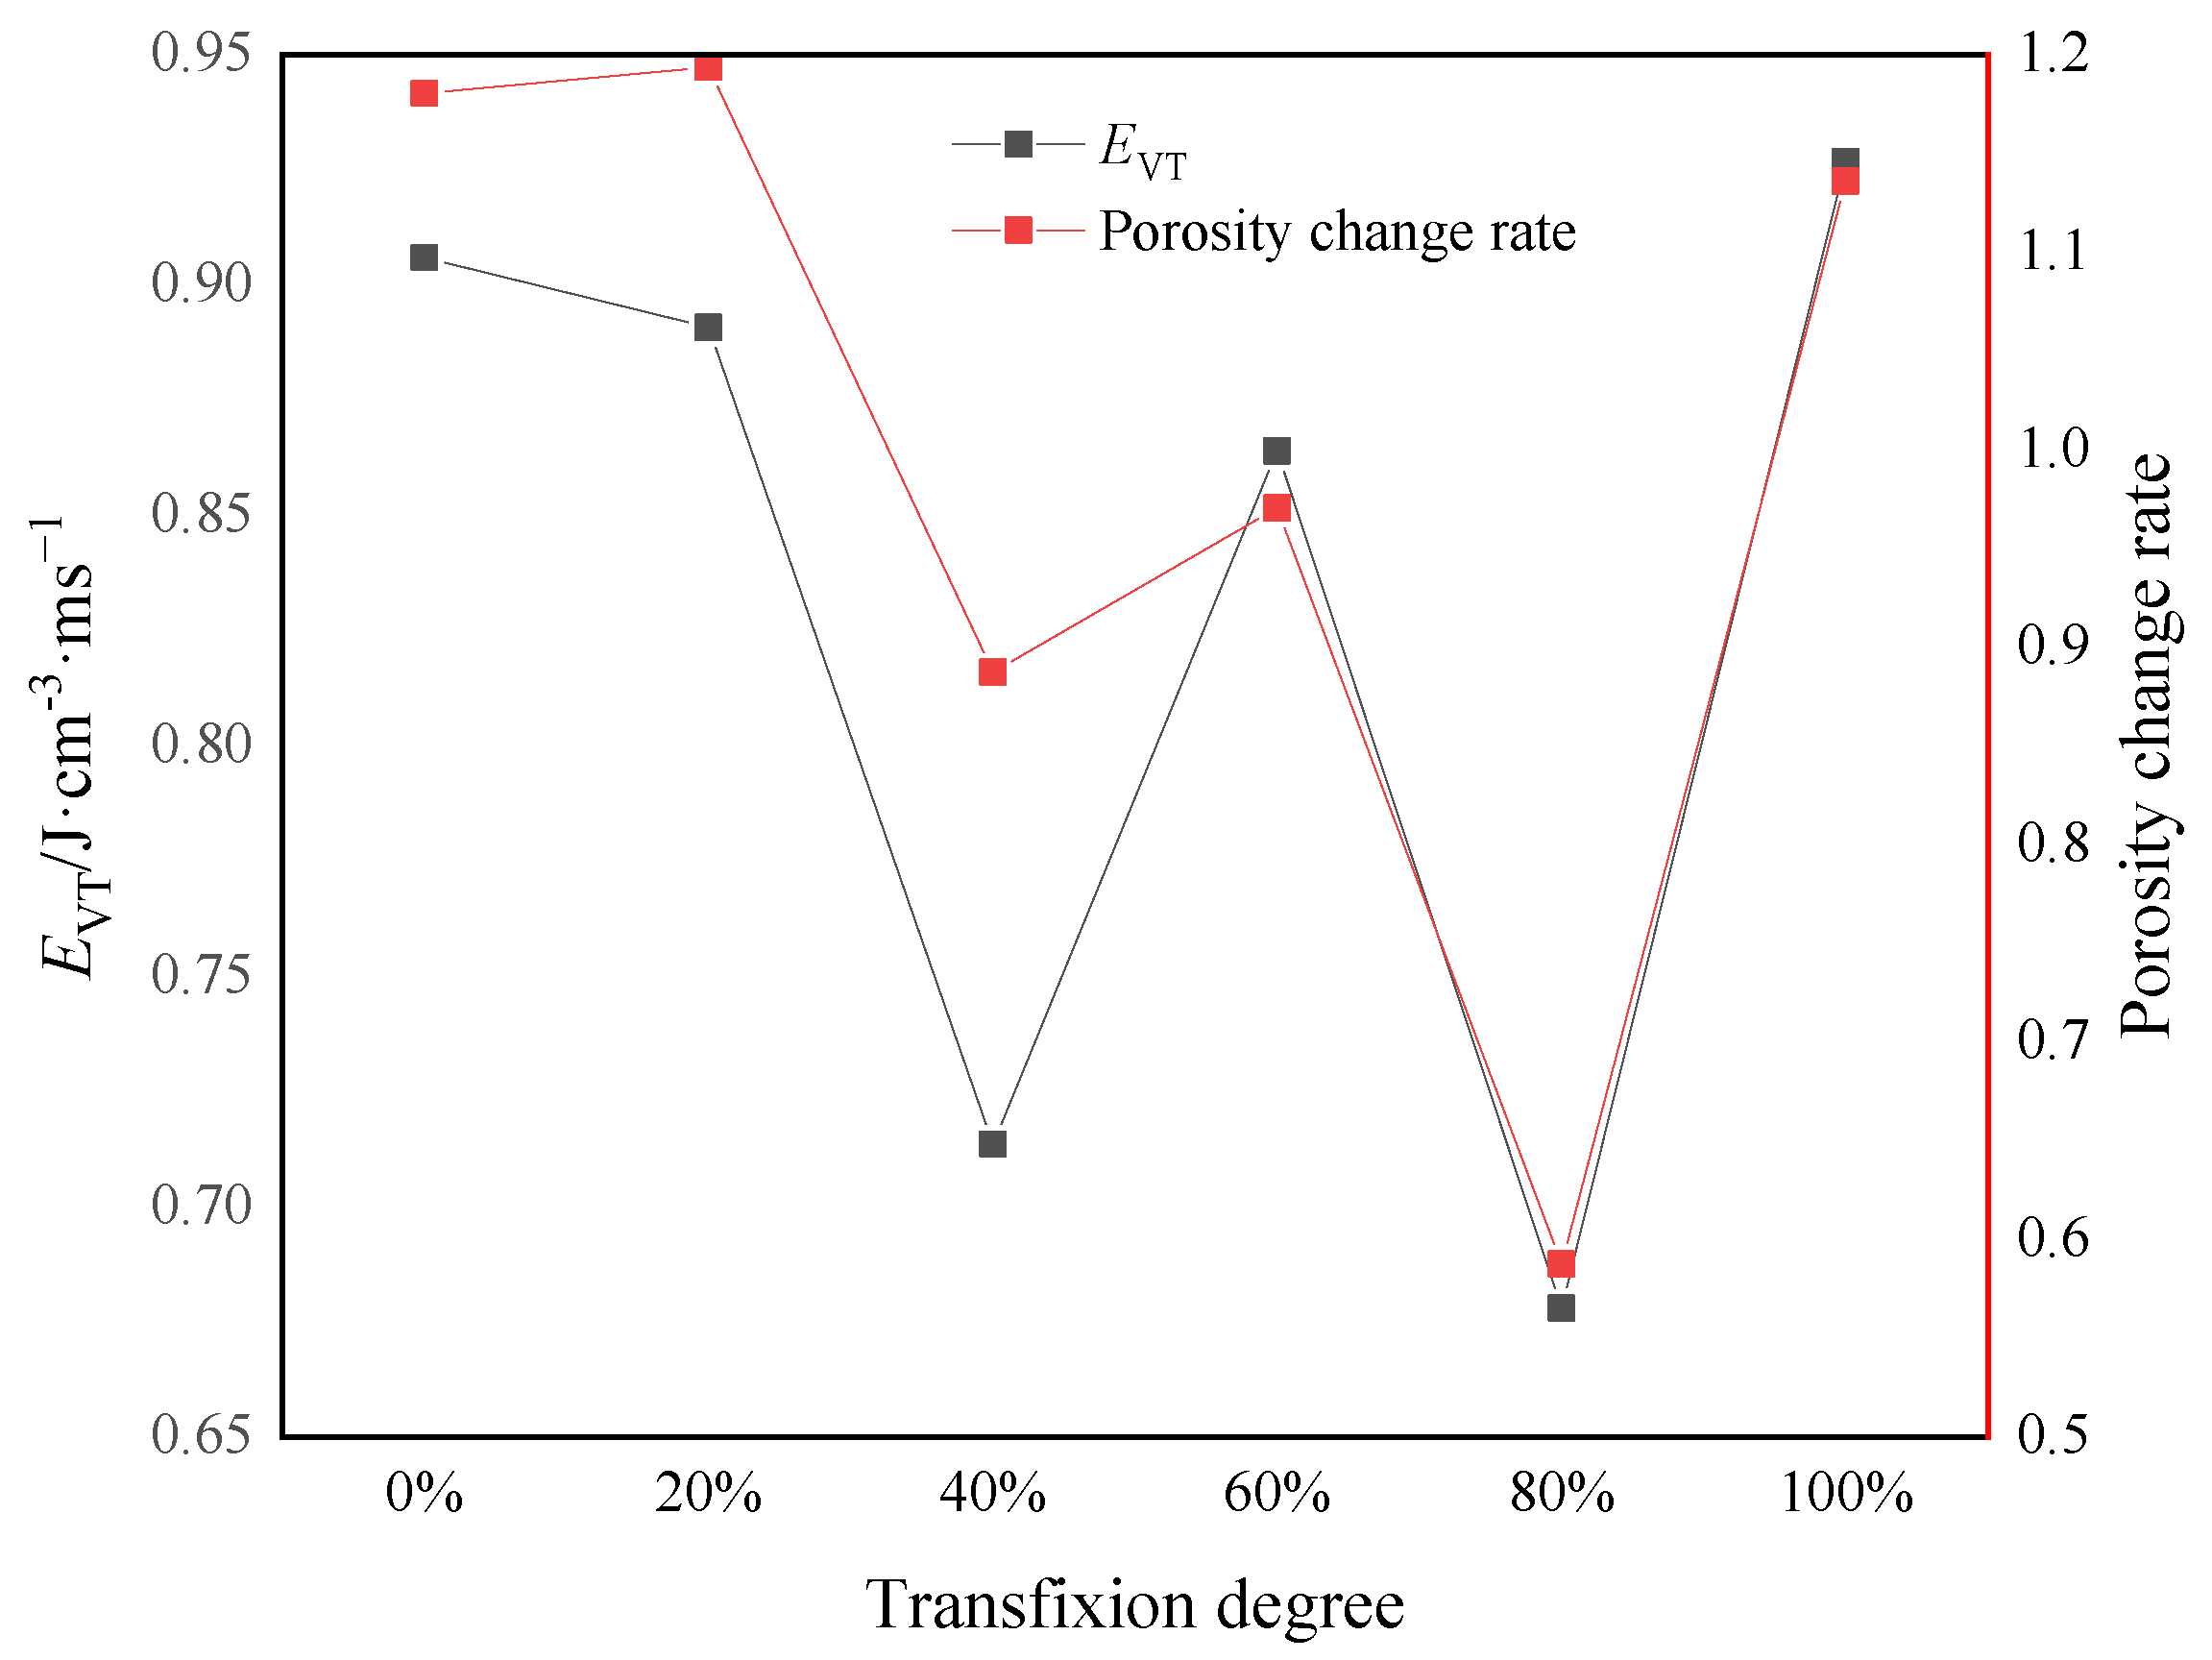
The reflected waves elapsed time of the 0~100% transfixion joint specimens were extracted, and the energy density per unit time (EVT) of the specimens with different joint transfixion degrees was calculated by Formula (6). The results are shown in Table 2. The right side of Table 2 shows the porosity and porosity change rate of specimens with different joint transfixion degrees. Because the porosity of the specimen decreases in the compacted state or increases in the crack initiation, development, and expansion state, the change of the porosity is related to the dissipated energy, so the absolute value of the porosity change rate is calculated when calculating the porosity change rate. Figure 7 shows the change trend relationship of the energy absorption and porosity change rate of the specimen with the joint transfixion degree.
It can be seen from Table 2 and Figure 7 that the EVT of the 0~100% transfixion degree joint specimens generally showed a trend of first decreasing and then increasing with the increase of transfixion degree. The EVT of the 80% transfixion joint specimen was the lowest, indicating that the specimen had the worst absorption of incident energy. The reason is that the transfixion degree is large, the load-bearing capacity of the specimen is weak, a small number of cracks in the specimen are initiated and expanded under the impact, and the time to complete the formation of surface cracks is short, and the number of tests is small. Therefore, this point can be excluded from the trend analysis of energy absorption. In the range of 0~40%, the EVT value decreased from 0.9060 J·cm−3·ms−1 to 0.7135 J·cm−3·ms−1, and the energy absorbed by the specimen kept decreasing in this range. When the transfixion degree is 40%, the energy absorption reaches the lowest level. Within the range of 40~100% (except 80%), the EVT value decreased from 0.7135 J·cm−3·ms−1 to 0.9268 J·cm−3·ms−1. Within this range, the energy absorbed by the specimen continued to rise. When the transfixion degree is 100%, the energy absorption reaches the highest level. Under the combined action of water-saturated freezing and impact load, more crack initiation and expansion consume more energy inside the specimen. It is extended to engineering practice, and it is aimed at cement mortar materials in alpine and long-saturated water areas. In the case of sufficient geological data, the direction of load action and the length of the transfixion joint can be considered in the design to enhance the load-bearing capacity.
Under the action of 0.11 MPa impact air pressure, the average change rate of porosity of the specimen first decreased and then increased with the increase of joint transfixion degree. The average change rates of porosity of the 0~100% transfixion degree specimens are 1.1805, 1.1937, 0.8873, 0.9705, 0.5875, and 1.1358, respectively. It can be seen that the joint transfixion degree has a greater impact on the damage of the specimen when the impact energy is not much different. The porosity variation rates of 0%, 20%, and 100% of the transfixion degree are larger, and the porosity variation rates of 40%, 60%, and 80% are smaller. It shows that the damage degree of the specimen is related to the joint transfixion degree and the ability of the specimen to bear the load due to the freezing of saturated water.

5. Influence of Axial Joint Transfixion Degree on Specimen Damage

5.1. Analysis of Pore Size Distribution

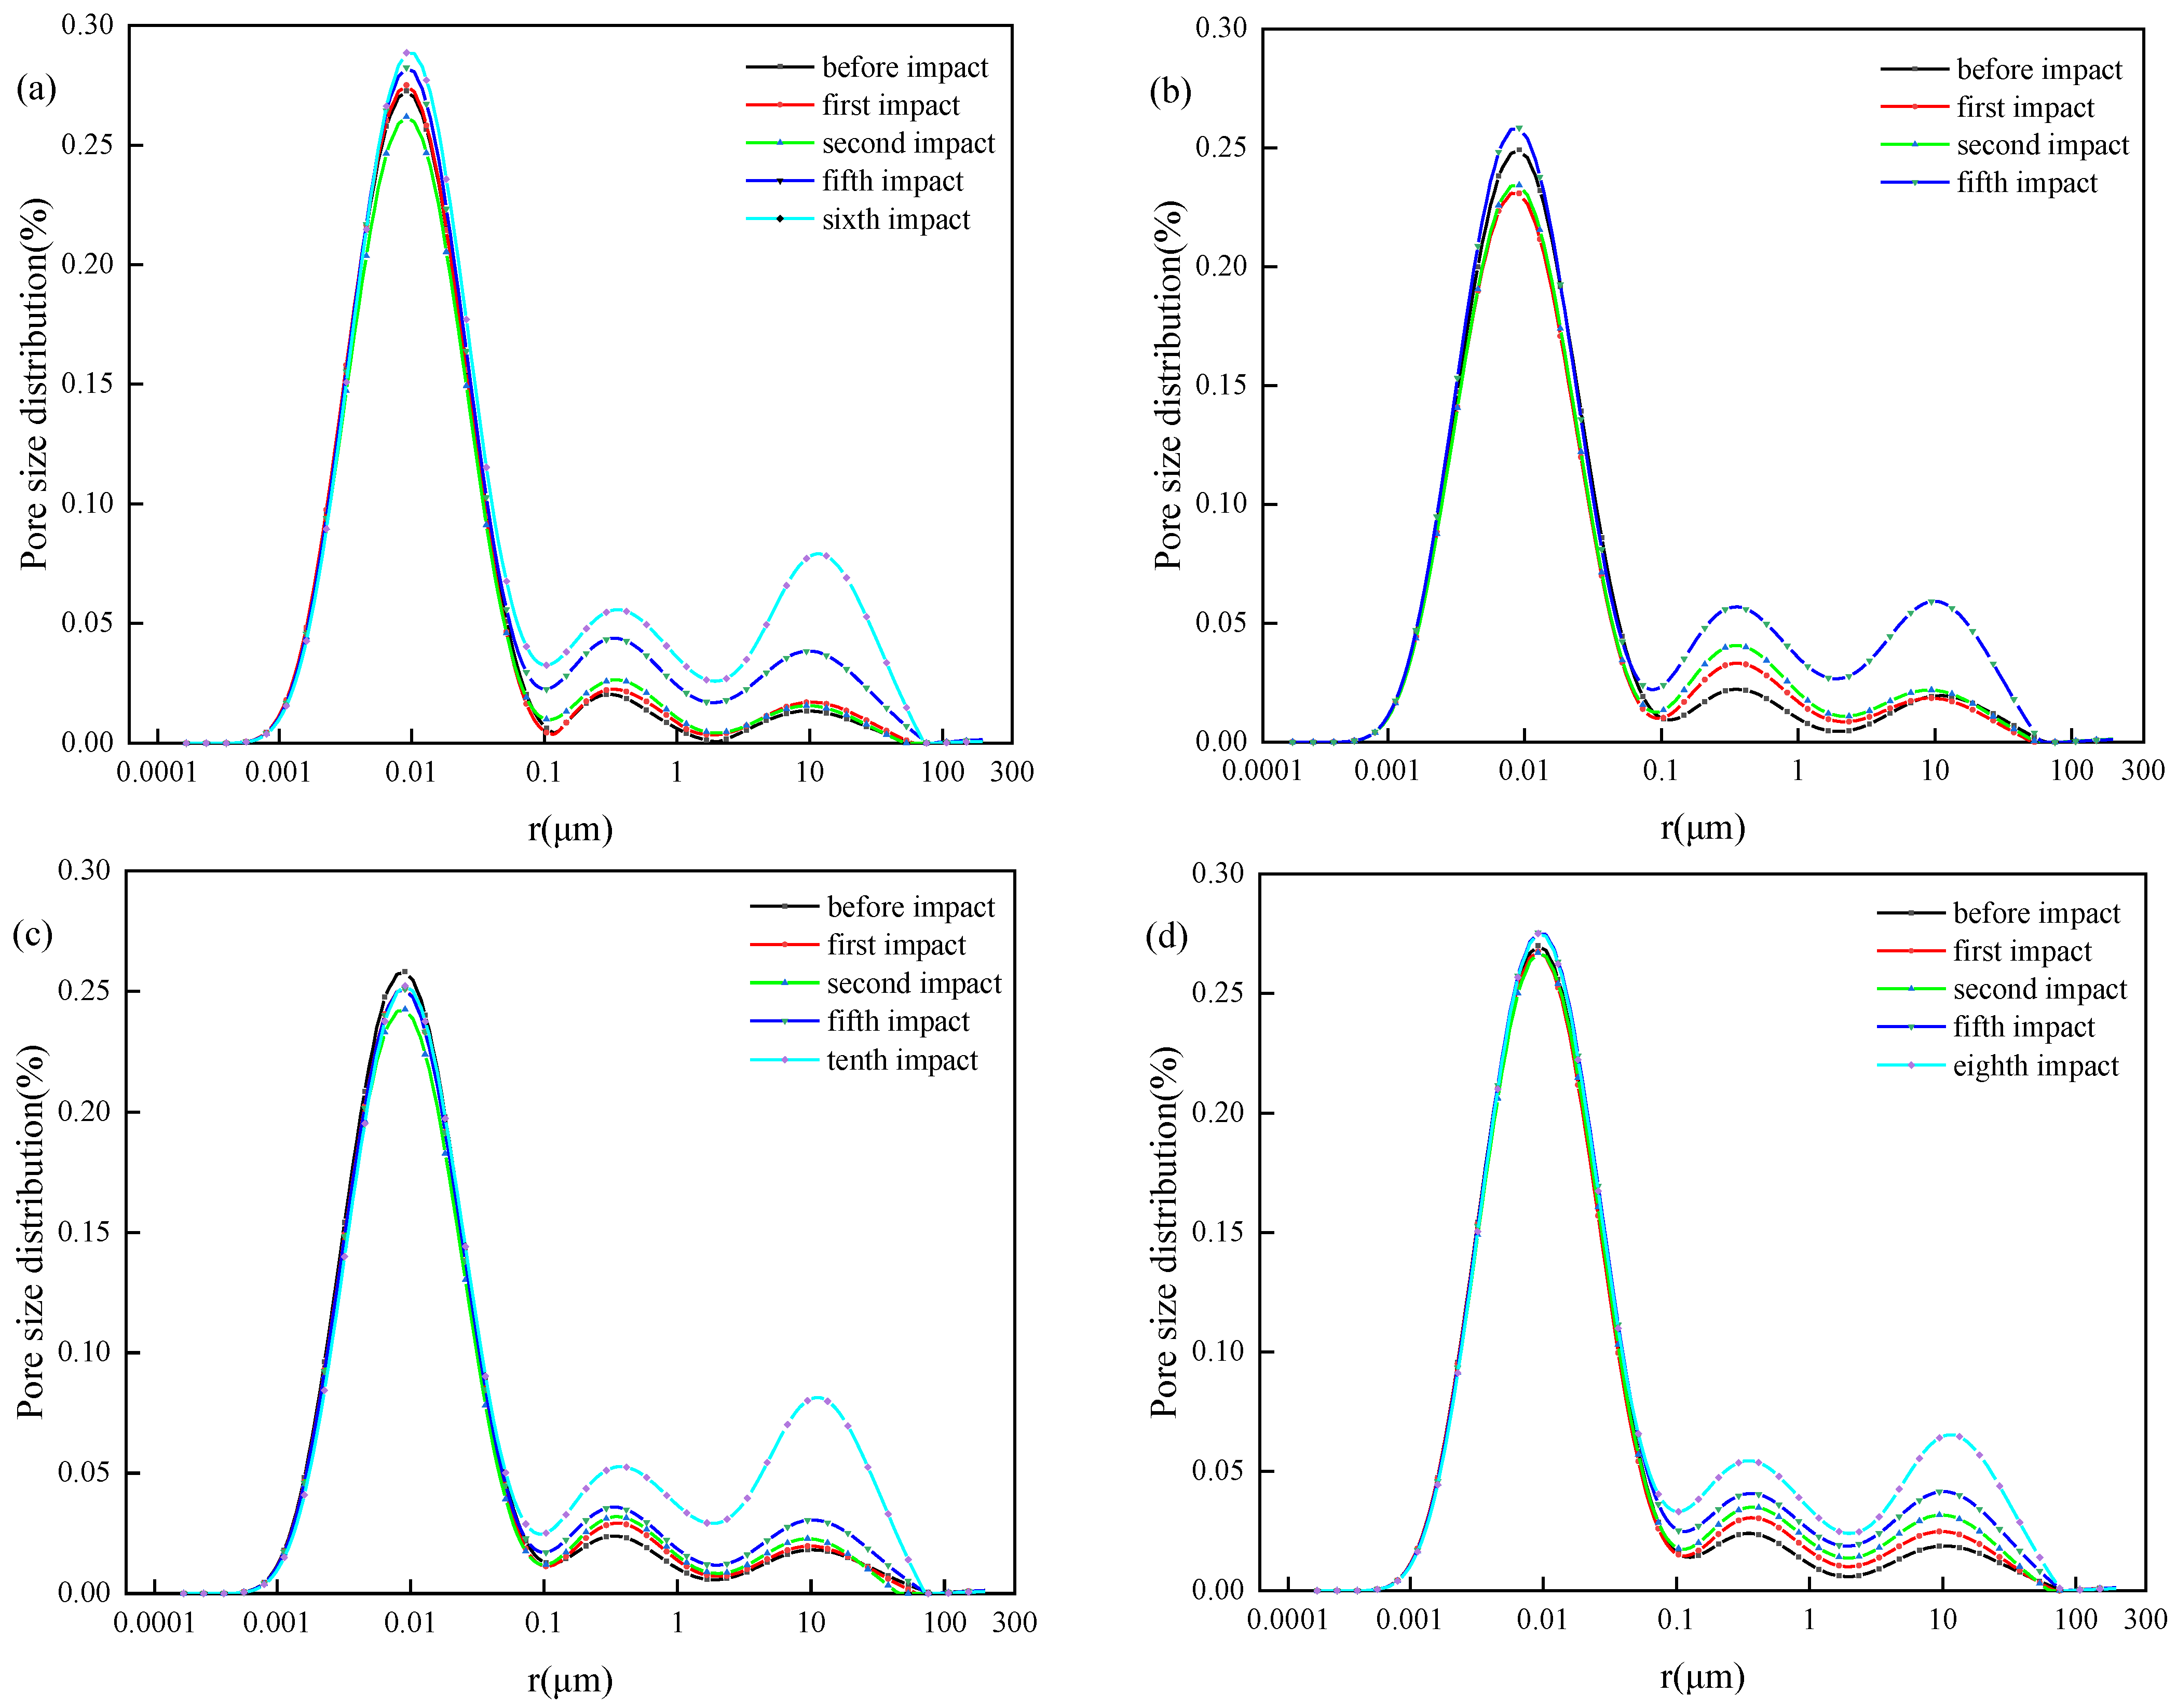
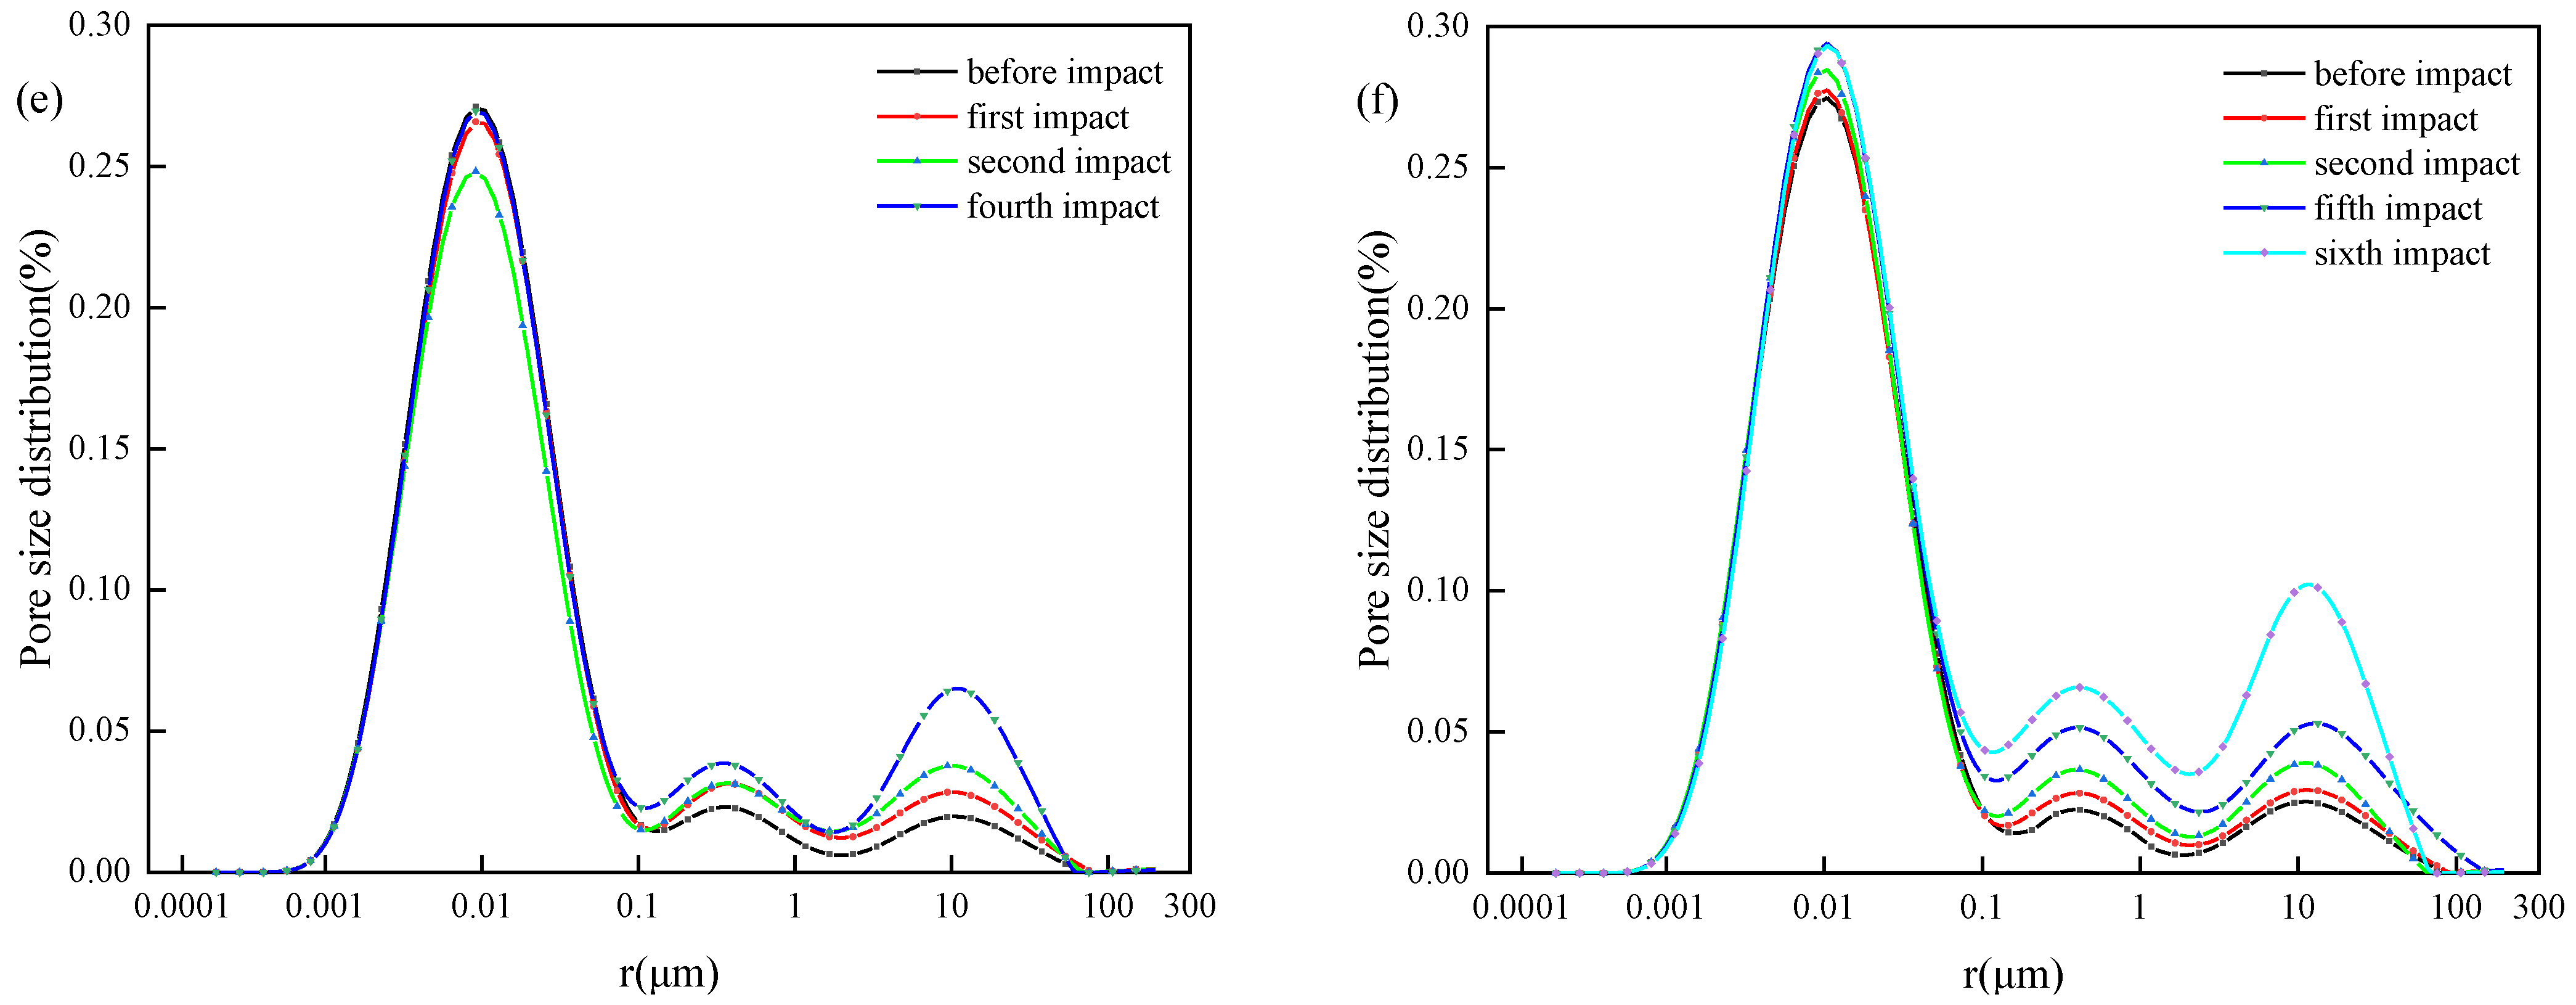
MRI can detect the signal intensity of water in each pore and the signal intensity of water in the total pores, and the ratio between the two can characterize the proportion of pores with different pore sizes in the rock to the total pores as the pore size distribution. To study the mesoscopic damage of different transfixion joint specimens under the combined action of water-saturated freezing and impact load, the pore size distribution structure of the specimens was analyzed. The pore size in the cement mortar specimen is divided into 3 grades [33,36,38]; 0~0.1 μm is microscopic pores, 0.1~1 μm is medium-sized pores, and larger than 1 μm is large-sized pores. It can be seen that the unjointed specimens before impact are mainly composed of tiny pores, accompanied by a small number of medium-sized pores, and almost no large-sized pores. Figure 8 is a comparison chart of the pore-size distribution of the specimens with different joint transfixion degrees frozen in saturated water under the action of cyclic impact.
It can be seen from Figure 8 that before the SHPB impact, a large number of tiny pores and a small amount of medium and large pores were developed inside all types of specimens. The continuity between the three types of pores is poor, and the proportion of pores in the original state of the specimen is similar to the trend of pore size. There are subtle individual differences between the specimens, but these do not affect the overall test effect.
Analysis of the pore-size distribution trend after impact shows that in the first two impact tests, the micro-pores of the specimen were compacted, and the medium-sized pores and the large-sized pores gradually increased, and the increasing phenomenon was not significant. It shows that the inside of the specimen belongs to the crack initiation state in which the tiny pores are compacted during the test. When the number of cyclic impact tests reaches 4~10 times, the medium-sized pores and the large-sized pores increase rapidly, the micro-sized pores do not change much, and the connection of the three pore intervals has a vertical upward trend, gradually softening and smoothing. It shows that the connectivity between pores of different sizes becomes better. In general, under the combined action of water-saturated freezing and impact load, the newly sprouted pores in the specimen and the compaction, redevelopment, and expansion of the primary pores are the reasons for the change in the pore-size distribution of the specimen. The ice crystal filling in the primary pores increases the strength of the specimen but reduces the expansion capacity of the original pores due to incident energy. Therefore, the increase of medium-sized pores and large-sized pores caused by the absorption of energy by the specimen dominates the damage degree of the specimen.
According to the pore-size distribution comparison chart of the specimens with different joint transfixion degrees in saturated water under cyclic impact conditions, the peak pore sizes of different pore types and their proportions are shown in Table 3.
By comparing the data in Table 3, it can be seen that the peak pore sizes of small pores, medium pores, and large pores of all specimens did not change much before and after impact, but the proportion of peak pore sizes of all specimens changed significantly before and after the cyclic impact test. The proportions of the peak diameters of small, medium, and large pores in the specimens with different transfixion degree increase in sequence as follows: 20% transfixion degree specimen is 0.0093, 0.0347, and 0.0397; 40% transfixion degree specimen is −0.0059, 0.0286, and 0.041; 60% transfixion degree specimen is 0.0051, 0.0304, and 0.046; 80% transfixion degree specimen is −0.0013, 0.0155, and 0.0454; 100% transfixion degree specimen is 0.0185, 0.0434, and 0.077; no-joint specimen is 0.016, 0.0354, and 0.0648. It can be seen that the small pores are compacted and the large pores are developed in the 40% and 80% transfixion degree specimens before and after the test, and the remaining specimens have both large and small pores.
Before and after the cyclic impact test, the percentage growth rate of the peak pore size of small pores is 100% > 0% > 20% > 60% > 80% > 40%, the growth rate of peak pore size proportion of medium-sized pores is 100% > 0% > 20% > 60% > 40% > 80% from large to small, the growth rate of the peak pore size ratio of large pores from large to small is 100% > 0% > 60% > 80% > 20% > 40%. Combined with the number of impacts, it can be seen that the impact resistance of the frozen specimen with a transfixion degree of 40% is stronger, and the impact resistance of the frozen specimen with a transfixion degree of 100% is weaker. Frozen specimens with a transfixion degree of 80% have less impact resistance due to the effect of joints. Due to the early failure of the 80% transfixion degree specimens, this group of data was excluded to analyze the relationship between the pore development trend and the transfixion degree. In the first five cyclic impact tests, the growth rate of the peak pore size ratio of small and medium pores from large to small is 100% > 0%> 60% > 40% > 20%, The growth rate of the peak pore size ratio of medium-sized pores is 100% > 0% > 20% > 60% > 40% from large to small, and the growth rate of the peak pore size ratio of large pores is 100% > 0% > 60% > 40% > 20% from large to small. The analysis shows that when there are joints, the overall pore development trend increases with the increase of the transfixion degree. Because the pore change of the unjointed specimen mainly comes from the deformation of the cement mortar matrix, the effect of water-saturated freezing inside the specimen is poor, so its pore development is second only to the frozen specimen with a transfixion degree of 100%.

5.2. Analysis of Microstructural Damage Imaging

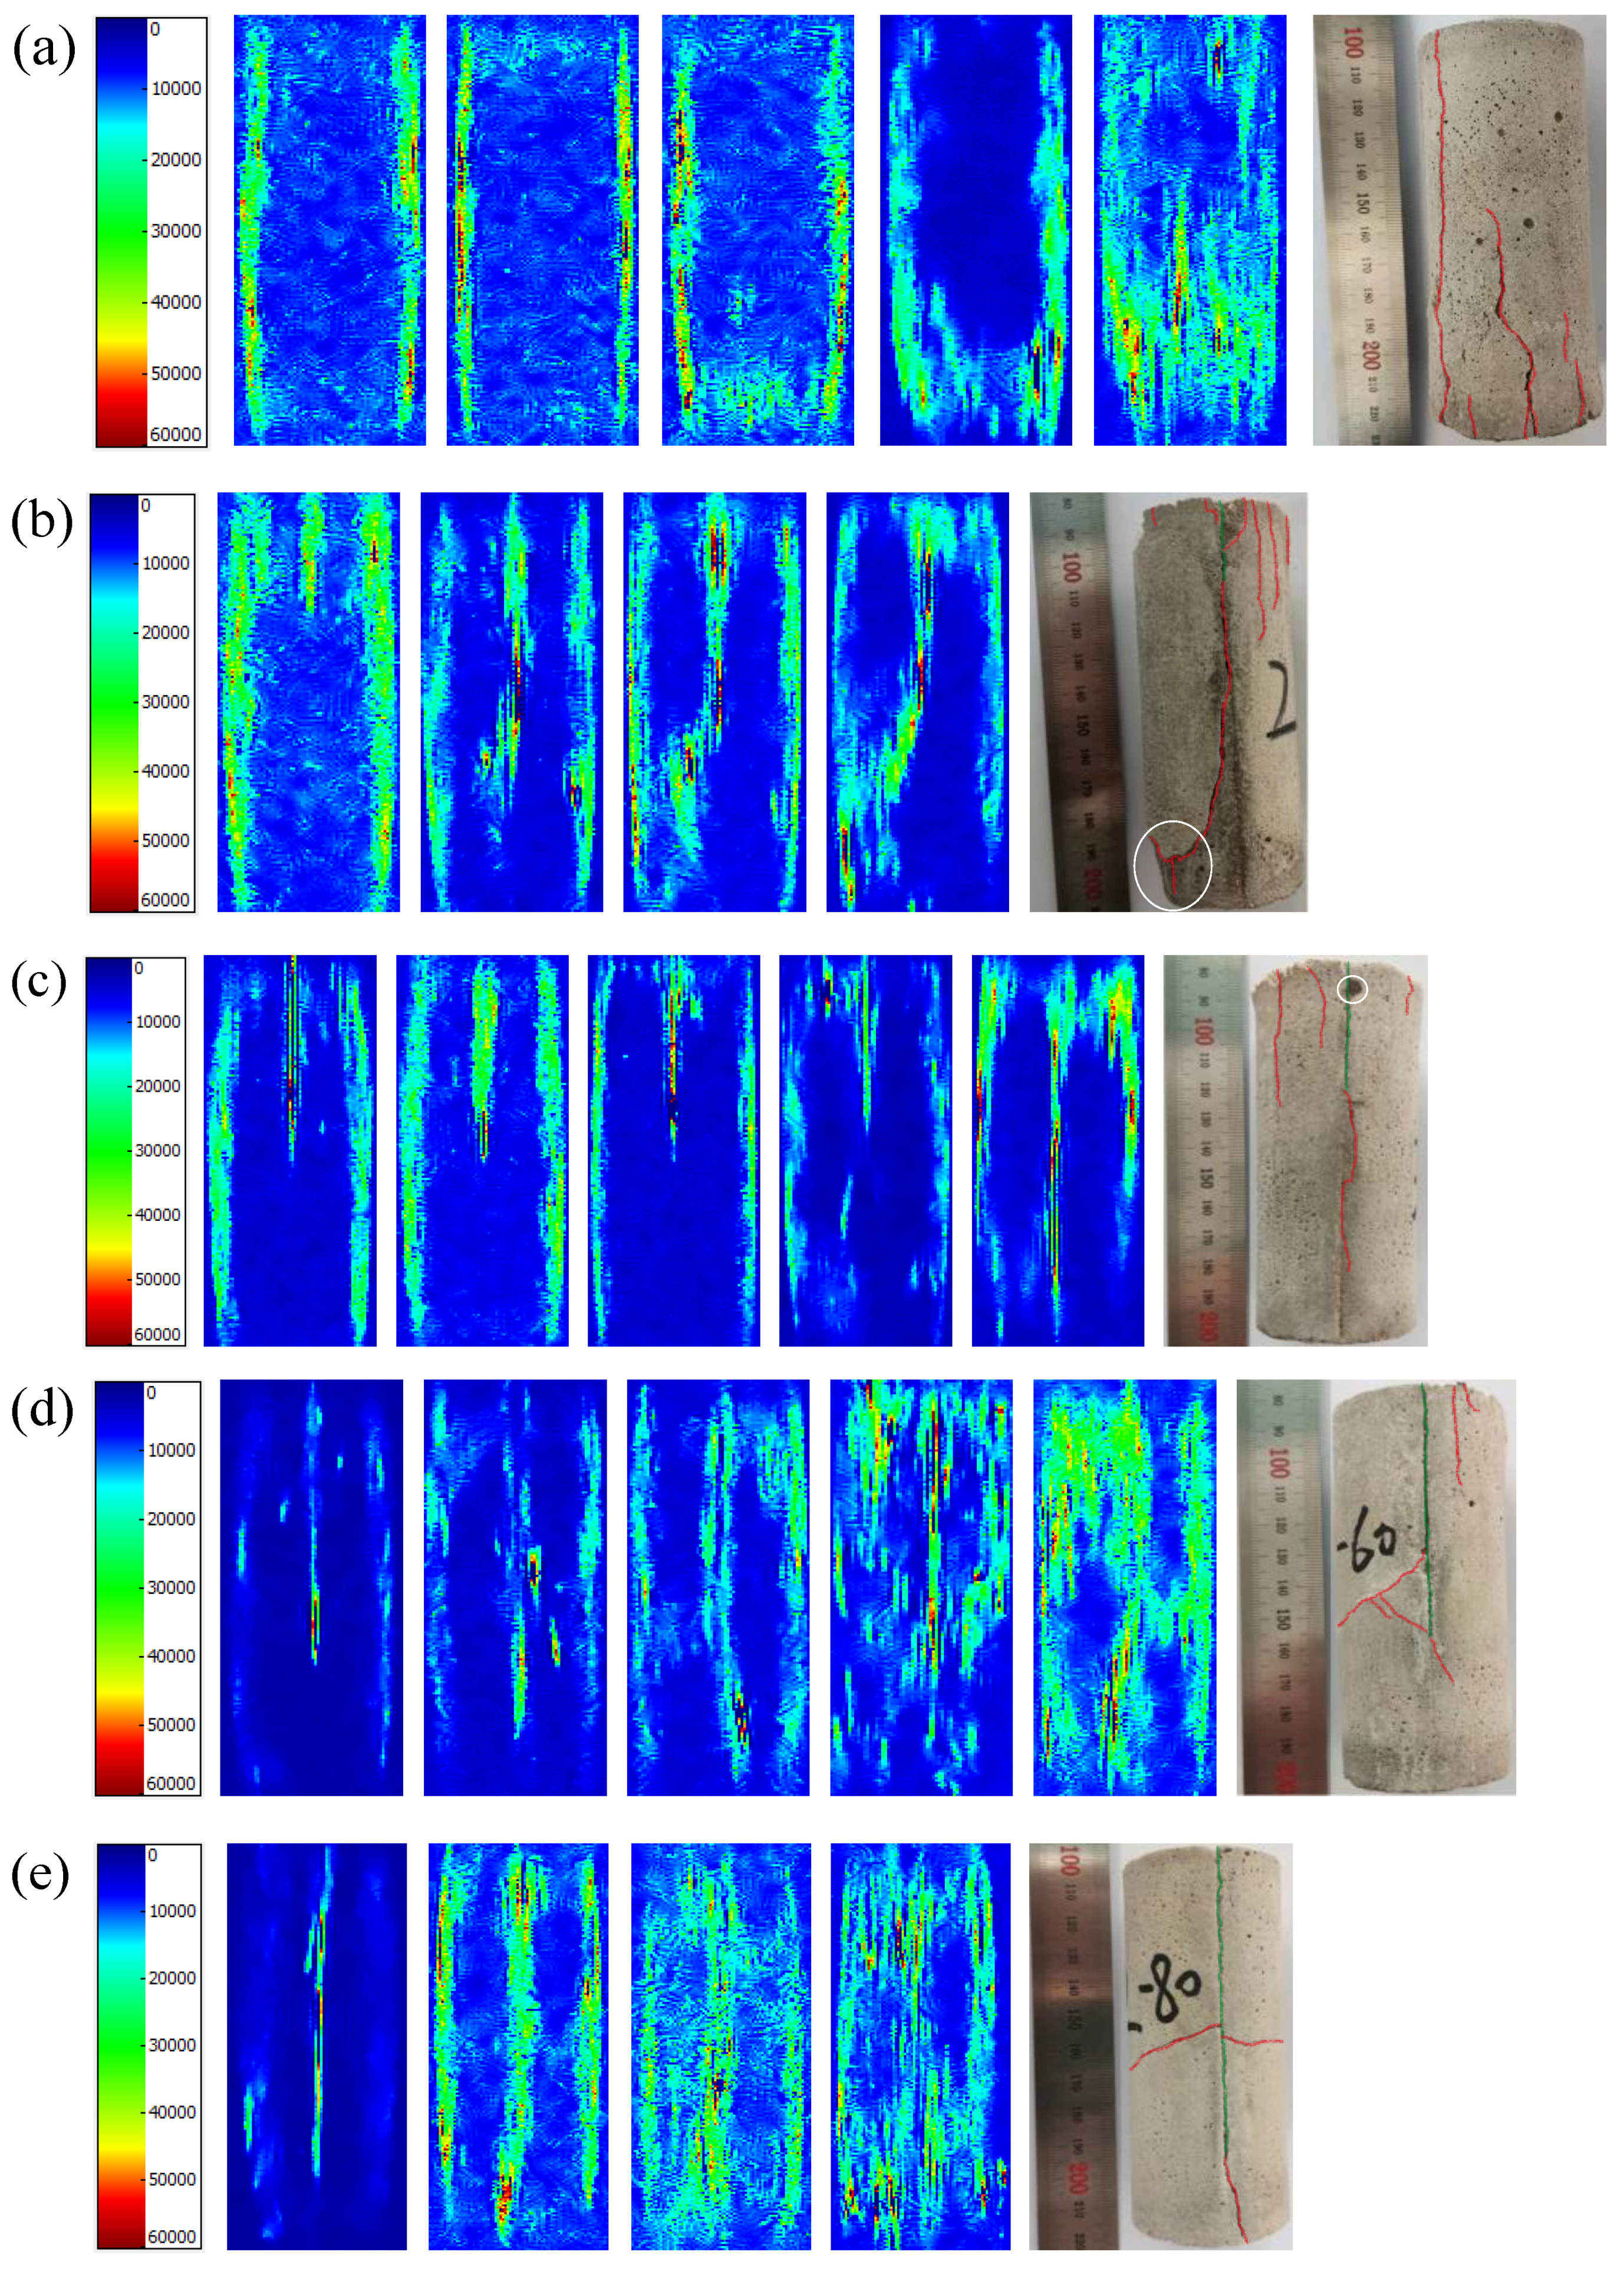
The microscopic imaging of the test specimen was carried out by MRI equipment, and the trend relationship of cumulative damage and crack propagation was analyzed from the microstructure. Figure 9 shows the MRI and surface crack distribution diagrams of specimens with different joint transfixion degrees.
It can be seen from Figure 9 that the failure states of the specimens with different joint transfixion degrees after impact are similar to those of the intact specimens. From the NMR imaging effect, there was a strip-shaped continuous bright spot at the center of the specimen before the test, and the rest of the bright spots were randomly scattered inside the specimen, and the bright spots on the surface of the specimen were mostly distributed. It shows that the internal damage of the specimen can be neglected before the impact load is applied.
With the increase in the number of cycle tests, it can be seen that all specimens were gradually destroyed by internal damage to the surface of the cumulative process, the 20~80% transfixion degree joint specimens were pre-destroyed by the joint tip, and then expanded into surface cracks, and the 0% and 100% transfixion degree joint specimens for internal minor damage and serious damage to the end. The reason for explaining this phenomenon was that air dielectric was present inside the prefabricated joint specimen due to joint action, the no-joint specimen discharged the internal air dielectric as much as possible by waterlogging, and the 100% transfixion degree specimen causes two parts of the cement mortar to carry a similar load at the same time due to the full transfixion of the joint and its destruction-free surface is the same.
With the cycle of the combined action of saturated water freezing and impact load, the bright spots inside the specimen gradually increase. From the perspective of the crack development state of the specimen, the joint specimen with a transfixion degree of 20~80% gradually expands along the tip of the prefabricated joint and finally penetrates, and the tensile failure dominates. With the increase of axial joint transfixion degree, the final failure mode of 0~40% transfixion joint specimens is a tensile-shear composite failure, the final failure mode of 60~100% transfixion joint specimens is split tensile failure.

6. Conclusions

Dynamic mechanical properties testing of water-filled frozen cement mortar specimens with the precast joints of different transfixion degrees (0%, 20%, 40%, 60%, 80%, 100%) by using a split Hopkinson pressure bar (SHPB) system assembled with axial and perimeter compression devices. The stress-strain curve, peak stress, peak strain, energy composition and absorption, destruction characteristics, and other dynamic mechanical properties of cement mortar were analyzed. Based on energy constitution theory, the energy density per unit time index (EVT) and porosity change rate were connected and revealed the action relationship between microscopic damage and energy dissipation of cement mortar specimens with different transfixion degrees of joint. The conclusions of the study were as follows.
(1) The dynamic compressive strength of cement mortar specimens with different transfixion degree joints was controlled by the effect of penetration and saturation freezing. Average dynamic compressive strength was reduced sequentially to transfixion degree of 20%, 40%, 0%, 60%, 80%, and 100%. With the increase of the joint transfixion degree, the peak stress of the specimens showed a significant linear downward trend. The average attenuation rate of peak strength of 20–100% axial transfixion joint specimens is 5.53 MPa.
(2) The cement mortar structure subjected to dynamic load should have better dynamic performance after the water-saturated freeze pre-conditioning process. The 80% transfixion degree joint specimen has the weakest ability to carry the impact load, and the 40% transfixion degree joint specimen has the strongest ability to carry the impact load. With the increase of joint transfixion degree, there was a similar trend relationship of first decreasing and then rising in both the average change of porosity and the change of EVT.
(3) Joint specimens with 20~80% transfixion degree gradually expanded along the precast joint tip and eventually formed a penetration crack. The final failure mode of the 0~40% transfixion degree joint specimens were pull-shear composite destruction. The final failure mode of 60~100% transfixion degree joint specimens were split and tensile failure.

Author Contributions

Conceptualization: S.B. and Z.X.; methodology: S.B., H.M. and D.W.; formal Analysis: S.B., L.G. and J.Z.; writing—original draft preparation: S.B.; writing—review and editing: S.B. All authors have read and agreed to the published version of the manuscript.

Funding

This work was carried out in the School of Mining Engineering, University of Science and Technology Liaoning, and supported by the Foundation of Liaoning Educational Committee of China (Grant No. LJKZ0282).

Institutional Review Board Statement

Not applicable.

Informed Consent Statement

Not applicable.

Data Availability Statement

The datasets generated and analyzed during the current study are available from the corresponding author upon reasonable request.

Acknowledgments

The authors would like to acknowledge Xin Liu and Xiahang Jiang for the help in the sample testing.

Conflicts of Interest

The authors declare no conflict of interest.

References

  1. Yang, Y.; Yang, R.S.; Wang, J.G. Simulation material experiment on dynamic mechanical properties of jointed rock affected by joint thickness. J. China Univ. Min. Technol. 2016, 45, 211–216+309. [Google Scholar]
  2. Liu, B.; Sun, Y.D.; Yuan, Y.F.; Liu, X.C.; Bai, X.T.; Fang, T.J. Strength characteristics of frozen sandstone with different water content and its strengthening mechanism. J. China Univ. Min. Technol. 2020, 49, 1085–1093+1127. [Google Scholar]
  3. Gong, F.Q.; Si, X.F.; Li, X.B.; Wang, S.H. Dynamic triaxial compression tests on sandstone at high strain rates and low confining pressures with split Hopkinson pressure bar. Int. J. Rock Mech. Min. Sci. 2019, 113, 211–219. [Google Scholar] [CrossRef]
  4. Shan, R.L.; Yang, H.; Guo, Z.M.; Liu, X.D.; Song, L.W. Experimental study of strength characters of saturated red sandstone on negative temperature under triaxial compression. Chin. J. Rock Mech. Eng. 2014, 33, 3657–3664. [Google Scholar]
  5. Chen, X.; Liao, Z.H.; Li, D.J. Experimental study of effects of joint inclination angle and connectivity rate on strength and deformation properties of rock masses under uniaxial compression. Chin. J. Rock Mech. Eng. 2011, 30, 781–789. [Google Scholar]
  6. Zhao, A.P.; Feng, C.; Guo, R.K.; Li, S.H.; Jia, J.J. Effect of joints on blasting and stress wave propagation. Chin. J. Rock Mech. Eng. 2018, 37, 2027–2036. [Google Scholar]
  7. Zou, C.J.; Wong, L.N.Y.; Loo, J.L.; Gan, B.S. Different mechanical and cracking behaviors of single-flawed brittle gypsum specimens under dynamic and quasi-static loadings. Eng. Geol. 2016, 201, 71–84. [Google Scholar] [CrossRef]
  8. Li, D.Y.; Liu, M.; Han, Z.Y.; Zhou, Z.L. Dynamic compressive mechanical properties of bedding sandstone with preexisting hole. J. China Coal Soc. 2019, 44, 1349–1358. [Google Scholar]
  9. Li, J.C.; Li, N.N.; Li, H.B.; Zhao, J. An SHPB test study on wave propagation across rock masses with different contact area ratios of joint. Int. J. Impact Eng. 2017, 105, 109–116. [Google Scholar] [CrossRef]
  10. Li, J.C.; Ma, G.W. Analysis of blast wave interaction with a rock joint. Rock Mech. Rock Eng. 2010, 43, 777–787. [Google Scholar] [CrossRef]
  11. Li, J.C.; Rong, L.F.; Li, H.B.; Hong, S.N. An SHPB test study on stress wave energy attenuation in jointed rock masses. Rock Mech. Rock Eng. 2019, 52, 403–420. [Google Scholar] [CrossRef]
  12. Liu, Q.S.; Huang, S.B.; Kang, Y.S.; Chui, X.Z. Advance and review on freezing-thawing damage of fractured rock. Chin. J. Rock Mech. Eng. 2015, 24, 452–471. [Google Scholar]
  13. Xi, J.M.; Yang, G.S.; Pang, L.; Lv, X.T.; Liu, F.L. Experimental study on basic mechanical behaviors of sandy mudstone under low freezing temperature. J. China Coal Soc. 2014, 39, 1262–1268. [Google Scholar]
  14. Xu, G.M.; Liu, Q.S.; Peng, W.W.; Chang, X.X. Experimental study on basic mechanical behaviors of rocks under low temperatures. Chin. J. Rock Mech. Eng. 2006, 25, 2502–2508. [Google Scholar]
  15. Shan, R.L.; Zhang, L.; Yang, H.; Zhang, J.X.; Guo, Z.M. Experimental study of freeze-thaw properties of saturated red sandstone. J. China Univ. Min. Technol. 2016, 45, 923–929. [Google Scholar]
  16. Yang, Y.; Li, X.L.; Yang, R.S.; Wang, J.G. Study on Fractal Characteristics and Fracture Mechanism of Frozen Rocks. J. Trans. Beijing Inst. Technol. 2020, 40, 632–639+682. [Google Scholar]
  17. Lv, N.; Wang, H.B.; Zong, Q.; Wang, M.X.; Cheng, B. Dynamic Tensile Properties and Energy Dissipation of High-Strength Concrete after Exposure to Elevated Temperatures. Materials 2020, 13, 5313. [Google Scholar] [CrossRef]
  18. Li, Y.; Zhai, Y.; Liu, X.Y.; Liang, W.B. Research on Fractal Characteristics and Energy Dissipation of Concrete Suffered Freeze-Thaw Cycle Action and Impact Loading. Materials 2019, 12, 2585. [Google Scholar] [CrossRef] [Green Version]
  19. Huang, Z.Y.; Sui, L.L.; Wang, F.; Du, S.L.; Zhou, Y.W.; Ye, J.Q. Dynamic compressive behavior of a novel ultra-lightweight cement composite incorporated with rubber powder. Compos. Struct. 2020, 244, 112300. [Google Scholar] [CrossRef]
  20. Ping, Q.; Wu, M.J.; Yuan, P.; Zhang, H. Experimental study on dynamic mechanical properties of high temperature sandstone under impact loads. Chin. J. Rock Mech. Eng. 2019, 38, 782–792. [Google Scholar]
  21. Zuo, J.P.; Xie, H.P.; Zhou, H.W.; Fang, Y.; Fan, X. Fractography of sandstone failure under temperature-tensile stress coupling effects. Chin. J. Rock Mech. Eng. 2007, 26, 2444–2457. [Google Scholar]
  22. Liu, M.X.; Liu, E.L. Dynamic mechanical properties of artificial jointed rock samples subjected to cyclic triaxial loading. Int. J. Rock Mech. Min. Sci. 2017, 98, 54–66. [Google Scholar] [CrossRef]
  23. Abrams, D.A. Effect of rate of application of load on the compressive strength of concrete. Am. Soc. Test Mater. J. 1917, 17, 364–377. [Google Scholar]
  24. Li, W.G.; Luo, Z.Y.; Wu, C.Q.; Duan, W.H. Impact performances of steel tube-confined recycled aggregate concrete (STCRAC) after exposure to elevated temperatures. Cem. Concr. Compos. 2018, 86, 87–97. [Google Scholar] [CrossRef]
  25. Chen, L.J.; Zhang, X.X.; Liu, G.M. Analysis of dynamic mechanical properties of sprayed fiber-reinforced concrete based on the energy conversion principle. Constr. Build. Mater. 2020, 254, 119167. [Google Scholar] [CrossRef]
  26. Cai, H.D.; Yuan, B.; Yang, F.; Chen, L.; Feng, W.H.; Liang, Y.W. Dynamic three-point flexural performance of unsaturated polyester polymer concrete at different curing ages. J. Build. Eng. 2022, 45, 103449. [Google Scholar] [CrossRef]
  27. Wang, L.; Su, H.M.; Qin, Y.; Chen, S.G. Study on Dynamic Constitutive Model of Weakly Consolidated Soft Rock in Western China. Shock. Vib. 2020, S2, 1–13. [Google Scholar] [CrossRef]
  28. Chang, S.; Xu, J.Y.; Bai, E.L.; Zhen, G.H.; Lv, X.C. Static and dynamic mechanical properties and deterioration of bedding sandstone subjected to freeze-thaw cycles: Considering bedding structure effect. Sci. Rep. 2020, 10, 12790. [Google Scholar] [CrossRef]
  29. Lv, T.H.; Chen, X.W.; Chen, G. The 3D meso-scale model and numerical tests of split Hopkinson pressure bar of concrete specimen. Constr. Build. Mater. 2018, 160, 744–764. [Google Scholar] [CrossRef]
  30. Zhang, F.L.; Zhu, Z.W.; Fu, T.T.; Jia, J.X. Damage mechanism and dynamic constitutive model of frozen soil under uniaxial impact loading. Mech. Mater. 2020, 140, 103217.1–103217.12. [Google Scholar] [CrossRef]
  31. Li, Y.; Zhai, Y.; Liang, W.B.; Li, Y.B.; Dong, Q.; Meng, F.D. Dynamic Mechanical Properties and Visco-Elastic Damage Constitutive Model of Freeze-Thawed Concrete. Materials 2020, 13, 4056. [Google Scholar] [CrossRef] [PubMed]
  32. Pan, B.; Wang, X.G.; Xu, Z.Y.; Guo, L.J.; Li, X.S. Research on the effect of joint angle on the dynamic response of rock materials. Chin. J. Rock Mech. Eng. 2021, 40, 566–575. [Google Scholar]
  33. Pan, B.; Wang, X.G.; Xu, Z.Y.; Guo, L.J.; Wang, X.S. Experimental and Numerical Study of Fracture Behavior of Rock-Like Material Specimens with Single Pre-Set Joint under Dynamic Loading. Materials 2021, 14, 2690. [Google Scholar] [CrossRef] [PubMed]
  34. Zhao, G.Y.; Li, Z.Y.; Wu, H.; Wang, E.J.; Liu, L.L. Dynamic failure characteristics of sandstone with non-penetrating cracks. Rock Soil Mech. 2019, 40, 73–81. [Google Scholar]
  35. Li, X. Rock Dynamics: Fundamentals and Applications; Science Press: Beijing, China, 2014; pp. 258–287. [Google Scholar]
  36. Li, X.S. Study on the Effect of Joint Characteristics on Impact Crushing Effect of Rock; University of Science and Technology Liaoning: Anshan, China, 2020. (In Chinese) [Google Scholar]
  37. Wang, M.; Wang, H.; Zong, Q. Experimental study on energy dissipation of mudstone in coal mine under impact loading. J. China Coal Soc. 2019, 44, 1716–1725. [Google Scholar]
  38. Li, J.L.; Zhu, L.Y.; Zhou, K.P.; Liu, H.W.; Cao, S.P. Damage characteristics of sandstone pore structure under freeze-thaw cycles. Rock Soil Mech. 2019, 40, 3524–3532. [Google Scholar]
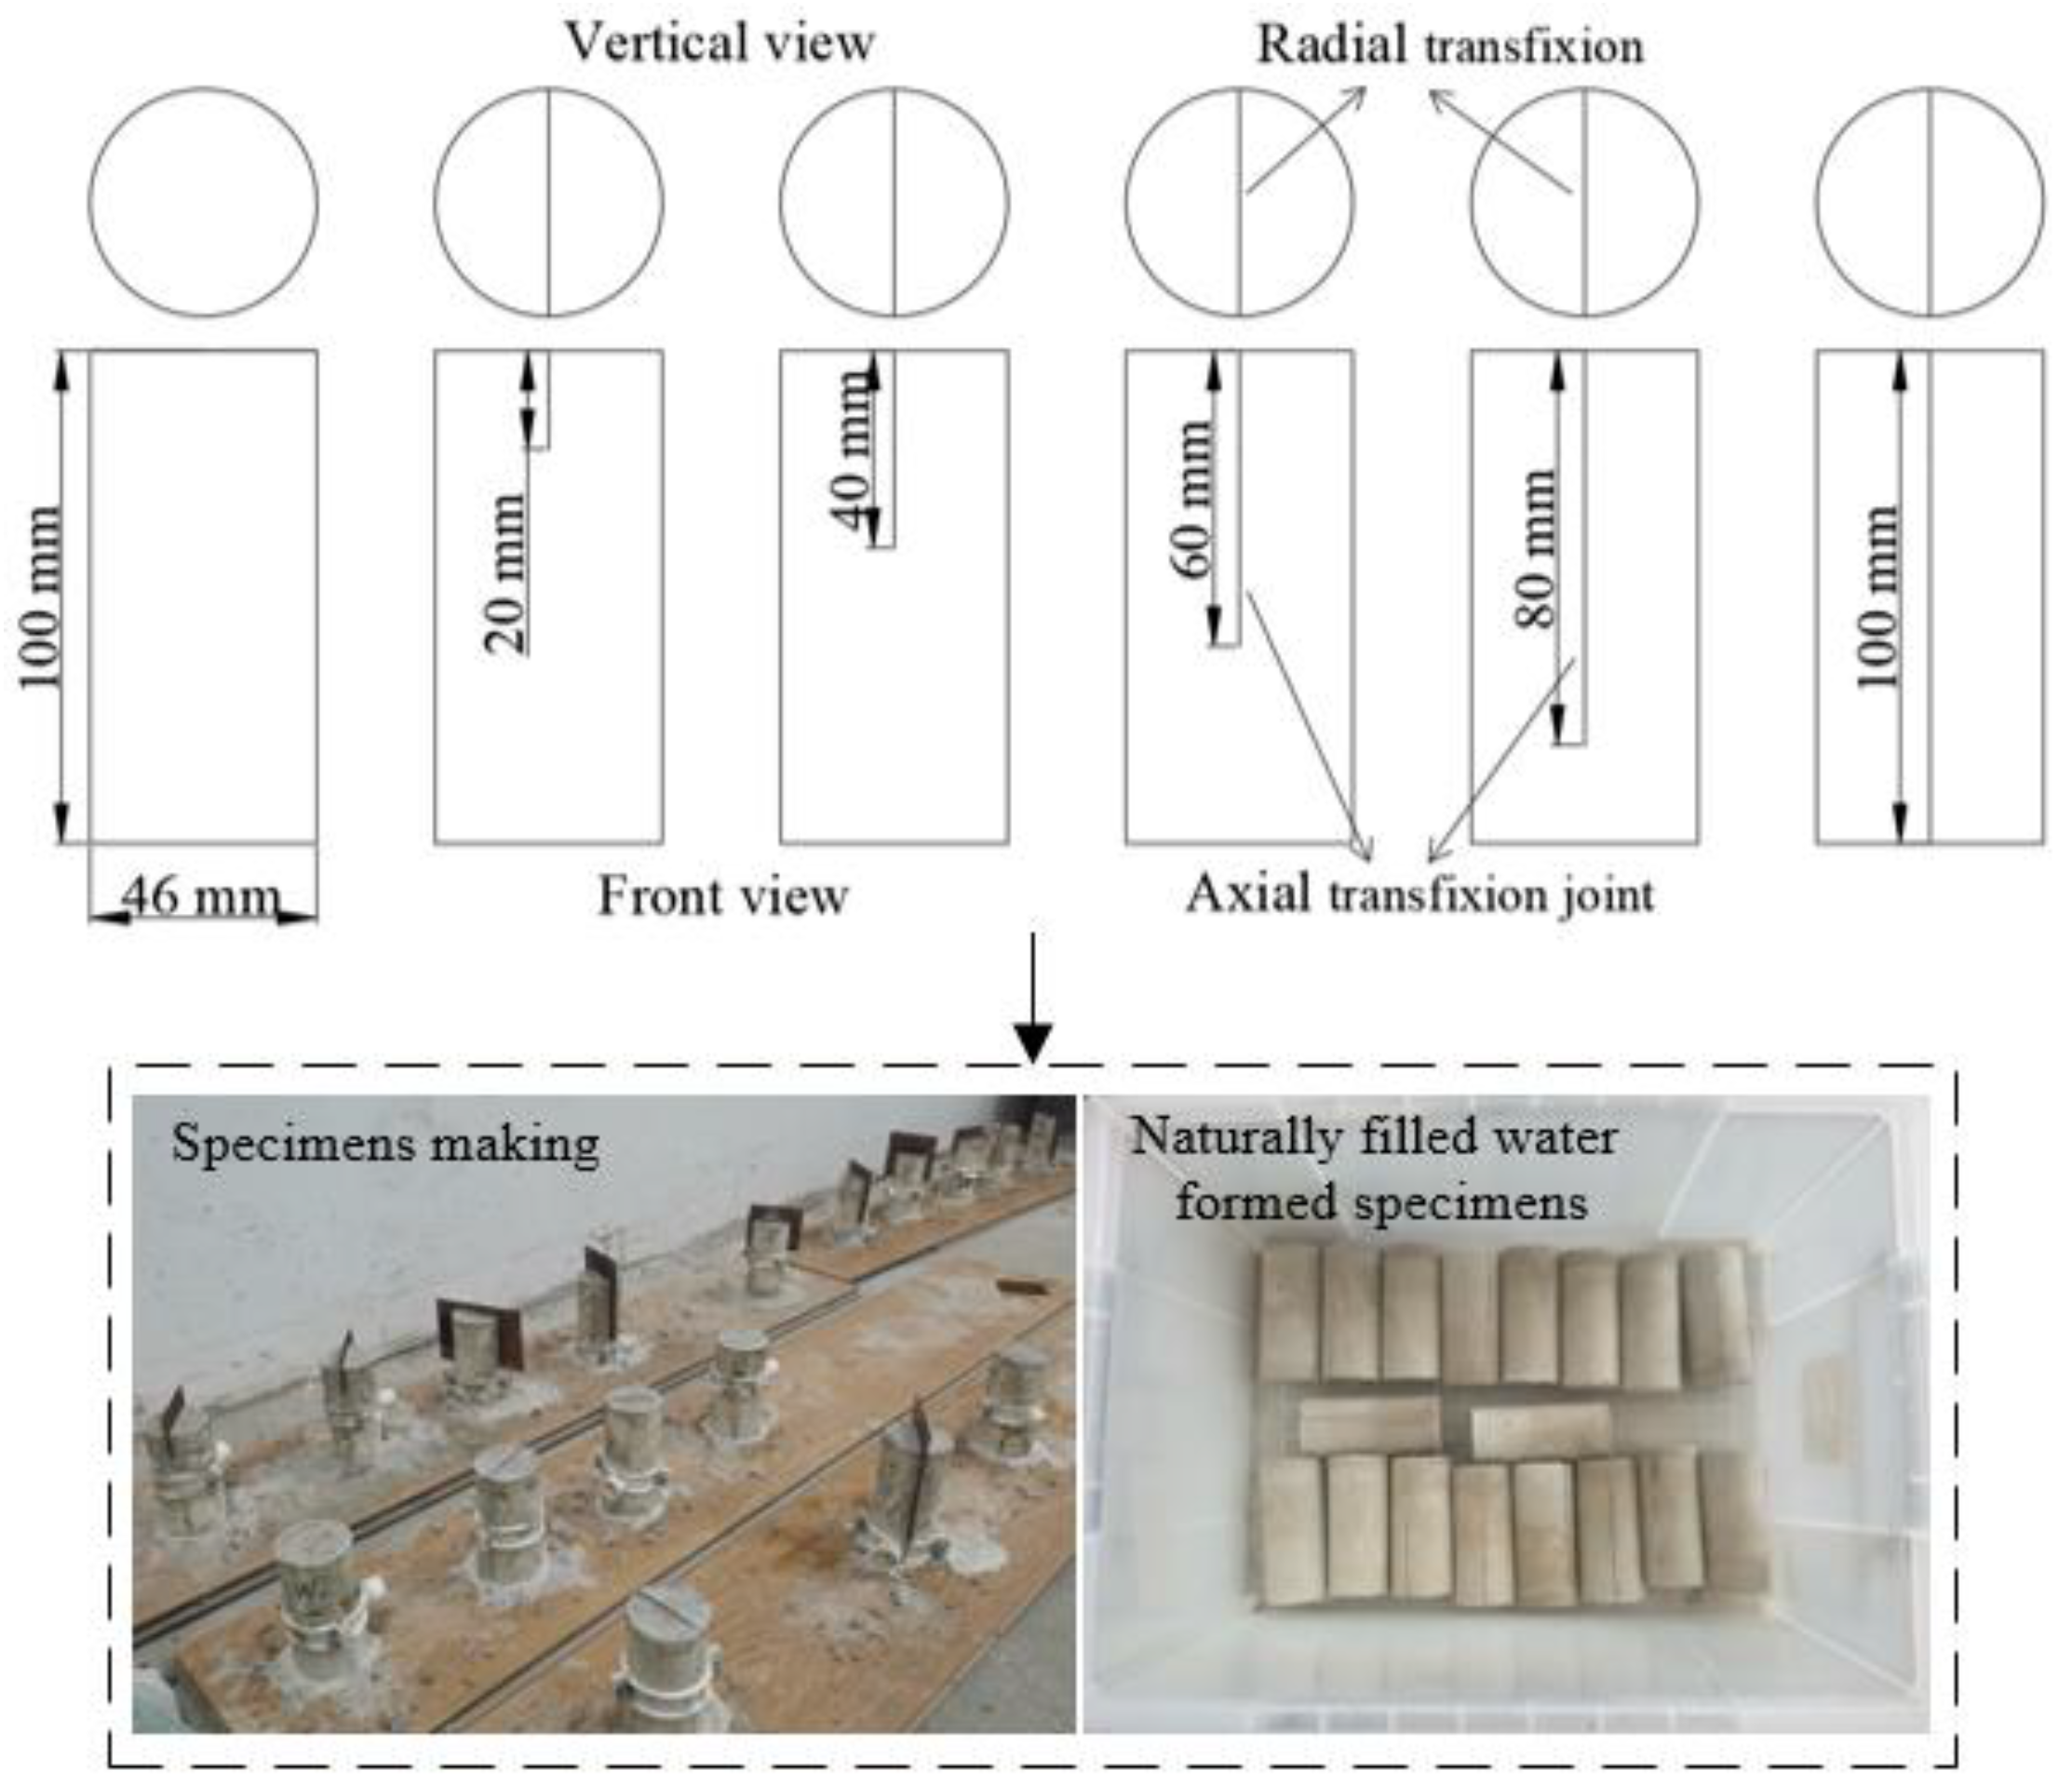
Figure 1. Specimen design and formed cement mortar samples.
Applsci 12 04396 g001
Figure 2. Experimental device: (a) SHPB device, (b) ZYB-Ⅱ vacuum device, (c) NMR system.
Applsci 12 04396 g002
Figure 3. Test stress-strain curves for different transfixion joint specimens: (a) 0%, (b) 20%, (c) 40%, (d) 60%, (e) 80%, and (f) 100%.
Applsci 12 04396 g003aApplsci 12 04396 g003b
Figure 4. Curve of the relationship between peak stress and number of cycles.
Applsci 12 04396 g004
Figure 5. Curve of the relationship between peak strain and number of cycles.
Applsci 12 04396 g005
Figure 6. Energy proportion of different transfixion degree joint specimens.
Applsci 12 04396 g006
Figure 7. The relationship curve between energy density per unit time and pore change of the specimen.
Applsci 12 04396 g007
Figure 8. Test pore-size distribution curves for different transfixion joint specimens: (a) 0%, (b) 20%, (c) 40%, (d) 60%, (e) 80%, (f) 100%.
Applsci 12 04396 g008aApplsci 12 04396 g008b
Figure 9. MRI and failure morphology of different transfixion joint specimens: (a) 0%, (b) 20%, (c) 40%, (d) 60%, (e) 80%, (f) 100%. Specimen destruction pattern diagram: the green lines are prefabricated, the red lines are tensile cracks or shear cracks formed by the impact test, and inside the white ring are the specimens shedding parts or large pores.
Applsci 12 04396 g009aApplsci 12 04396 g009b
Table 1. Energy composition data of different transfixion degree joint specimens.
GroupEIERETEDER/EIET/EIED/EI
MeasuredAverageMeasuredAverageMeasuredAverage
0%124.3428.9760.7934.580.23300.18130.48890.40400.27810.4147
123.0731.6151.9039.560.25690.42170.3214
102.7121.5439.6041.570.20970.38560.4047
75.0416.1625.7533.120.21540.34320.4414
103.4312.2733.4857.680.11860.32370.5577
111.616.0751.4554.090.05440.46100.4846
20%82.7813.1435.1634.470.15880.19550.42480.43750.41650.3670
96.9228.3839.8128.730.29280.41070.2964
166.4434.7874.6157.040.20900.44830.3427
139.5235.4255.5848.510.25390.39840.3477
89.015.6244.9638.430.06320.50510.4317
40%83.5823.4235.6624.490.28030.24960.42670.40540.29310.3450
101.9210.6039.8551.470.10400.39100.5050
85.7625.2636.5523.940.29460.42620.2792
86.2524.5739.3422.340.28490.45610.2590
106.3732.9943.0030.380.31010.40420.2856
101.2133.5142.7924.910.33110.42270.2462
99.5929.3031.5238.770.29420.31650.3893
125.7035.7645.1944.750.28450.35950.3560
111.1329.8038.3642.960.26820.34520.3866
90.804.0045.8940.920.04410.50540.4506
60%105.7916.4158.8030.580.15510.16810.55580.43800.28910.3940
139.1925.8662.1251.200.18580.44630.3679
166.5229.8575.1461.530.17920.45120.3695
84.3519.0736.0129.270.22610.42690.3470
81.8716.6640.7424.480.20350.49760.2990
114.6917.3939.1258.170.15170.34110.5072
103.2018.6732.5951.940.18090.31580.5032
86.165.3440.4040.420.06200.46890.4691
80%94.0516.5147.0930.460.17550.17560.50070.43470.32380.3897
111.0716.2345.3349.500.14610.40810.4457
68.1814.0825.6528.450.20660.37620.4173
50.868.8523.0918.920.17400.45400.3720
100%120.4412.4467.1640.840.10330.10590.55760.46470.33910.4294
87.0017.8442.7826.380.20510.49170.3032
103.8413.6238.7251.500.13120.37290.4960
113.0611.2841.7460.040.09980.36920.5310
111.097.4249.4754.200.06680.44530.4879
107.143.1459.0744.930.02930.55130.4194
Table 2. EVT and pore change data of different transfixion degree joint specimens.
GroupVS (cm3)TR (ms)EVT
(J·cm−3·ms−1)
E ¯ VT
(J·cm−3·ms−1)
K (%)K′ (%) Δ K   ( % )
0%164.390.2970.69930.906010.347310.40210.0548
0.2720.873610.03700.3651
0.2750.907912.30472.2677
0.2910.6836
0.2961.1704
0.3151.031414.33922.0345
20%167.480.2950.69770.89089.74319.31510.4280
0.2590.66239.75630.4412
0.2781.225112.46832.7120
0.2541.1403
0.3150.7284
40%166.310.2920.50430.713510.175710.02030.1554
0.2681.15489.81340.2069
0.2840.506910.68960.8762
0.2660.5050
0.2570.7108
0.2810.533013.00032.3107
0.2860.8151
0.2880.9343
0.3630.7116
0.3240.7594
60%168.540.2900.62570.86409.681610.98541.3038
0.2651.146411.36180.3764
0.2751.327612.41311.0513
0.2910.5968
0.2990.4858
0.3181.085313.56351.1504
0.3130.9846
0.3650.6571
80%165.580.2750.66890.677910.804310.76450.0398
0.2911.027311.15500.3905
0.2850.602912.48711.3321
0.2770.4125
100%167.830.3080.79010.926811.353311.68430.3310
0.2830.555412.37100.6867
0.2821.088114.10131.7303
0.2911.2294
0.2921.1060
0.3380.792015.89651.7952
Table 3. Peak pore sizes of different pore types and their proportions of joint specimens with different transfixion degrees.
GroupPore TypePeak Aperture /μm (Percentage/%)
0%Small pore0.00911 (0.2726)0.00911 (0.275)0.00911 (0.2618)0.00911 (0.2824)0.00911 (0.2886)
medium pore0.31406 (0.0204)0.33664 (0.0225)0.33664 (0.0265)0.33664 (0.0439)0.36084 (0.0558)
Large pore9.42751 (0.0135)10.10526 (0.0172)10.10526 (0.0156)10.10526 (0.0385)10.10526 (0.0783)
20%Small pore0.00911 (0.2491)0.00792 (0.2309)0.00911 (0.2343)0.00911 (0.2584)-
medium pore0.36084 (0.0222)0.36084 (0.0332)0.36084 (0.0407)0.36084 (0.0569)-
Large pore11.61045 (0.0195)9.42751 (0.0185)9.42751 (0.0219)10.10526 (0.0592)-
40%Small pore0.00911 (0.2582)0.00911 (0.2511)0.00911 (0.2424)0.00911 (0.2510)0.00911 (0.2523)
medium pore0.33664 (0.0239)0.33664 (0.0292)0.33664 (0.0319)0.33664 (0.0359)0.33664 (0.0525)
Large pore10.10526 (0.0182)10.10526 (0.0197)9.42751 (0.0228)10.10526 (0.0306)11.61045 (0.0592)
60%Small pore0.00911 (0.2699)0.00911 (0.2675)0.00911 (0.2669)0.00911 (0.2755)0.00911 (0.275)
medium pore0.36084 (0.024)0.36084 (0.0306)0.36084 (0.035)0.36084 (0.0407)0.36084 (0.0544)
Large pore10.10526 (0.0188)10.10526 (0.0248)10.10526 (0.0317)10.10526 (0.0415)10.10526 (0.0648)
80%Small pore0.00911 (0.2711)0.00911 (0.2659)0.00911 (0.2483)0.00911 (0.2698)-
medium pore0.36084 (0.0231)0.36084 (0.0313)0.36084 (0.0315)0.36084 (0.0386)-
Large pore10.83174 (0.0197)10.83174 (0.0283)10.10526 (0.0376)10.83174 (0.0651)-
100%Small pore0.01046 (0.2748)0.01046 (0.2775)0.01046 (0.2847)0.01046 (0.2941)0.01046 (0.2933)
medium pore0.38678 (0.0225)0.38678 (0.0284)0.38678 (0.0367)0.38678 (0.0516)0.41458 (0.0659)
Large pore11.61045 (0.0253)11.61045 (0.0295)11.61045 (0.0391)12.44514 (0.0531)11.61045 (0.1023)
Publisher’s Note: MDPI stays neutral with regard to jurisdictional claims in published maps and institutional affiliations.