The robot model is described, and the kinematics constraints are analyzed to improve the robot design based on the Taguchi method. We defined the control parameters and the noise factors to obtain the sensitivity analysis. Then, we can find the optimal values of the design parameter. We also consider the kinematic constraints such as maximum height and minimum step that the robot can climb up or down to ensure that the parameters selected based on the Taguchi method are appropriate.
2.1. Robot Design and Kinematics Constraints
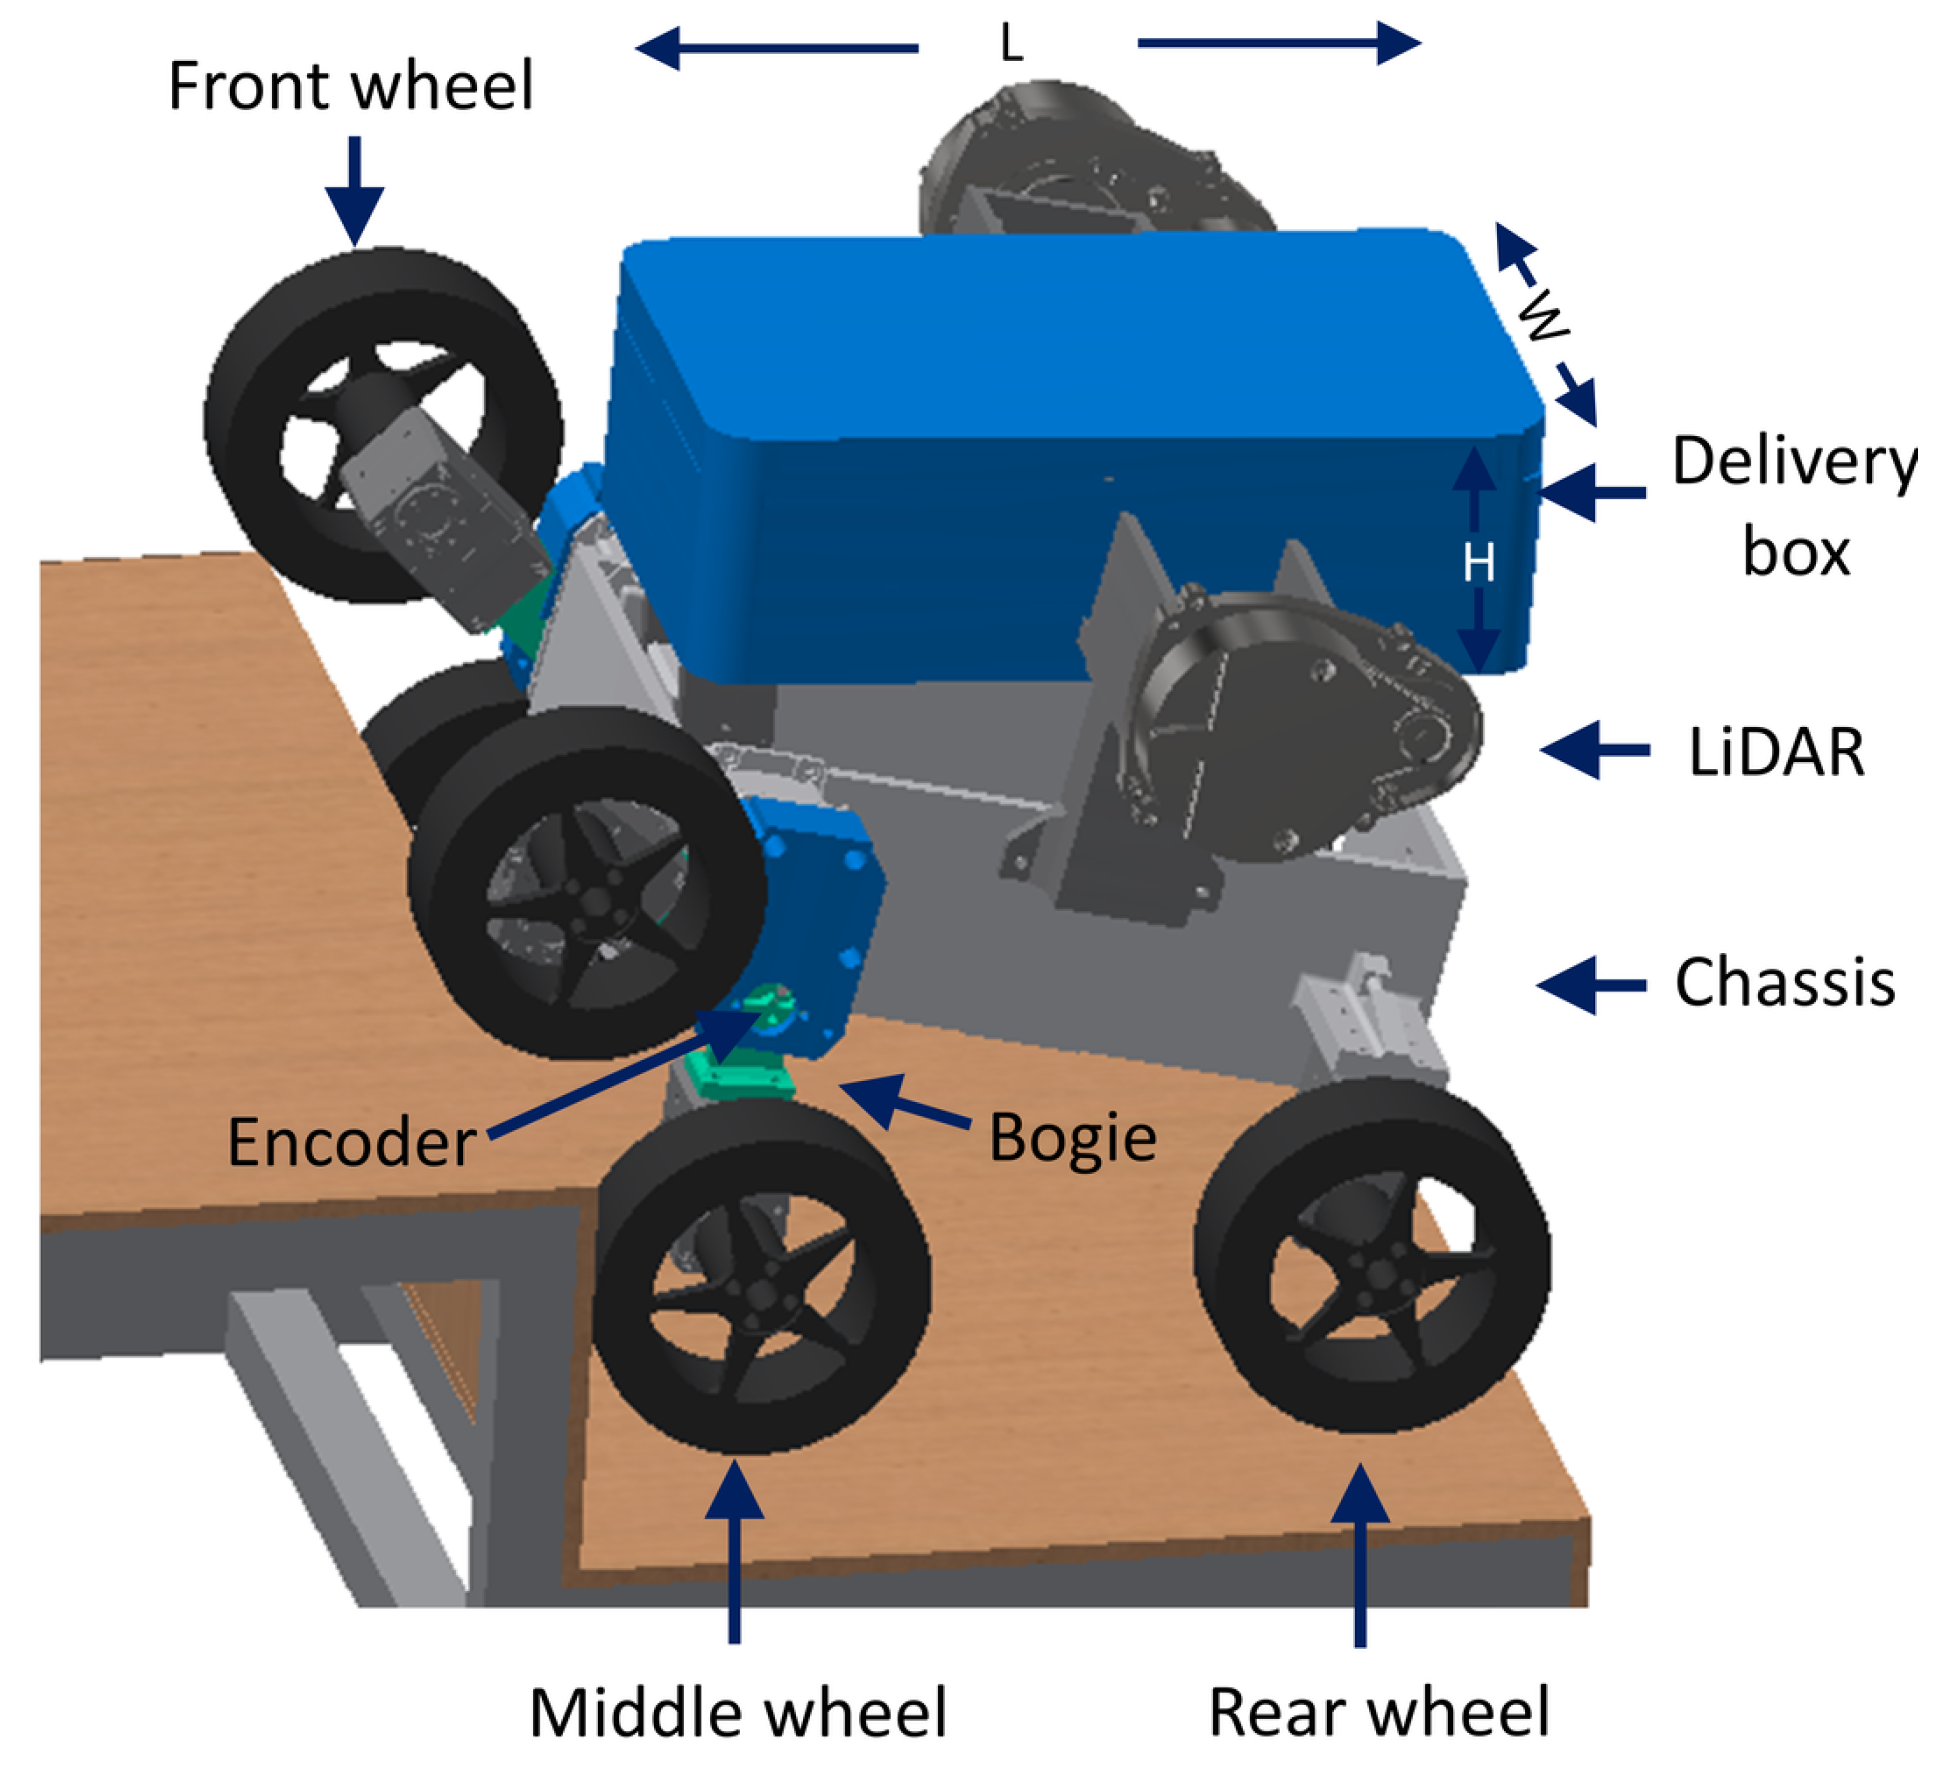
The mobile robot design comprises a chassis, a box for the delivery package, and six wheels individually controlled by each actuator, as shown in
Figure 1. The front wheel
and the middle wheel
are attached to a passive rotation joint that denotes by bogie and Link 1, which has a triangle shape formed by
,
, and
parameters, where
is the distance between the center of the front wheel and the center of the bogie.
is the distance between the center of the middle wheel and the center of the bogie.
is the distance between the front and middle wheel. The rear wheel
is connected to the chassis forming an imaginary link between the center of the wheel and the bogie’s center called Link 2 and
parameter.
The center of mass of delivery package is assumed fixed above Link 1. It remains stable because the delivery box rotates and has a horizontal position with respect to the ground during the robot’s motion. is the distance between the bogie and the center of mass. is the distance between the chassis and the LiDAR.
The sensors installed are encoders in each bogie to obtain the rotation measurement of the passive joint. The LiDAR sensor on each side of the robot to measure the contact angle between the wheel–ground and detect when the wheel loses contact with the ground. IMU in the chassis to obtain the rotation and the robot’s velocity. The dimensions and parameters of the robot are detailed in
Table 1 and
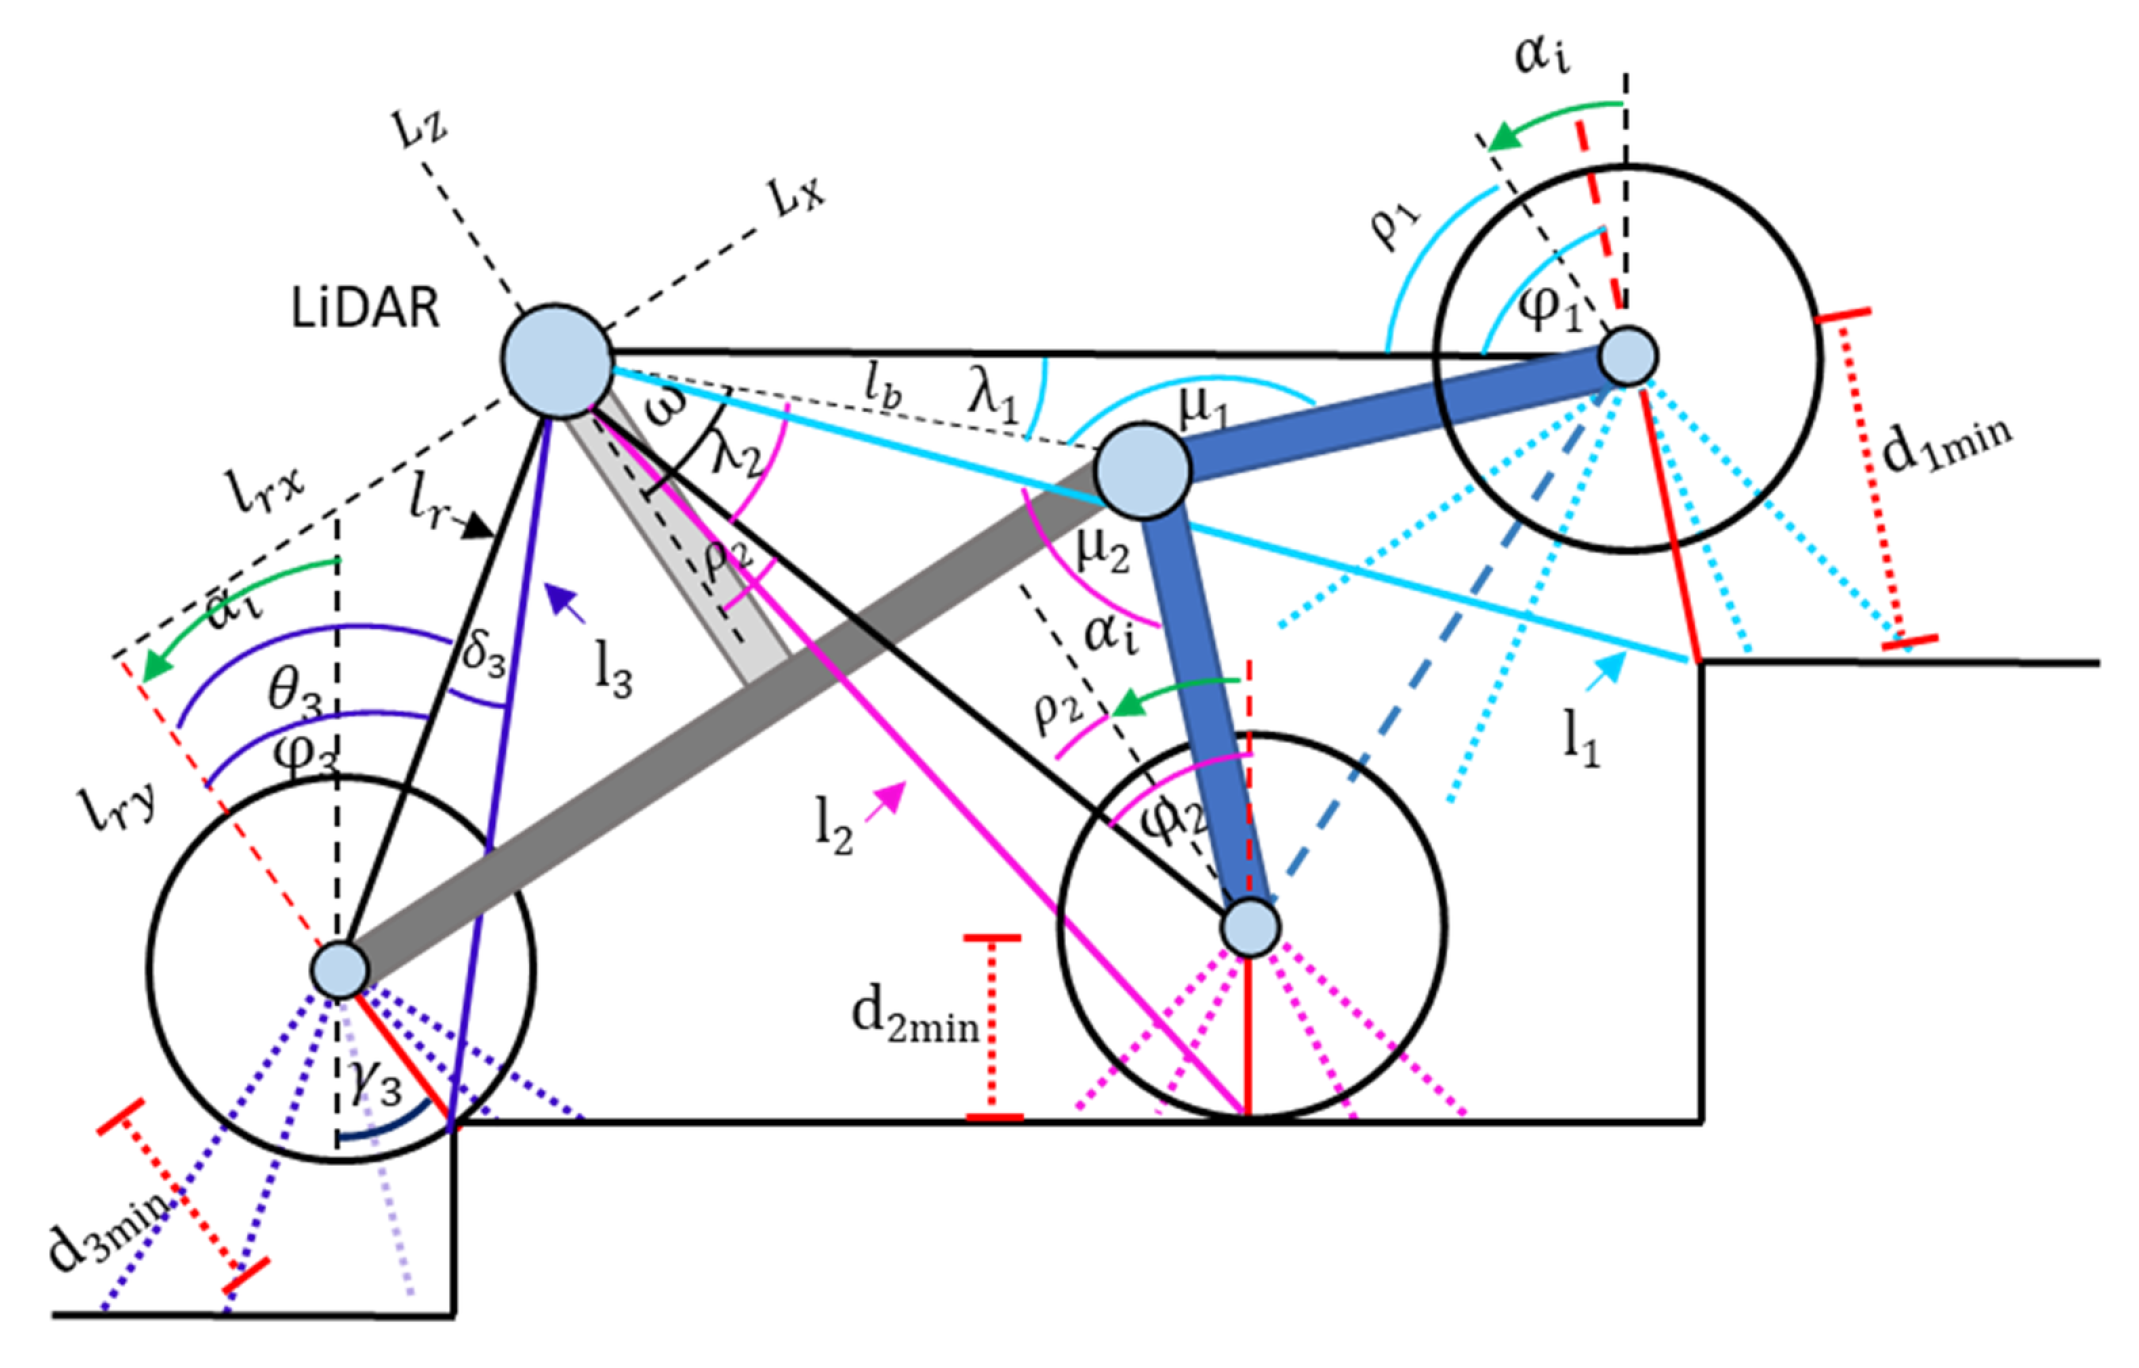
Figure 2 shows the schematic diagram of the 2D model.
The kinematic constraints of the wheeled robot are analyzed based on the parameters and the links of the robot.
Figure 2 shows the nine parameters of the robot, including the radius of the wheels, the center of mass, and the position of the LiDAR. Equation (
1) details the restrictions based on the geometric relationships to prevent collision between the links and the wheels, as well as the LiDAR position according to its specifications defined as follows:
- 1.
Parameters , , and form Link 1. The constraints are based on keeping the link as a triangle shape to improve the robot’s stability when climbing and descending stairs.
- 2.
The radius of the wheels , , and must be smaller than the parameters , , and , respectively, to avoid collisions between the wheels and parameters.
- 3.
The sum of and must be greater than to avoid collisions between the front and middle wheel, and , respectively.
- 4.
The difference between and must be greater than the sum of and to avoid collisions between the middle and rear wheels, and respectively, when the robot climbs or descends stairs.
- 5.
The distance between the LiDAR position to the ground must be greater than 120 mm to ensure the accuracy of the contact angle results. According to the datasheet of LDS-01 from (120–499) mm, the accuracy of the distance is mm.
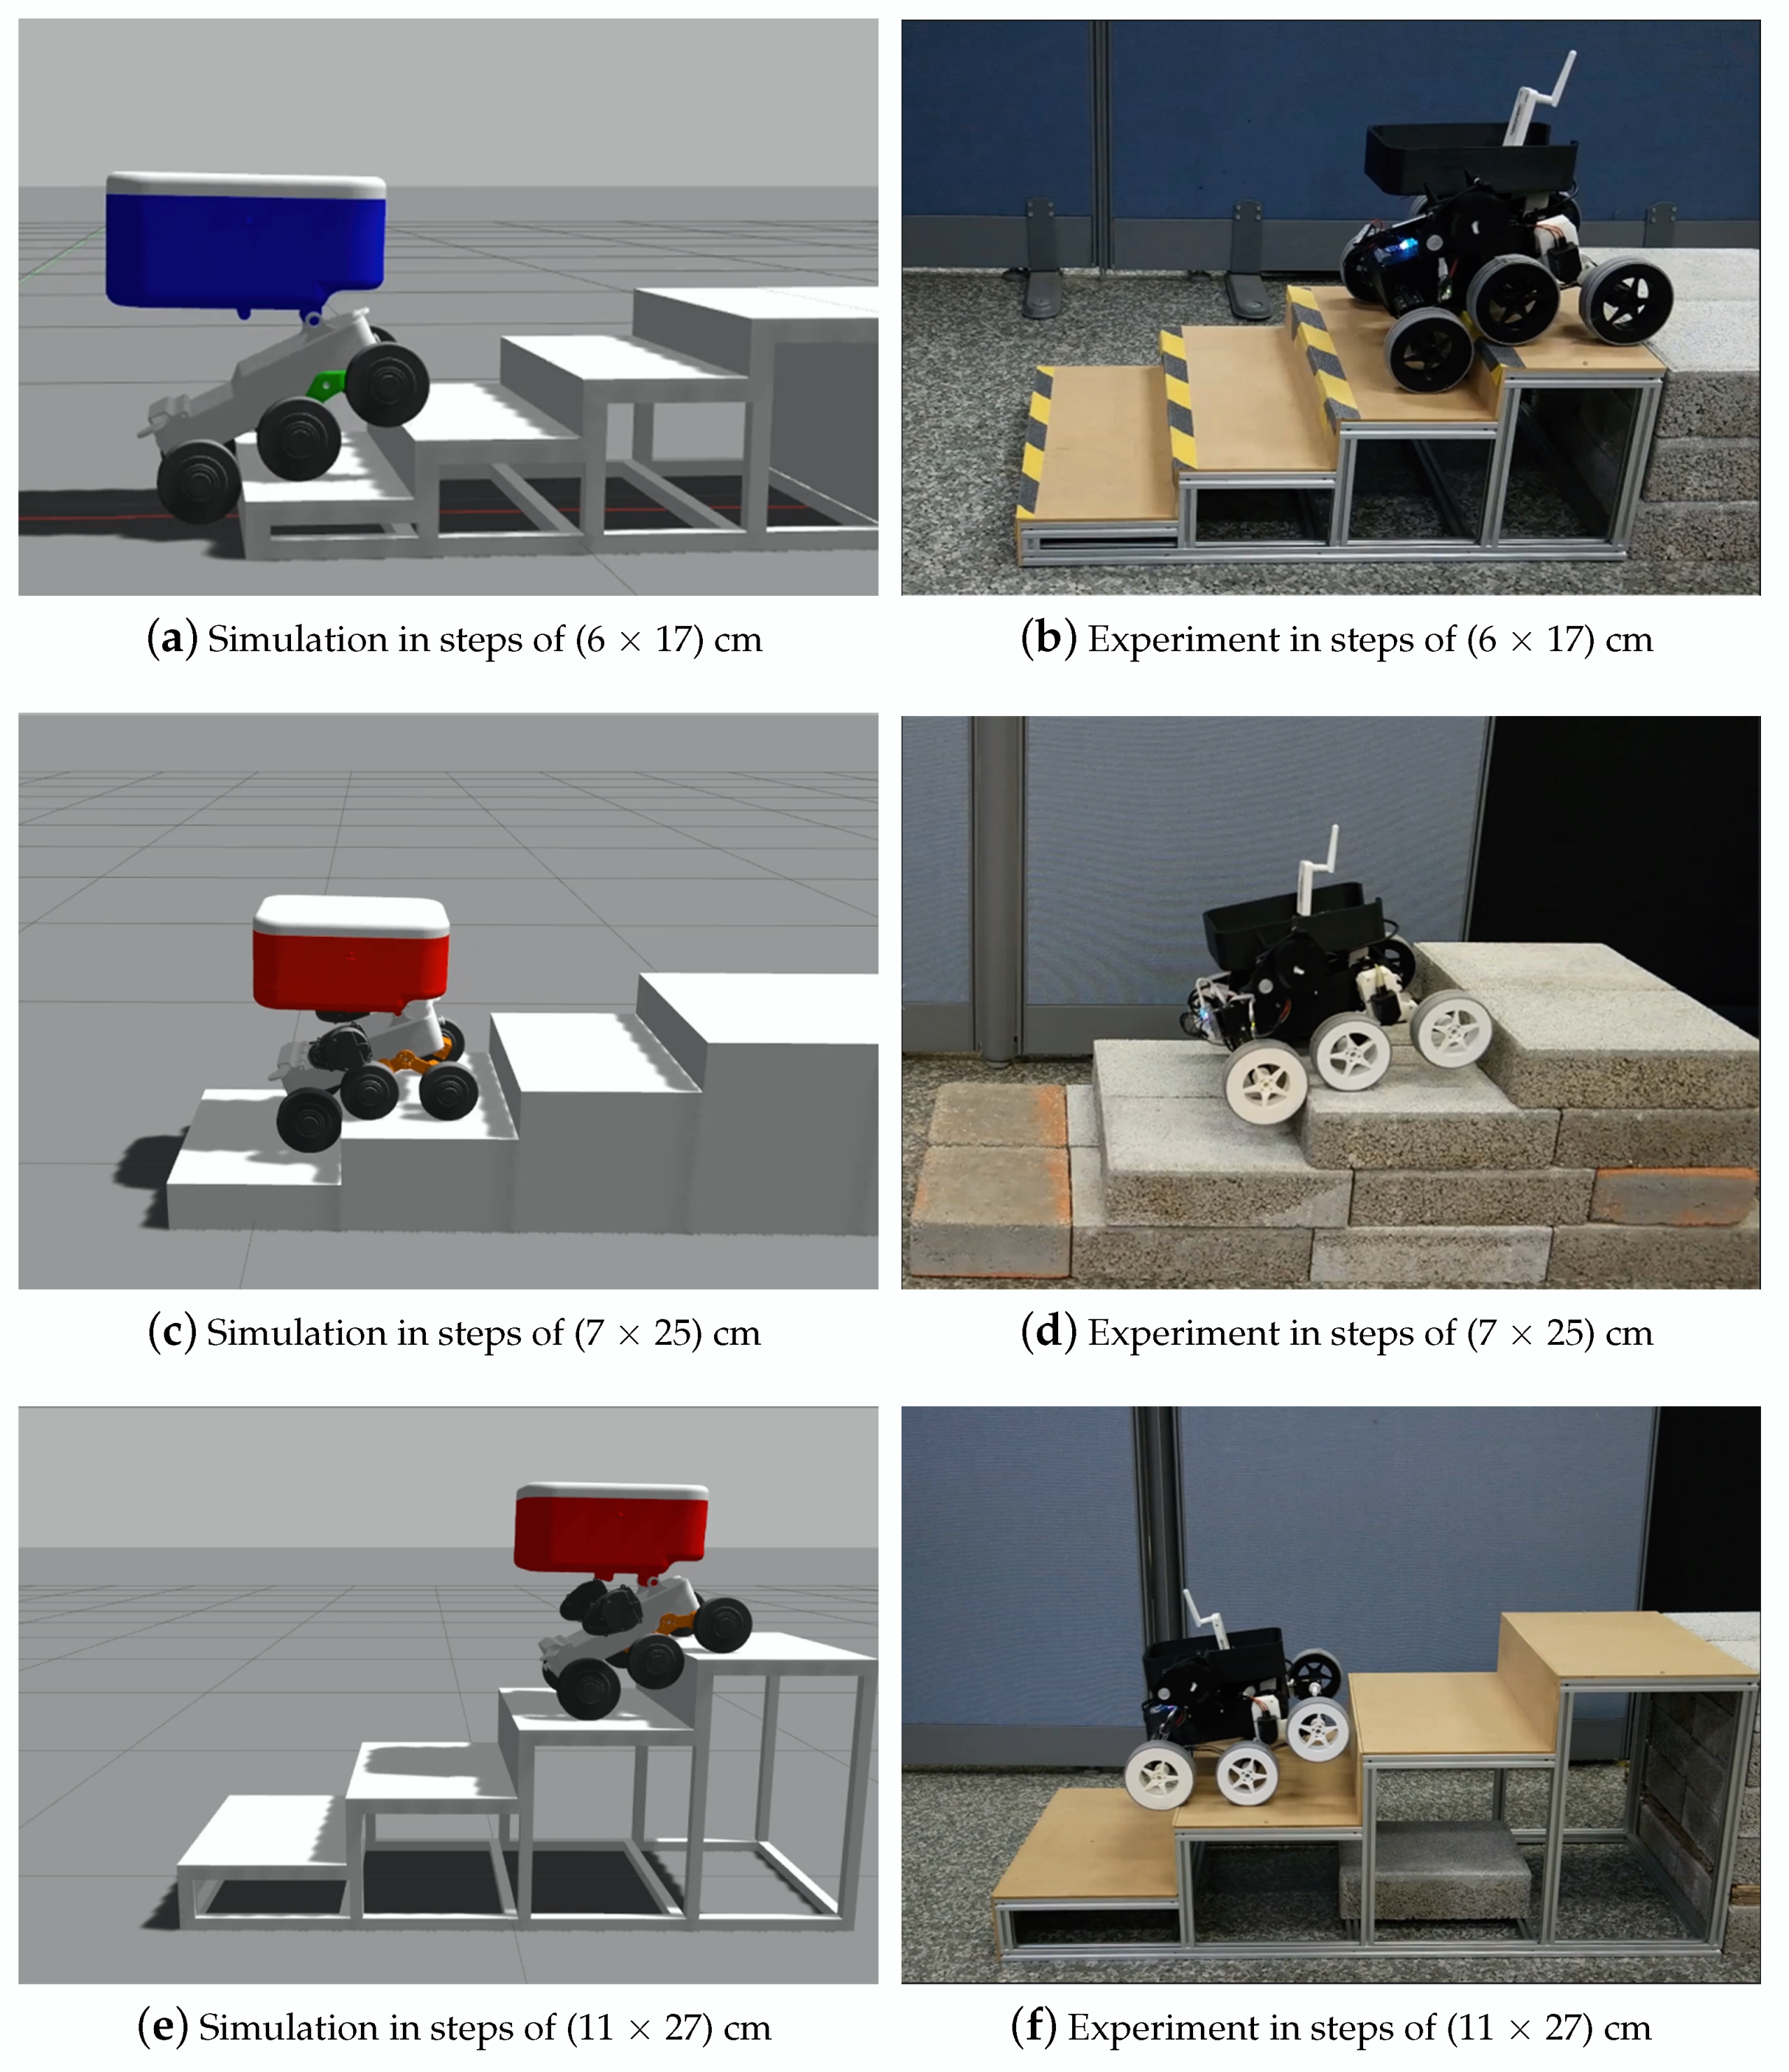
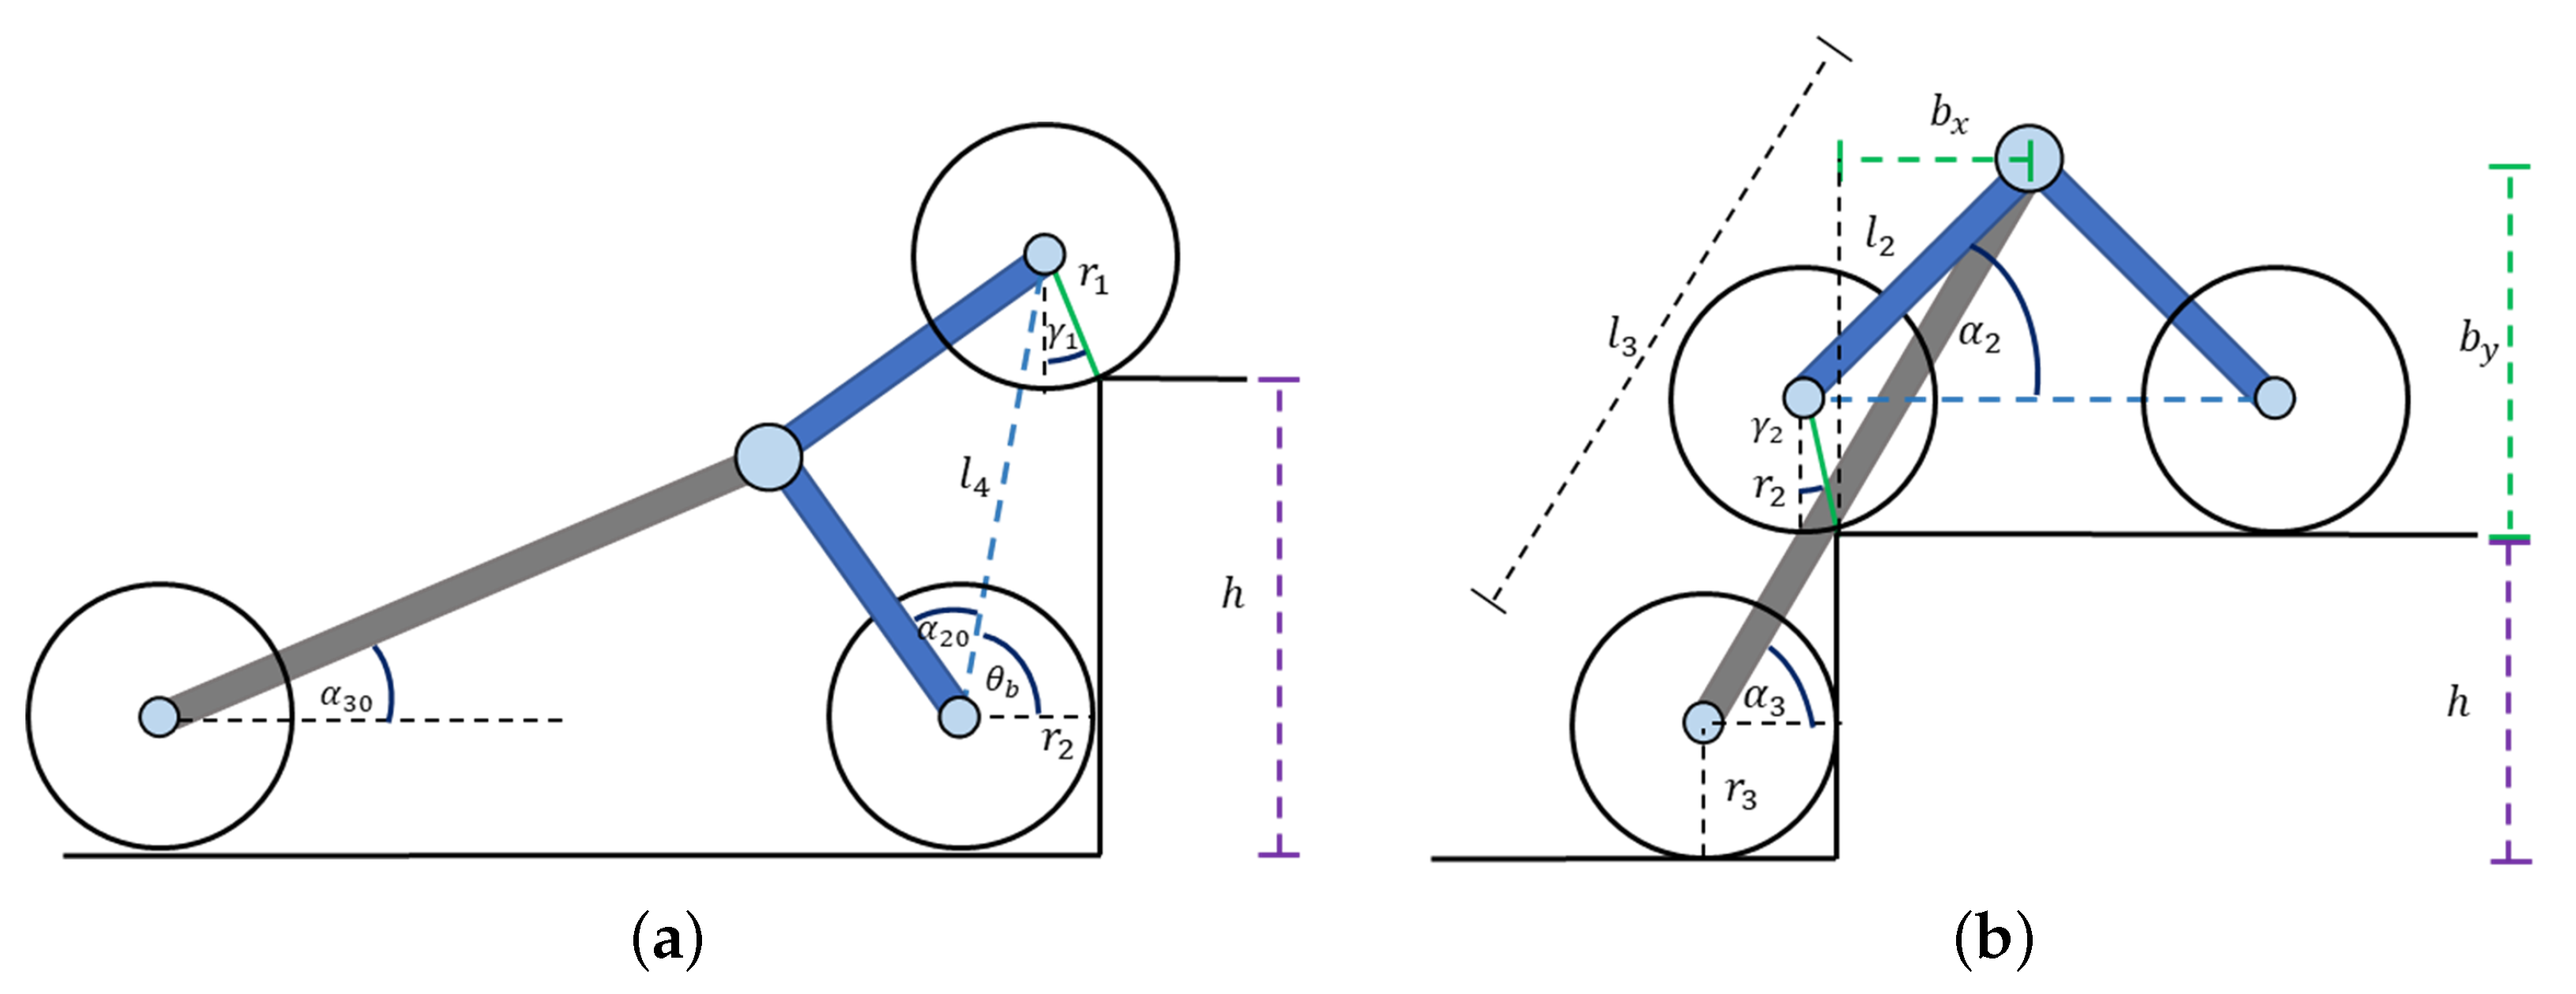
One of the conditions for the robot to be autonomous is recognizing the obstacles in front of it and determining if they can be scaled; otherwise, the robot must take another path. It is expected that the wheels maintain contact with the ground to avoid falls. However, in reality, the wheels can lose contact; therefore, they lose their stability and fall. To ensure the robot can climb, we calculate the maximum height and the minimum length of the step that the robot can climb up and down an obstacle or step as shown in
Figure 3. The maximum height can vary according to the size of the robot. Five different maximum height steps are obtained based on the constraints and parameters of the robot Equation (
2), where
is the contact angle between each wheel and the ground,
denotes the angle between
and
,
denotes the angle between
and the horizontal global axis,
denotes the maximum bogie rotation,
denotes the initial angle between
and the horizontal global axis when the robot is in a flat surface, and
denotes the angle between
and the horizontal that varies with the tilt of the chassis.
denotes the horizontal distance between the center of the bogie and the contact point of the middle wheel, and
denotes the vertical distance from the center of the bogie to the contact point of the middle wheel.
The maximum height the robot can climb up or down an obstacle is determined by Equation (
3) after obtaining the maximum heights for each constraint.
prevents the front and middle wheel from climbing up or down together, as shown in
Figure 3a. The middel wheel maintains contact with the ground before starting to climb, and the front wheel must maintain a contact angle fewer than 65 degrees, based on experiments.
is the maximum rotation of the bogie in the counterclockwise direction
Figure 3a.
is the maximum rotation of the bogie in a clockwise direction
Figure 3b.
Similar to
,
restricts the middle and rear wheels from climbing up or down simultaneously
Figure 3b.
is the maximum height step according to the maximum inclination of the chassis to avoid falls, obtained from
Figure 3b.
The minimum length of the step required to climb up or down depends on the step height
h, which must be less than
Equation (
3). The first case is when
h is equal to
, the minimum length of the step when the robot climbs up is the length of
plus
,
, and the horizontal distance between the middle and rear-wheel contact point. However, when the robot climbs down with
, the minimum step length required is the total length of the robot. The second case occurs when the front and middle wheel maintain contact with the tread or the middle and rear wheel maintain contact with the tread. Then we include a parameter
d, which is the distance between the middle wheel and the step. If the parameter
d is greater than zero, there is a space between the middle wheel and the step. Furthermore
h is less than
and we can obtained
and
.
denotes the horizontal distance between the front and middle wheel in contact with the tread, including both wheel’s radius, and
denotes the horizontal distance between the middle and rear wheel in contact with the tread, including both wheel’s radius. The middle wheel can climb up or down with fewer than 65 degrees of contact angle. This value is obtained based on experimentation. Then, the largest distance between
and
is the minimum distance required if two wheels simultaneously touch the tread. Finally, the third case is when the robot can climb up and down, and the three wheels maintain contact with the ground in three different steps. The minimum tread required is subject to the maximum slant of the chassis during climbing up or down.
2.2. Robot Design Methodology
Designing a robot based on experience and trial and error does not ensure that the chosen parameters and the combination of these offer the best results for the robot’s performance. The robot design implies multiple variables, objectives, restrictions, and evaluation criteria.
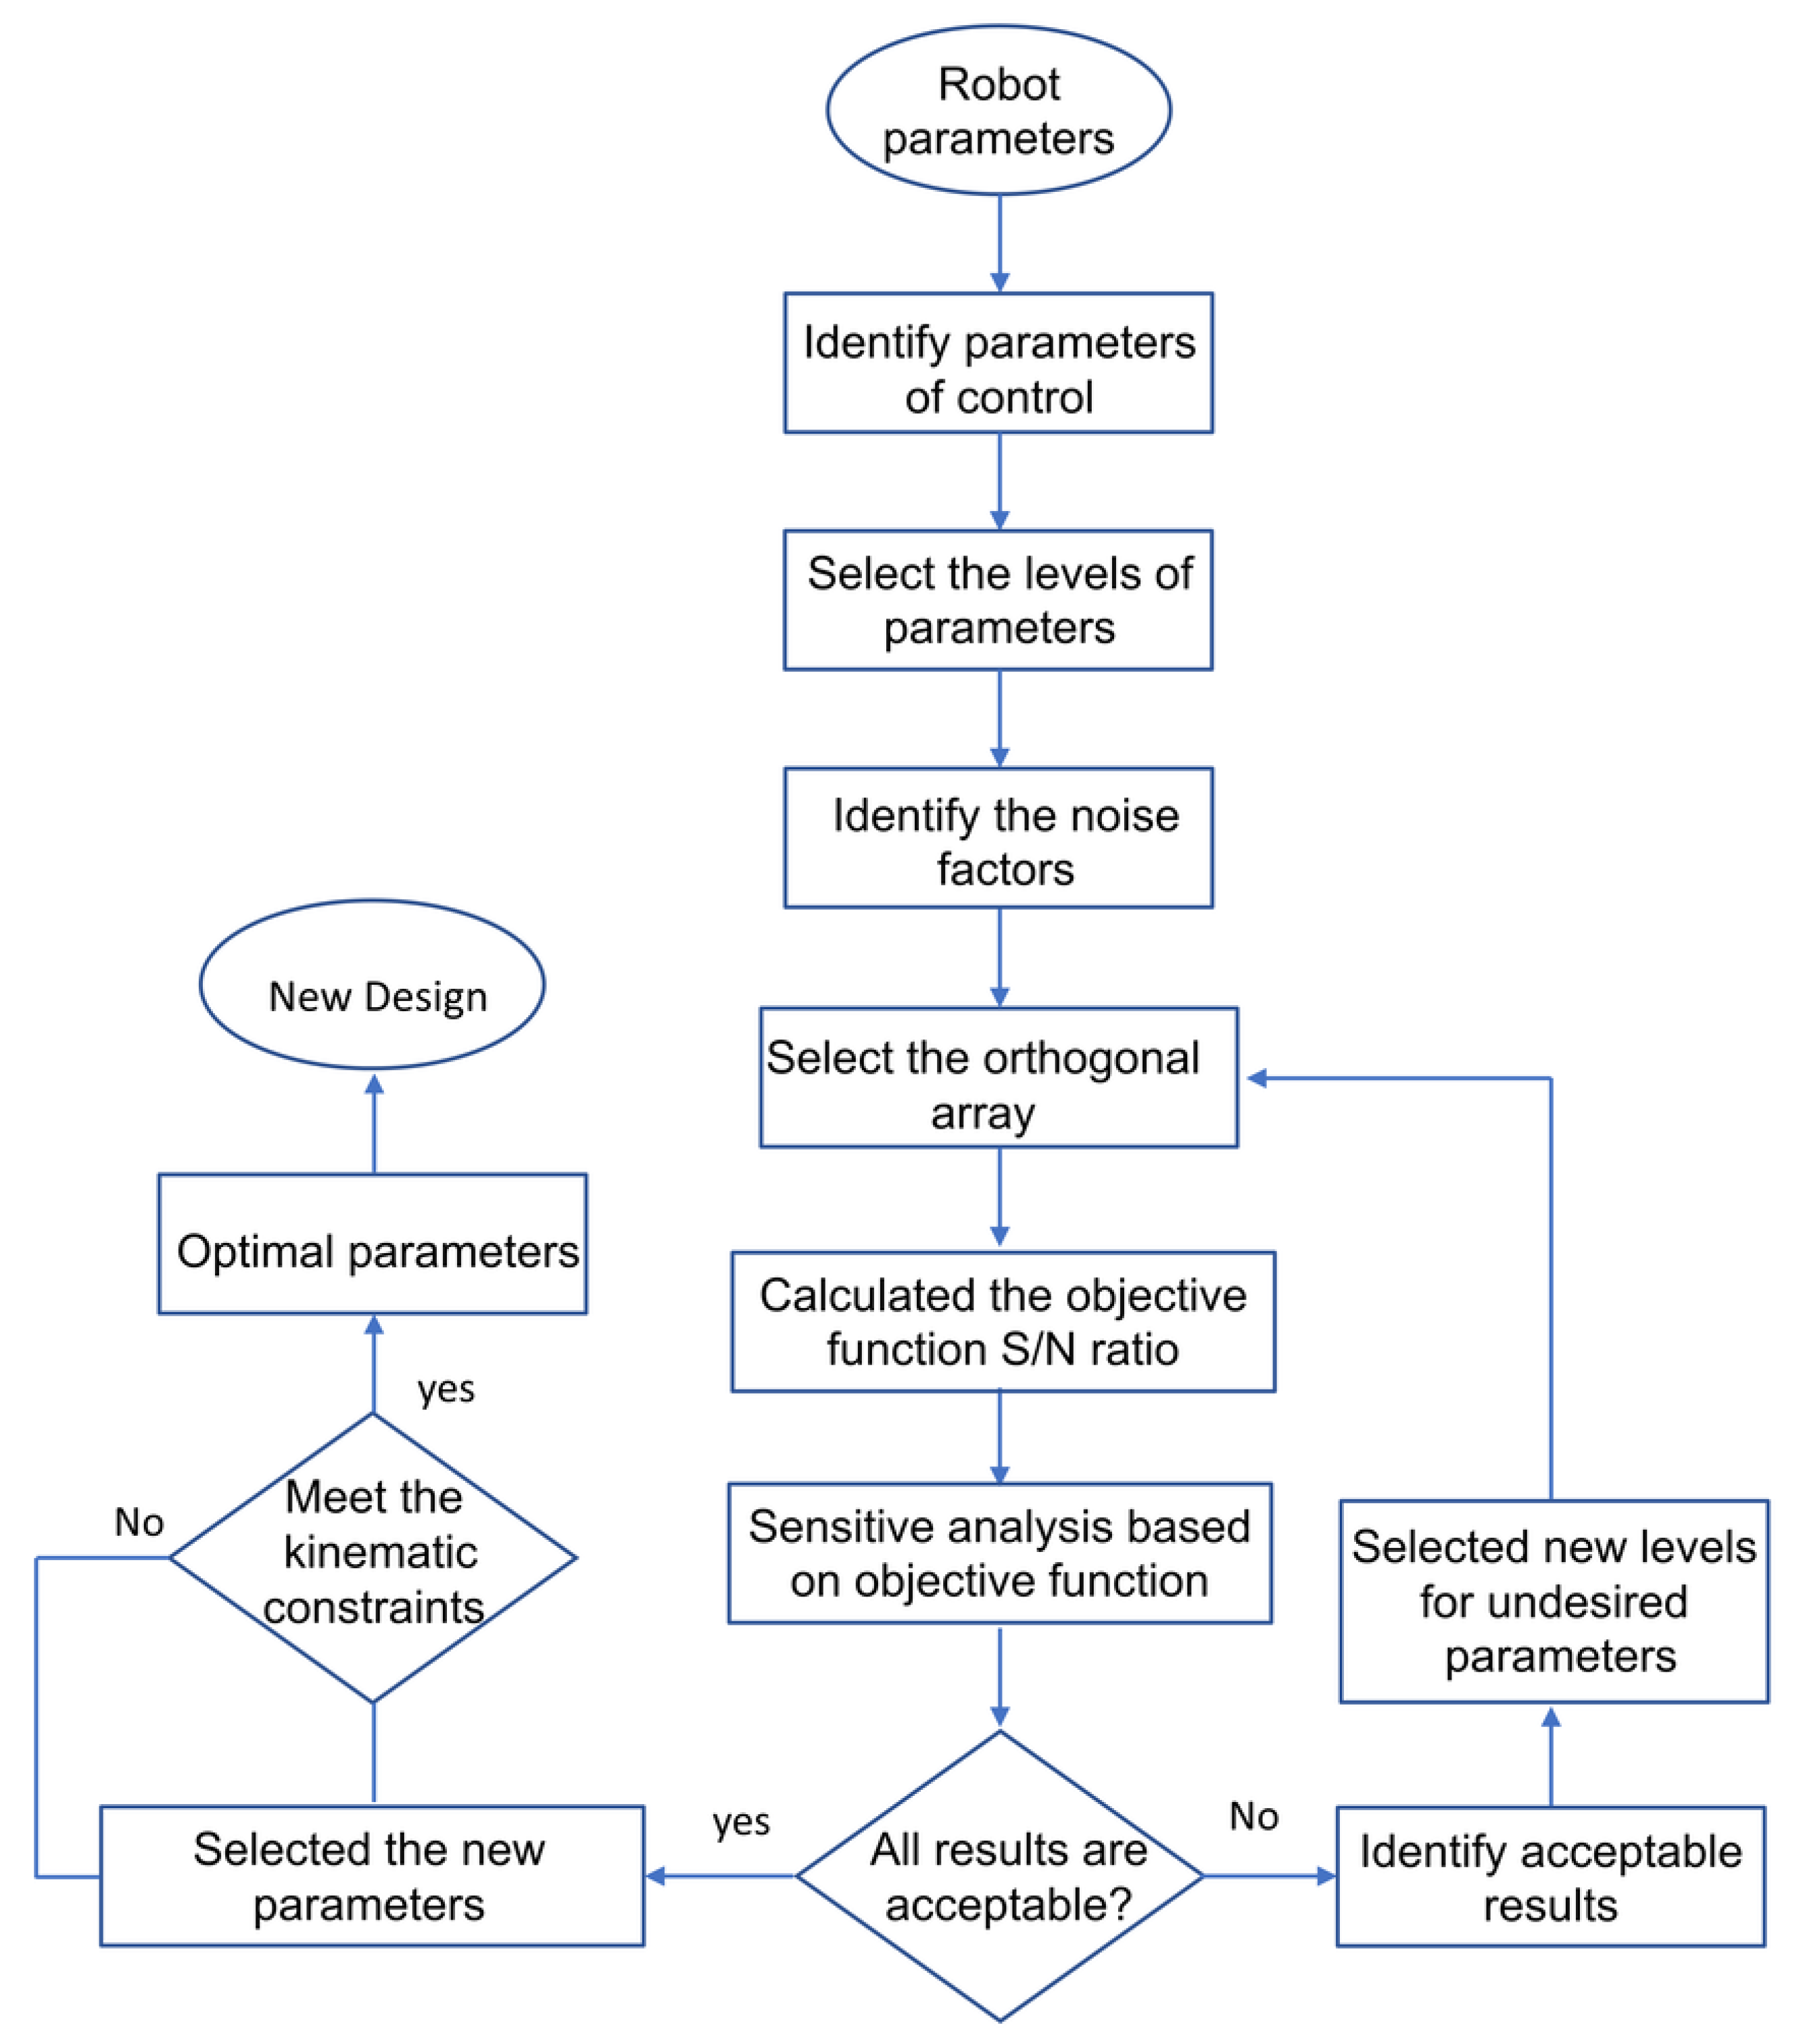
The robot design methodology proposed in this paper is described in
Figure 4. The flowchart shows how the designer obtained the optimal parameters for the wheeled robots. We identify the parameters of control, which are the length of the links and the wheel radius. These parameters are changeable and evaluated to improve the robustness of the robot. We selected three levels of each parameter based on the kinematic constraints. The noise factor is a variable that cannot be controlled. For example, we do not know the height and the minimum step that the robot can find on its way. Then, we chose three different stair sizes as noise factors to ensure the robot could climb up and down different sizes of steps. We selected the orthogonal array according to the number of control factors and the levels. Then, we calculated the signal–noise ratio according to the objective function and obtained the sensitivity analysis. If the results show higher slopes between the levels of each parameter, it means we can select new levels and evaluate them again. We can select the best values based on the objective function if the slopes are minimums. Finally, if the new design parameters meet the kinematic constraints, they can be considered optimal design parameters.
The Korea Electronics Technology Institute (KETI) designed the six-wheeled mobile robot [
24,
25], and we adapted it to the robot shown in
Figure 1. The optimization is carried out under the Taguchi method [
26,
27,
28]. We find the optimal combination parameters and improve its performance based on minimizing the trajectory of the center of mass and the slope of 3 different stairs. The results obtained show the robustness of the robot through the analysis of the signal-to-noise (S/N) ratio.
For the simplicity of the robot design, nine parameters are chosen, as shown in
Table 1. For the methodology design, the six most relevant parameters shown in
Table 2, these parameters represent the links and joints of the robot. Although the dynamic parameters affect the robot’s behavior, we can safely create a proper robot control to climb up and down stairs with the kinematic analysis. The dimensions of the chassis and the delivery box remain fixed as
,
, and
, since these values keep the original design. Therefore, the control factors are
,
,
,
,
, and
.
In addition, three levels are determined for each parameter to optimize the design. These values were based on the kinematic analysis. Thus, it reduces the time of experimentation and analysis to find the optimal values. The levels are shown in
Table 2. Since there are six parameters and three levels, we selected the orthogonal array
.
The evaluation of the three levels is given by the signal-to-noise ratio (S/N), where “signal” represents the desired value and “noise” represents the undesirable value. Lower signal noise means the design is robust.
The optimal design parameters are given by sensitive analysis based on the signal–noise ratio Equation (
4). The goal is to reduce the trajectory of the center of mass as low as possible to the slope of the stair, maintaining the wheels’ contact with the ground. Therefore, the robot is more robust and adapts to different sizes of stairs.
n is the number of experiments conducted at level
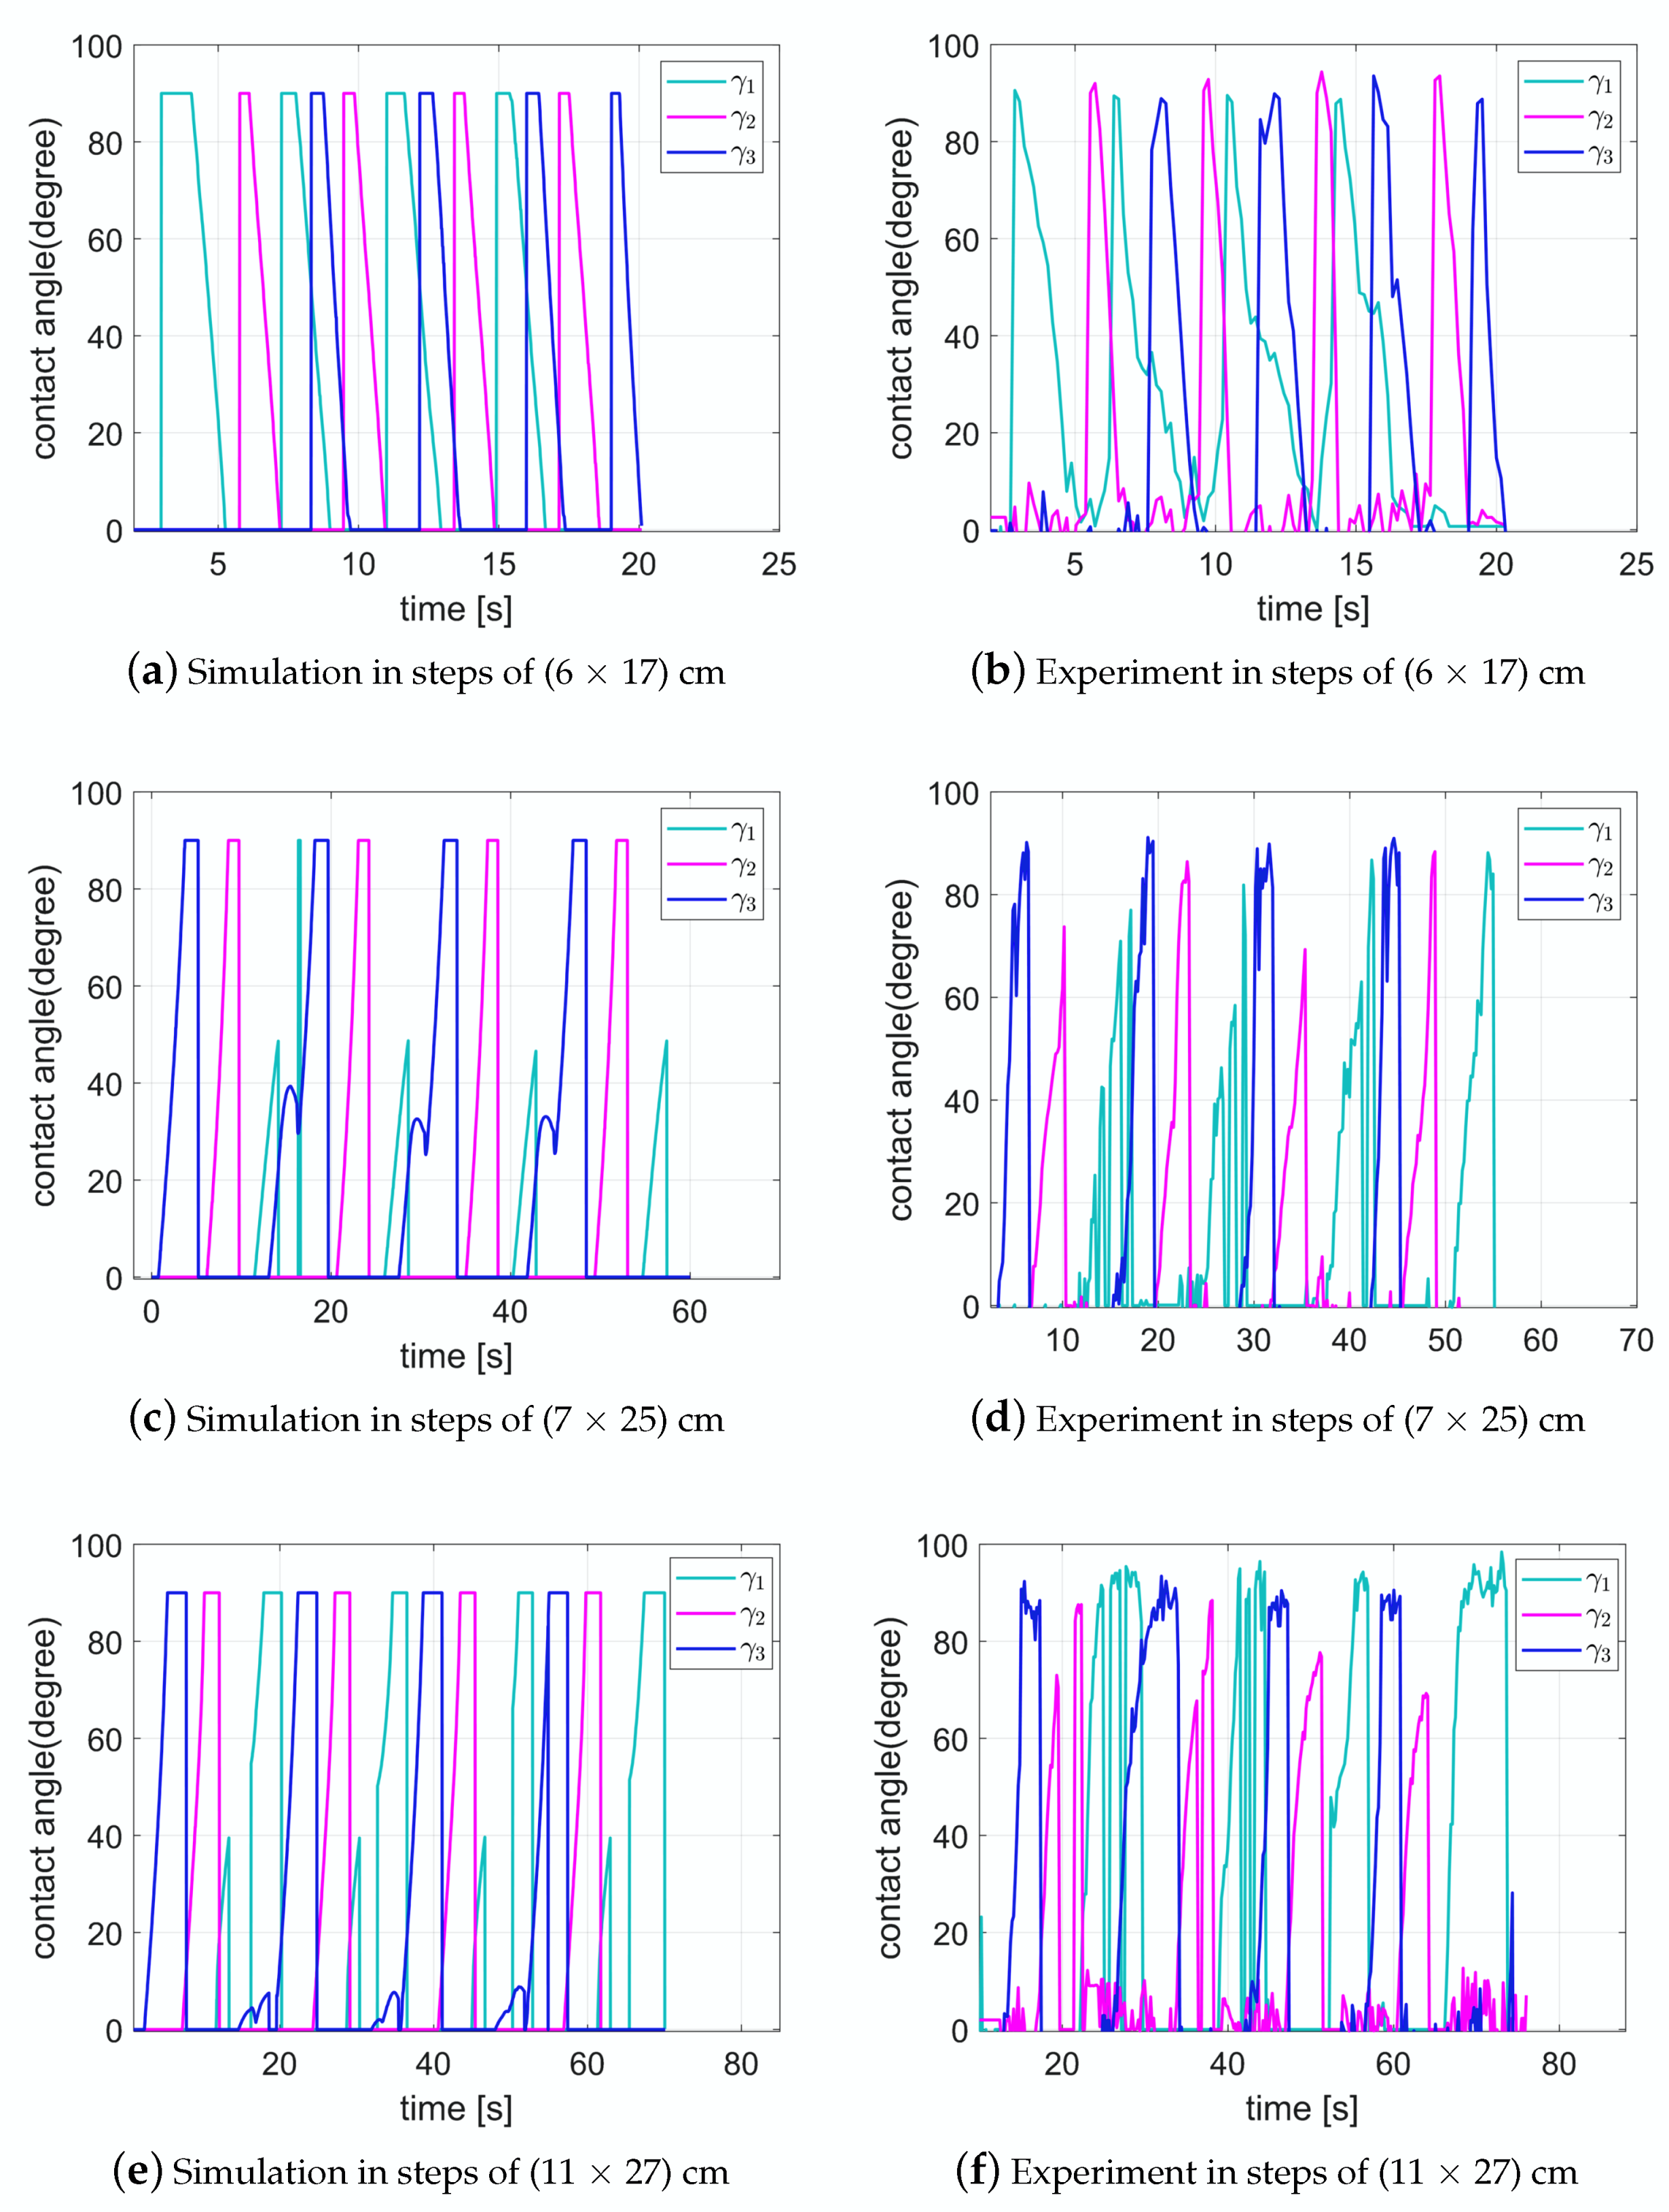
i, in our case, three sizes of stairs:
cm,
cm, and
cm.
is the area between the slope of the stair and the center of mass trajectory. To find the optimal values, we expect to choose the most positive values of the S/N ratio in each parameter and check the kinematic constraints to ensure that the robot can satisfy the requirements to climb up and down stairs.
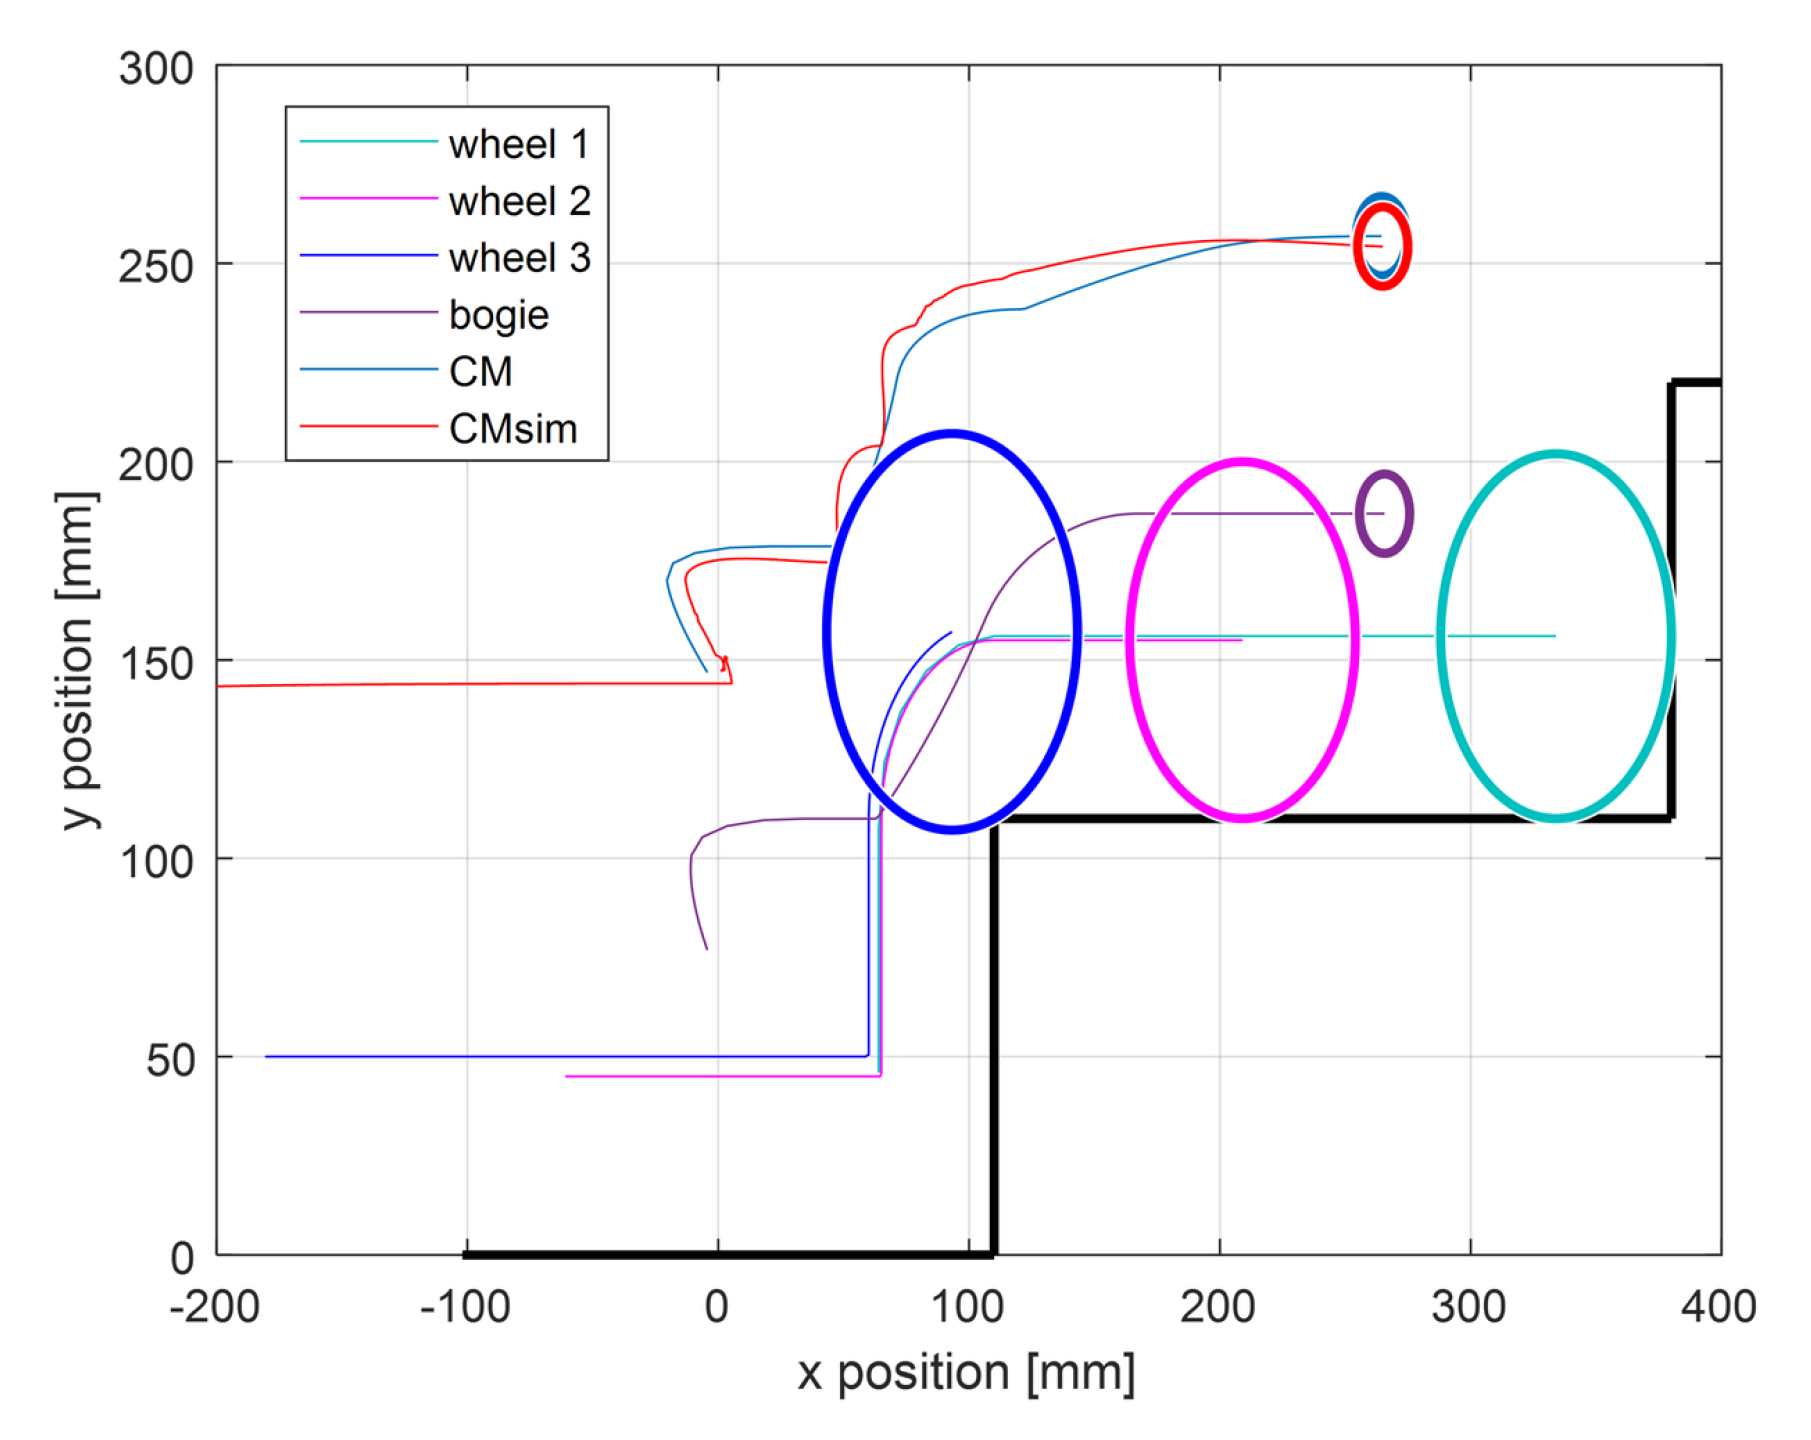
The center of mass considered in the paper is the CM of the delivery package, including the load.
Figure 5 shows the trajectory of the bogie, wheels, and center of the mass from the robot design while climbing up a step of
cm, obtained by the kinematic relation between wheels and links. Furthermore,
denotes the trajectory of the center of mass obtained in the Gazebo simulator using ROS. Therefore, we can validate that the center of mass can be assumed to be fixed above Link 1 as long as the motor maintains the delivery package in a horizontal position during the robot’s motion.
From the orthogonal array
and the three levels of each parameter, we obtain
. Therefore, we calculate S/N Equation (
4).
Table 3 shows the result of the Taguchi method. The result of the initial design is
[dB]. This result is acceptable because prior to the construction of the robot and the stairs, we analyzed the kinematic constraints to know the maximum height the robot could climb. However, in real tests, the wheels lost contact with the ground, and inevitably the robot fell. Then, we decided to implement an emergency controller to avoid falls, as detailed in the next section, and optimize the robot design in the current section.
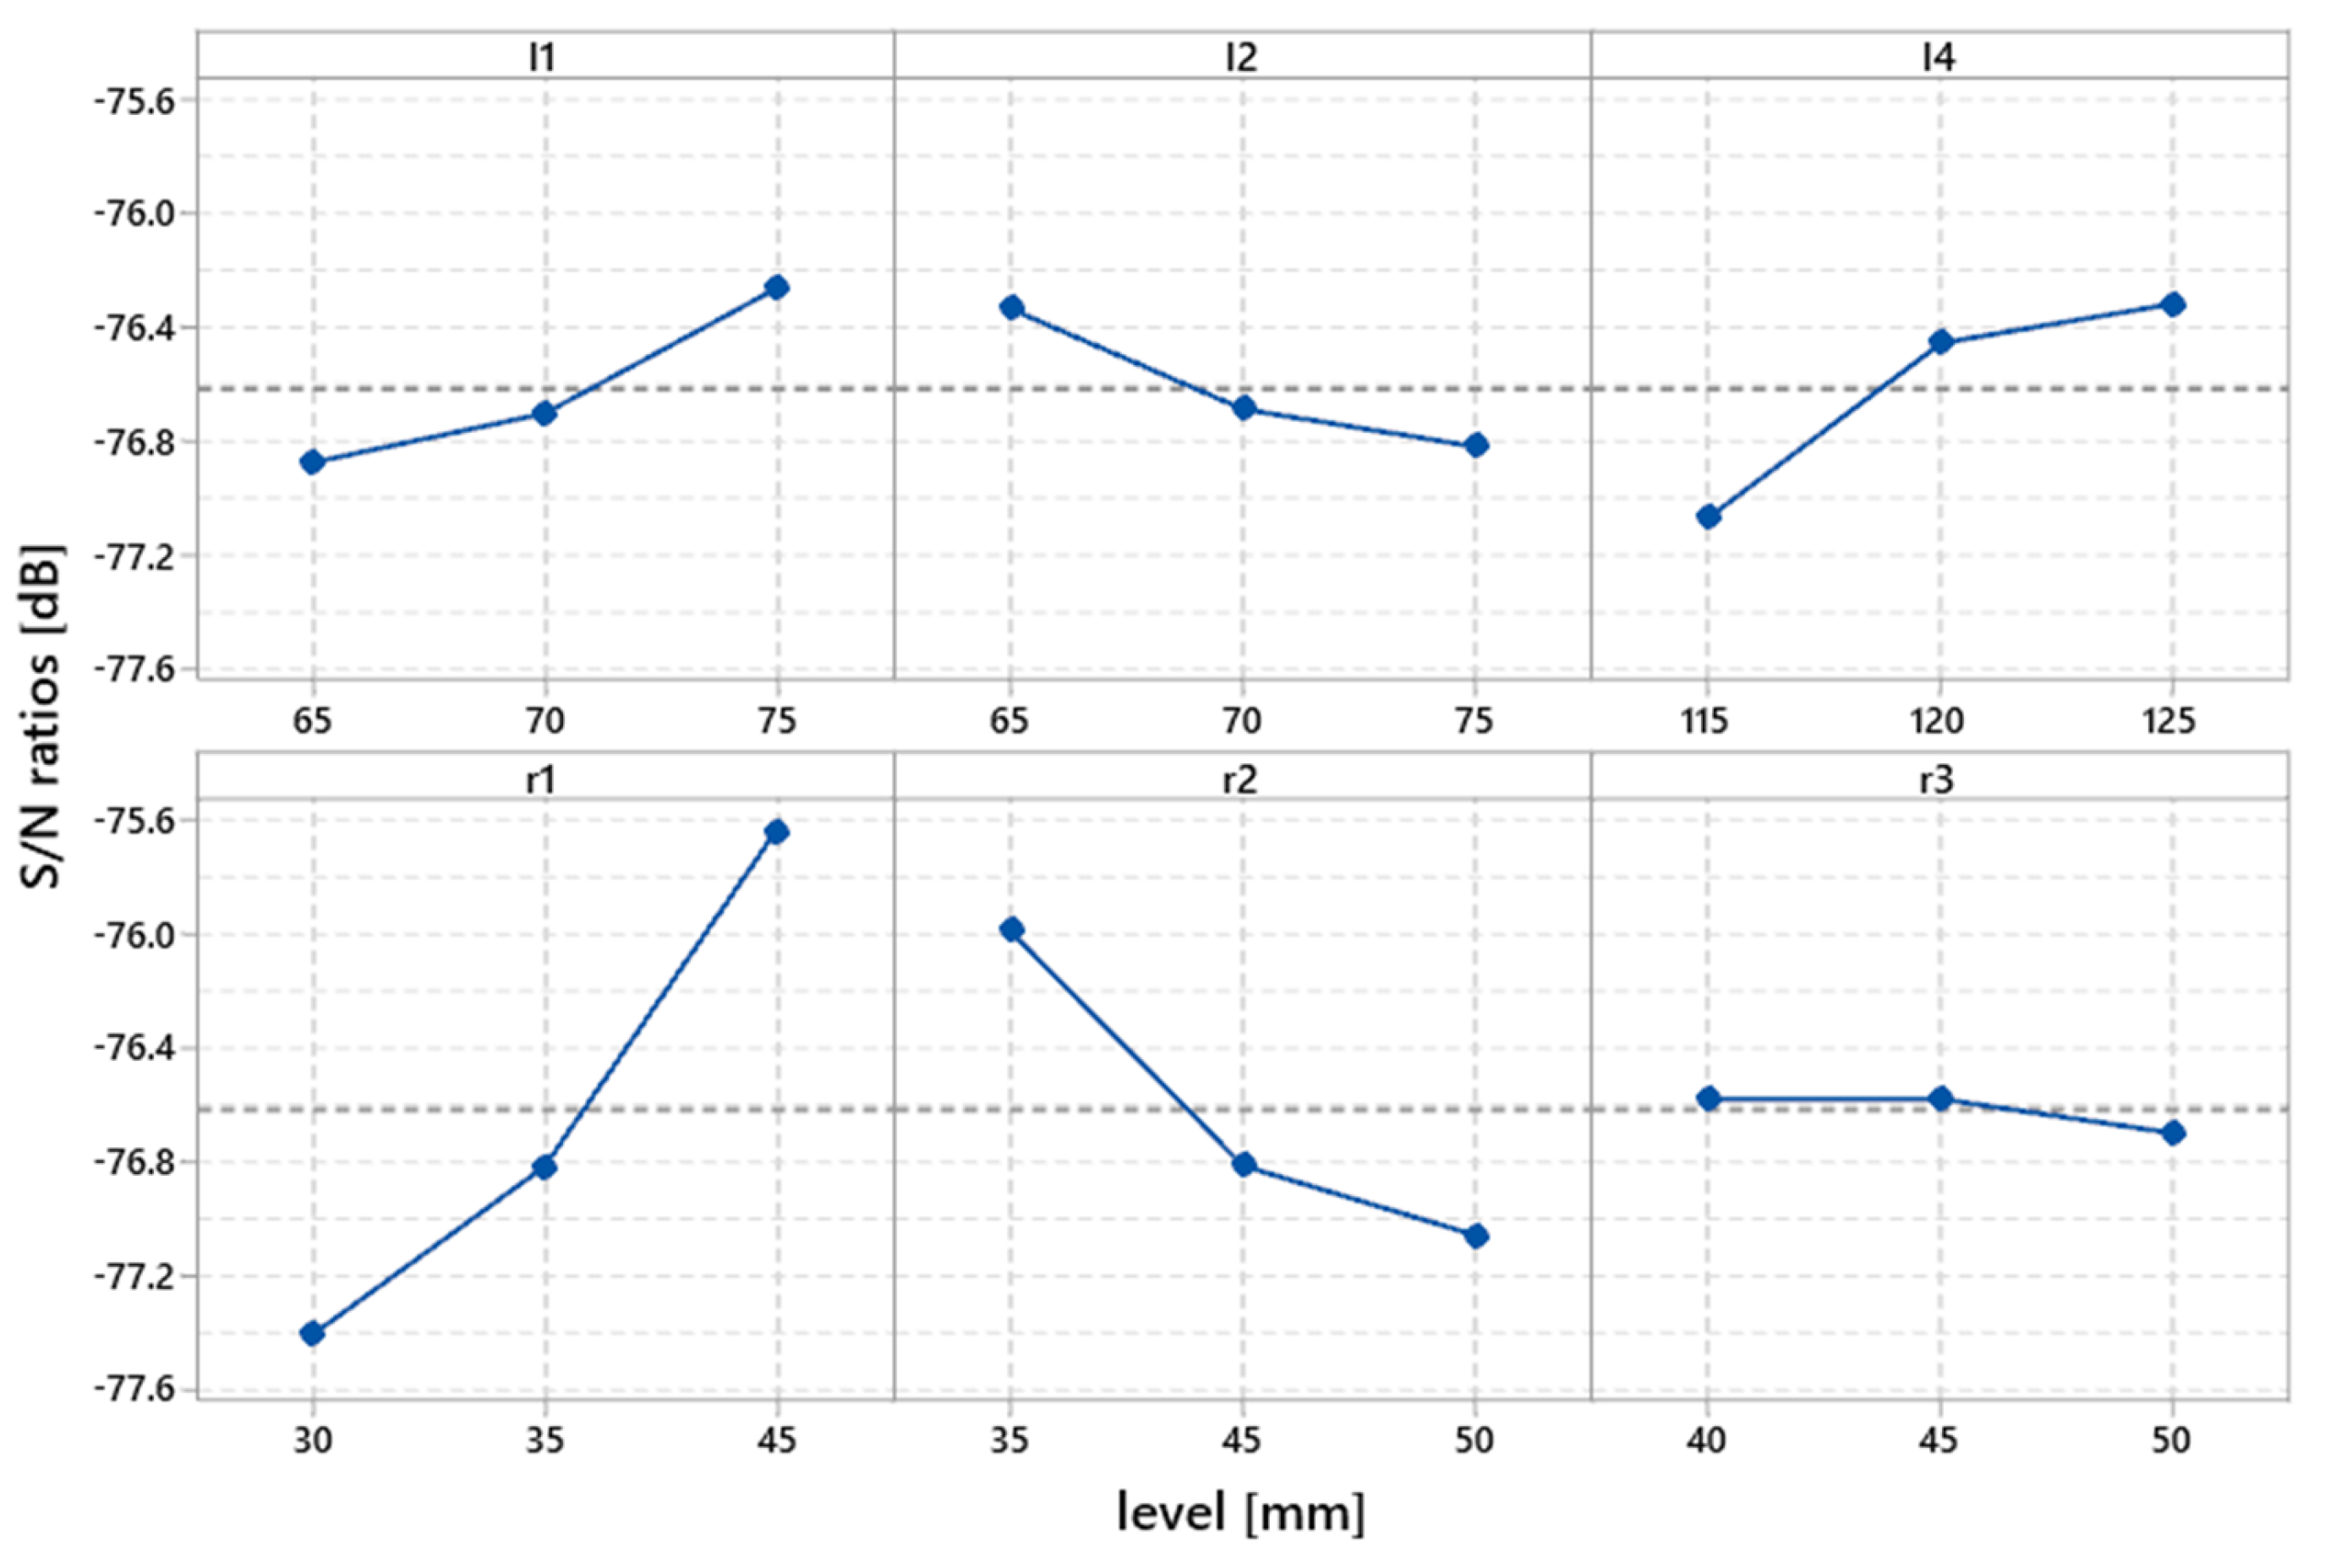
The sensitivity analysis of the Taguchi method is shown in
Figure 6. The six control factors are evaluated based on the objective function. Higher values in the S/N ratio mean optimal values of the design parameters. However, suppose the slope between the levels in each parameter is high. In that case, it means having large sensitivity. Then, it is recommended to prepare a second iteration with new levels in the parameters with high sensitivity in conjunction with the optimal values in the parameters with low sensitivity effects. The parameters
,
,
, and
have low sensitivity, and
and
have high sensitivity. From the first iteration results, we selected
,
,
, and
. For
, even though 125 shows a higher value in (dB), we selected 120 based on kinematic constraints to reduce the length of the robot. For
, the three values in (dB) are practically the same. Therefore, we decided to choose 50 because, during the descent of the 11 cm-high step, the rear wheel takes time to touch the ground, and the robot loses stability.
The second iteration focuses on
and
. The optimal values obtained from the first iteration, and the three new levels for
and
are shown in
Table 4. The new orthogonal array is given by
. We calculate
and the objective function S/N ratio, as show in
Table 5.
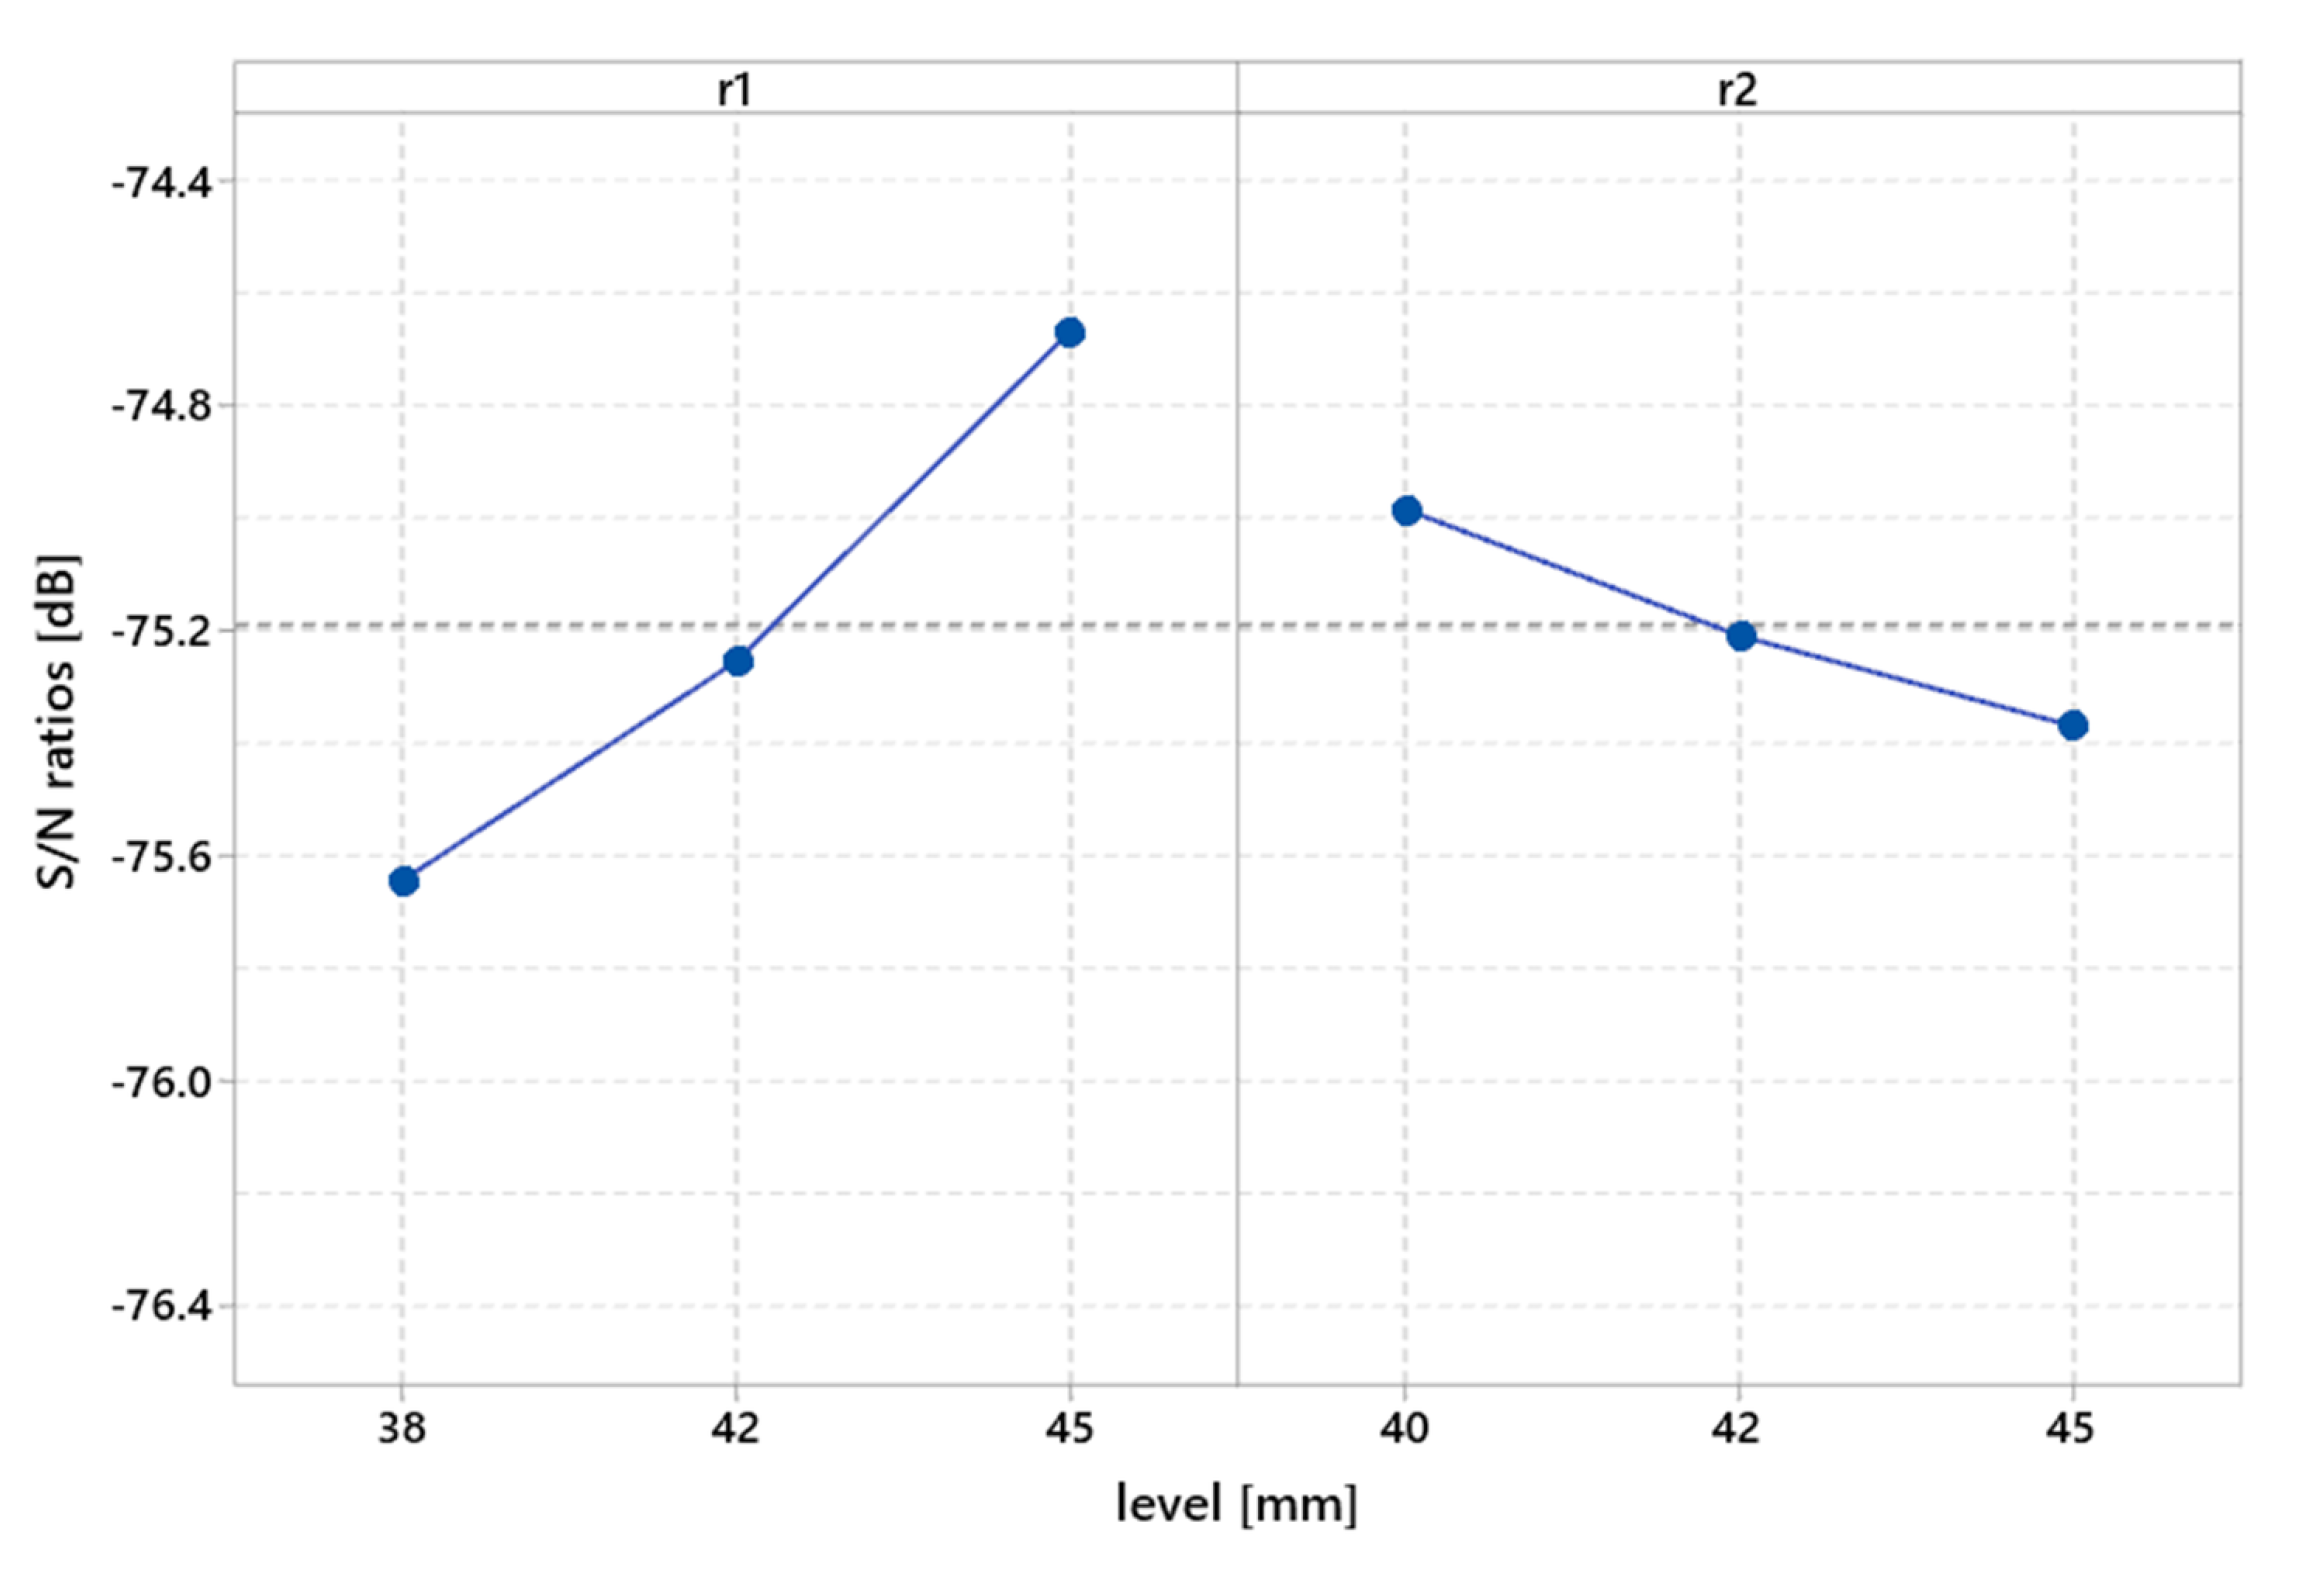
The sensitive analysis from the second iteration is shown in
Figure 7. To determine the optimal values for
and
, we compare the S/N ratios from
to
(dB) in the first iteration, which reduces from
to
(dB) in the second iteration, these values denote better results than the previous ones. Then, we selected the optimal values in conjunction with the kinematic constraints. It is worth noting that the three levels in each parameter satisfy the kinematic constraints. Therefore, the optimal values are
and
, even in the graph showing that
has a better S/N ratio; We selected 45 because when the robot is climbing up or down the high
cm step, the chassis rubbed against the stair.
Table 6 shows the comparison of the initial design and the optimized design, as well as the gain in (dB) being
.
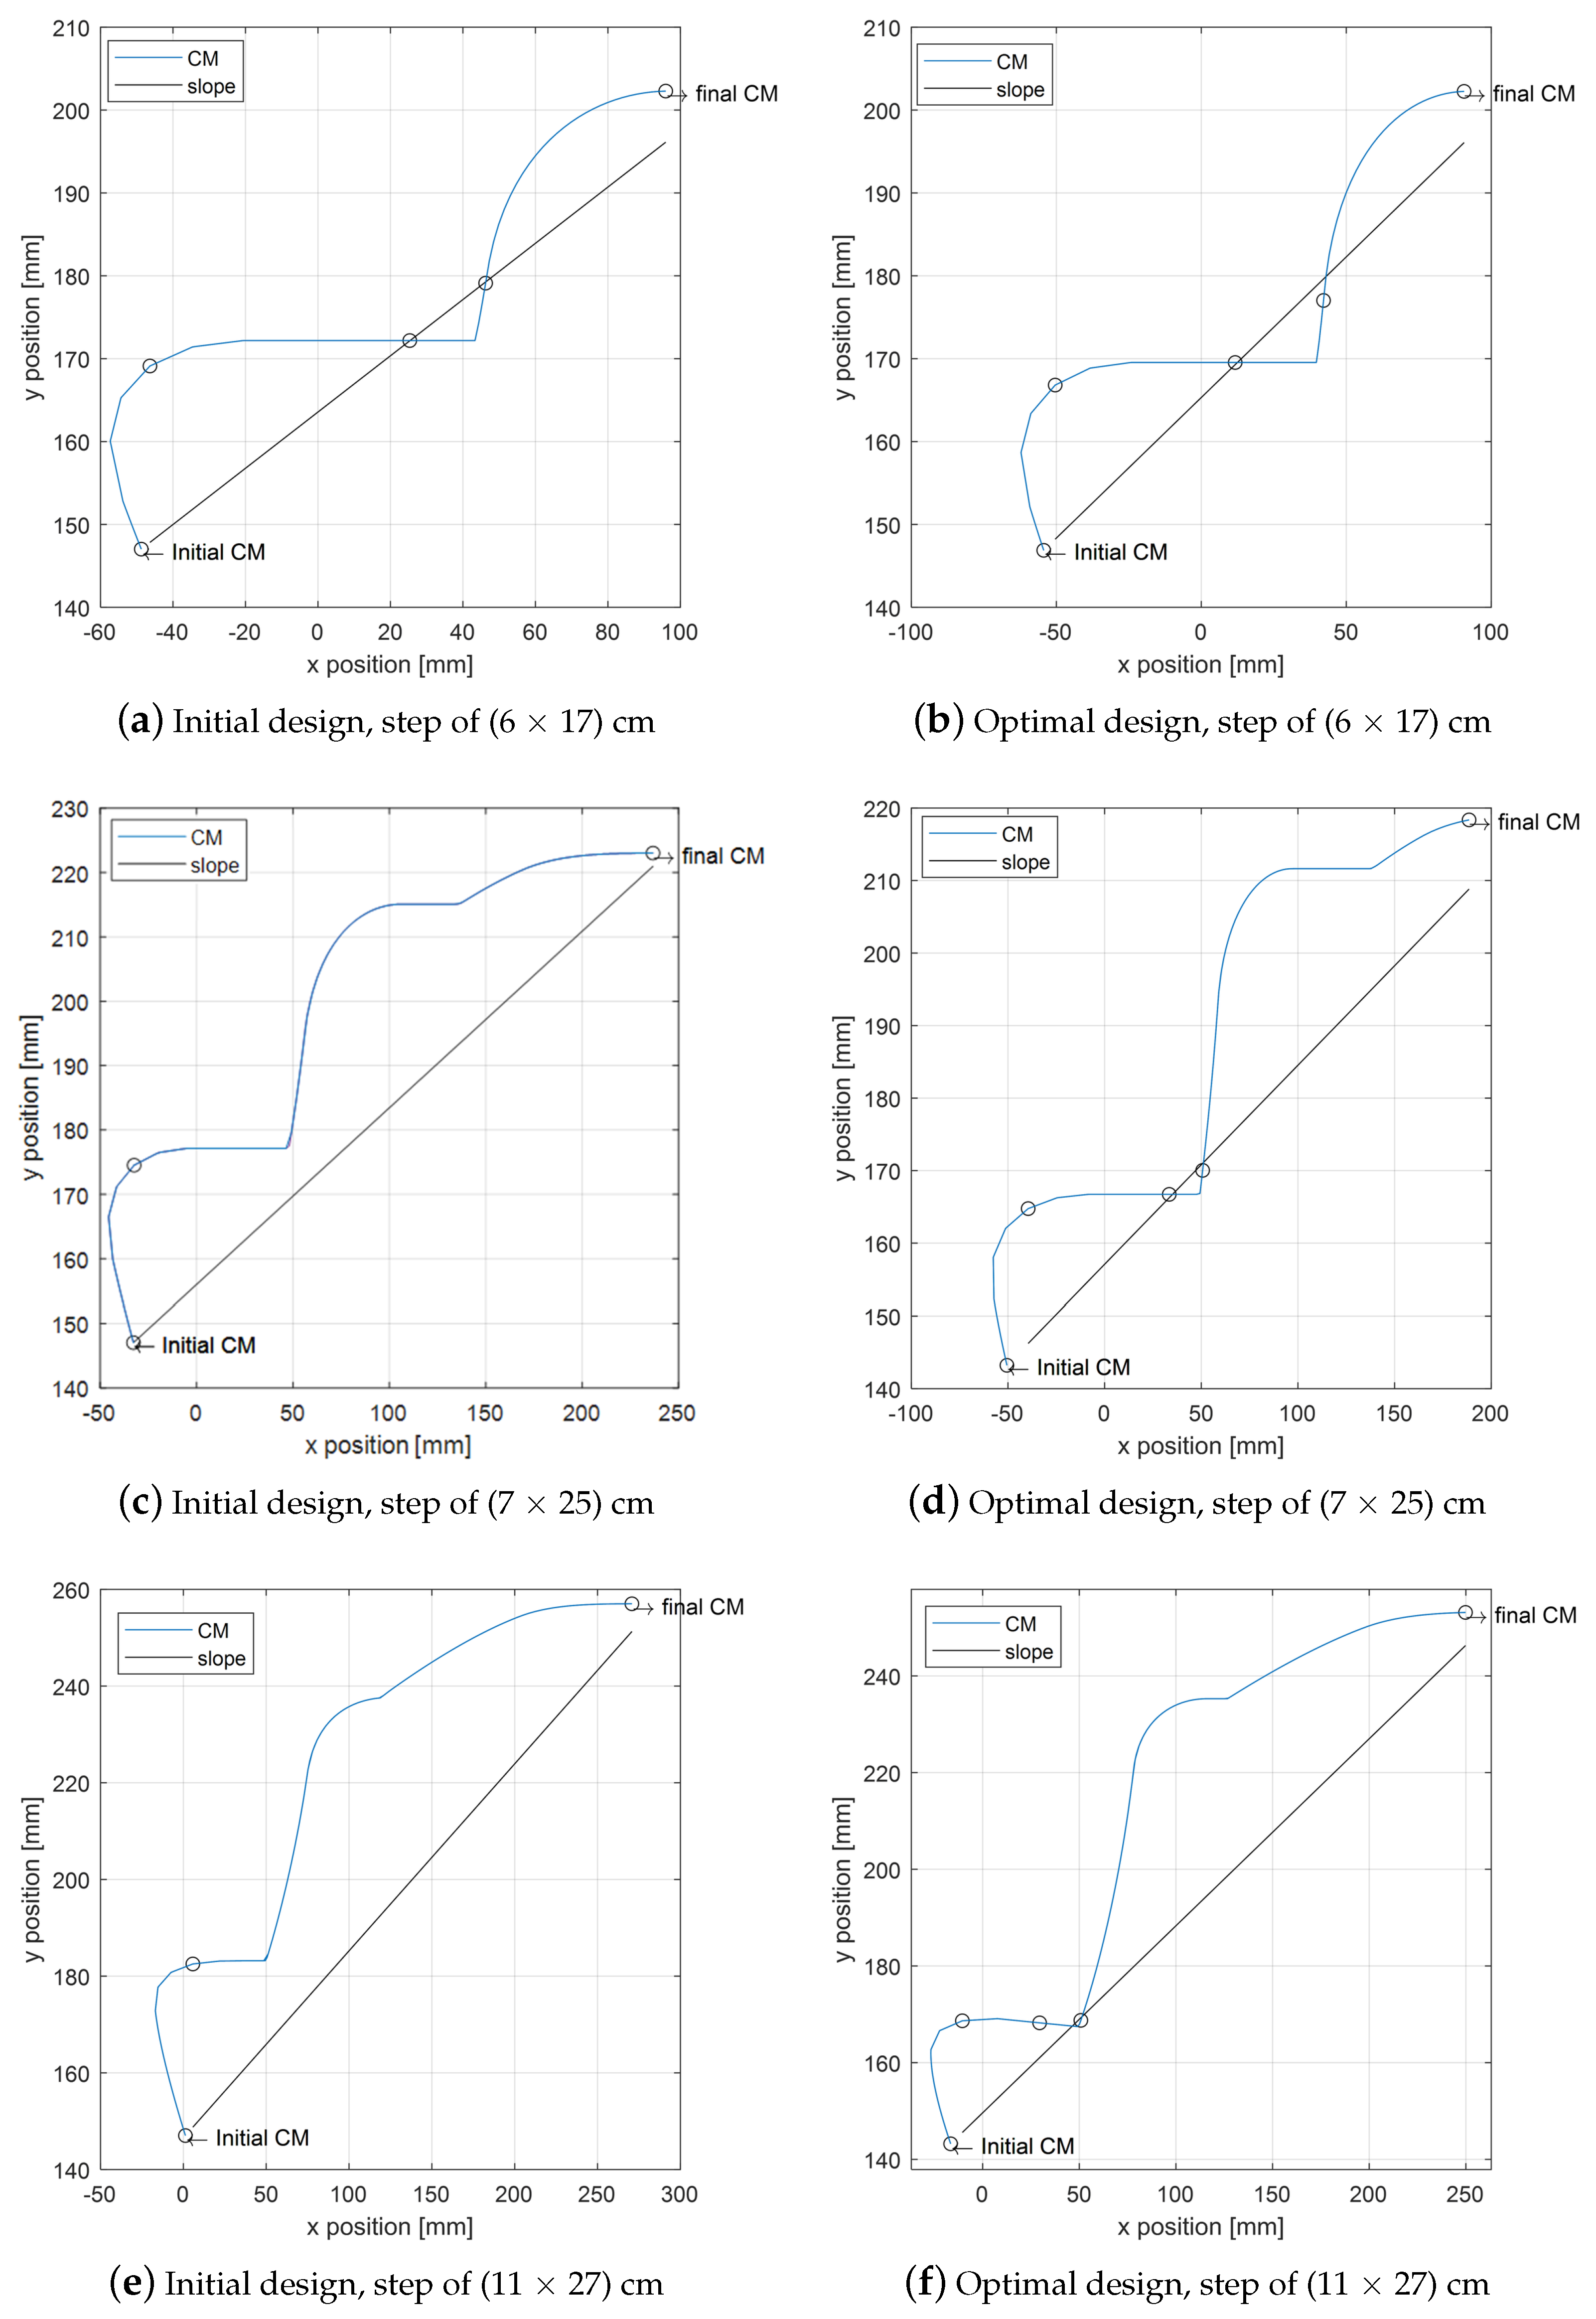
Figure 8 shows the area between the path of the center of mass and the slope of each stair. The results show satisfactorily that the area decreased with the optimal design.
Figure 8a,b shows the robot climbing up one step of (6 × 17) cm, initial and optimal design, respectively; the area reduces from 1474 mm to 1227 mm.
Figure 8c,d shows the robot climbing up one step of (7.5 × 25) cm, initial and optimal design, respectively; the area reduces from 5603 mm to 4828 mm.
Figure 8e,f shows the robot climbing up one step of (11 × 27) cm, initial and optimal design, respectively; the area reduces from 8887 mm to 7624 mm.
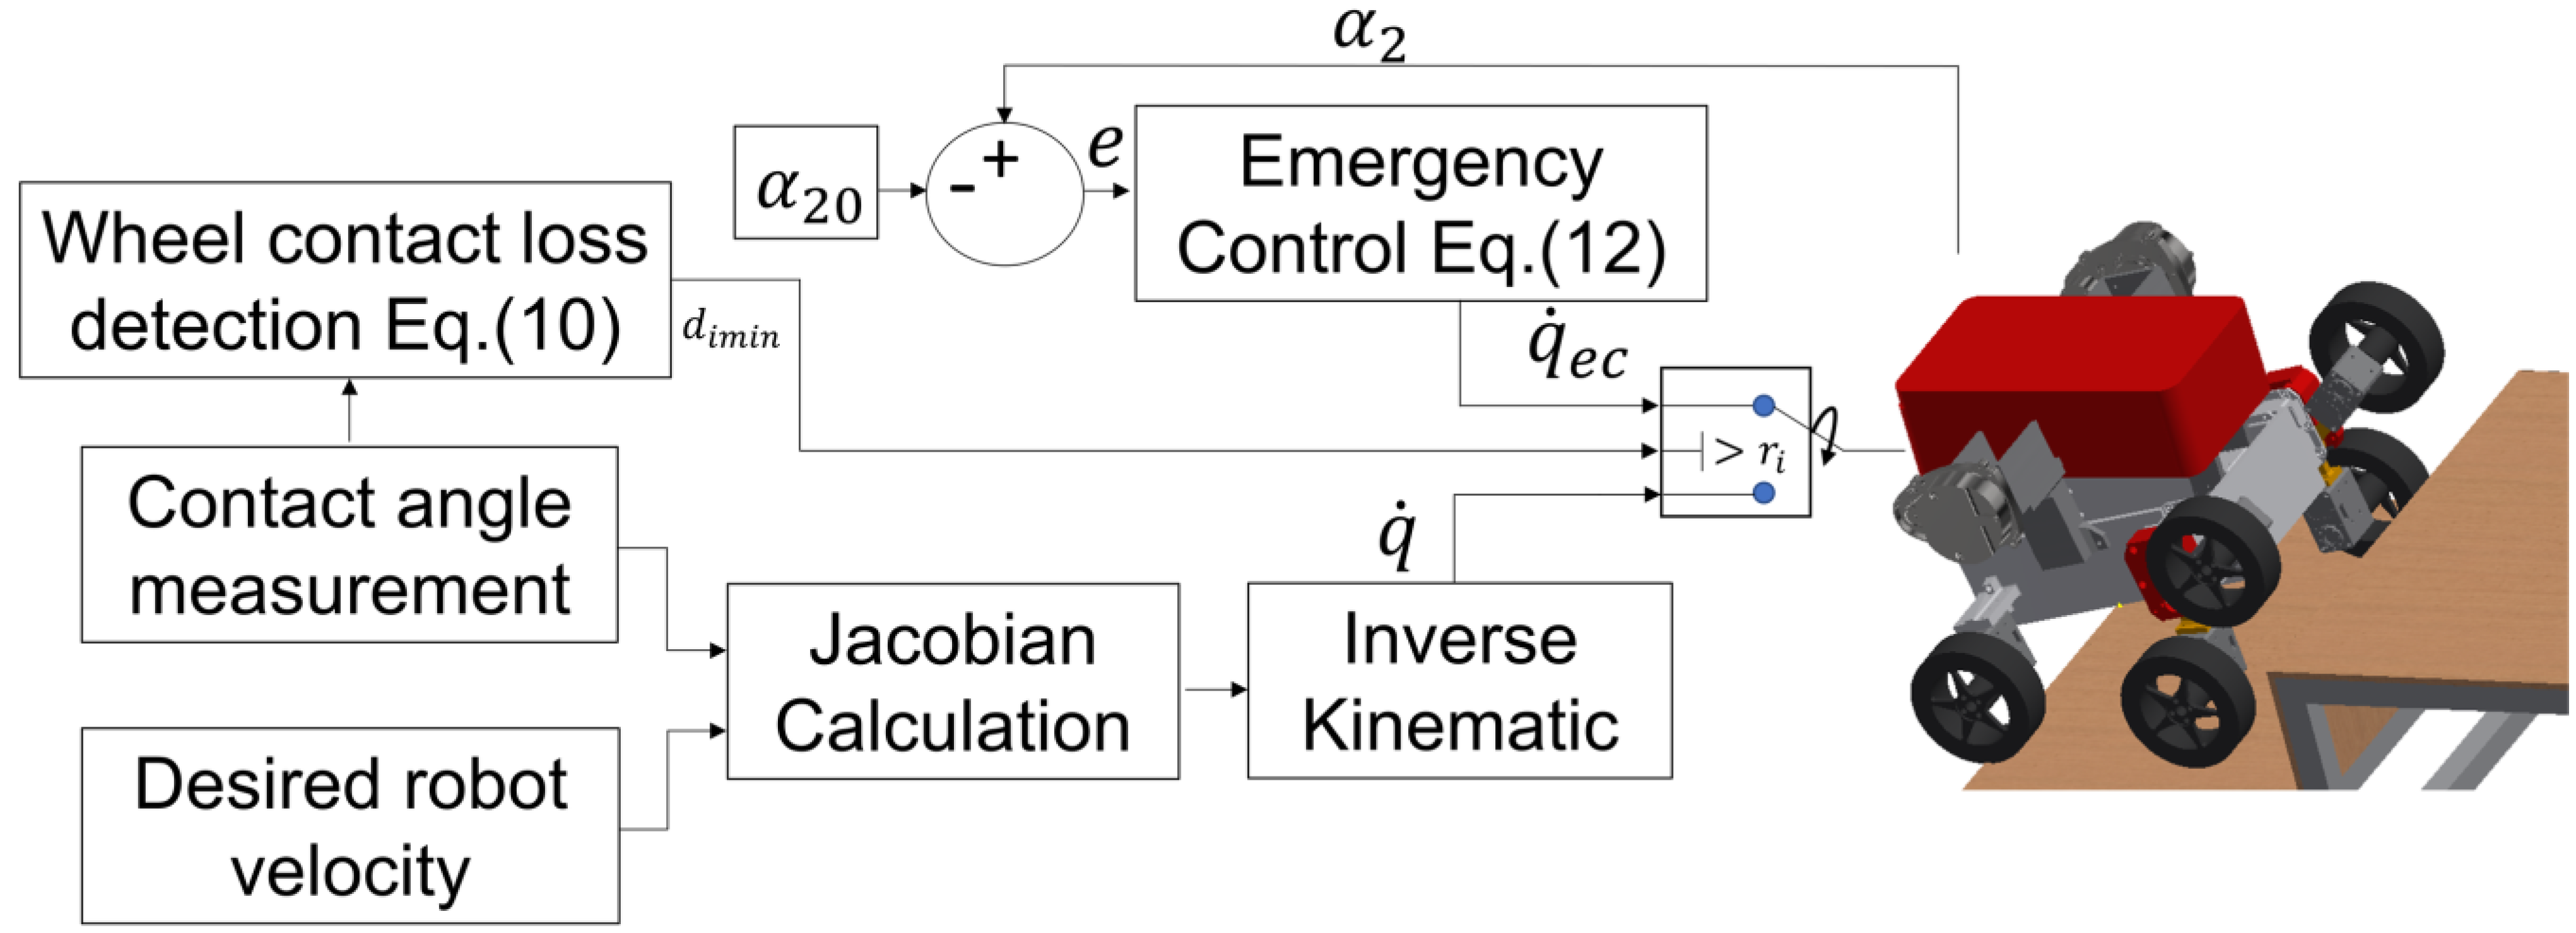
The next section details how the robot recognizes if it climbs up or down stairs. Additional emergency control prevents the robot from falling when the wheels lose contact with the ground.


