1. Introduction
The emergency generator installed in the building uses a diesel engine, and to ensure start ability and stable power generation performance in case of an emergency such as a power outage, the operation inspection should be performed once a week for at least 30 min under no-load condition. During this test operation, many harmful emissions such as NOX and particulate matter (PM) are generated. Emergency generators basically reduce harmful emissions through the same type of aftertreatment system installed on road diesel engines. Exhaust gas is largely reduced through diesel oxidation catalyst (DOC), diesel particulate filter (DPF), and selective catalyst reduction (SCR). Since emergency generators are less limited in space than vehicles during installation, integrated aftertreatment systems developed for vehicle installation, such as catalyzed DPF (CDPF), which combines the functions of DOC and DPF, are not considered.
US Environmental Protection Agency regulates the emission of emergency power generators through the EPA emission regulation, which is a non-road engine emission regulation [
1]. To meet this, the PM/NO
X reduction efficiency and back pressure of the aftertreatment system must be optimized, so the system shape must be optimally designed so that flow uniformity of the reducing agent is sufficiently secured in front of the SCR. Basic configurations of the aftertreatment solutions for emergency generator include a DOC, DPF. SCR, and similar. However, for large aftertreatment systems exceeding 500 kW, rectangle substrates more easily respond to exhaust capacity and are relatively easier to manufacture than circular types. Hence, rectangle types are mainly applied, so optimal design is possible considering changes in internal flow characteristics according to differences in cross-sectional shape.
In the urea–SCR system, as the urea–water mixture sprayed from the urea injector installed in the reactor part is thermally decomposed by the exhaust temperature, HNCO is produced, and a hydrolysis reaction is generated in the reactor (mixed region) to produce an ammonia (NH
3)-reducing agent. Exhaust gas containing ammonia then flows into the SCR through the diffuser, and ammonia causes an SCR reaction in the catalyst to convert NO
X into harmless H
2O and N
2 [
2]. Therefore, the flow uniformity of ammonia distributed at the front end of the SCR becomes an index capable of determining the reduction efficiency of the system. In addition, by calculating the pressure at the front end and the rear end of the system, the effect of the system on the output power characteristics of the engine can be determined in advance. However, these flow characteristics have limitations when analyzing them in an experimental method.
Using the CFD analysis method can greatly reduce trial and error required for optimal design, so analytical research on the aftertreatment system has been conducted using it. CFD studies on the urea–SCR system began with the NOx reduction efficiency study of the SCR system according to the presence or absence of mixer installation, and studies were conducted to analyze internal flow characteristics according to engine load rate and SCR device shape [
3,
4,
5,
6,
7,
8]. Recently, an analytical study was conducted to deal with the blade specifications of the urea mixer and the back pressure and flow characteristics of SCR according to the length of the reactor [
9]. In this study, ANSYS Fluent, a commercial CFD software, was used as an analysis tool. CFD can be performed on a computer alone without complex separate experimental and analytic devices, which relatively reduces costs and minimizes trial and error required for optimal design by reflecting analysis results at the initial design stage. It has the advantage of being able to interpret actual physical phenomena that are difficult to experimentally analyze, such as complex internal fluid behavior accompanied by turbulent flow. The change in flow velocity according to the cross-sectional shape of the system was first analyzed, and the change in flow uniformity and back pressure according to the change in SCR diffuser angle, urea injector position, and porosity was analyzed.
2. Numerical Methods
2.1. CFD Model
Ansys FLUENT, a CFD program used in this study, is a widely used representative program that largely allows for normal and abnormal interpretation and provides comprehensive modeling of a wide range of incompressibility and compressibility, and laminar and turbulent flow problems. CFD numerical analysis can be largely divided into three stages: preprocessor, solver (calculation), and post-processor [
10].
In the preprocessing step, the analysis area of the model to be interpreted is set, and then discretized through a mathematical differential equation. To this end, a grid of analysis models is created. In the solver step, input to the analysis is performed on physical properties, energy equations, viscosity models, and boundary conditions. Next, the analysis work is carried out through repeated calculations, and it can be judged that the better the convergence of the interpretation, the stronger the interpretation has been. Finally, in the post-processing step, graphic processing is performed so that the calculated result can be visualized and analyzed by the user. Lastly, the task of comparing with actual experimental data was added to verify the reliability of the analysis results. The purpose of this study is to interpret the internal flow, including turbulence.
The subject of analysis is an aftertreatment system capable of responding to a large diesel engine of 560 kW, and due to its large size, a rectangular, not a circular one, was applied to vehicles. SDPF (SCR on DPF) has an advantage in space efficiency, but it is not introduced because emergency generators are free from space constraints when devices are installed and generally have low porosity in the process of coating the catalyst for SDPF in DPF.
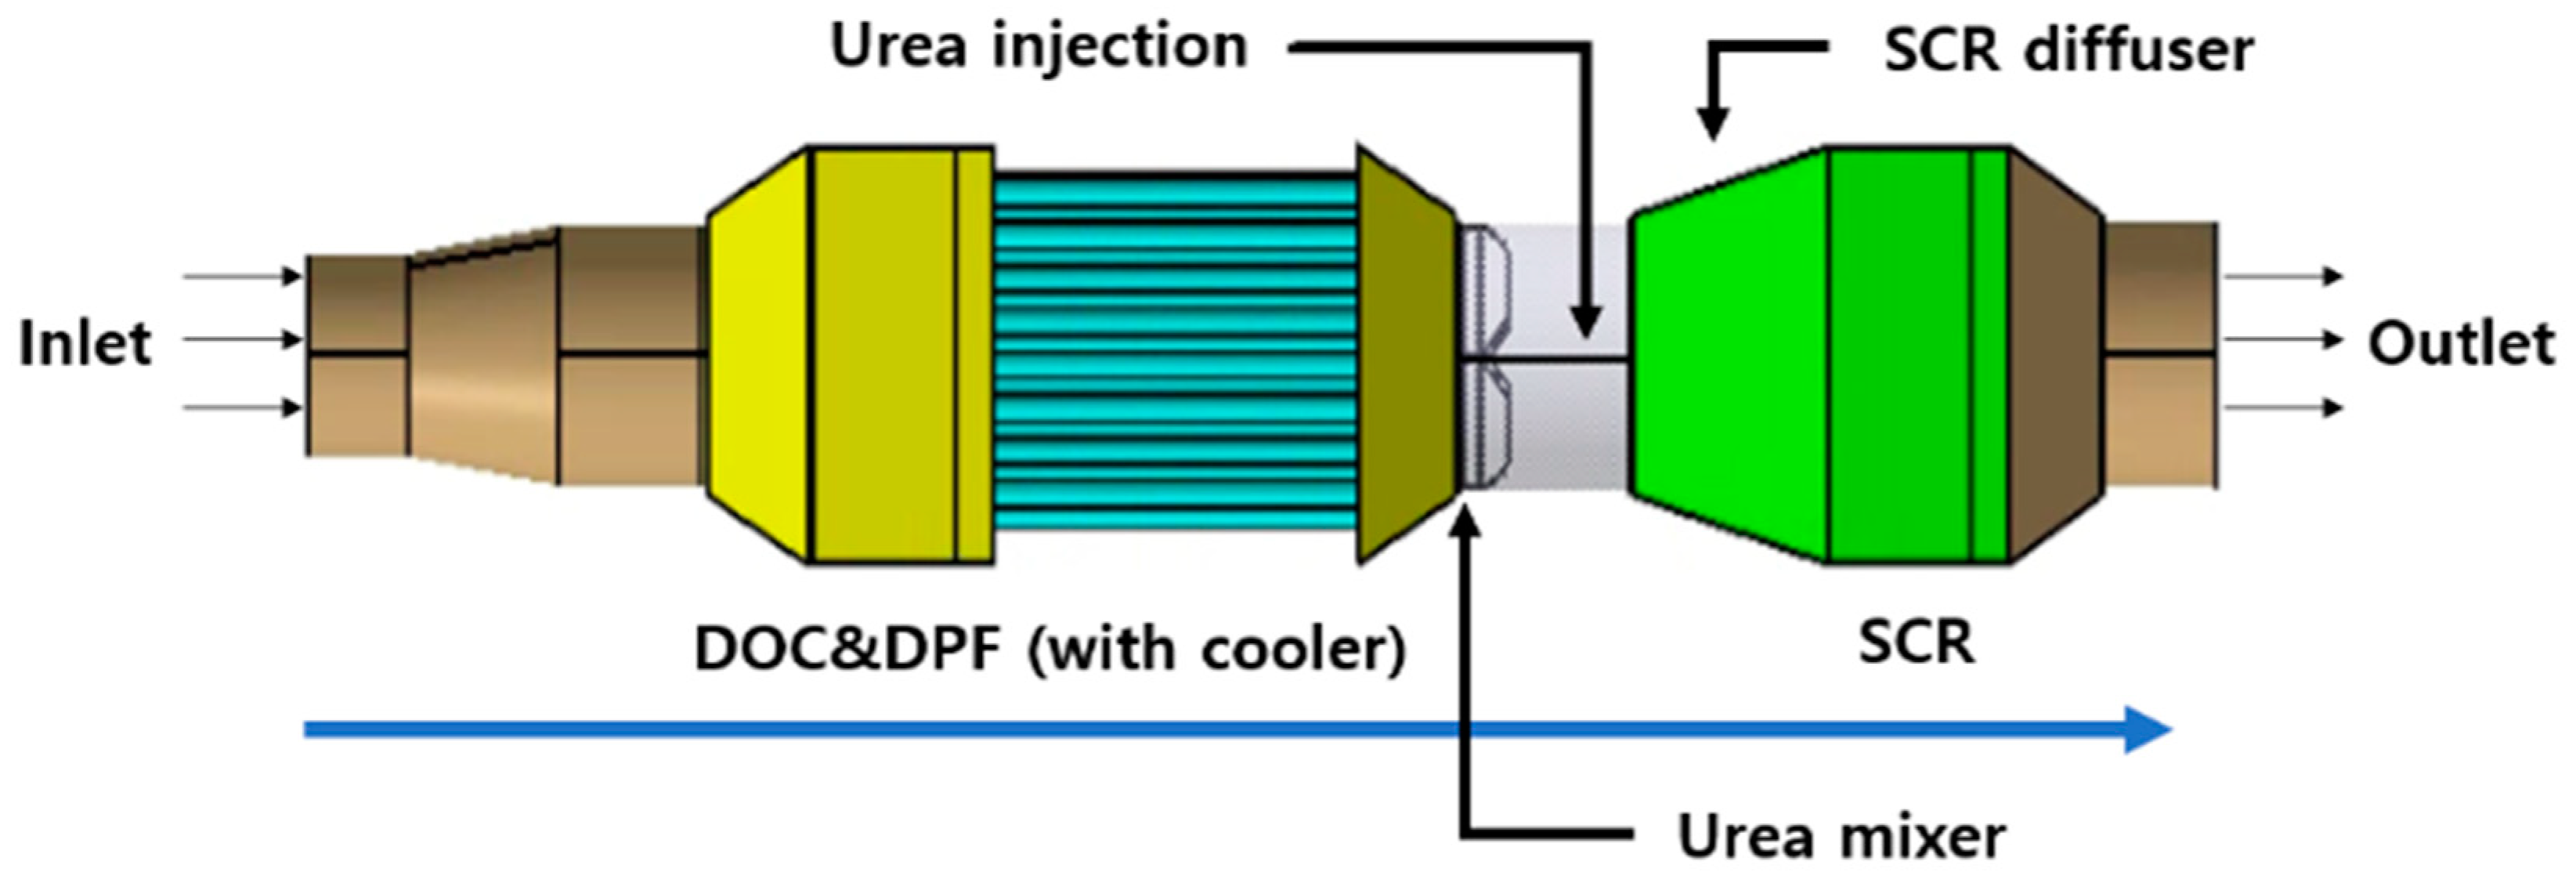
Figure 1 shows the overall shape of the system used in this study. The flow uniformity was analyzed at the front of SCR, and the back pressure was calculated by measuring the exhaust pressure applied at both ends of the inlet and outlet.
There is a mixing section (reactor) between the DPF and the SCR, and a urea injection nozzle is installed at the point 2/3 of the reactor. The front end of the reactor is equipped with an eight-blade mixer with a diameter of 150 mm for urea mixing, shown in
Figure 2.
2.2. Analysis Conditions
This study applied a numerical analysis technique based on the finite volume method and assumed a compressible turbulent flow in a normal state for exhaust flow. Accordingly, the compressible flow-based momentum equation, the continuous equation, and the turbulence motion equation were applied together. For the analysis of swirl generated by the mixer, an RNG k-epsilon turbulence model was used to calculate a relatively robust result value for turbulence. The high-porosity substrate filters were set as a porous medium, and the internal flow was assumed to be laminar.
2.2.1. SCR Reaction Mechanism
When SCR uses ammonia (NH
3) produced from urea–water mixture as a reducing agent, NO
X is converted to N
2. For the improvement of SCR efficiency, the catalyst active temperature range should be kept constant as much as possible, and a change in catalyst temperature generates NO and N
2O and promotes a reaction in which NH
3 and O
2 react and convert to N
2 [
11].
2.2.2. Porous Media
When porous media are set and analyzed, catalysts composed of micro lattice are replaced with formulas related to inertial resistance and viscosity resistance, enabling accurate numerical analysis without lattice generation. Therefore, this research used a porous model to set and analyze the isotropic catalyst for emergency generators as areas with viscous resistance and inertial resistance, which are characteristic values of real porous media. In the case of filters, the porosity and cell density determine the filtering ability, and the porosity of the DPF was set based on 45% and 70% SCR. However, in this study, since the change in flow characteristics according to the change in porosity was the major interest, the analysis was conducted in consideration of the change in porosity, the change in viscosity, and inertial resistance values according to the change in porosity.
Table 1 shows the specifications of each filter.
2.2.3. Pressure Drop
The pressure drop generated in the porous medium was calculated based on the following equation from the Hagen–Poiseuille equation below:
Here,
is dynamic viscosity,
is internal energy, and
d is the diameter of catalyst.
kr is a radial and axial resistance coefficient and was calculated through porosity
ϕ and friction coefficient
f, as shown in the right term, and Reynolds number
Re in the monolith channel. At the entrance of the monolith catalyst, the flow direction changes rapidly in the process of changing the flow cross-sectional area, so the turbulence strength decreases sharply as the boundary layer begins to develop. To consider the change in flow characteristics at the inlet, Lai added an additional coefficient
D1 to the following pressure drop equation [
12].
where
L is the length of the catalyst. However, the above modeling formula alone does not consider the additional losses caused by flow separation and flow recirculation at the catalyst inlet, so it was calculated based on the pressure loss formula proposed by Benjamin, etc. [
13,
14].
In this study, the pressure drop was analyzed by considering the loss caused by the Hagen–Poiseuille equation, the Lai model, and flow recirculation.
2.2.4. Flow Uniformity Index
The uniformity of the flow of NH
3 through the front end of the catalyst is an important factor affecting the NO
X conversion efficiency, the lifetime, and activation time of the catalyst. As an index representing the flow uniformity, the uniformity γ proposed by Weltens [
15] et al. is generally used and is defined as follows.
where
n denotes the total calculation cell distributed on the surface of the support,
C denotes the average concentration in the cross-sectional area, and
Ci denotes the local concentration in the catalyst lattice
i. The closer the flow uniformity index is to 1, the more uniform the concentration distribution of the reducing agent is. In other words, as the local concentration in a specific grid region is higher than the average concentration, the uniformity index decreases.
2.2.5. Heat Transfer Modeling
In this study, we accounted conduction and convection heat transfer modes into CFD simulation. The rate of heat transfer depends strongly on the fluid velocity, and fluid properties may vary significantly with temperature. At walls, the heat transfer coefficient is computed by the turbulent thermal wall functions. Conduction heat transfer is governed by Fourier’s law. Mathematically:
where, for isotropic materials, constant of proportionality is the thermal conductivity
k. The entire system, including DPF, was assumed to be isotropic materials, and the analysis was conducted by assigning heat transfer coefficient and wall thickness provided by the manufacturer of this aftertreatment device.
2.3. Boundary Conditions
The change in the density of exhaust gas was calculated by the ideal gas state equation and analyzed by assuming an abnormal state to observe the change in internal flow over time. In the reactor section, the injection pressure, temperature, and mass flow rate of the urea injector were set to 6 bar, 298 K, and 5 g/s, respectively. The urea injector sprays the urea–water mixture at a constant flow rate in the steady-flow type and solid-cone type. Therefore, the corresponding injection condition was set separately from the inlet exhaust gas flow. The mixing ratio of the urea–water was set to 32.5% urea and 67.5% water. As for the kinetic trajectory of the droplet, the resistance and inertial force of particles through the discrete phase model (DPM), Saffman lift, linearized instability sheet atomization (LISA) primary atomization model, KHRT secondary atomization model, and evaporation model were all considered [
16].
Table 2 shows the boundary conditions used in the analysis. Immediately after mixing with the exhaust flow in the abnormal state, the aqueous element solution sprayed in the normal state was interpreted assuming an abnormal multiphase flow along with the corresponding exhaust flow.
3. Results
3.1. Difference according to the Shape of the Substrate
As described in the introduction, when designing a single type of aftertreatment system for large generators, it is recommended to apply a system with a square substrate rather than a circular one for manufacturing reasons, since it is necessary to secure a cross-sectional diameter of 762 mm or more according to the specifications. Therefore, since it is expected to show different flow characteristics from the system to which the conventional circular substrate is applied, ammonia flow uniformity was compared at the front of the SCR according to the shape of each substrate to compare the difference in reduction efficiency between the rectangular and circular substrates. The flow area except the porous filter was designed in a circular shape to ensure maximum uniformity, and the urea mixer was designed in front of the injector to evenly mix ammonia in both systems.
First, the distribution of the exhaust flow rate for the system of the square type during 75% load operation was analyzed, and
Figure 3 visually shows the result. The flow velocity distribution is an index that can grasp the characteristics of exhaust flow throughout the system, so it is the first CFD analysis process to be preceded.
As a result of analyzing the flow velocity distribution, the flow velocity increased to about 55 m/s in DOC, and DPF made of porous media decreased to about 27 m/s immediately after passing through the filter, and then turbulent flow was formed by the mixer, and the flow velocity in the reactor section rose again to about 37 m/s. After that, the exhaust flow passes through the SCR composed of 16 square substrates. At this time, the average flow rate is 30 m/s, and then it passes through the outlet without a large change in flow rate.
Figure 4 is an analysis of the flow velocity distribution for the system based on a circular type having the same volume. The average exhaust flow rate is about 17% higher than that of the rectangle type, which is estimated to be due to the difference in flow resistance due to the difference in cross-sectional shape, and analysis through flow uniformity analysis at the front of the SCR according to the cross-sectional shape is necessary. The exhaust flow rates at each part according to the cross-sectional shape of the system are summarized in
Table 3.
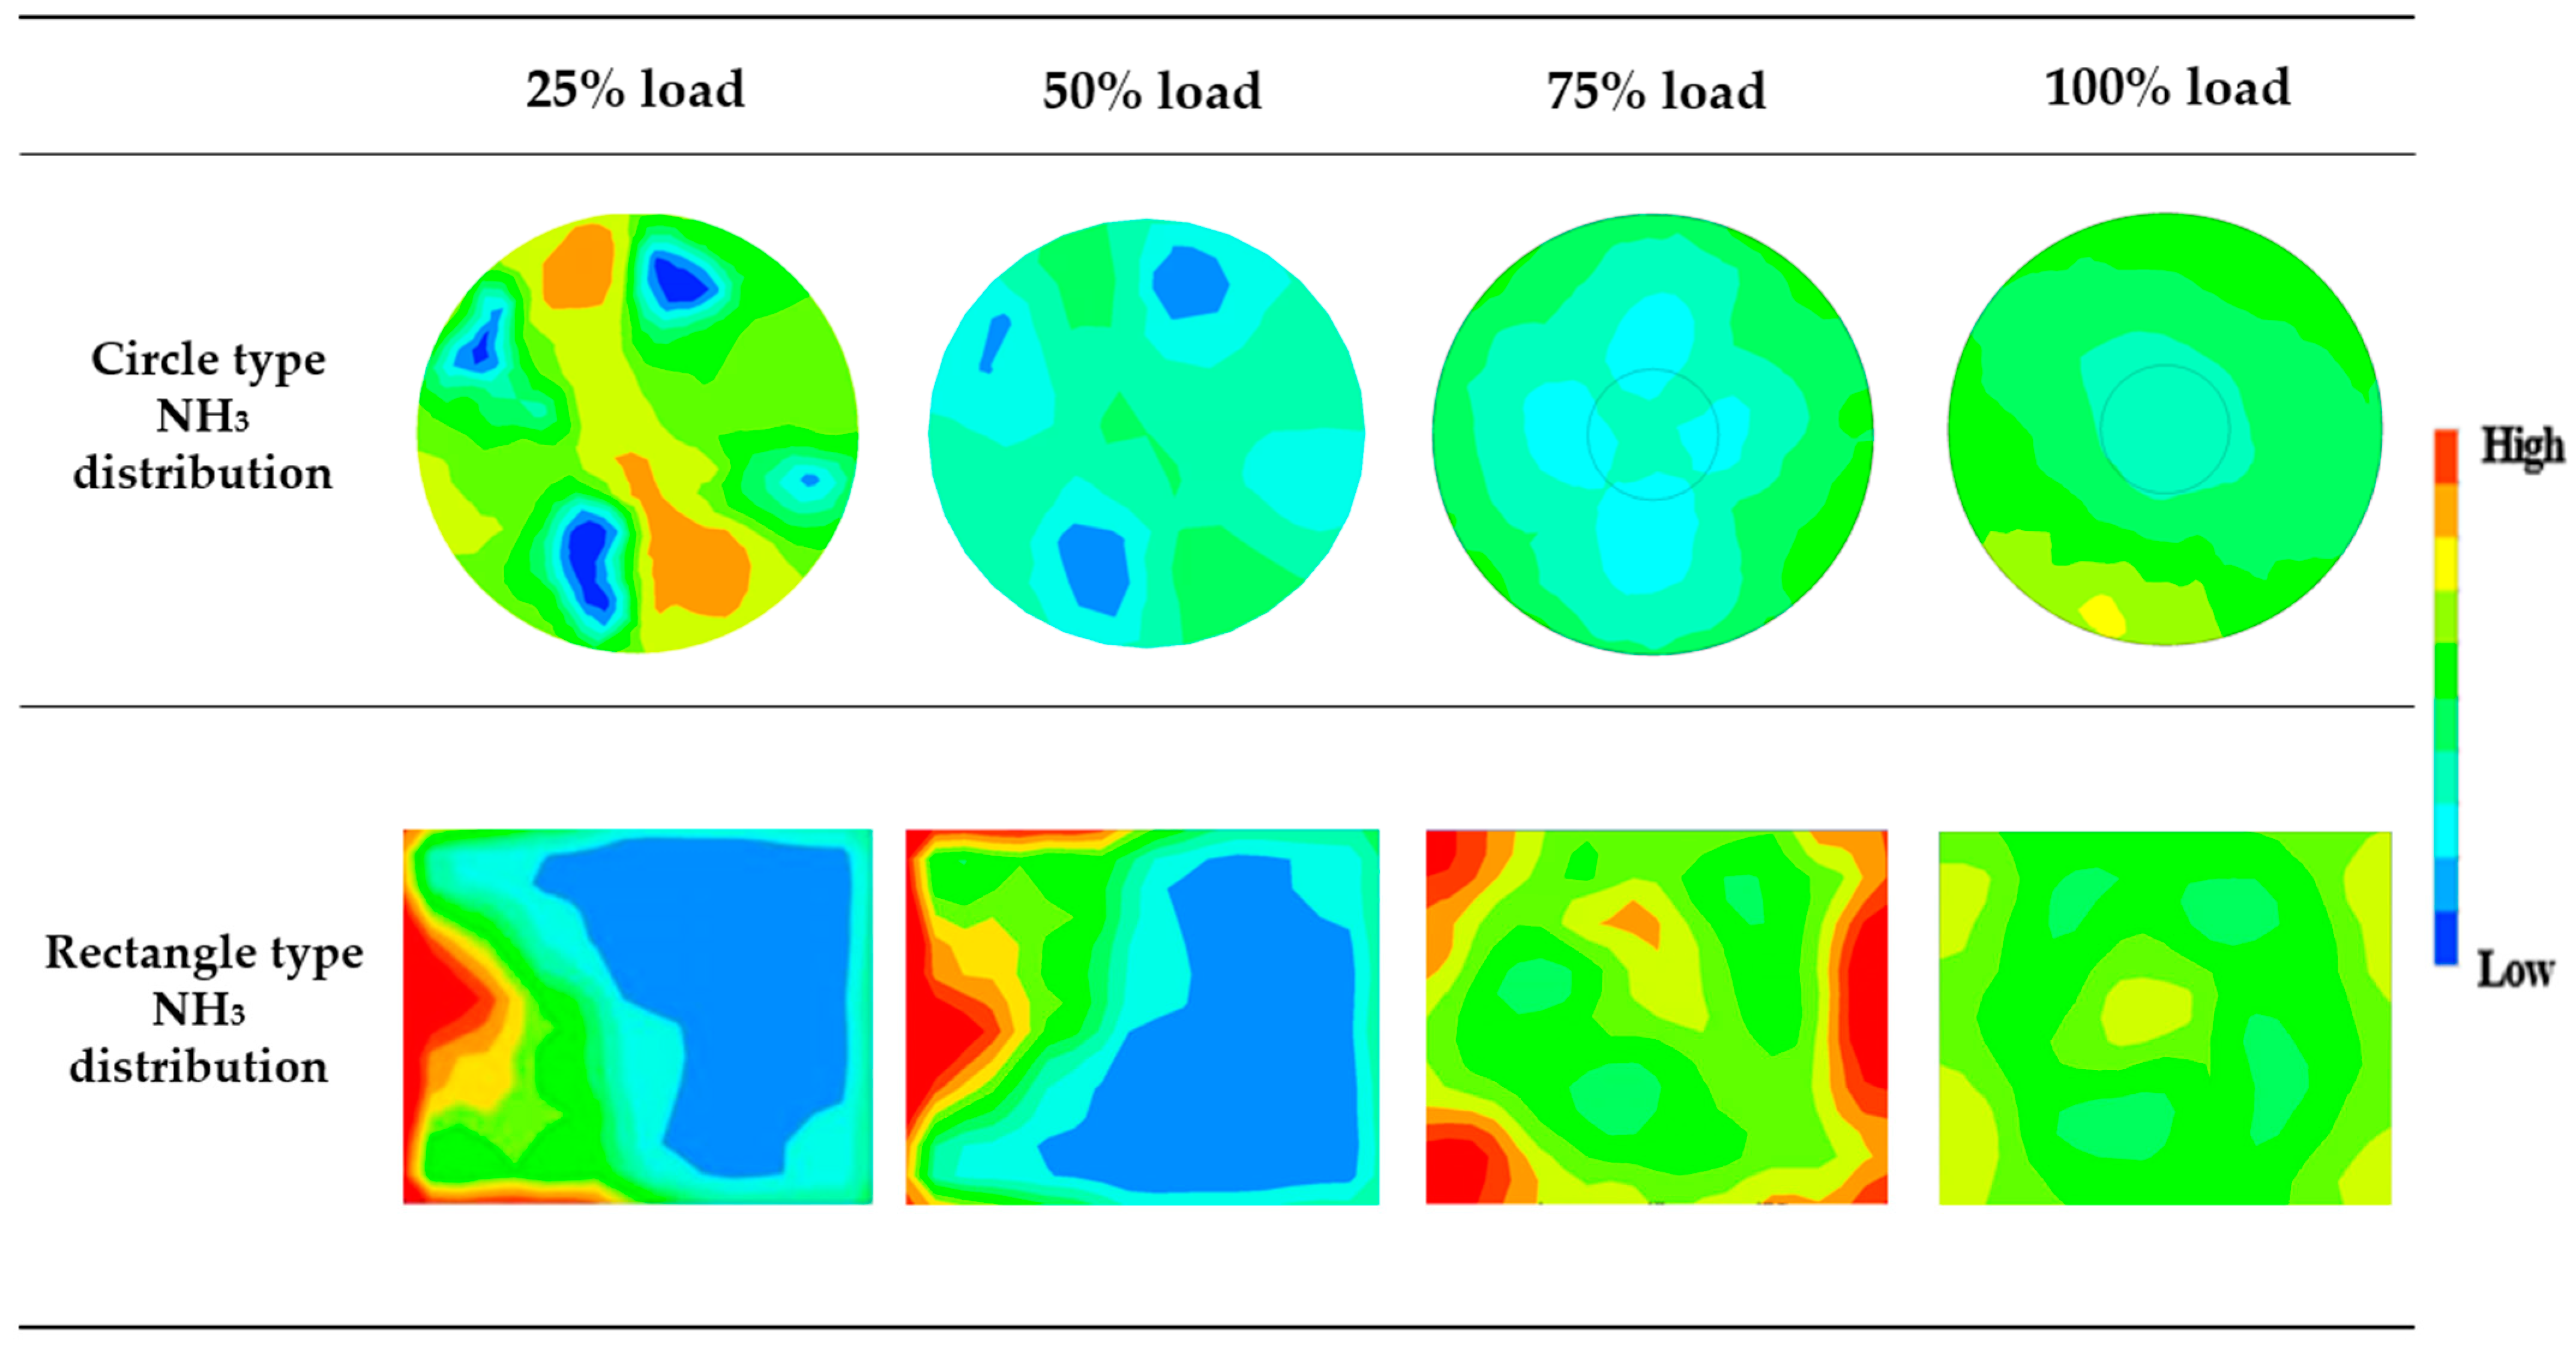
Figure 5 shows the flow distribution at the front of the SCR according to the load condition of the engine by comparing the shape of the substrate. In the case of the rectangular type, under low load, ammonia was not sufficiently distributed on the wall surface due to dead zones generated at the corners when the flow velocity was not sufficiently secured. However, as the load increases, the flow rate increases, and a relatively large amount of ammonia is distributed well to the wall surface.
In the case of the circular type, there are no dead zones that are severely restricted by the flow such as with the rectangular type, so a relatively even distribution is shown, but when the flow velocity increases as the load increases, a phenomenon where a part of ammonia is locally concentrated on the wall surface appears. This can be seen as a result of relatively stagnant ammonia flow near the wall due to the result that the influence of friction acting on the wall increases with the increase of the flow velocity. The phenomenon where the ammonia concentration becomes thicker shows the effect of suppressing the SCR reaction, and thus shows a relatively low de-NO
X performance in this region [
18].
As a result of this, when the load is increased, the flow uniformity of both the rectangle and the circle type are improved, but the amount of improvement is relatively larger for the rectangle substrate than for the circle type. That is, when the flow rate is not sufficient, the flow congestion according to the dead zone is large. However, as the flow velocity increases, the fluid congestion intensity according to the dead zone decreases rapidly to a negligible level compared to the typical wall friction loss, resulting in a significant improvement in overall ammonia uniformity.
Figure 6 is a graph comparing front-SCR ammonia flow uniformity for the rectangle and circular type for each load.
In this figure, a circular substrate is advantageous in terms of reduction efficiency under conditions of relatively low flow rate and low load, but it is difficult to see that a large difference in efficiency occurs between the two substrates in a high-load area with a large flow rate. Therefore, in the case of an emergency generator operating in a high-load range of 75 to 100%, it is desirable to introduce aftertreatment system using a rectangle type in consideration of the ease of production and reduction efficiency of the substrates.
3.2. Difference according to the Injector Locations
Ammonia distribution at the front of SCR, according to the location and direction of urea injection, was examined. The urea injection location is a variable that directly affects flow uniformity because it determines the residence time and ammonia production location of urea. Therefore, it is necessary to derive an optimal injection position capable of minimizing the pressure loss and minimizing the loss due to the dead zone occurring at the corner of the rectangle type. In the basic design, a 45-degree standard mixer is mounted on the front-SCR, which promotes mixing of Urea more uniformly. In this study, the change in ammonia distribution characteristics was analyzed by changing the location and direction of the urea injector.
Four cases were interpreted: Case 1, where the injector is located as close as possible, Case 2, where the injector is located relatively far from the mixer, Case 3, where the positions of the mixer and the injector are reversed, and Case 4, where the injection direction is set as opposite to exhaust flow.
Figure 7 summarizes the distribution of front-SCR ammonia by arrangement case of each urea injector for circular and rectangle systems.
Figure 8 shows the comparison of flow uniformity and back pressure characteristics according to the urea injector position for circular and rectangle systems. As a result of Case 1, it is observed that ammonia is distributed unevenly overall. That is, although turbulence was formed by a mixer mounted on the front end of the injector, a distance between the expansion tube and the injector was relatively close; thus, even distribution was not generated, and ammonia distribution was locally rich. As in Case 2, when the injector is positioned farther from the mixer and closer to the SCR front end, the turbulence formation effect by the mixer is reduced, and the sprayed urea does not sufficiently reach the dead zone; thus, ammonia distribution is significantly concentrated in the center. As a result, the lowest flow uniformity value was shown. However, the low back pressure was recorded, relatively.
In Case 3, where the injector is set to a reverse direction facing the exhaust flow direction, an aqueous element solution sprayed in the reverse direction meets turbulent exhaust flow formed by a mixer and is mixed fast, thereby improving in terms of ammonia distribution. Resistance is generated in the process of meeting the exhaust flow and the flow rate of the aqueous element solution in opposite directions, leading to a decrease in the flow rate and an increase in back pressure, but the flow uniformity is greatly improved.
Lastly, Case 4, in which a mixer is positioned at the rear end of the injector, the sprayed urea–water mixture is directly mixed by the mixer, and efficient mixing occurs at the front end of the SCR. However, due to the stagnation of some ammonia in the dead zone, the back pressure was lower than Case 3, but the uniformity was relatively low. Therefore, considering the increase in flow uniformity, Case 3, which sprays urea in the reverse direction to exhaust flow, can be seen as the most efficient arrangement. If the urea injector is installed in the reverse direction, the back pressure may increase compared to the initial model, and thus the power may be partially degraded, but NH3 and the exhaust gas are much more evenly mixed in the exhaust pipe, hence raising the reduction efficiency of NOX to a high level.
3.3. Difference by SCR Diffuser Angle
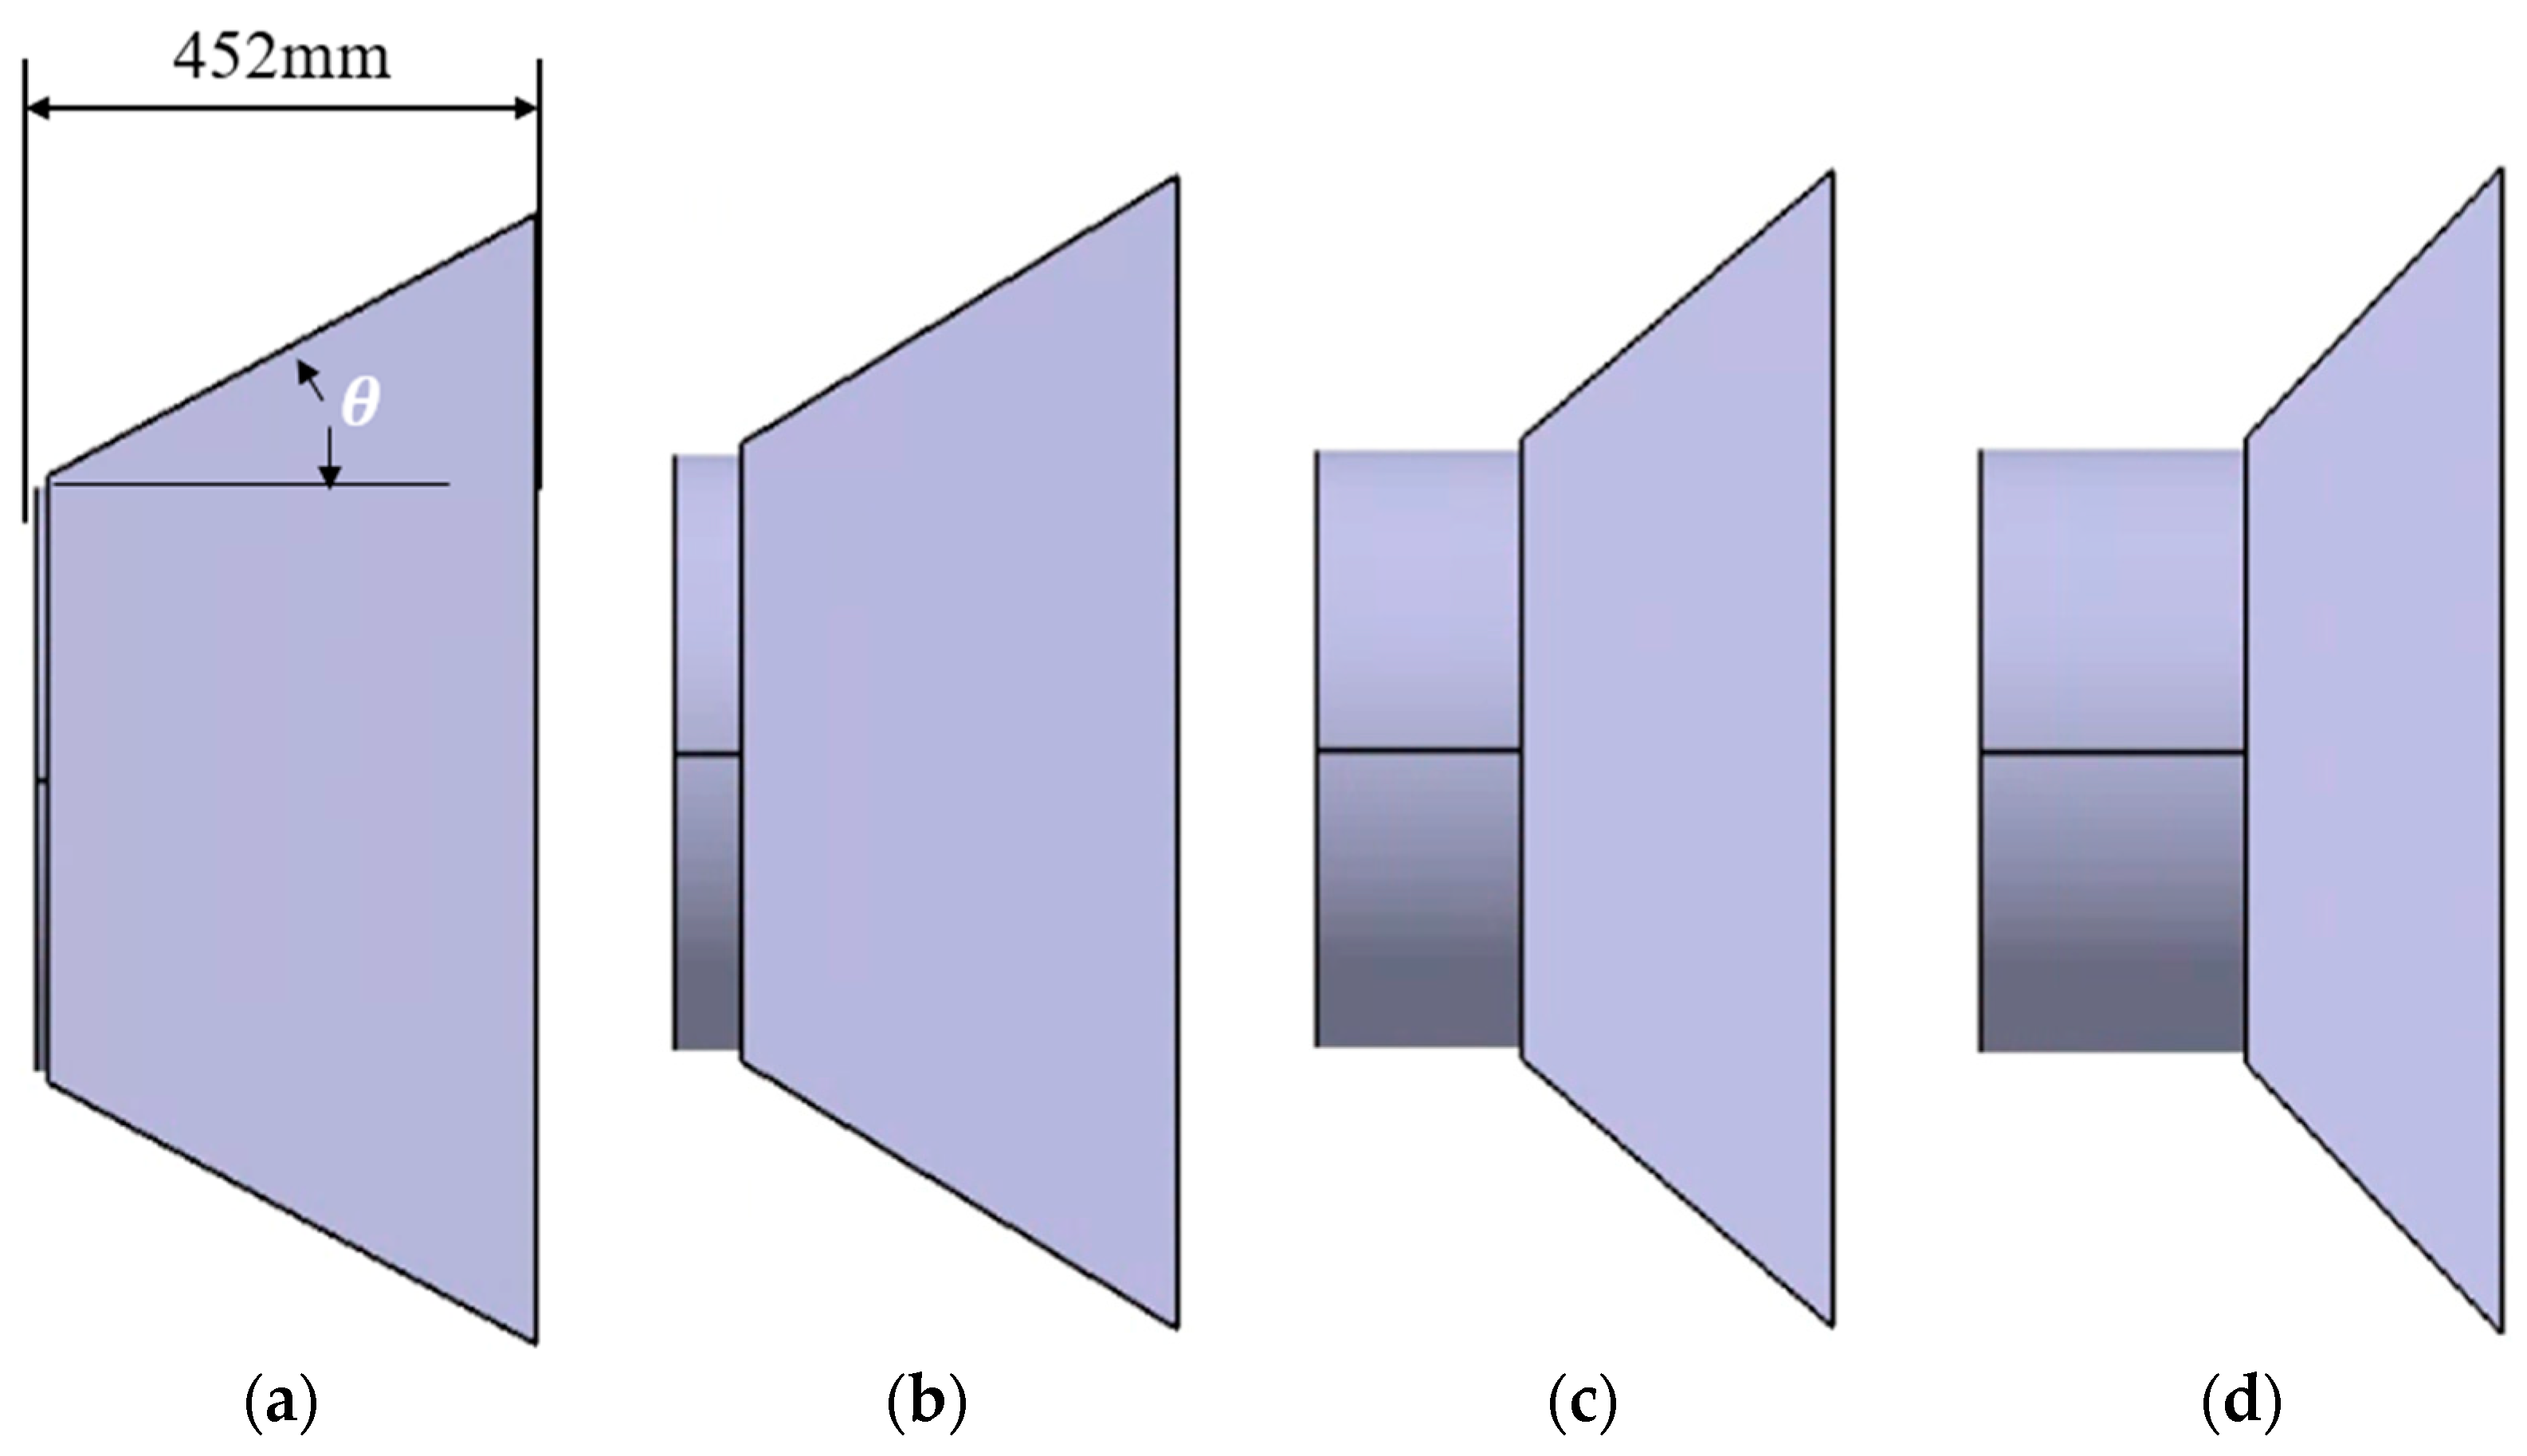
The diffuser provided at the front end of the SCR is provided for even distribution of ammonia by maximizing static pressure, which is a pressure acting in a direction perpendicular to the flow of the fluids. However, as the flow phenomenon occurs due to the difference in area between the inlet of the diffuser and the front end of the SCR catalyst, the flow velocity decreases rapidly, and in this process, secondary loss of flow occurs. Therefore, it is important to find an optimal angle to maximize ammonia flow uniformity while minimizing flow loss by analyzing the flow distribution according to the angle of the diffuser angle. To see the effect of the diffuser angle on the efficiency of the system, the total length of the entire system was fixed, and the magnifying tube angle was changed to 25°, 30°, 35°, and 40°.
Figure 9 shows the enlarged diffuser angle model for numerical analysis, and the overall length of each model is the same.
Figure 10 shows the change in flow uniformity and back pressure according to the enlarged tube angle. The change in flow uniformity according to the increase in angle appeared irregularly, but in the case of back pressure, it gradually improves. The diffuser angle showing the highest flow uniformity is 30°.
The reason why the pressure drop due to the increase in the angle of the magnifying tube is not significant is that the recirculation flow of local ammonia occurred due to the flow-peeling phenomenon, leading to an inverse pressure gradient phenomenon.
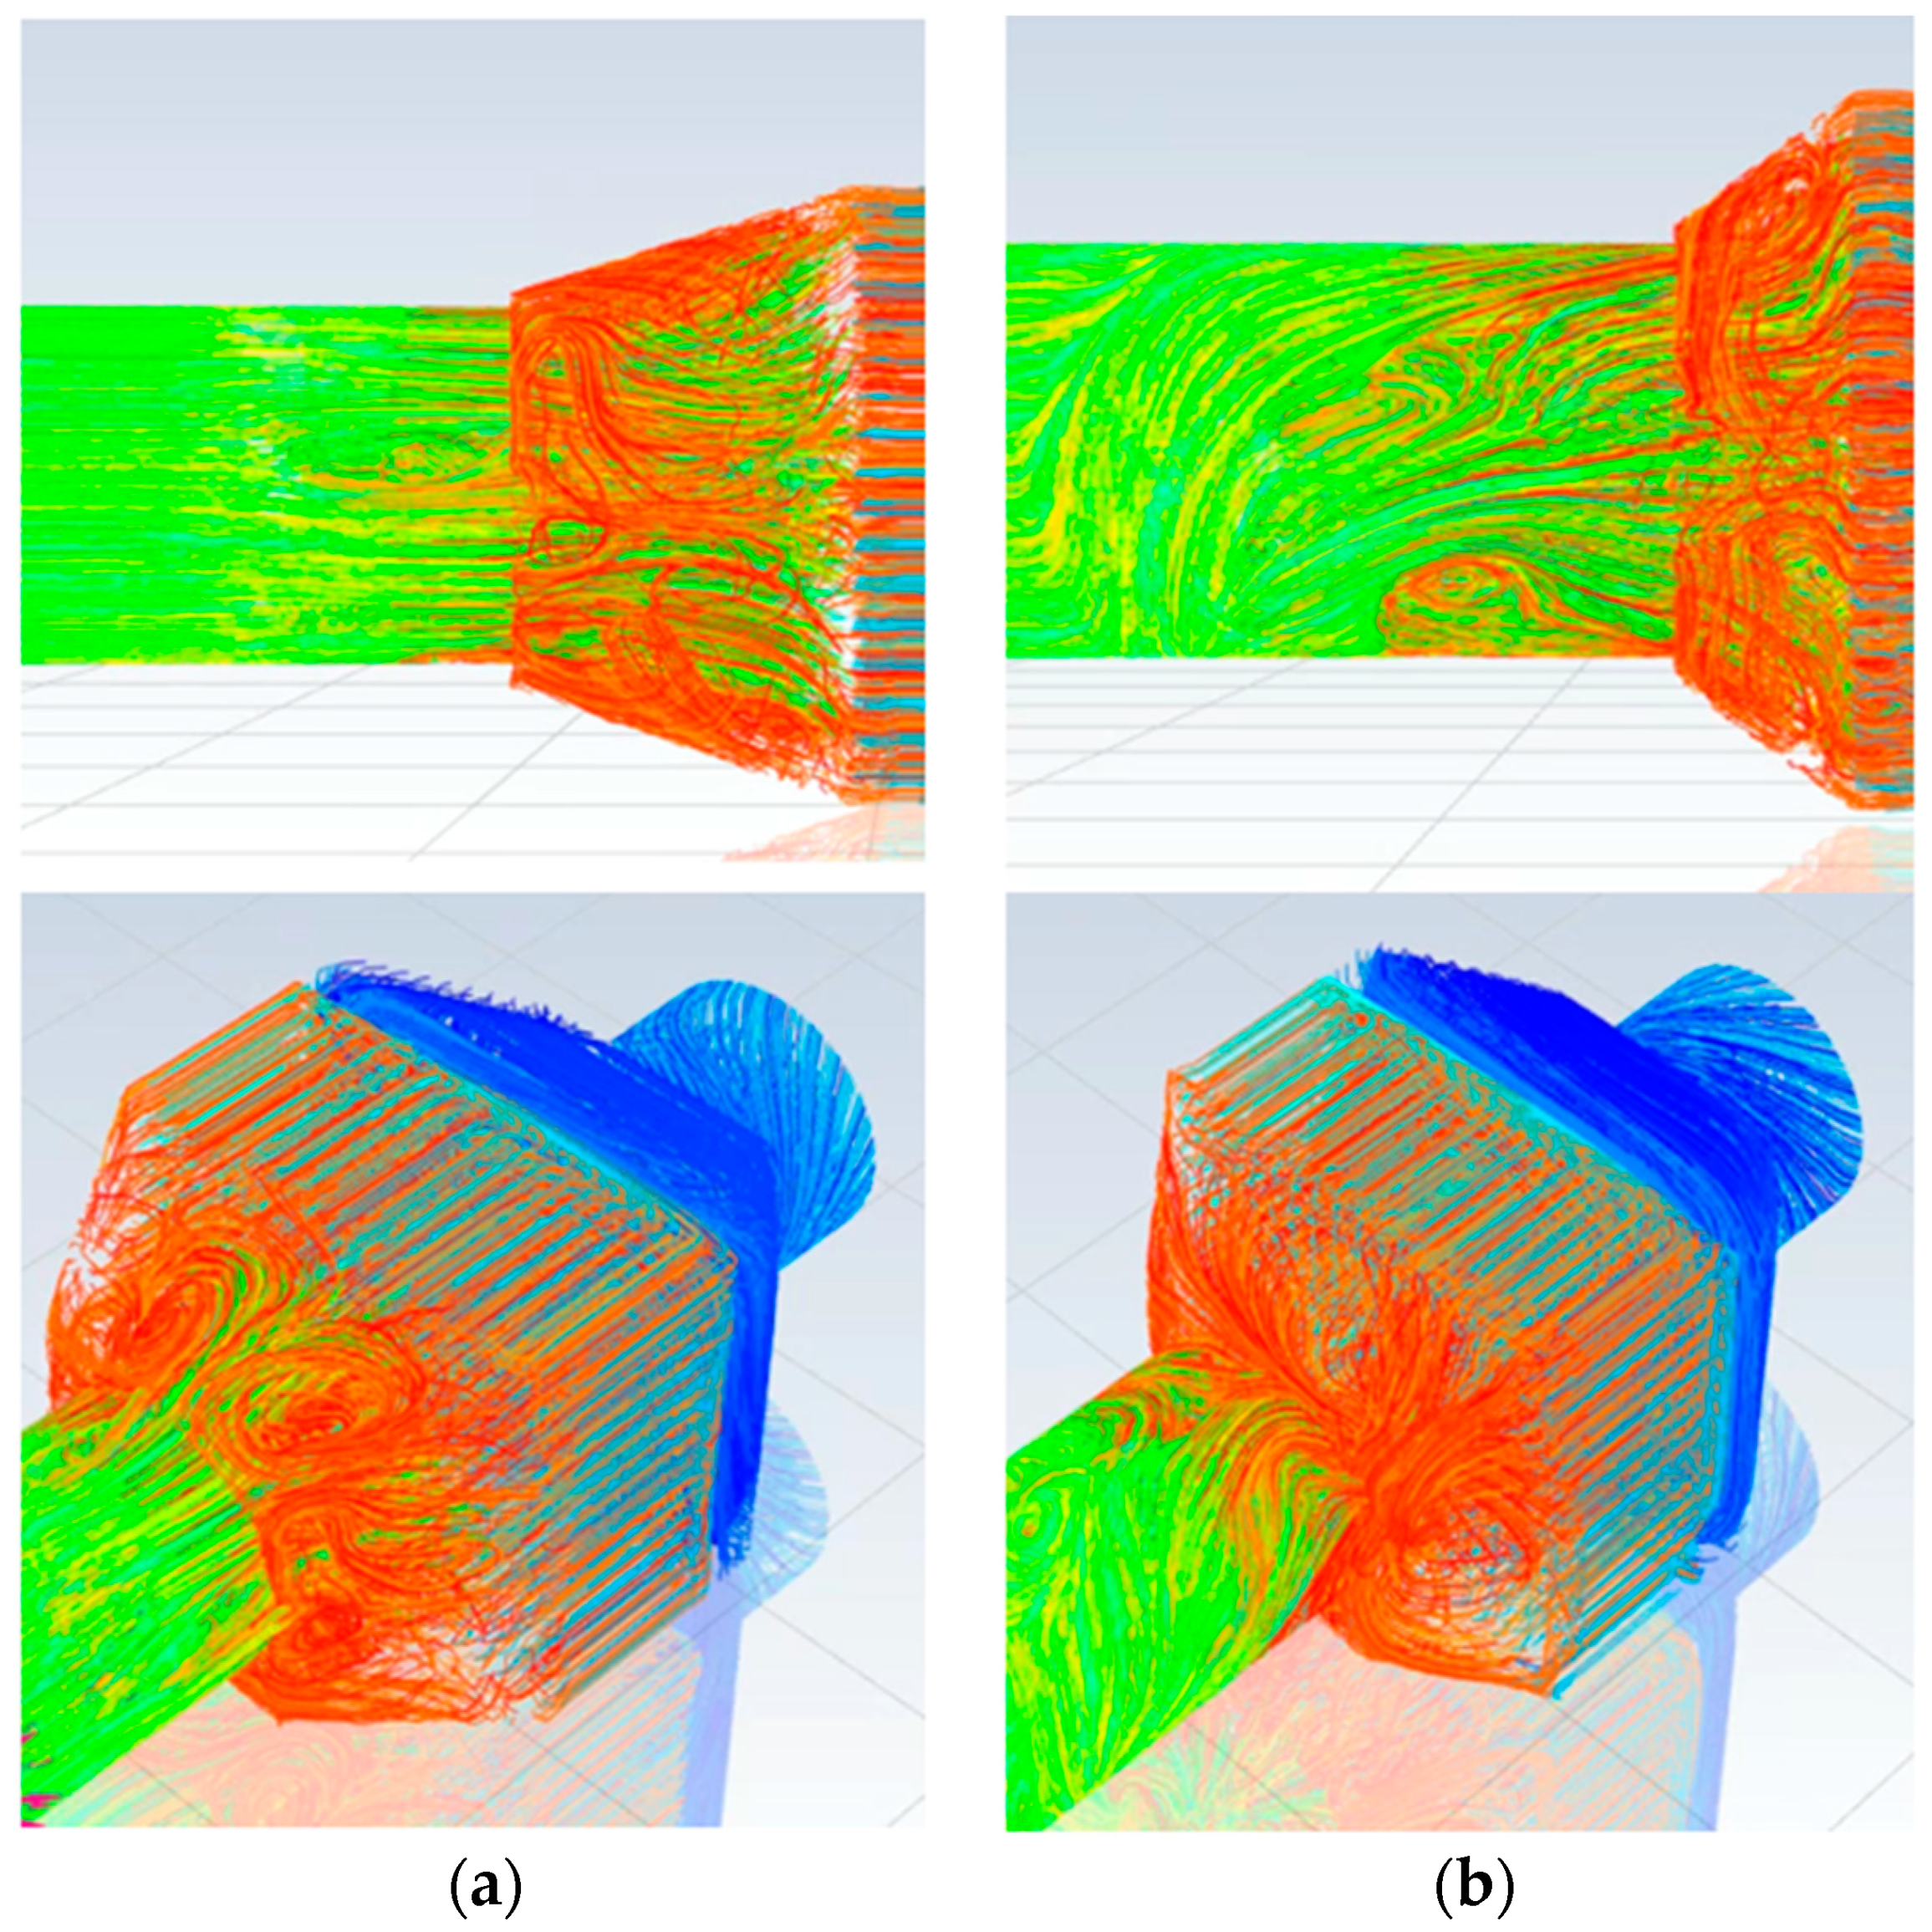
Figure 11 shows the difference in streamline for the 25° and 40° magnifying tube models, respectively. The area marked with the red circle is the area where the recirculation flow is generated, which appears stronger as the magnifying tube angle increases. If the angle of the enlarged tube is more than 40°, the reverse flow rate occurs due to flow delamination, and recirculation occurs from the reactor area, and even after some urea is converted into ammonia, it does not flow into SCR and stagnates. As a result, the average flow rate also decreased.
In other words, when designing at an appropriate angle, the diffuser can induce static pressure to increase flow uniformity, but if the flow rate decreases by more than a certain angle, and recirculation of the flow occurs around the dead zone due to the flow phenomenon, this causes the flow uniformity to decrease again.
3.4. Difference according to Filter Porosity
To increase the efficiency of flow analysis, filters such as DOC and DPF are set to porous media, where the porosity value becomes a major variable [
19,
20].
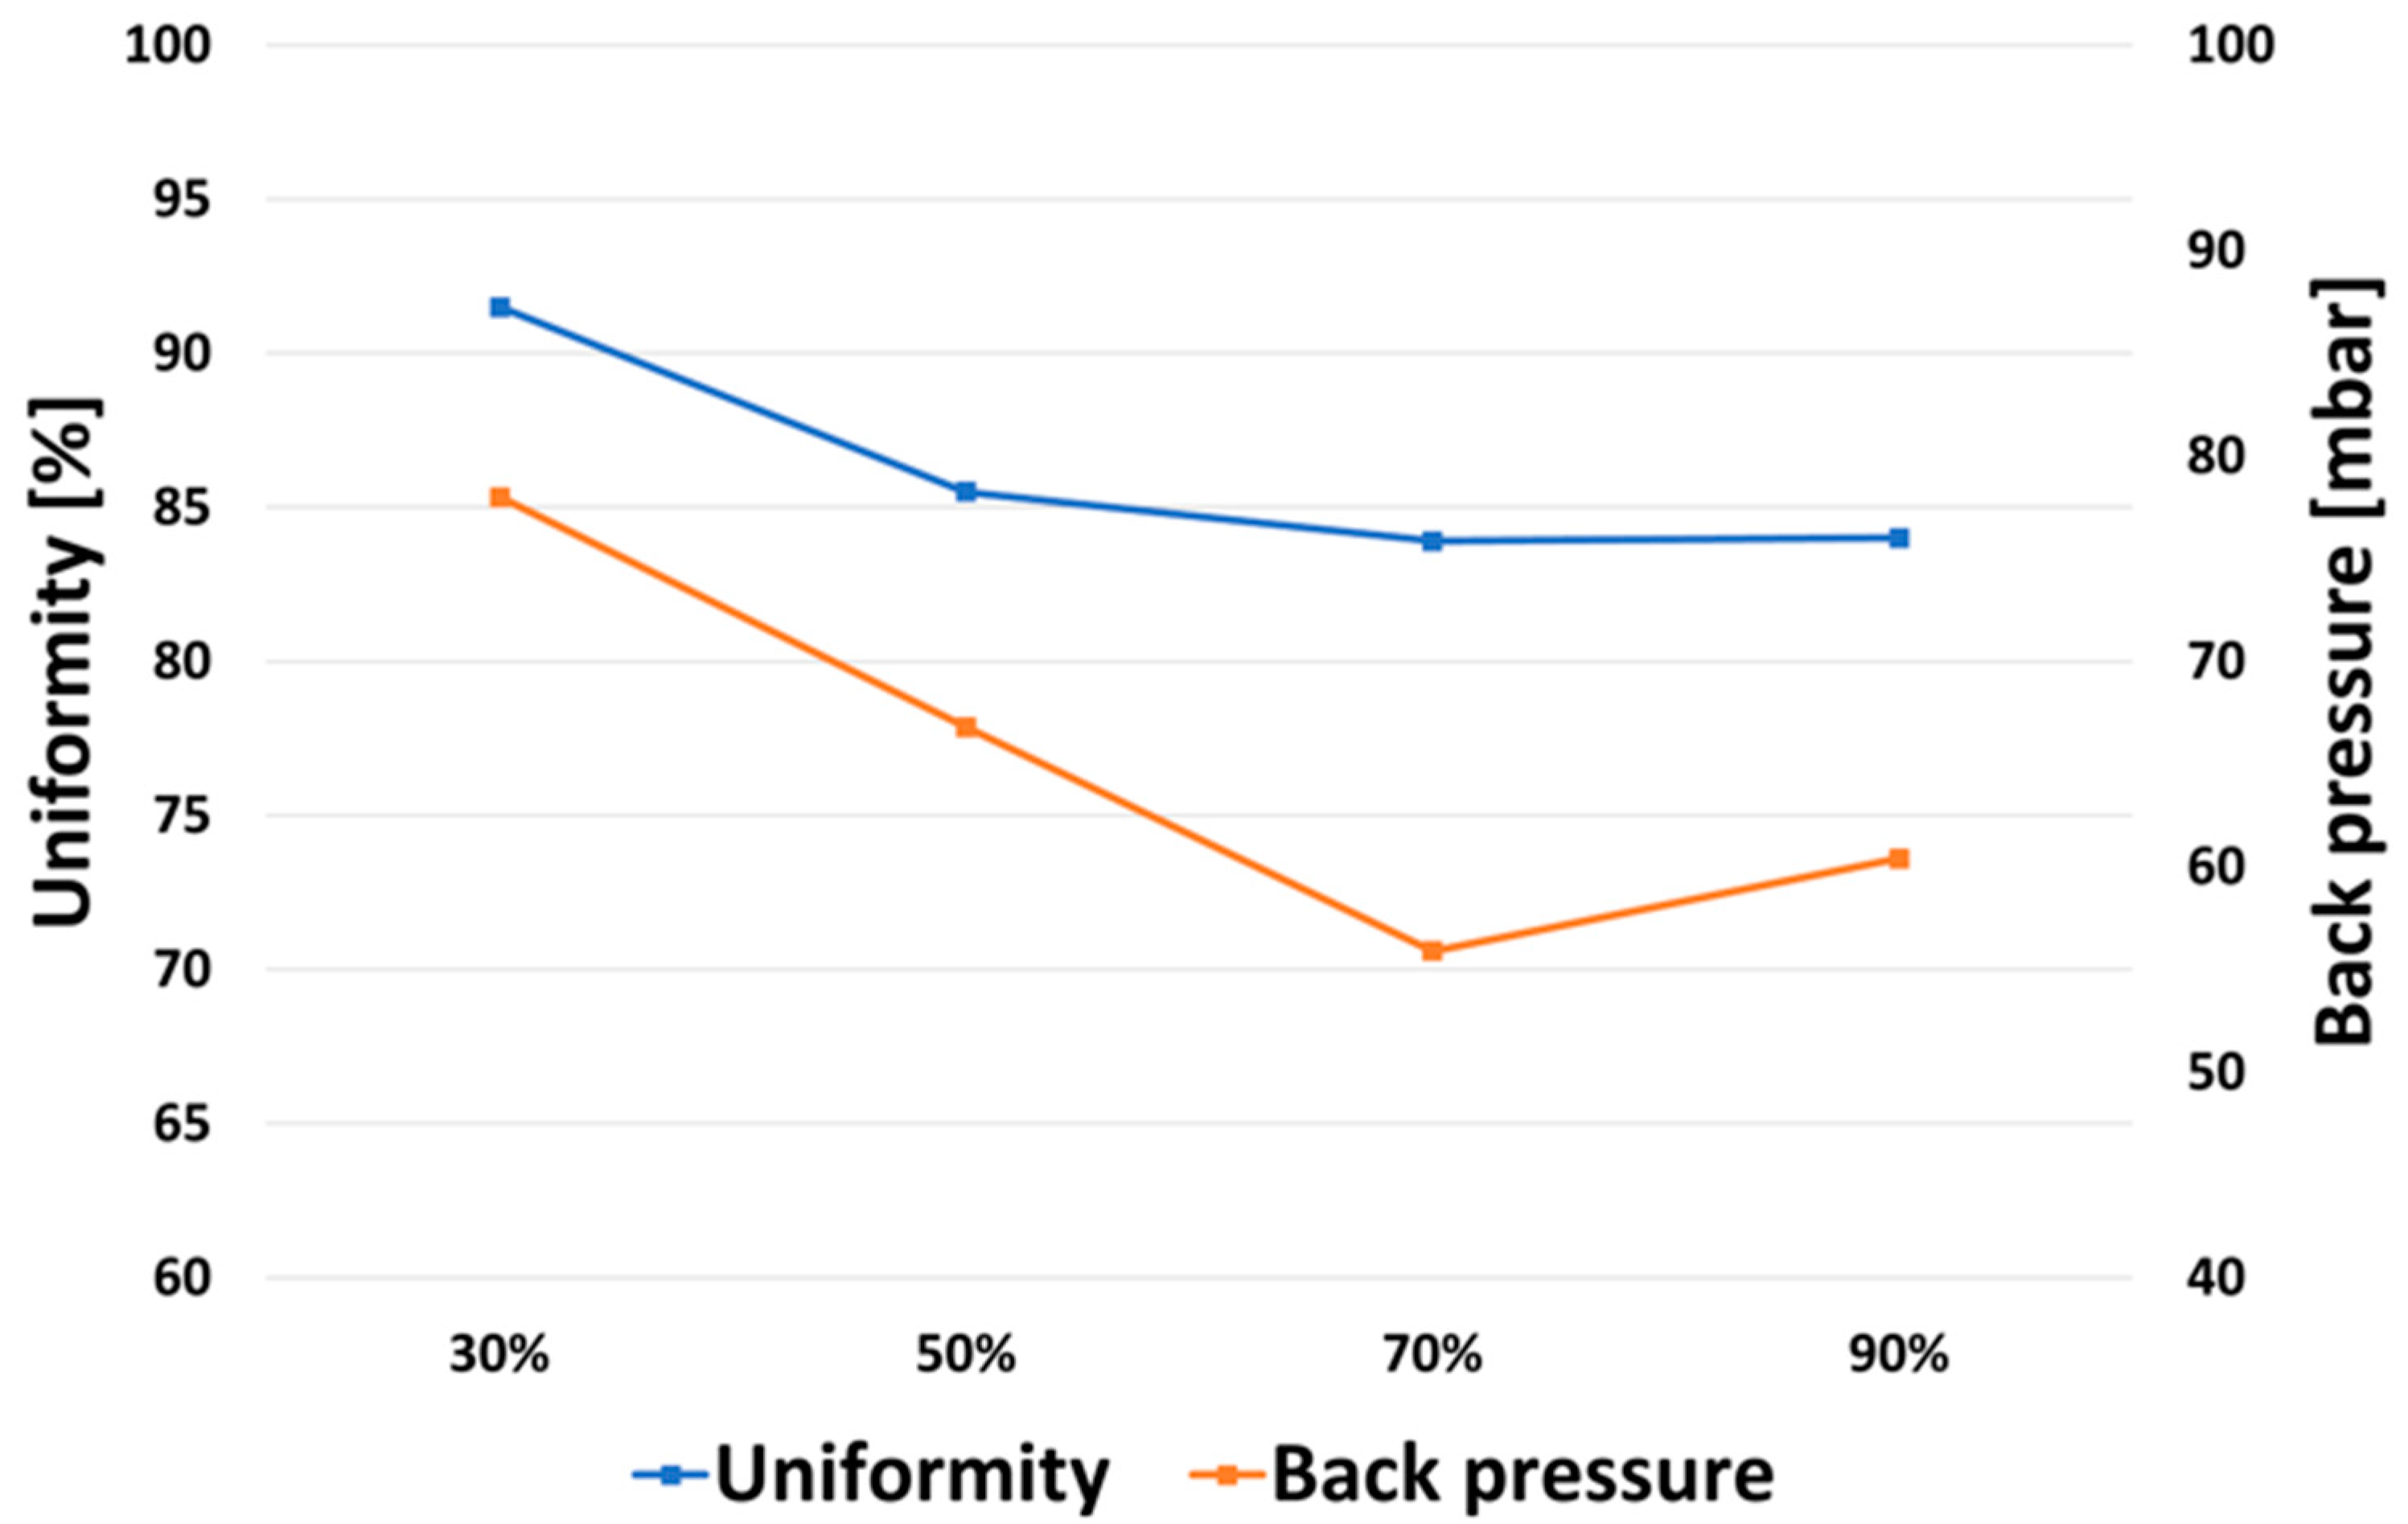
This study analyzed how the change in porosity affects back pressure and flow uniformity under the same conditions by setting the pore size and wall thickness as fixed values and setting only the porosity as variables. Since a typical DPF substrate has a porosity of around 40% and SCR has a porosity of about 70%, the porosity of DPF is increased to 30%, 50%, 70%, and 90% based on an average porosity of 50%, and changes in flow uniformity and back pressure are found.
Figure 12 shows the change in flow uniformity and back pressure according to the change in porosity of DPF. As the porosity increases under the same conditions, the exhaust flow resistance generated when passing through the channel of the filter decreases and the back pressure decreases. At the same time, as the porosity increases, the flow uniformity tends to decrease.
Figure 13 compares the distribution of SCR shear ammonia according to porosity, and it was found that if the porosity was greater than 70%, the flow distribution characteristics deteriorated. When the porosity is increased to a predetermined level or more, the reason why the flow characteristic is decreased may be found in a relationship between the superficial velocity (SV) passing through the porous medium and the porosity. The velocity refers to the approximate average speed of a fluid flowing through a porous medium such as a catalyst layer. It is mentioned in the Darcy–Weisbach equation that deals with fluid flow inside porous media, and the superficial velocity,
v, is defined as follows.
That is, the velocity v is a value proportional to the volume flow rate and is inversely proportional to the catalyst cross-sectional area and porosity, and the flow speed decreases as the porosity increases. This is because an increase in porosity increases the available area of the total cross-sectional area, resulting in an increase in the flow area.
For this reason, when the porosity increases, the flow rate decreases, and the back pressure level also decreases, but when the porosity exceeds 90%, the back pressure rises again. This is because ammonia stagnation occurred in the dead zone due to excessive reduction in flow velocity.
3.5. Verifying CFD Results Accuracy
The Korea Automotive Technology Institute (Katech) manufactured a prototype, as shown in
Figure 14, for the basic design of a circle-type system, and measured the total back pressure. And we compared the values of CFD and experimental total back pressure, as shown in
Table 4. The back pressure measurement showed an error of 2.83% between the flow analysis result and the actual experimental result, which can be considered to be a good deviation considering that detailed shapes such as the urea injection system were not reflected in the analysis model.
In addition, the degree of convergence through repeated analysis was monitored. In order to obtain the optimal analysis quality, up to 3000 iterations were conducted for each analysis model. Residual values of major analysis results, such as mesh quality, three-axis velocity, energy, k, and epsilon values, were monitored. In general, when the residual value is stabilized below 10−4, it can be determined that there is little variation due to repetitive analysis and the degree of convergence is good. In this analysis study, a residuals value of 10−6 or less was obtained, and it was confirmed that the degree of convergence according to repeated analysis was very good.


