
Analysis of the Effect of the Tool Shape on the Performance of Pre-Cutting Machines during Tunneling Using Linear Cutting Tests


Abstract
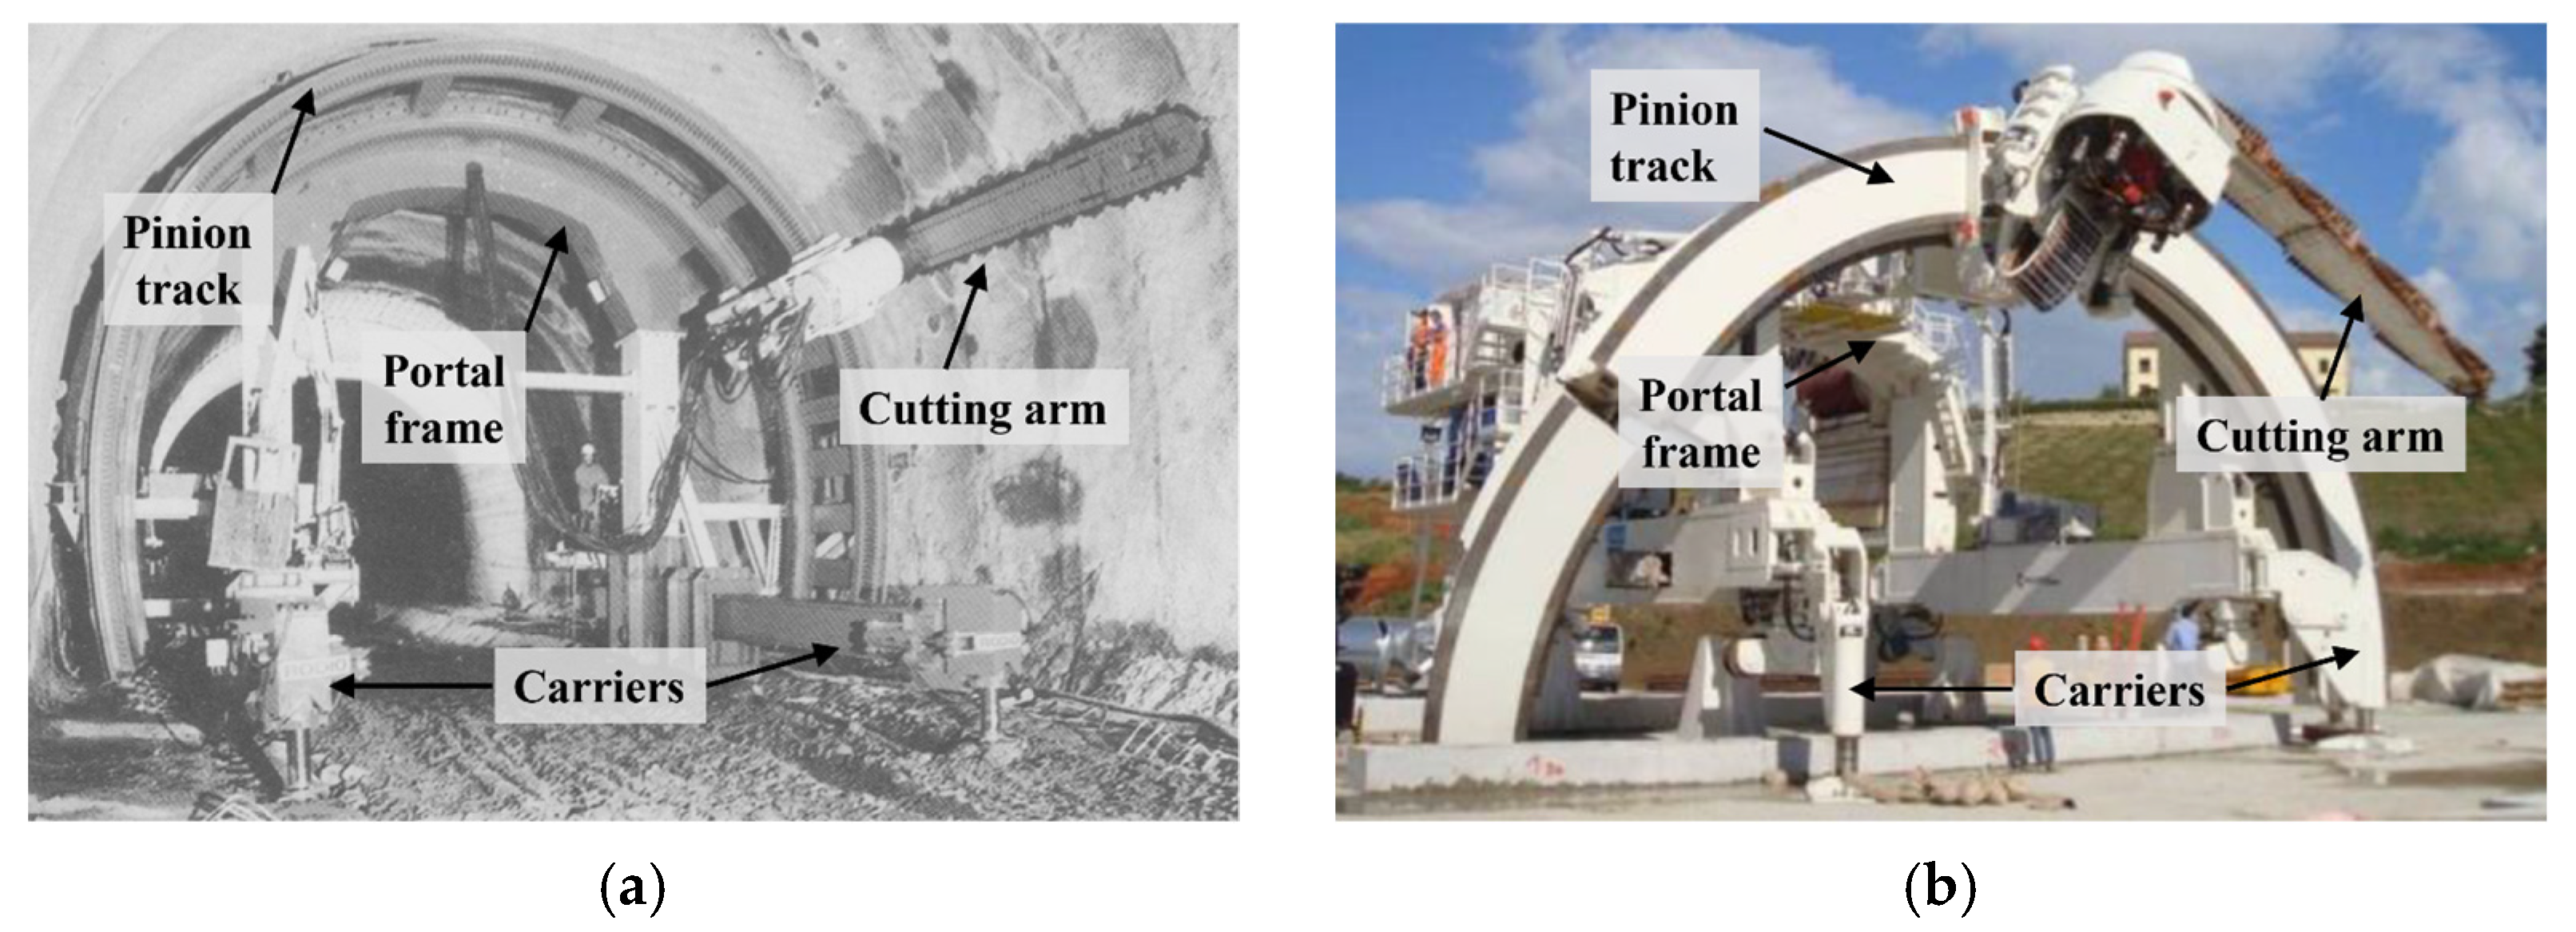
:1. Introduction
2. Materials and Methods
2.1. Linear Cutting Machine
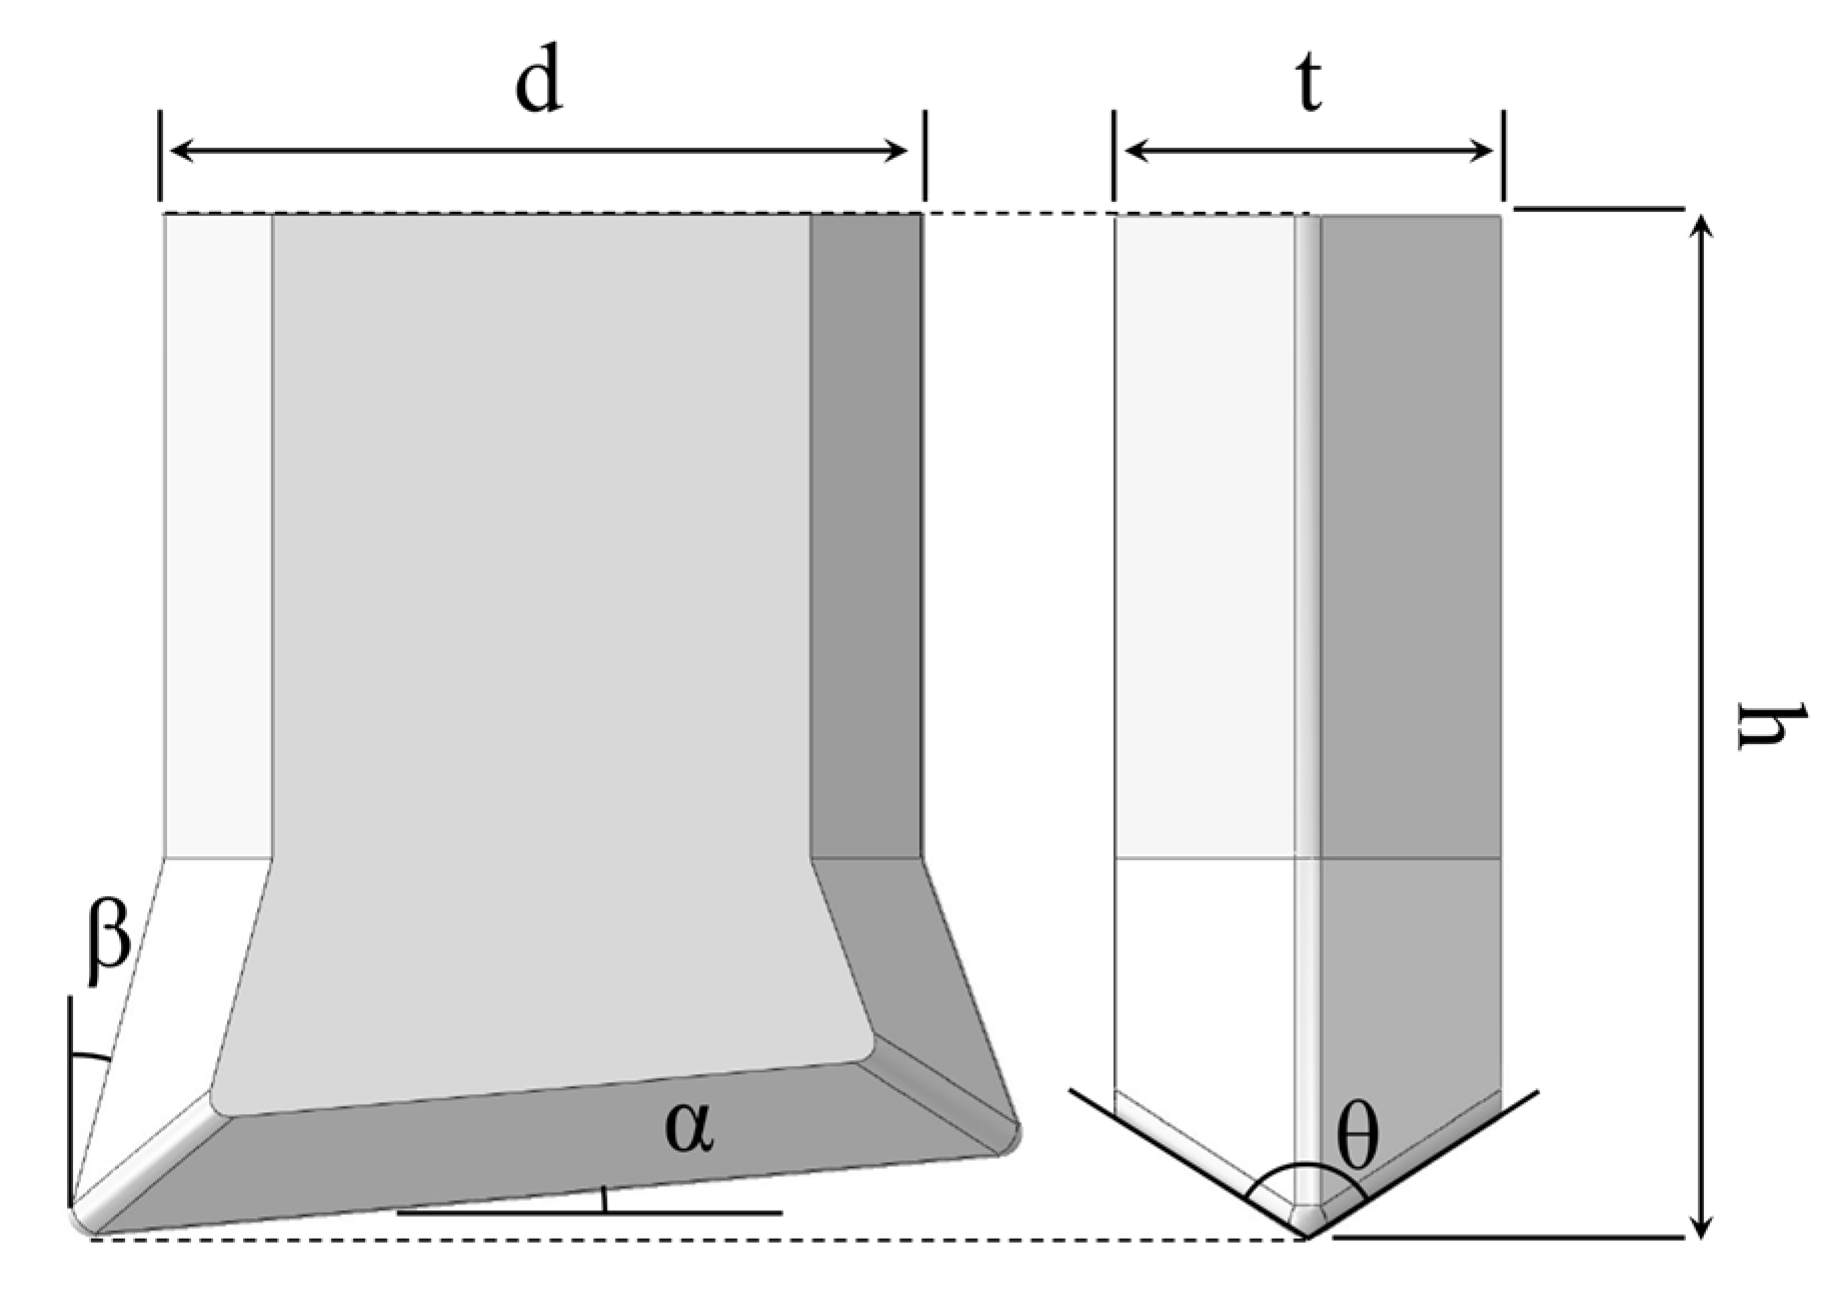
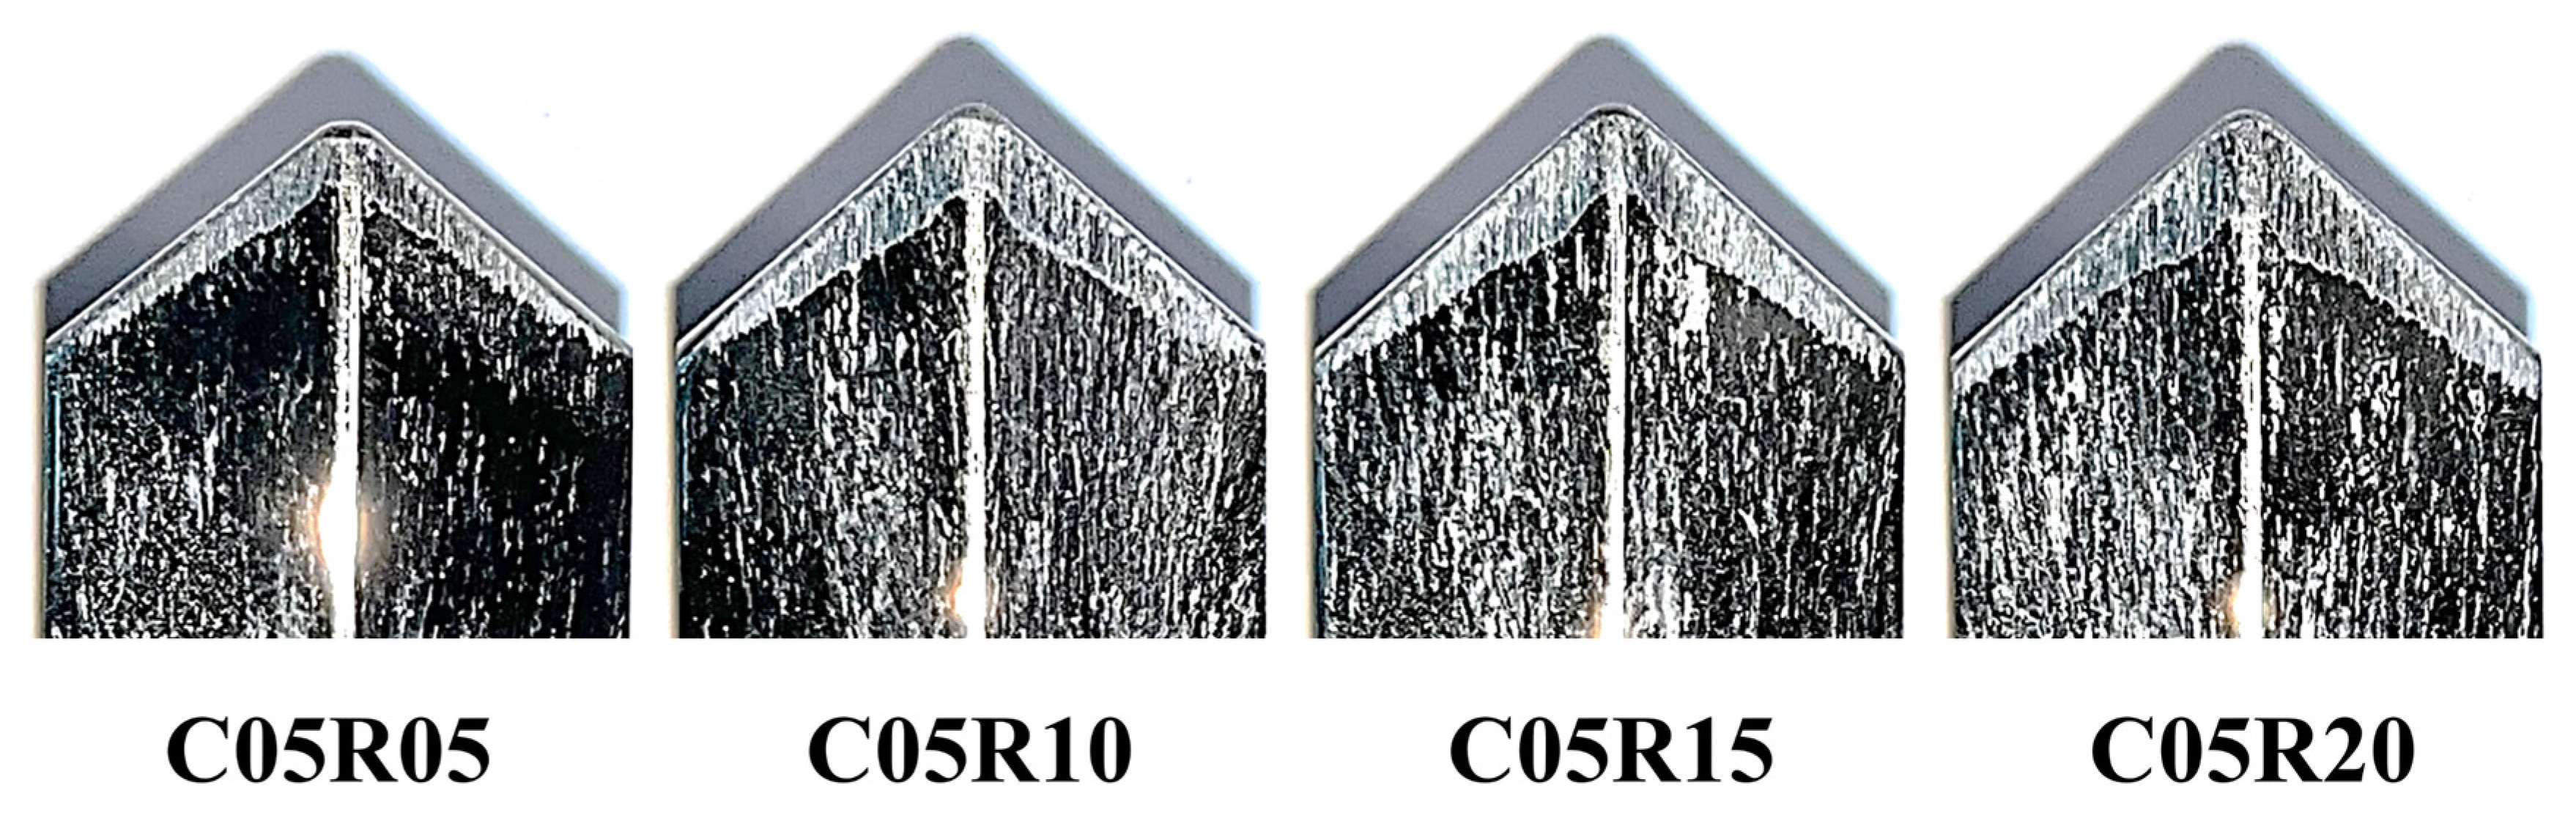
2.2. Cutting Tool of the Pre-Cutting Machine
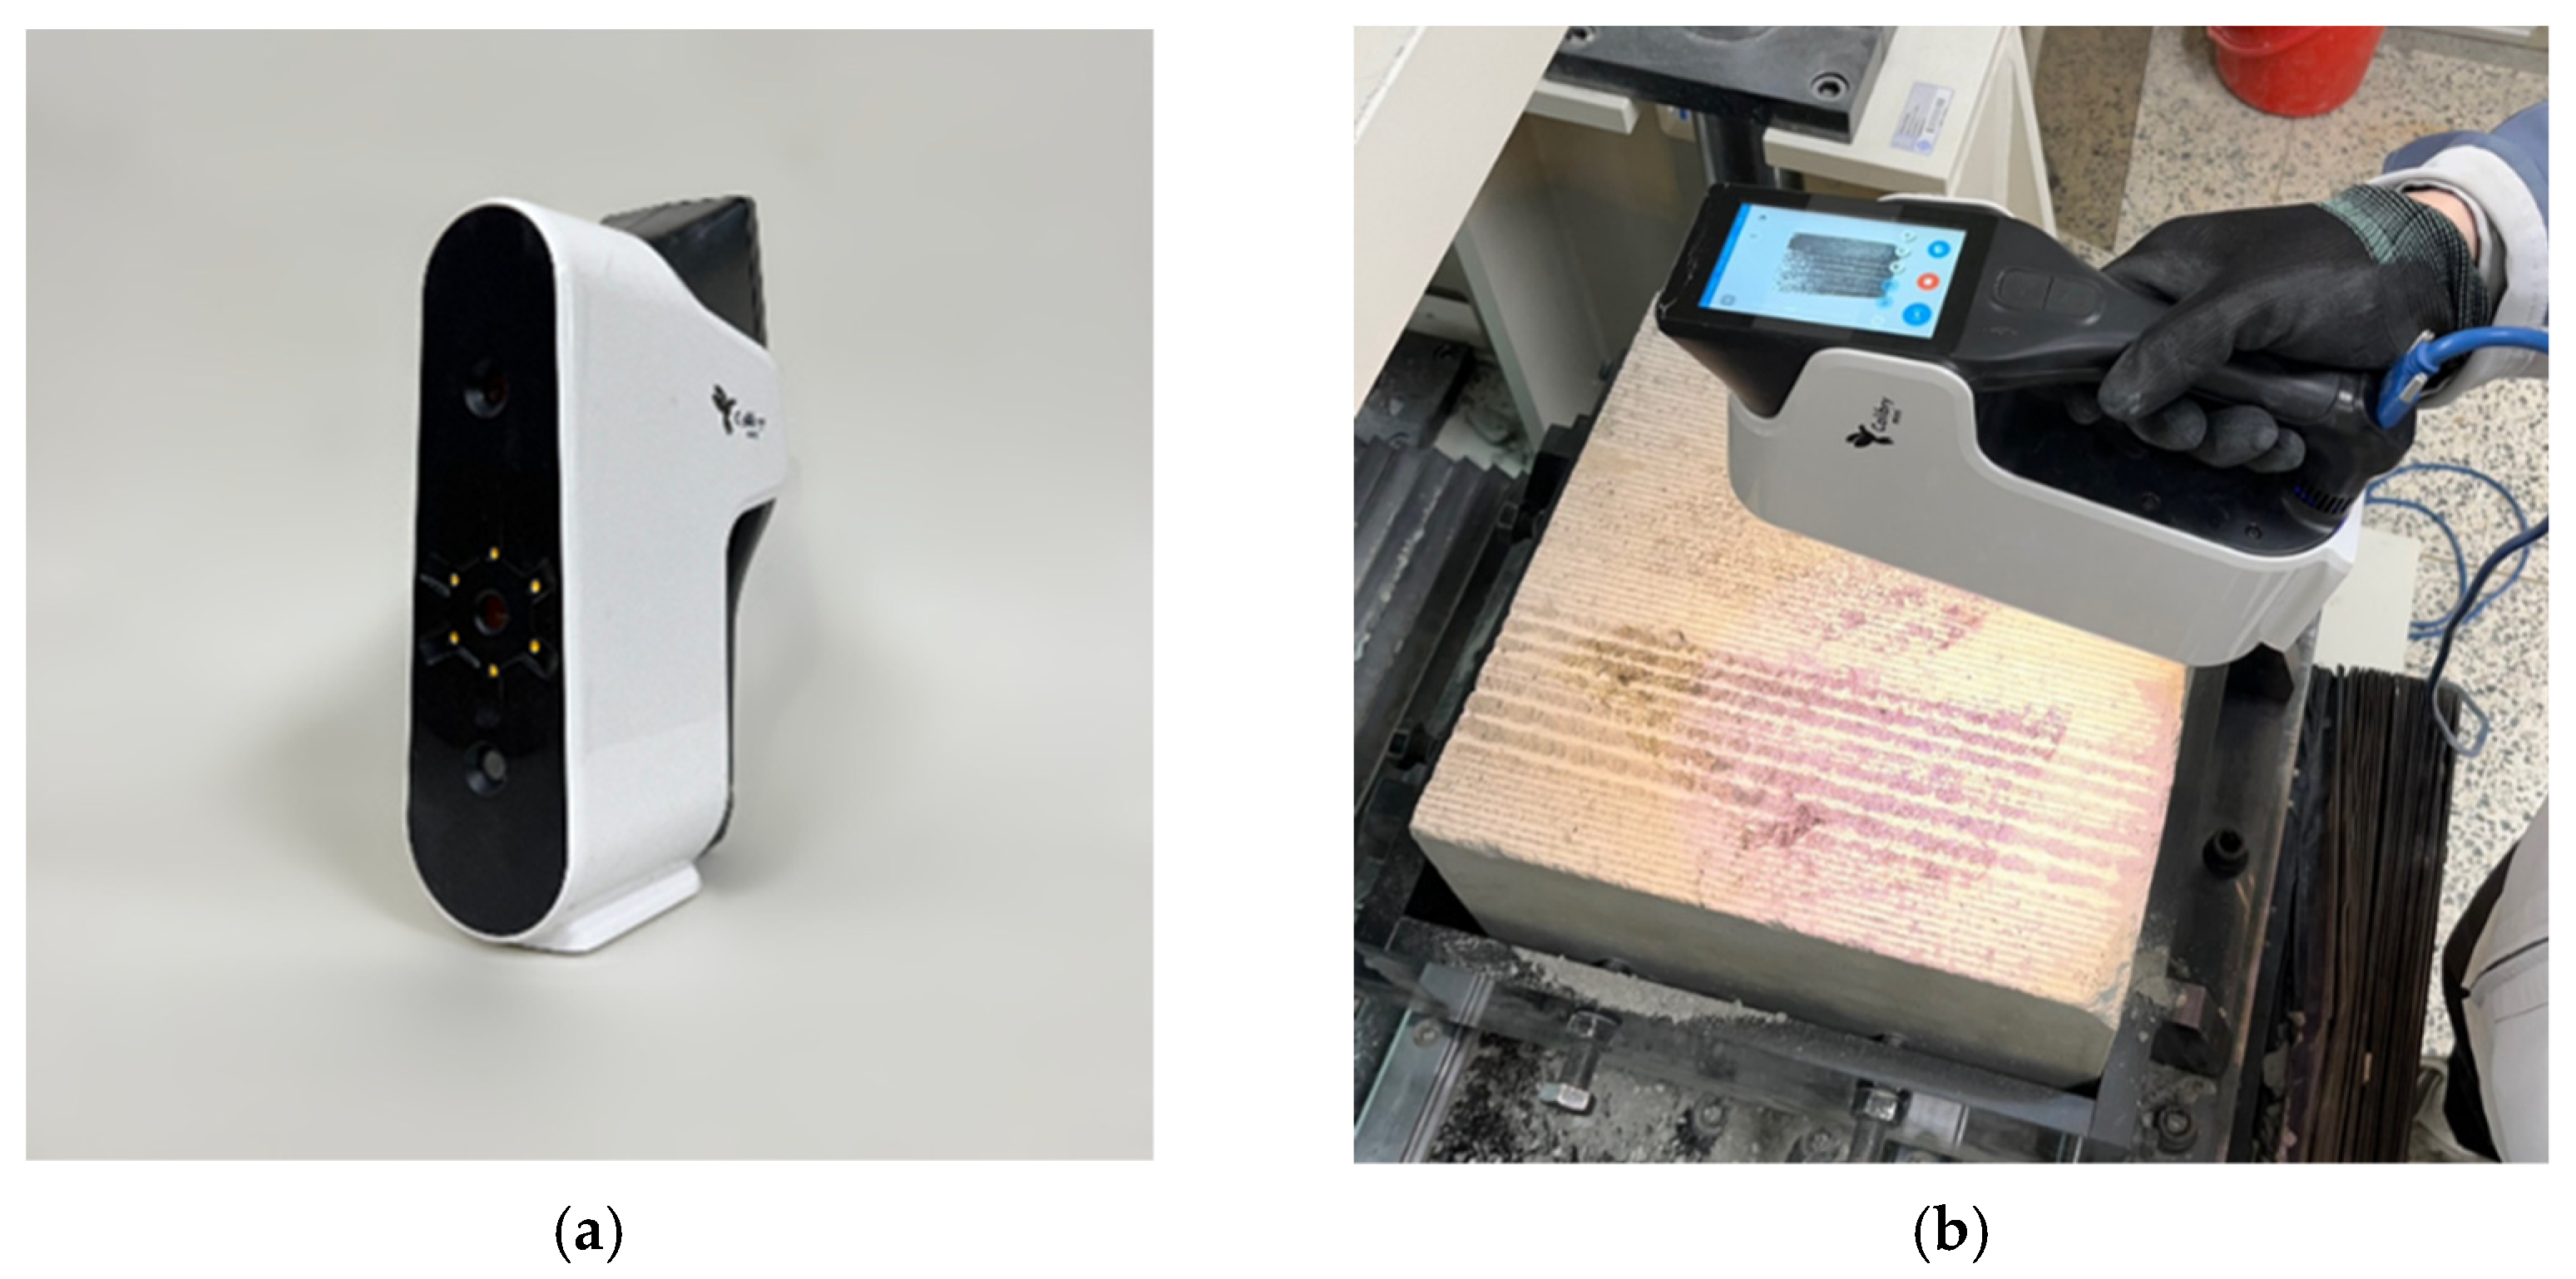
2.3. Rock Sample
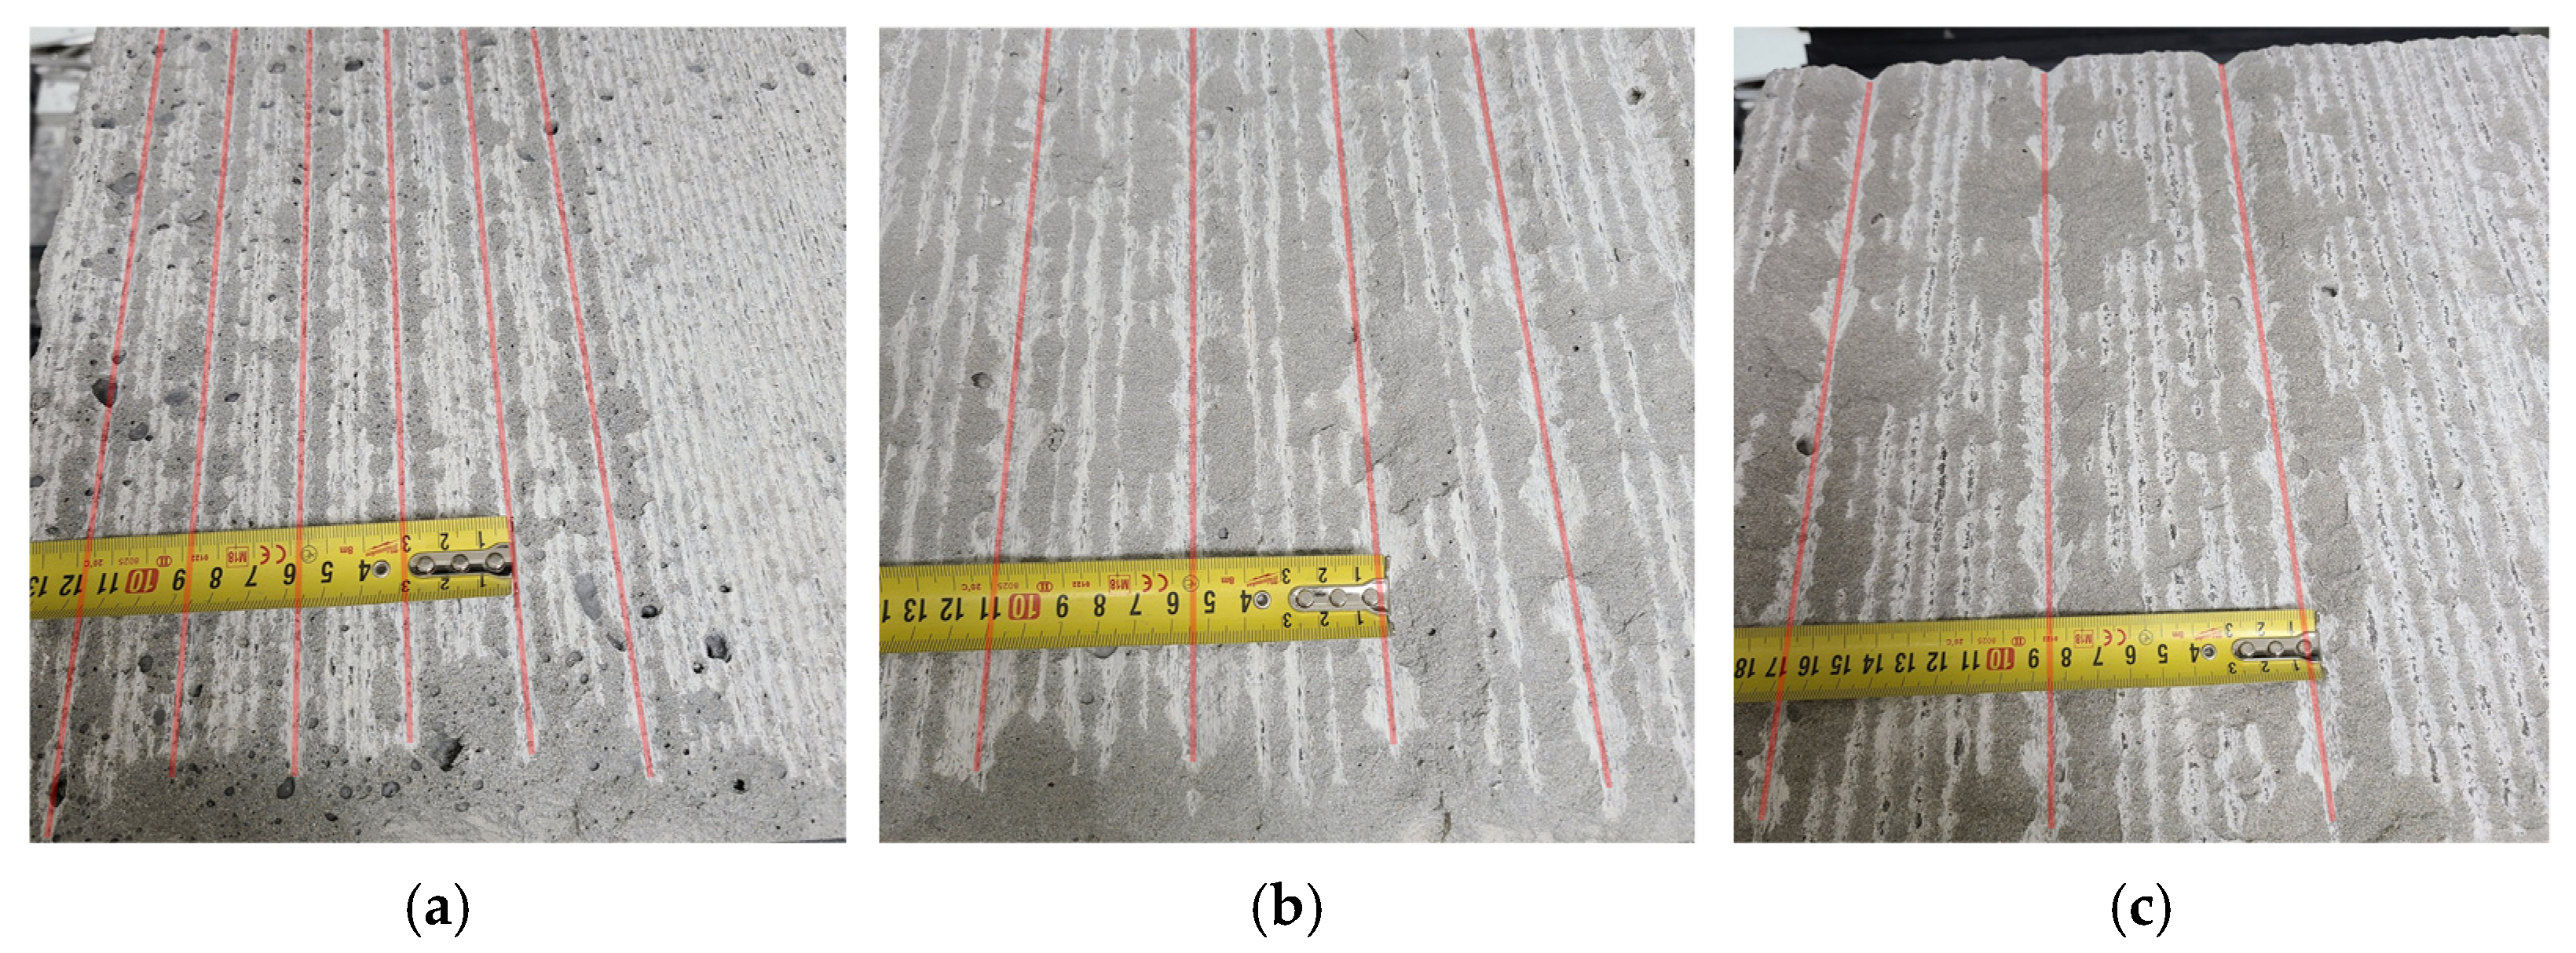
2.4. Linear Cutting Test
- SE = specific energy (J/m3);
- Fc = average cutting force (N);
- l = cutting length (m);
- V = cutting volume (m3).
3. Results
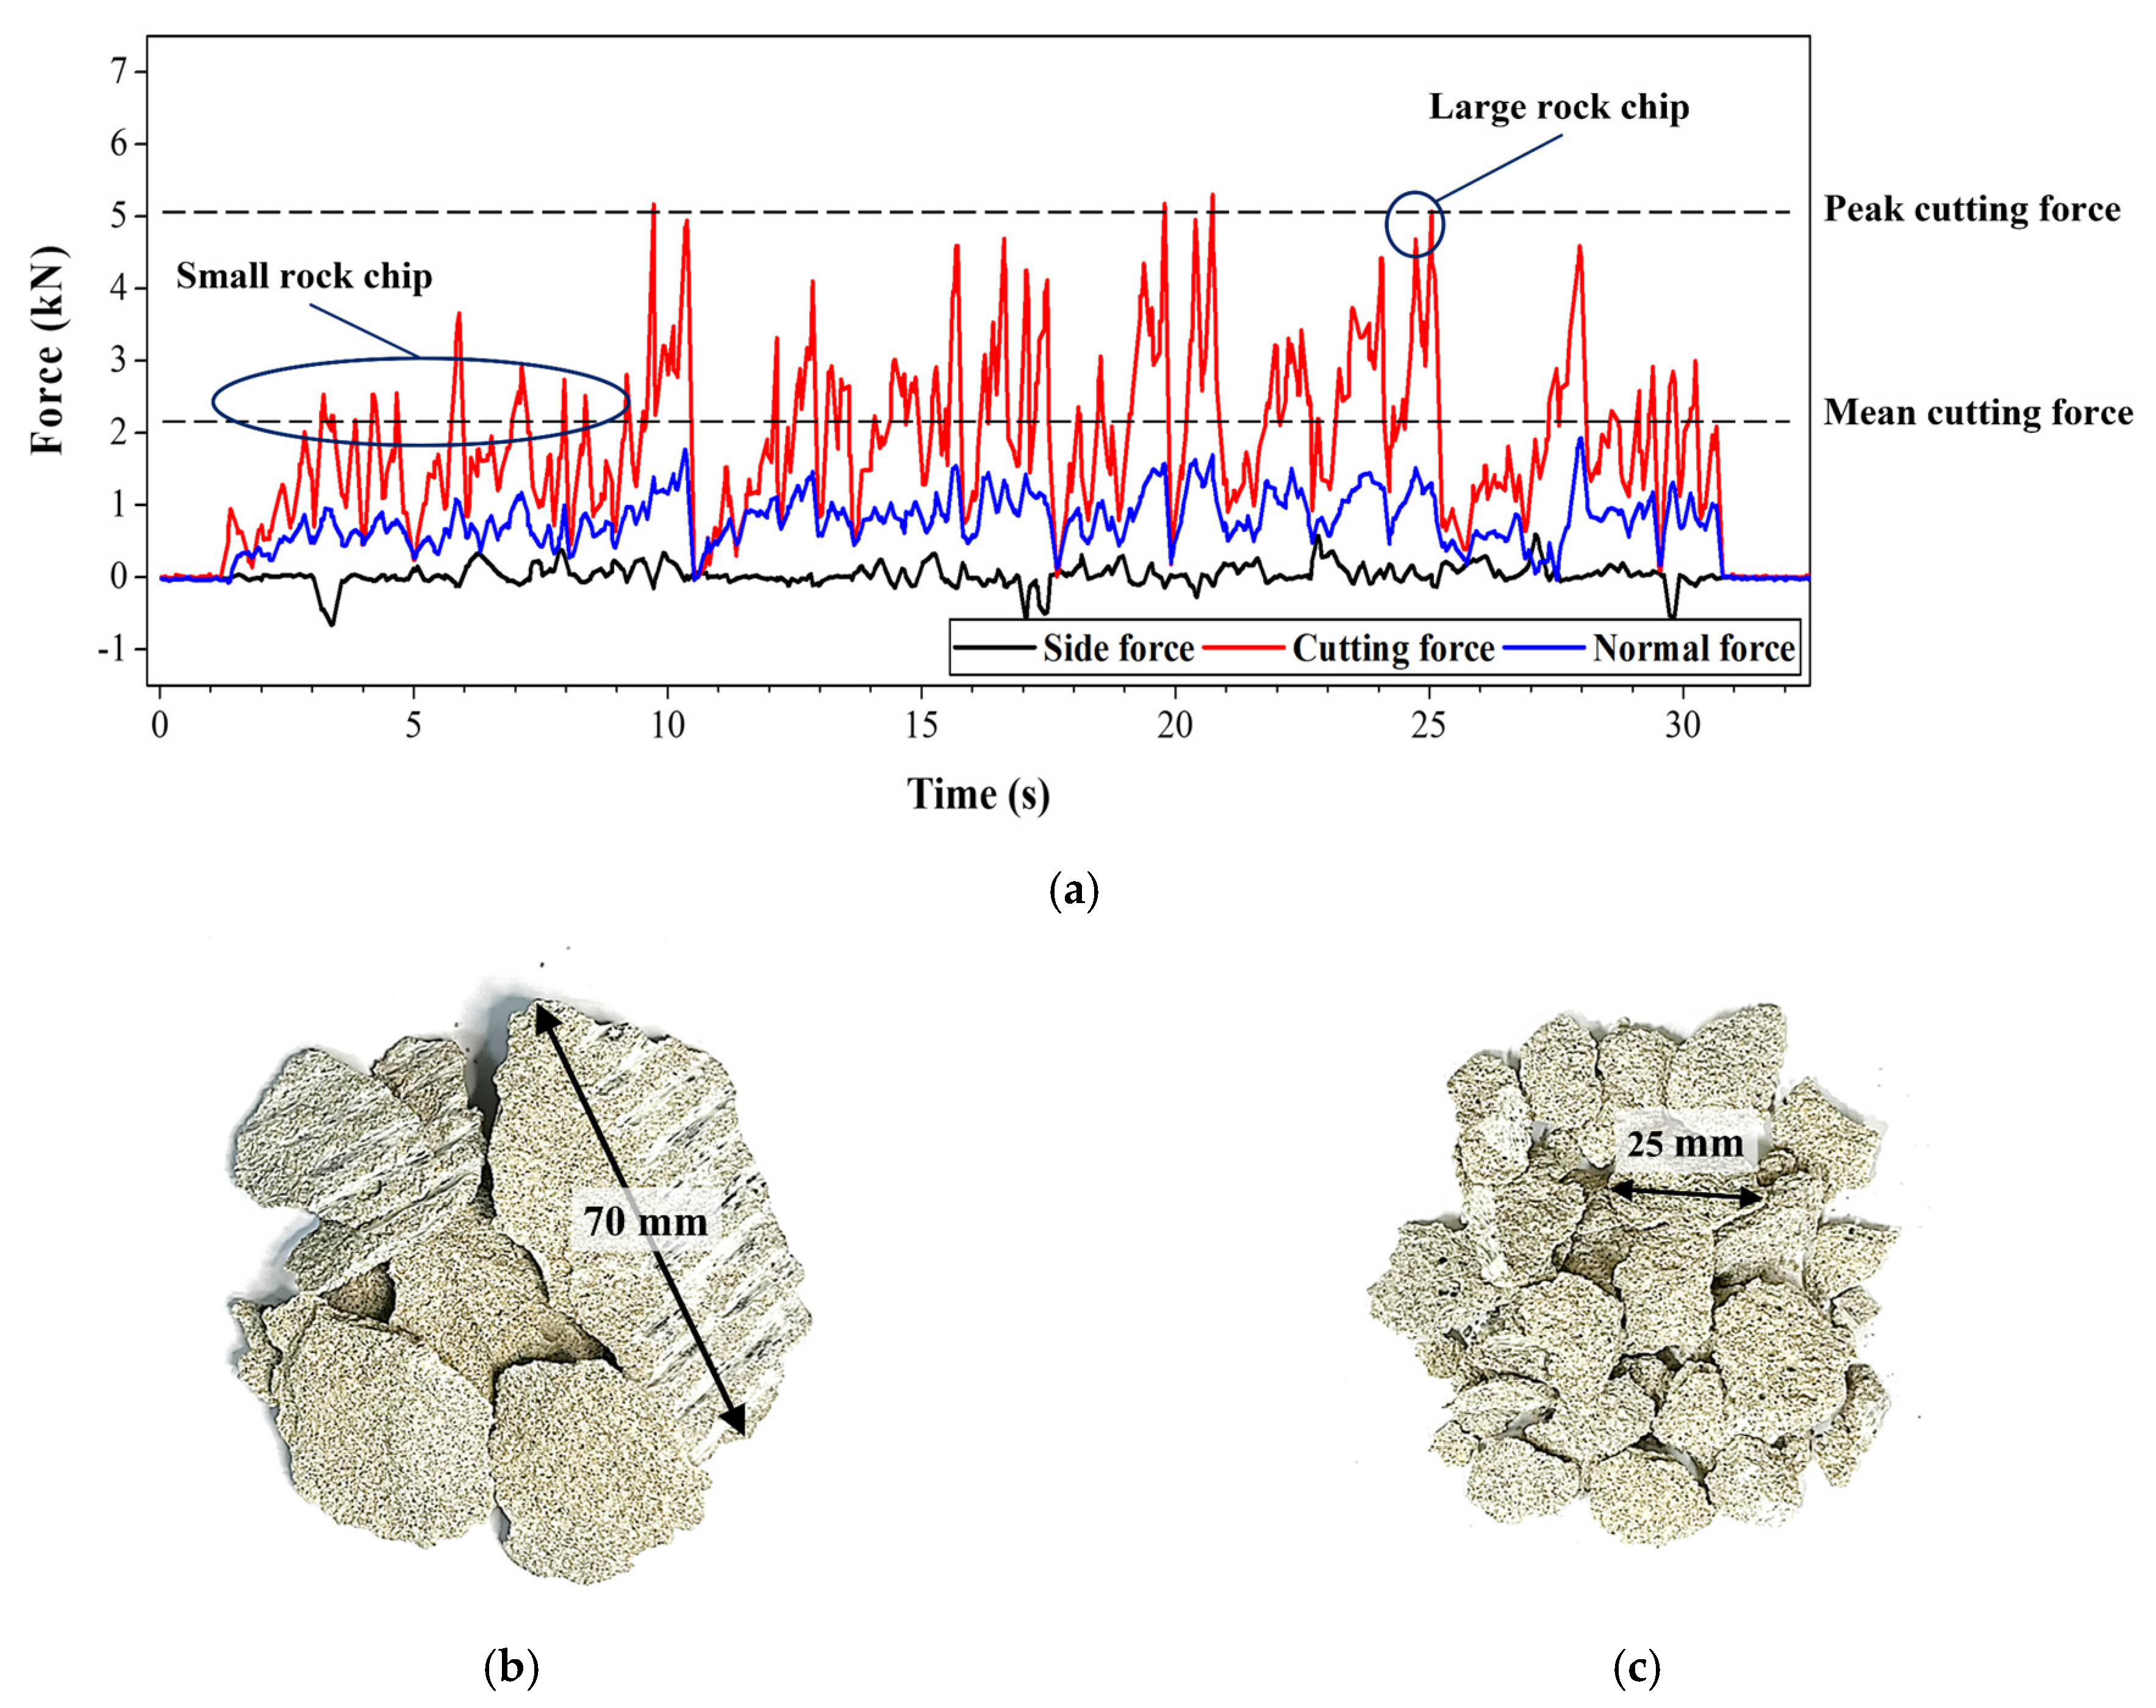
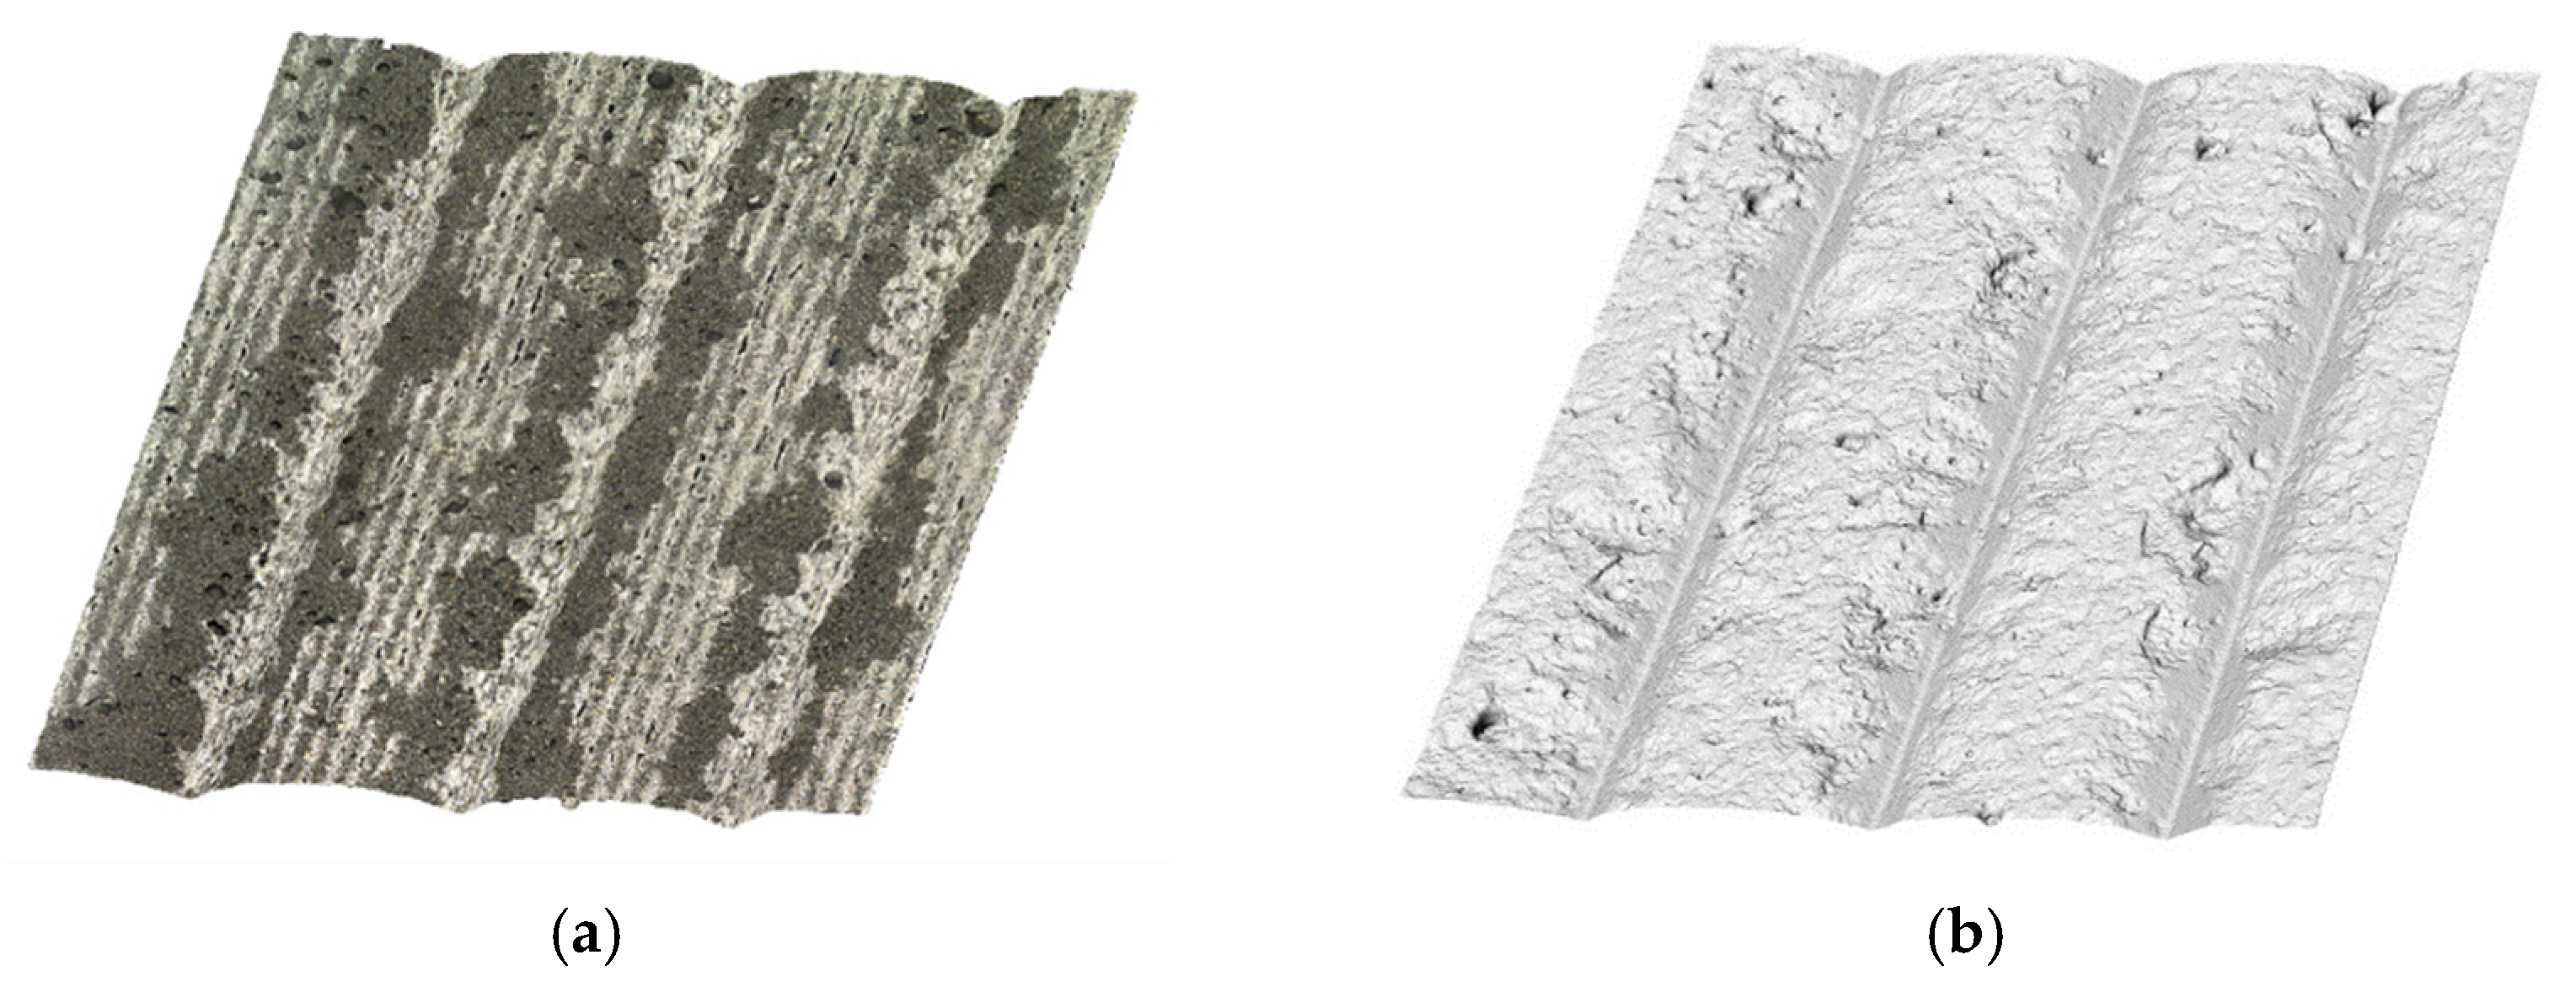
3.1. Relation of the Cutting Force and Rock Chips Generation
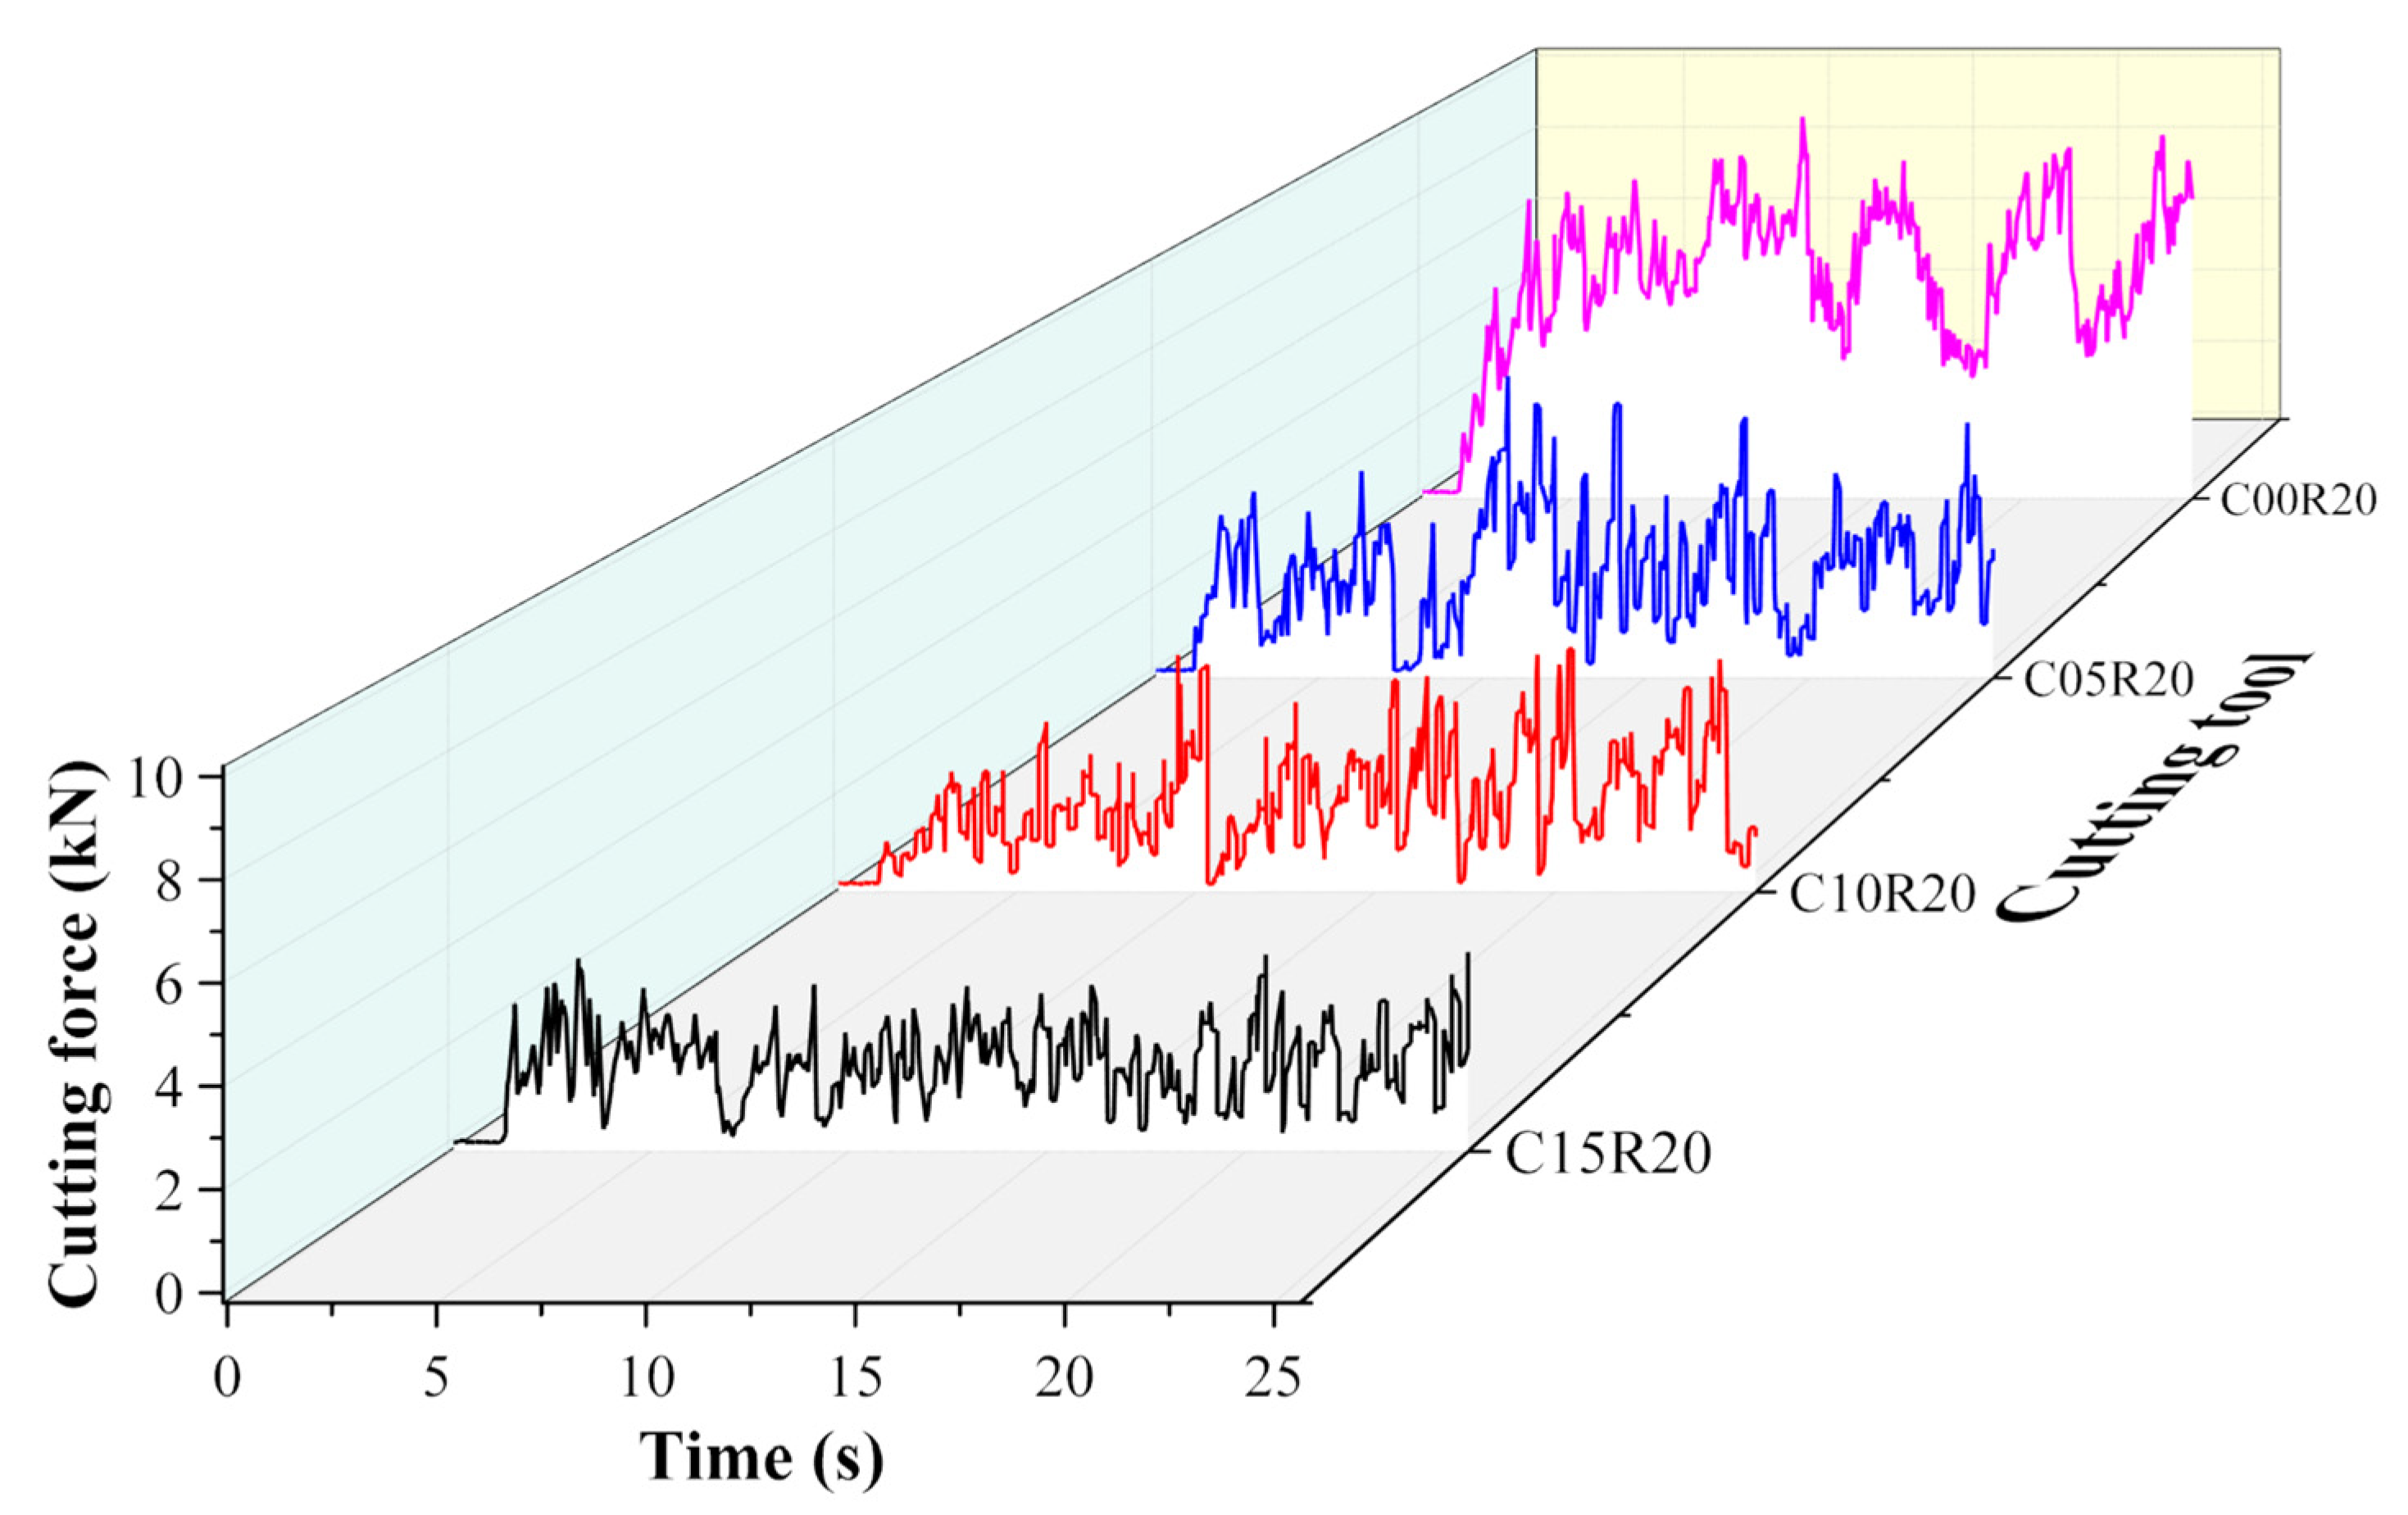
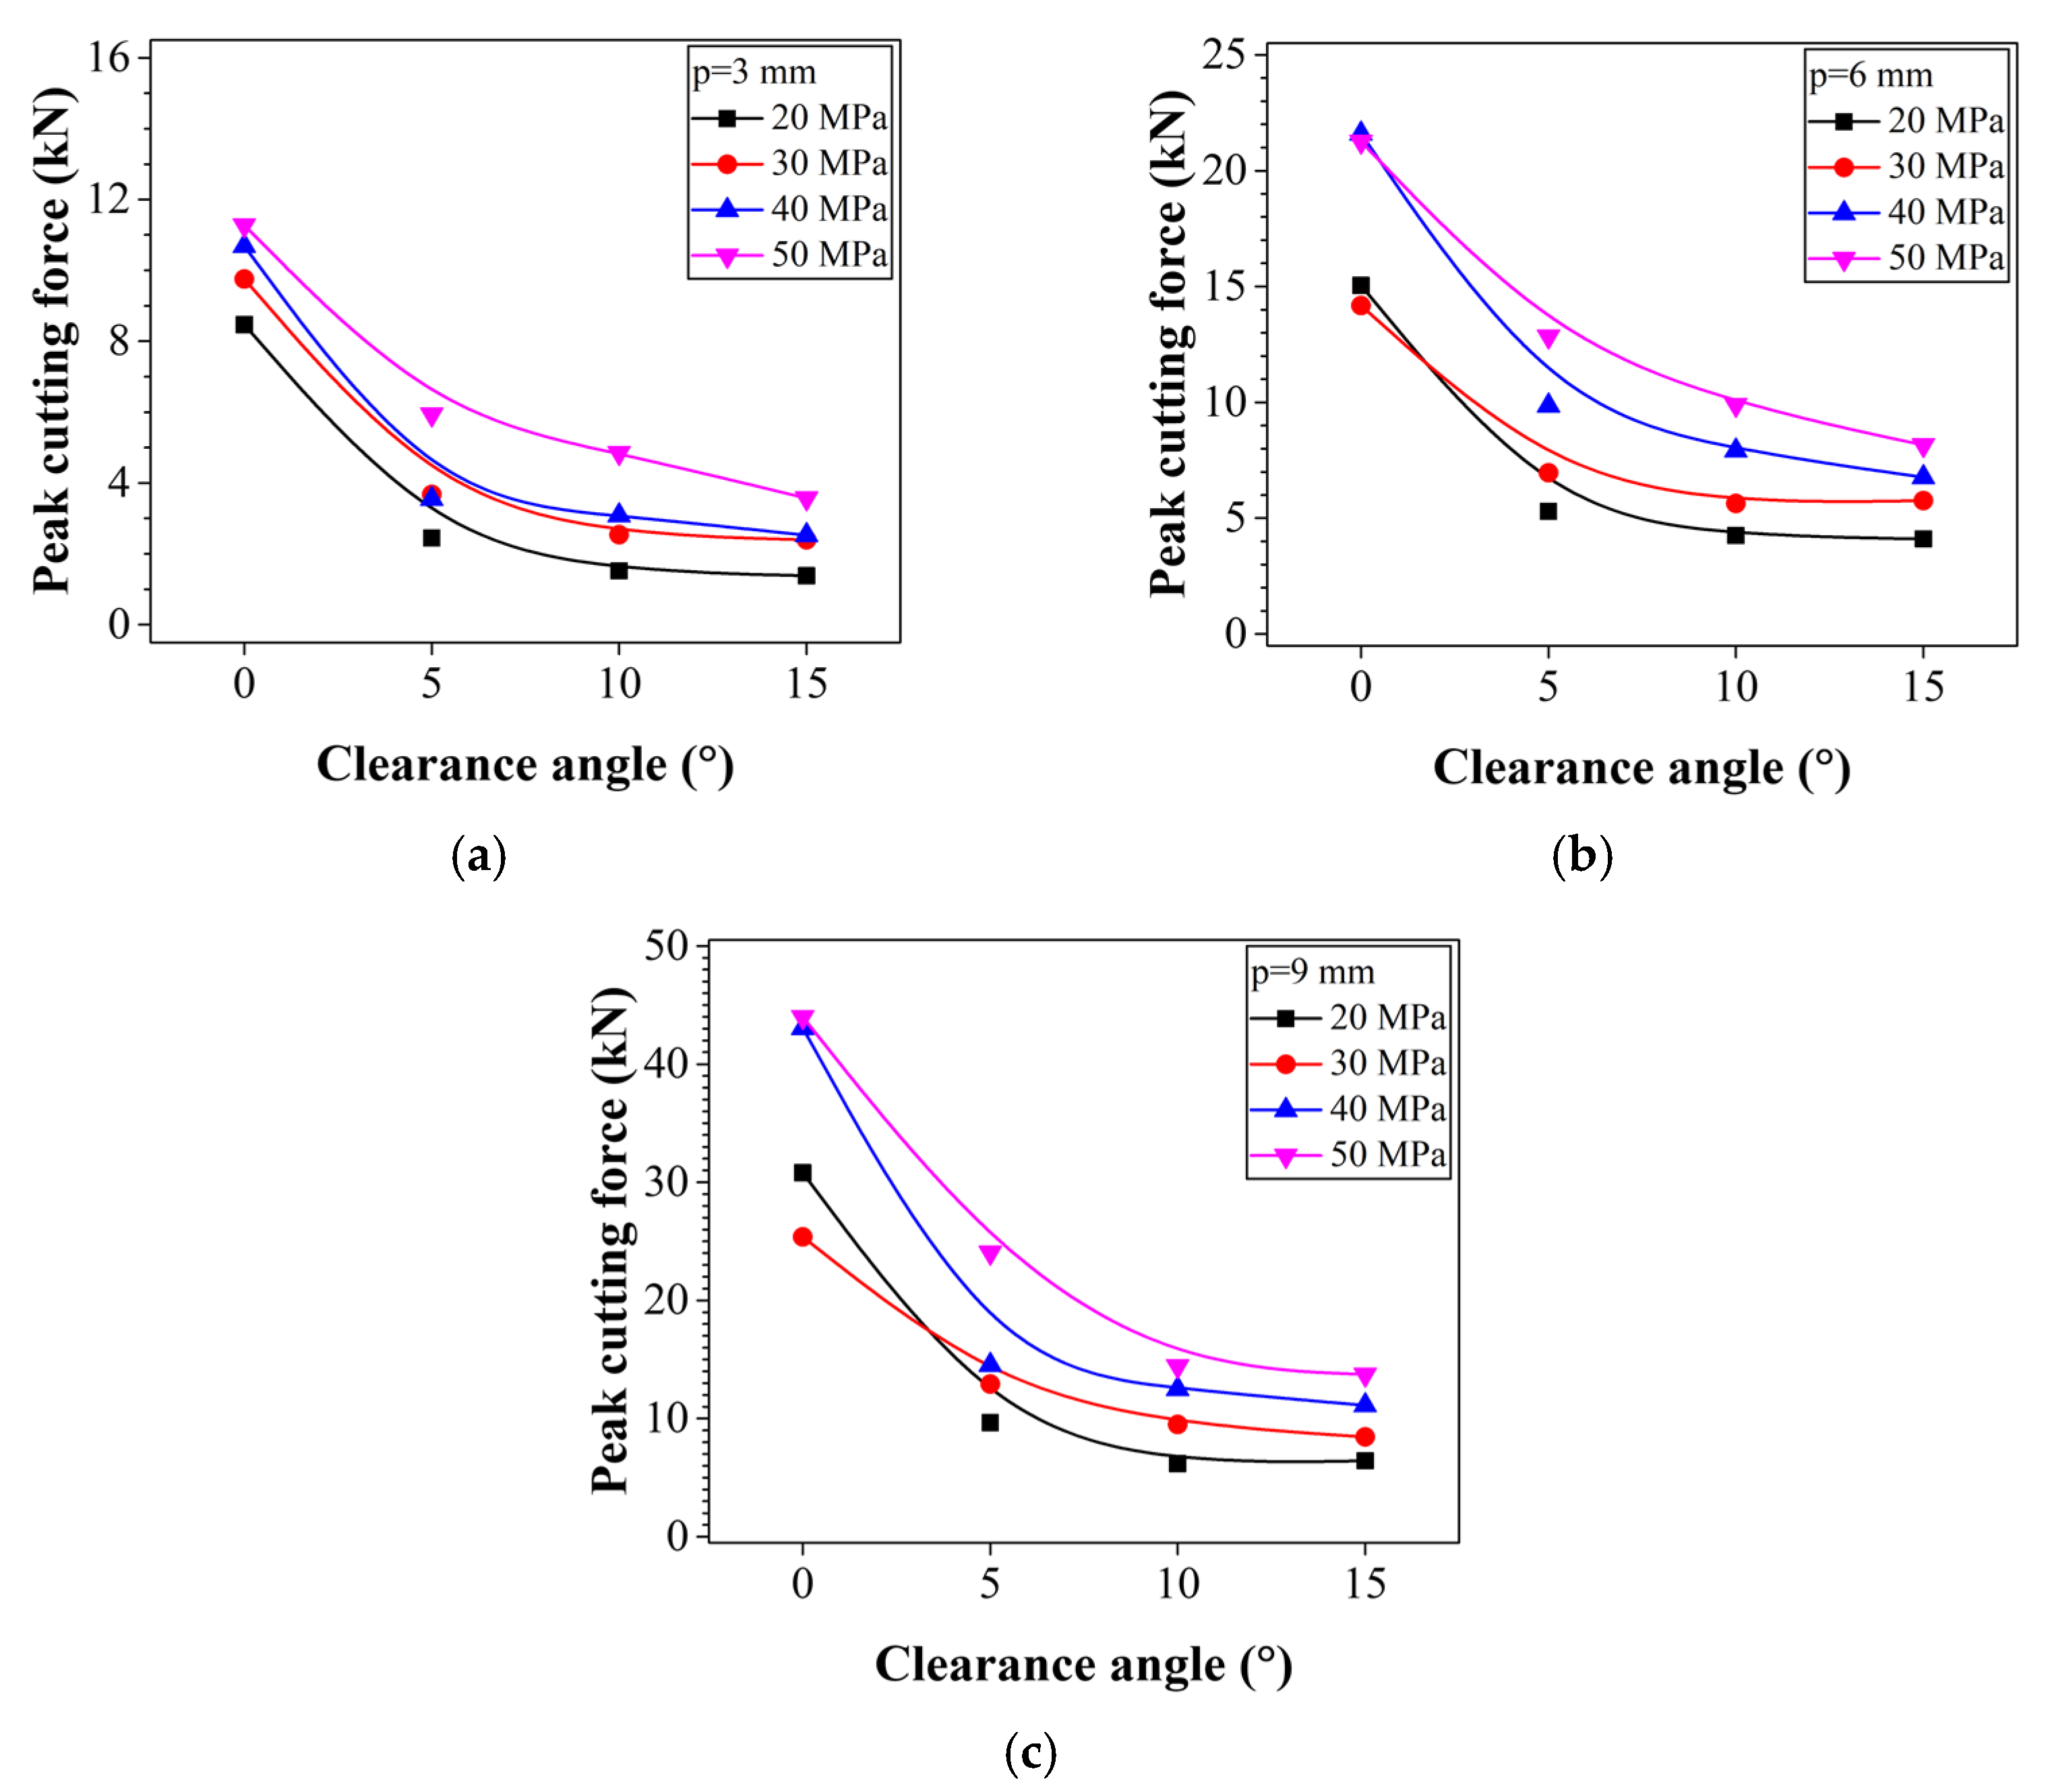
3.2. Effect of the Clearance Angle on the Cutting Force
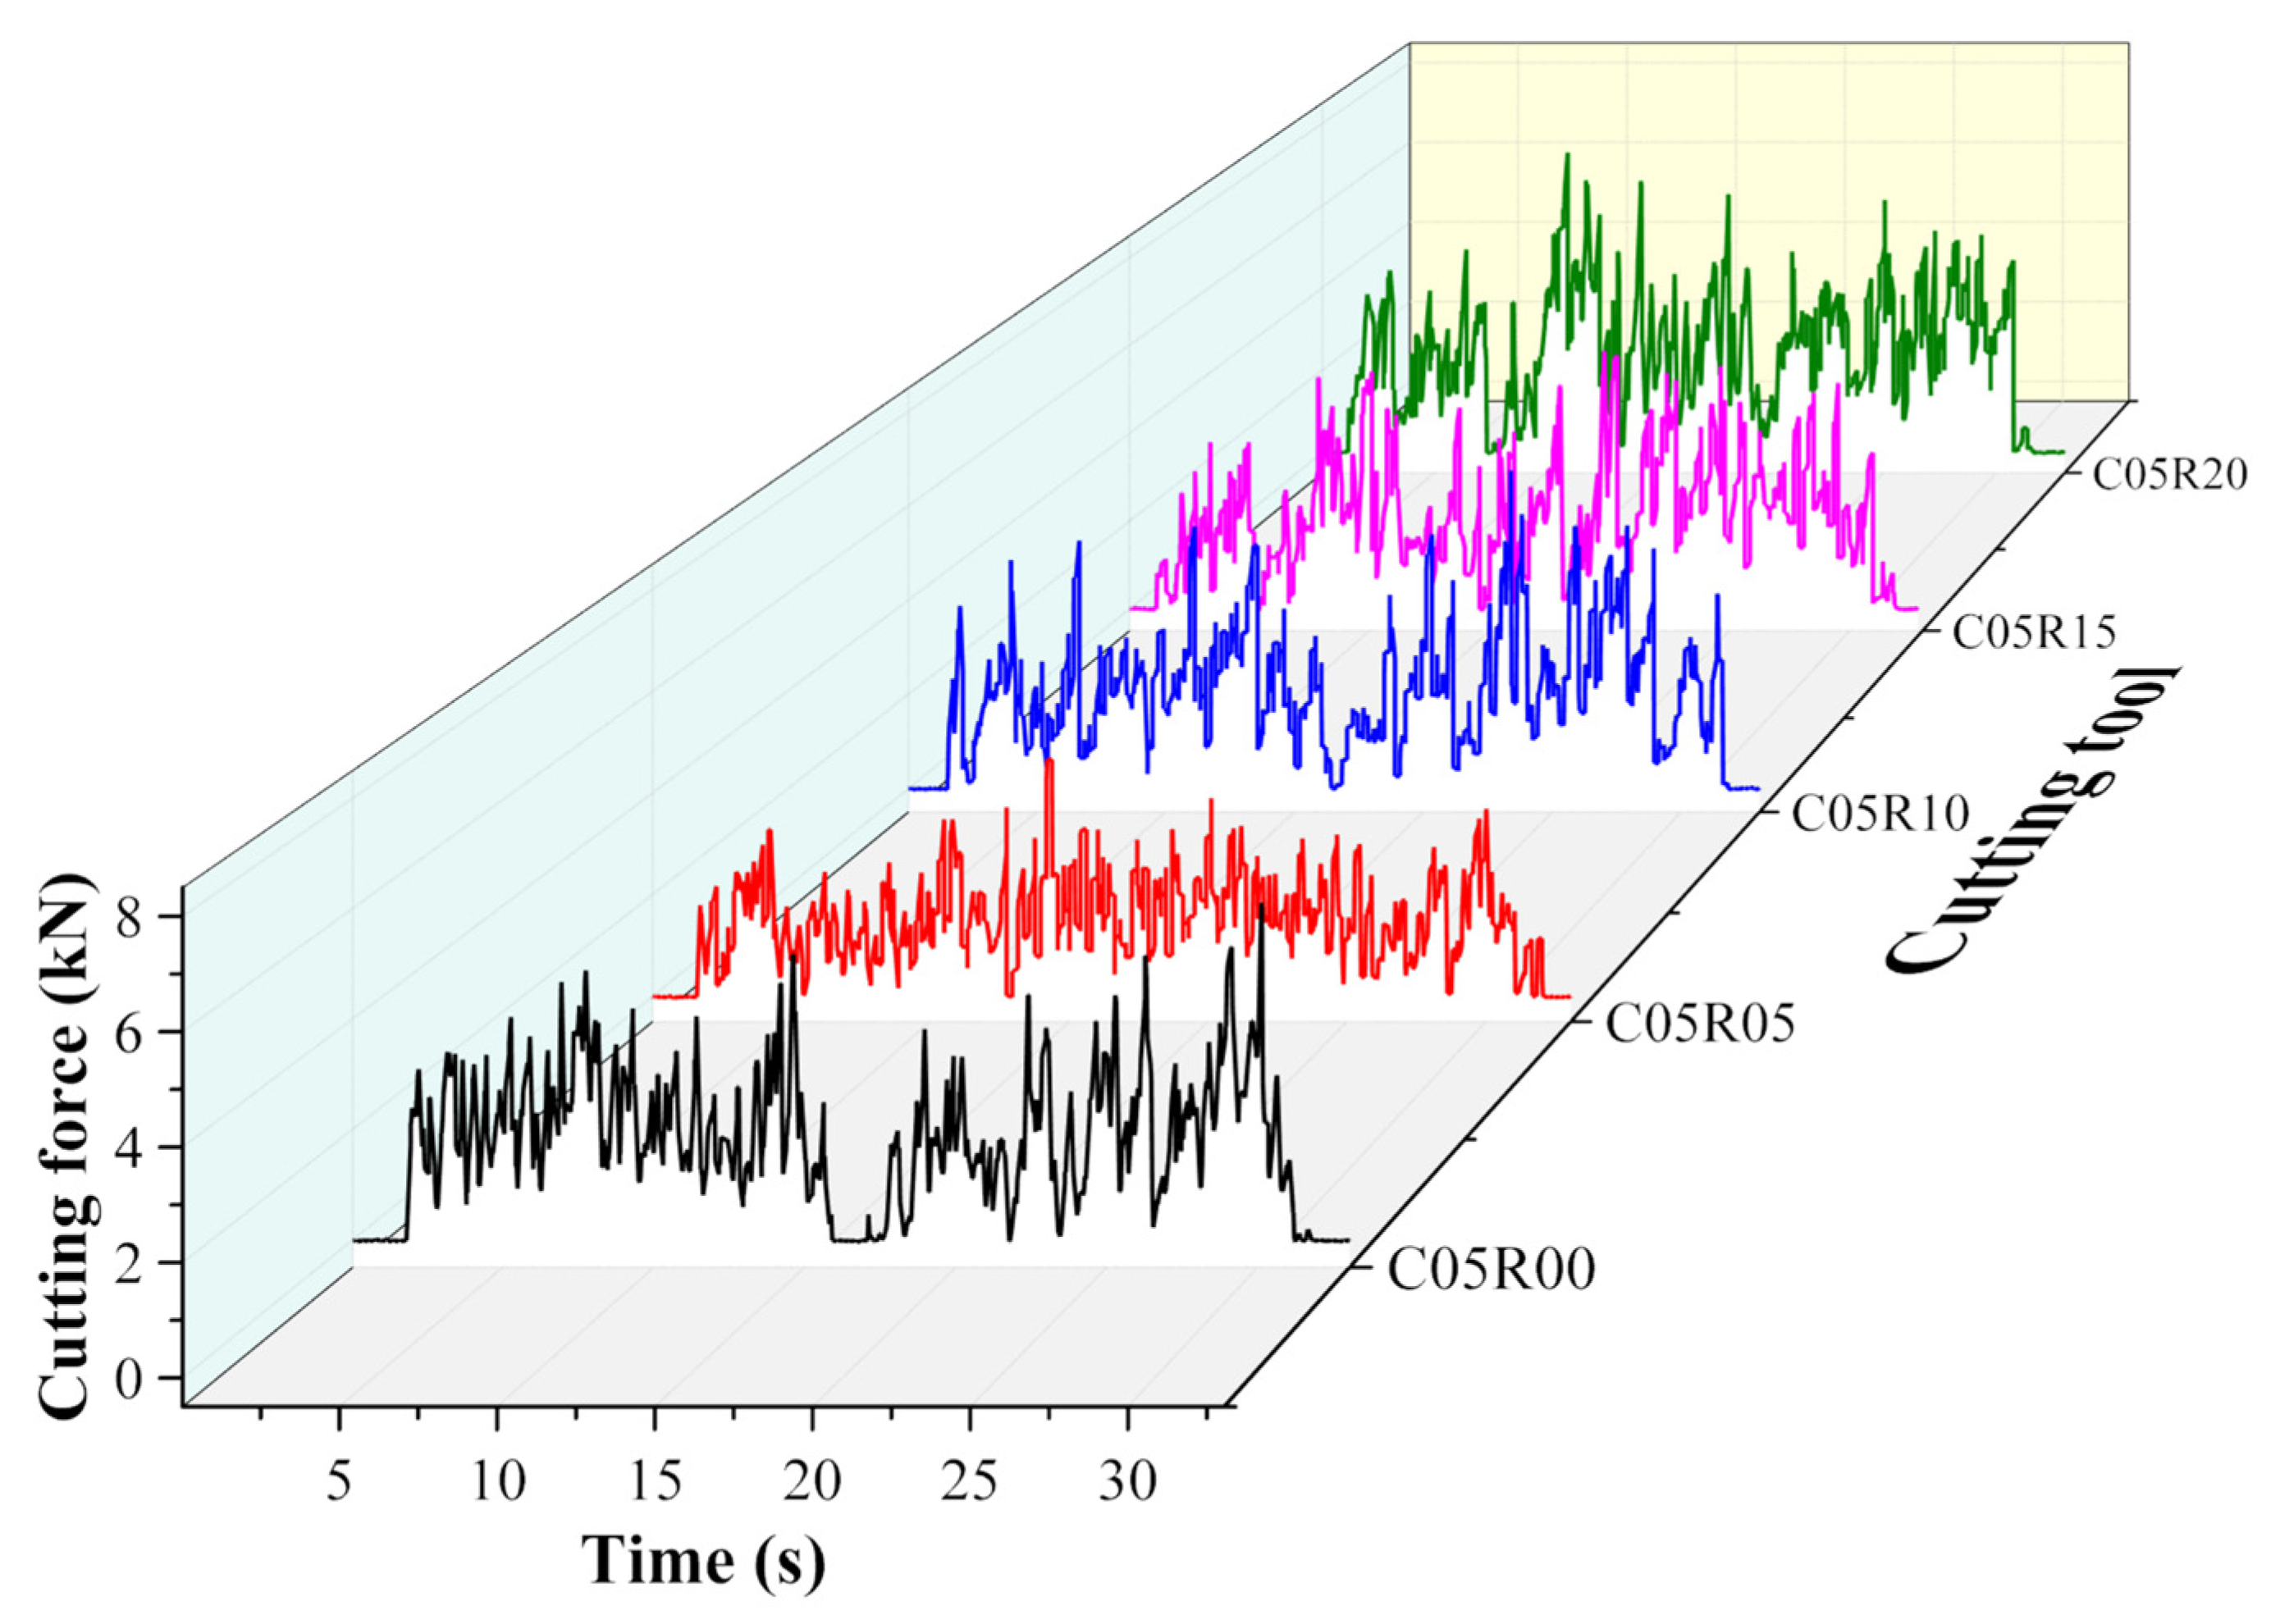
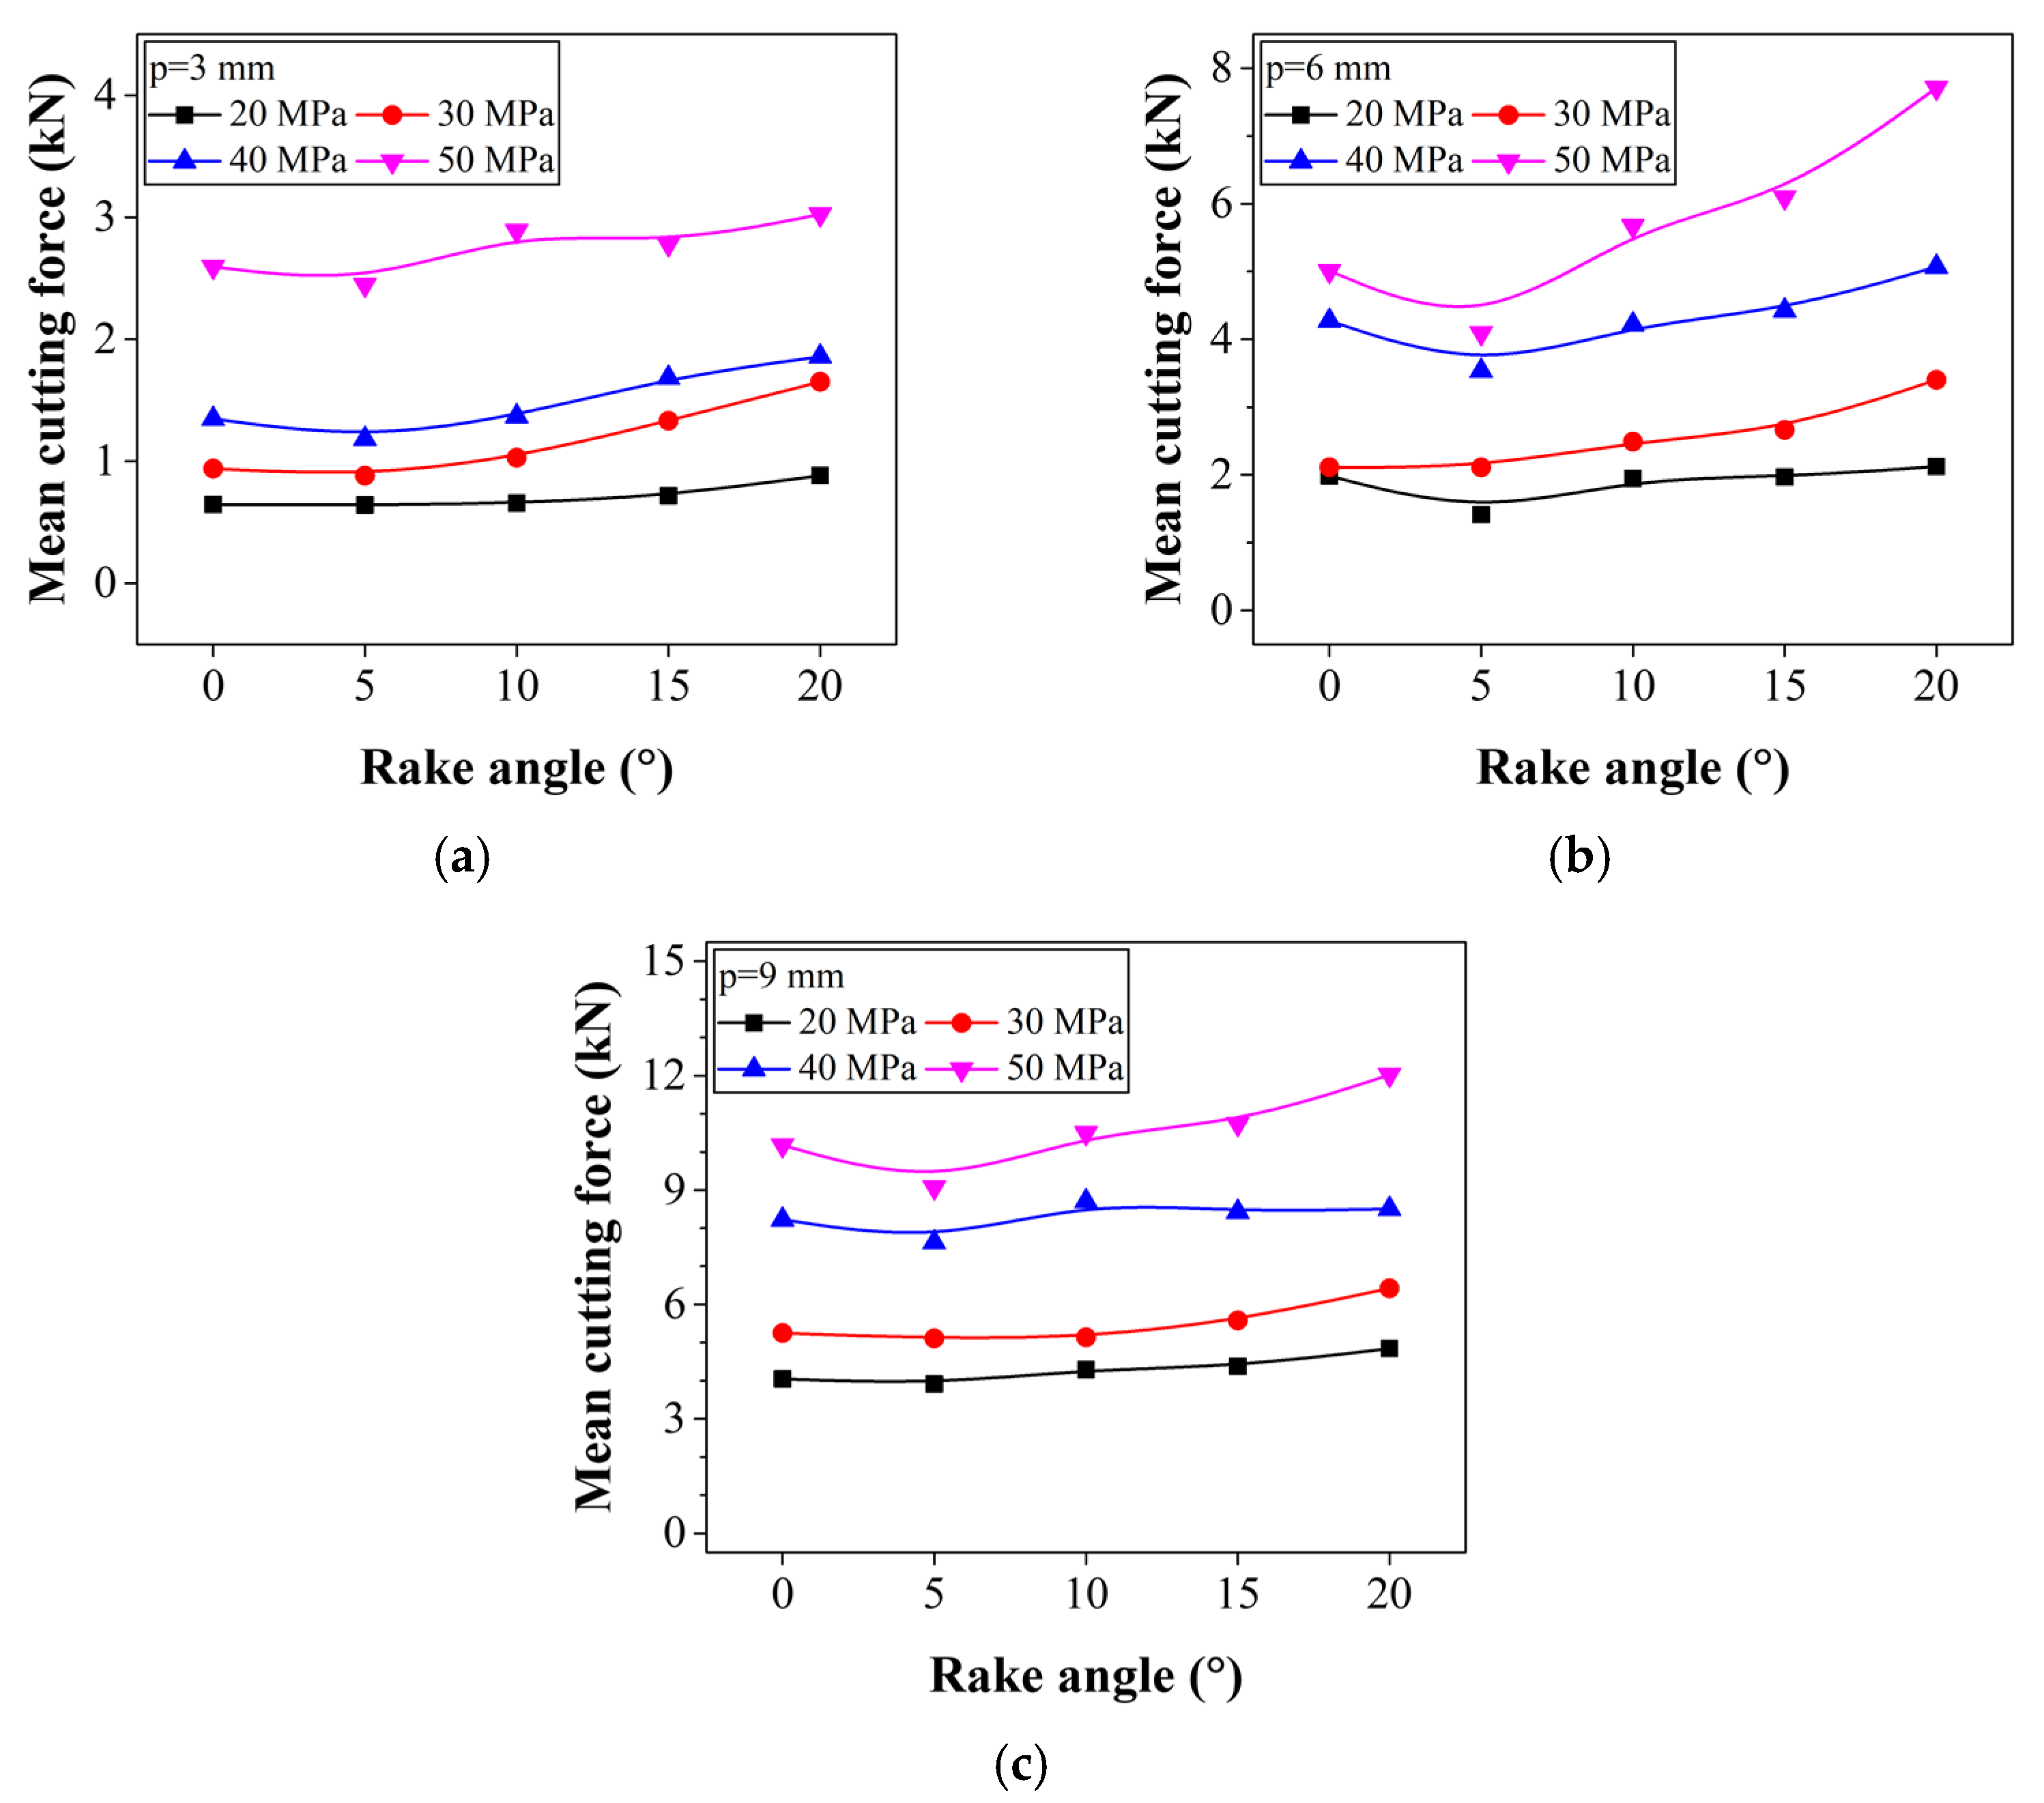
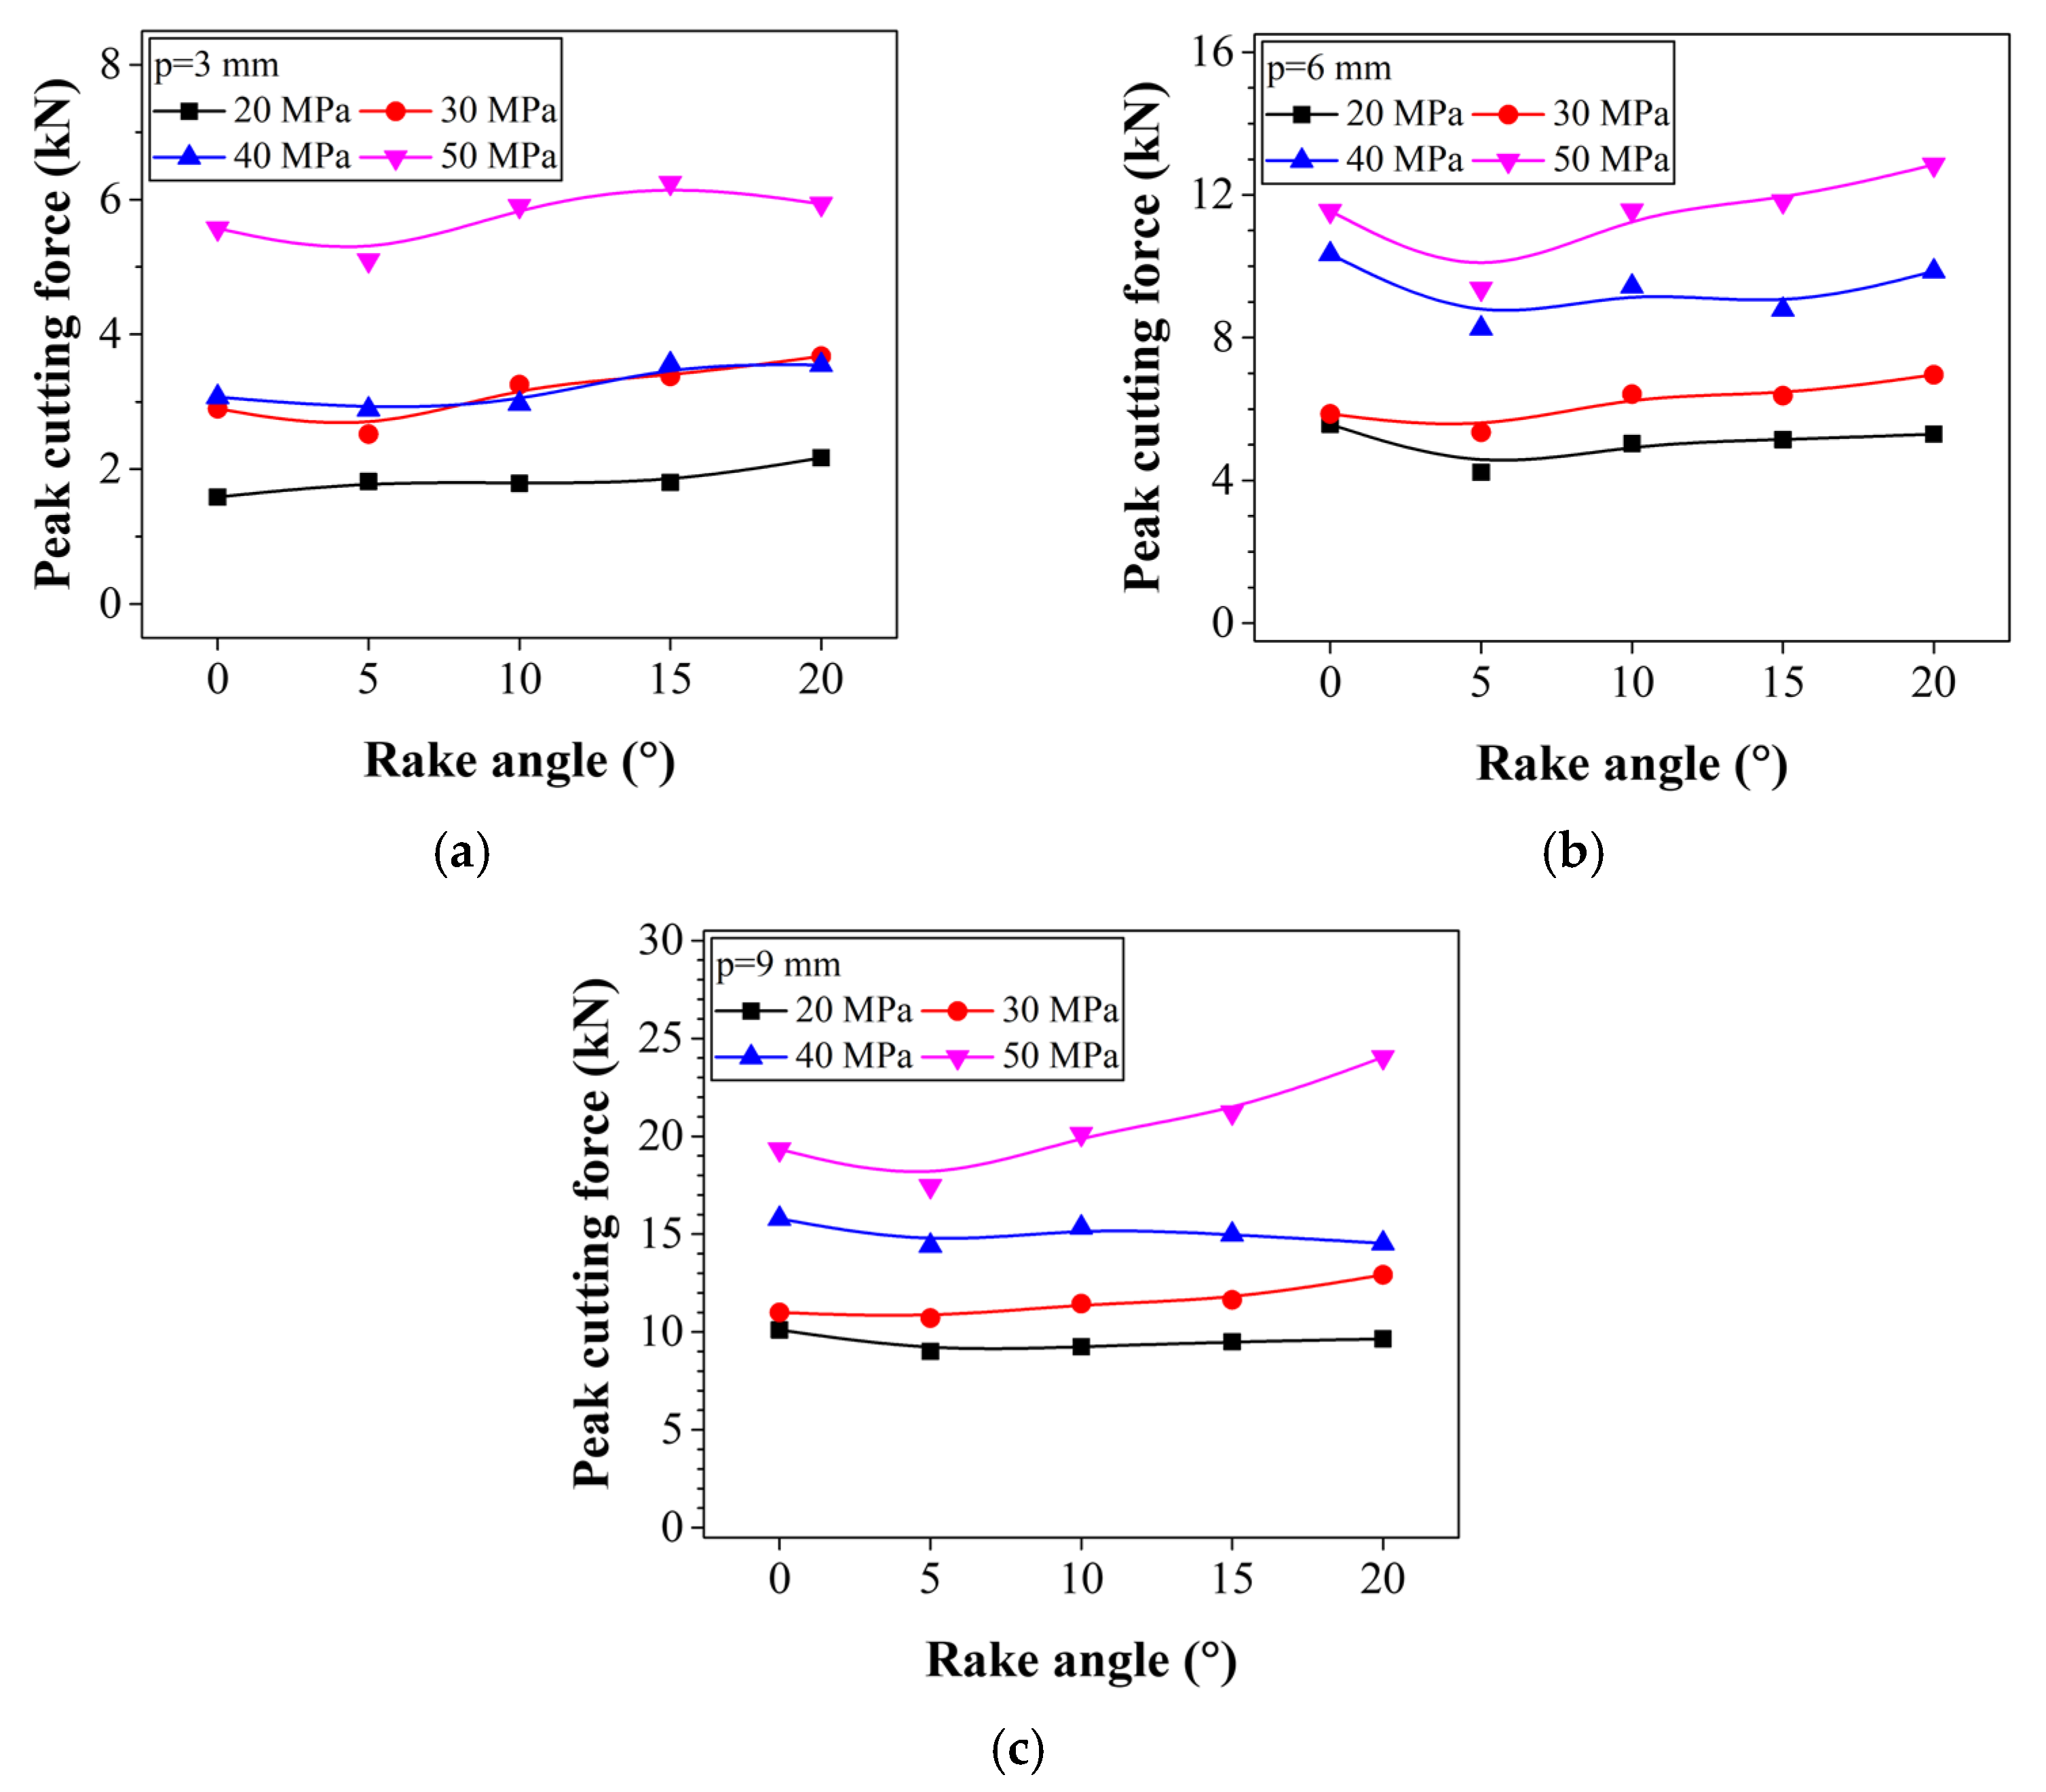
3.3. Effect of the Rake Angle on the Cutting Force
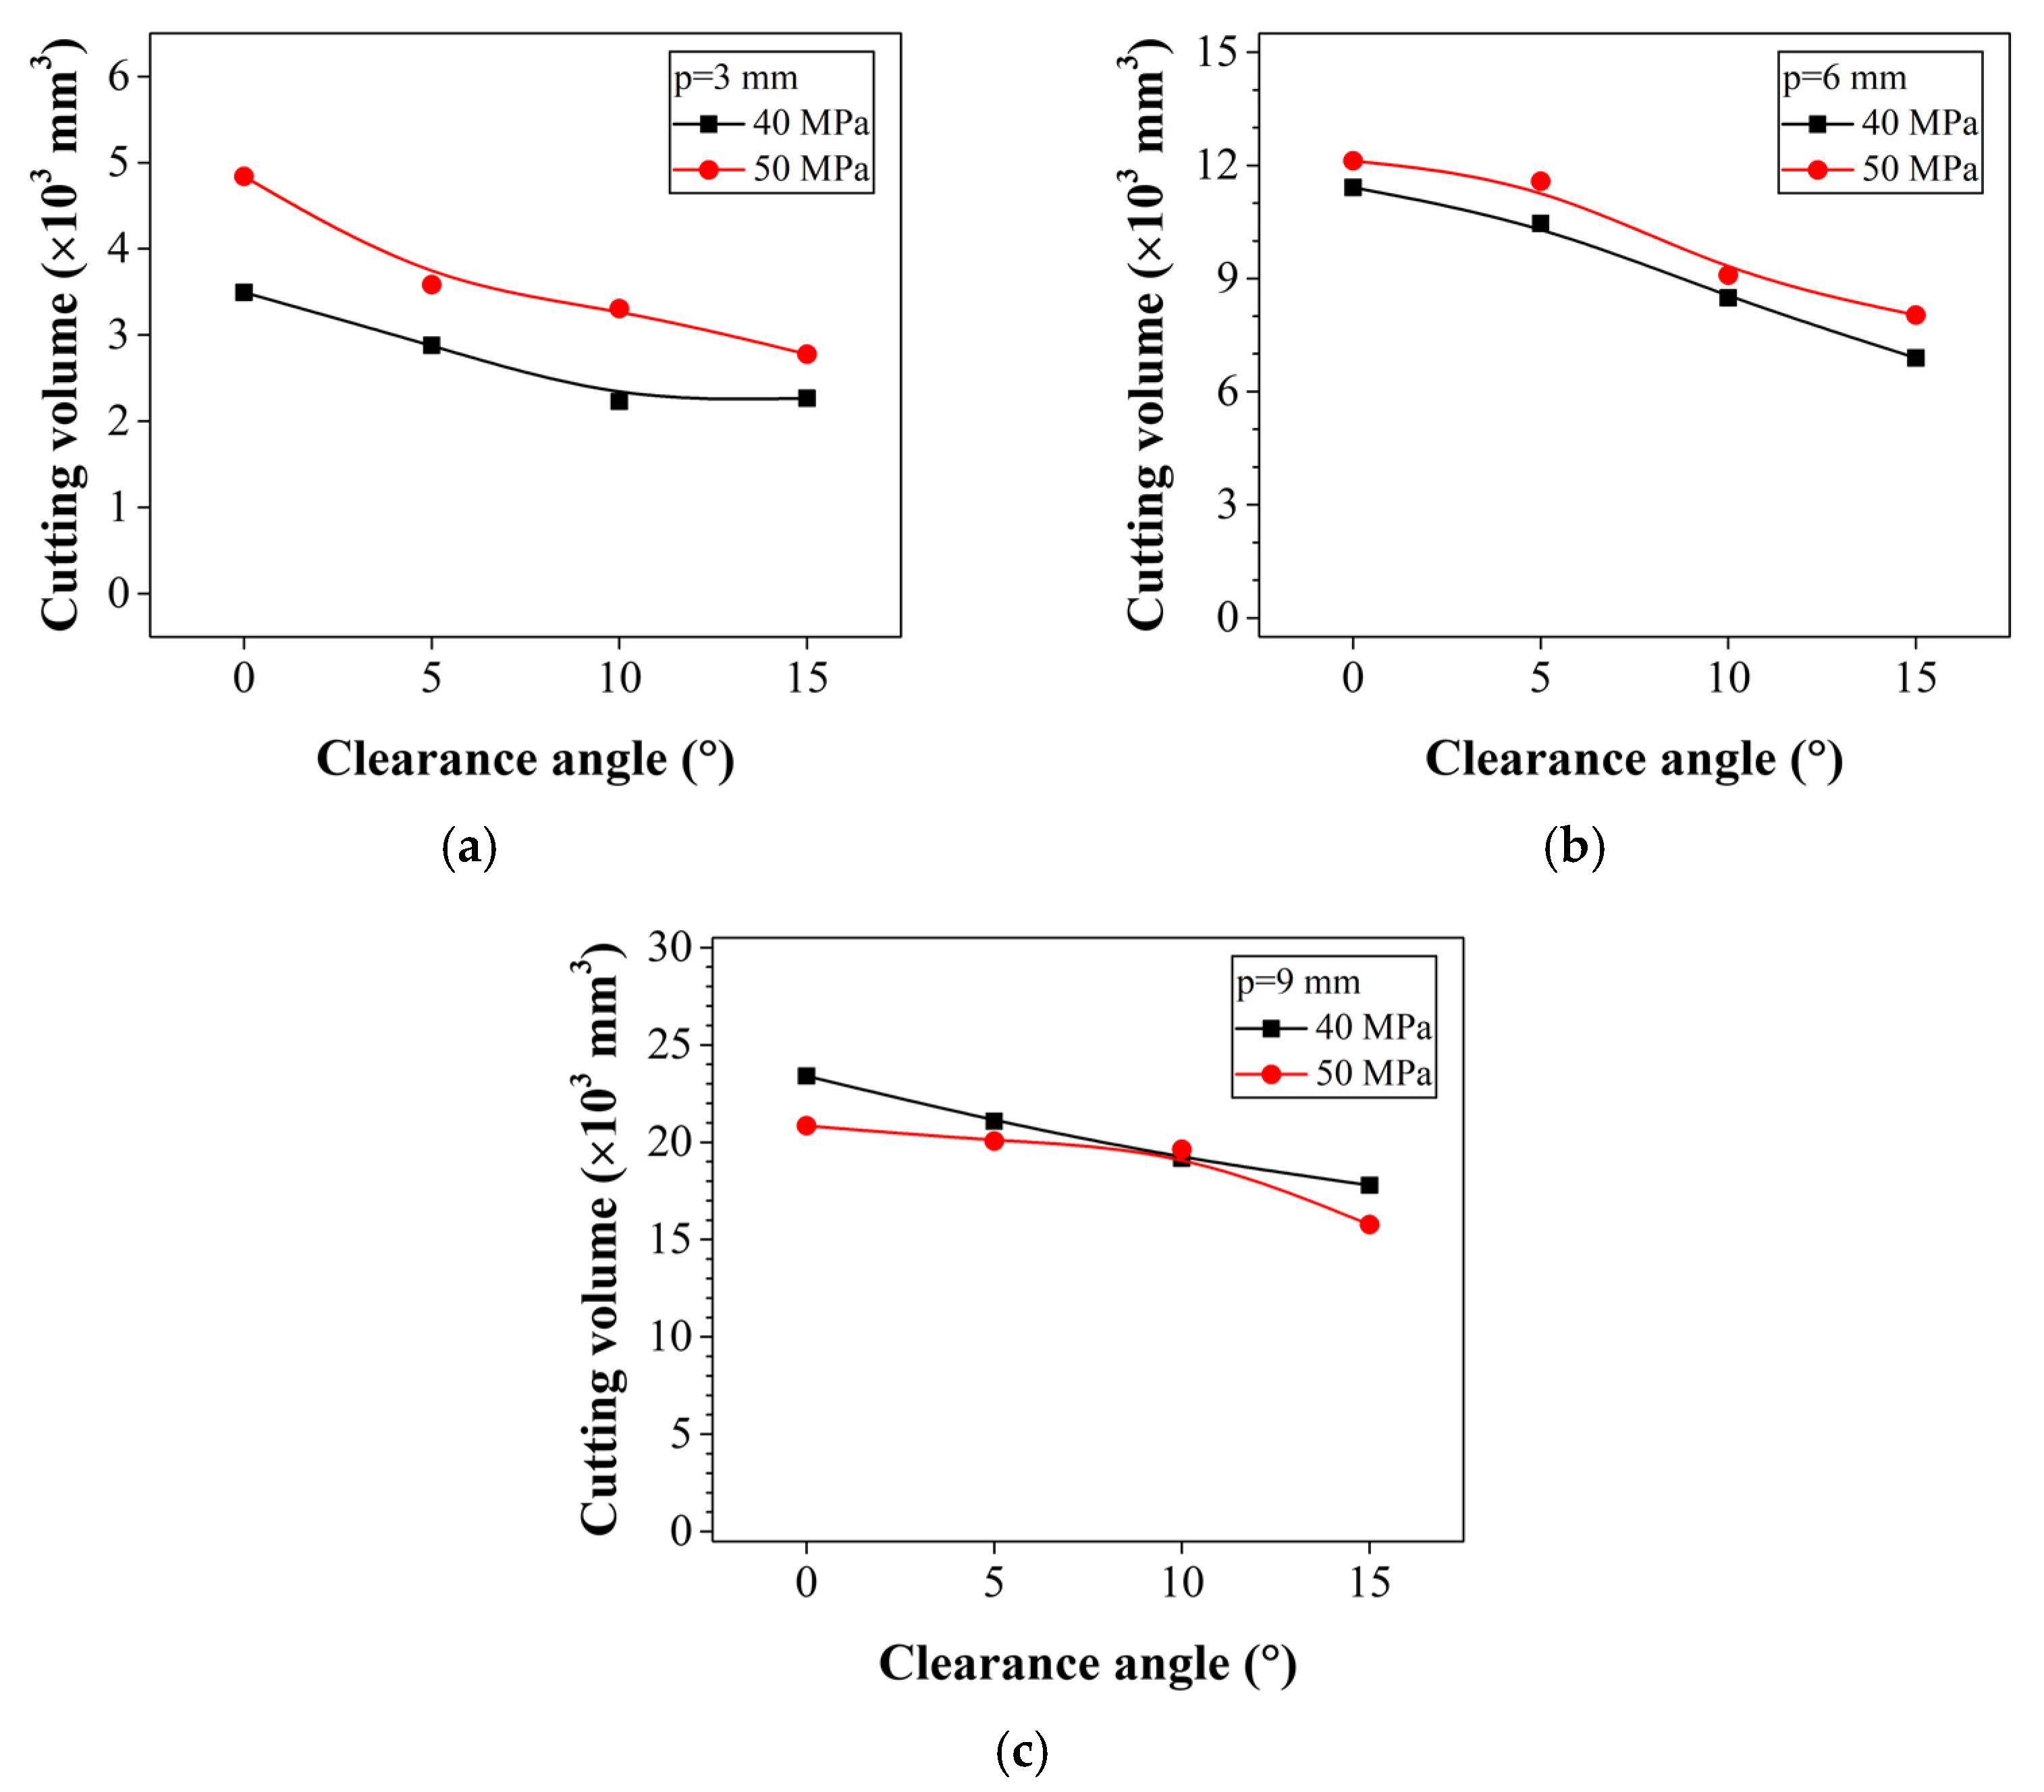
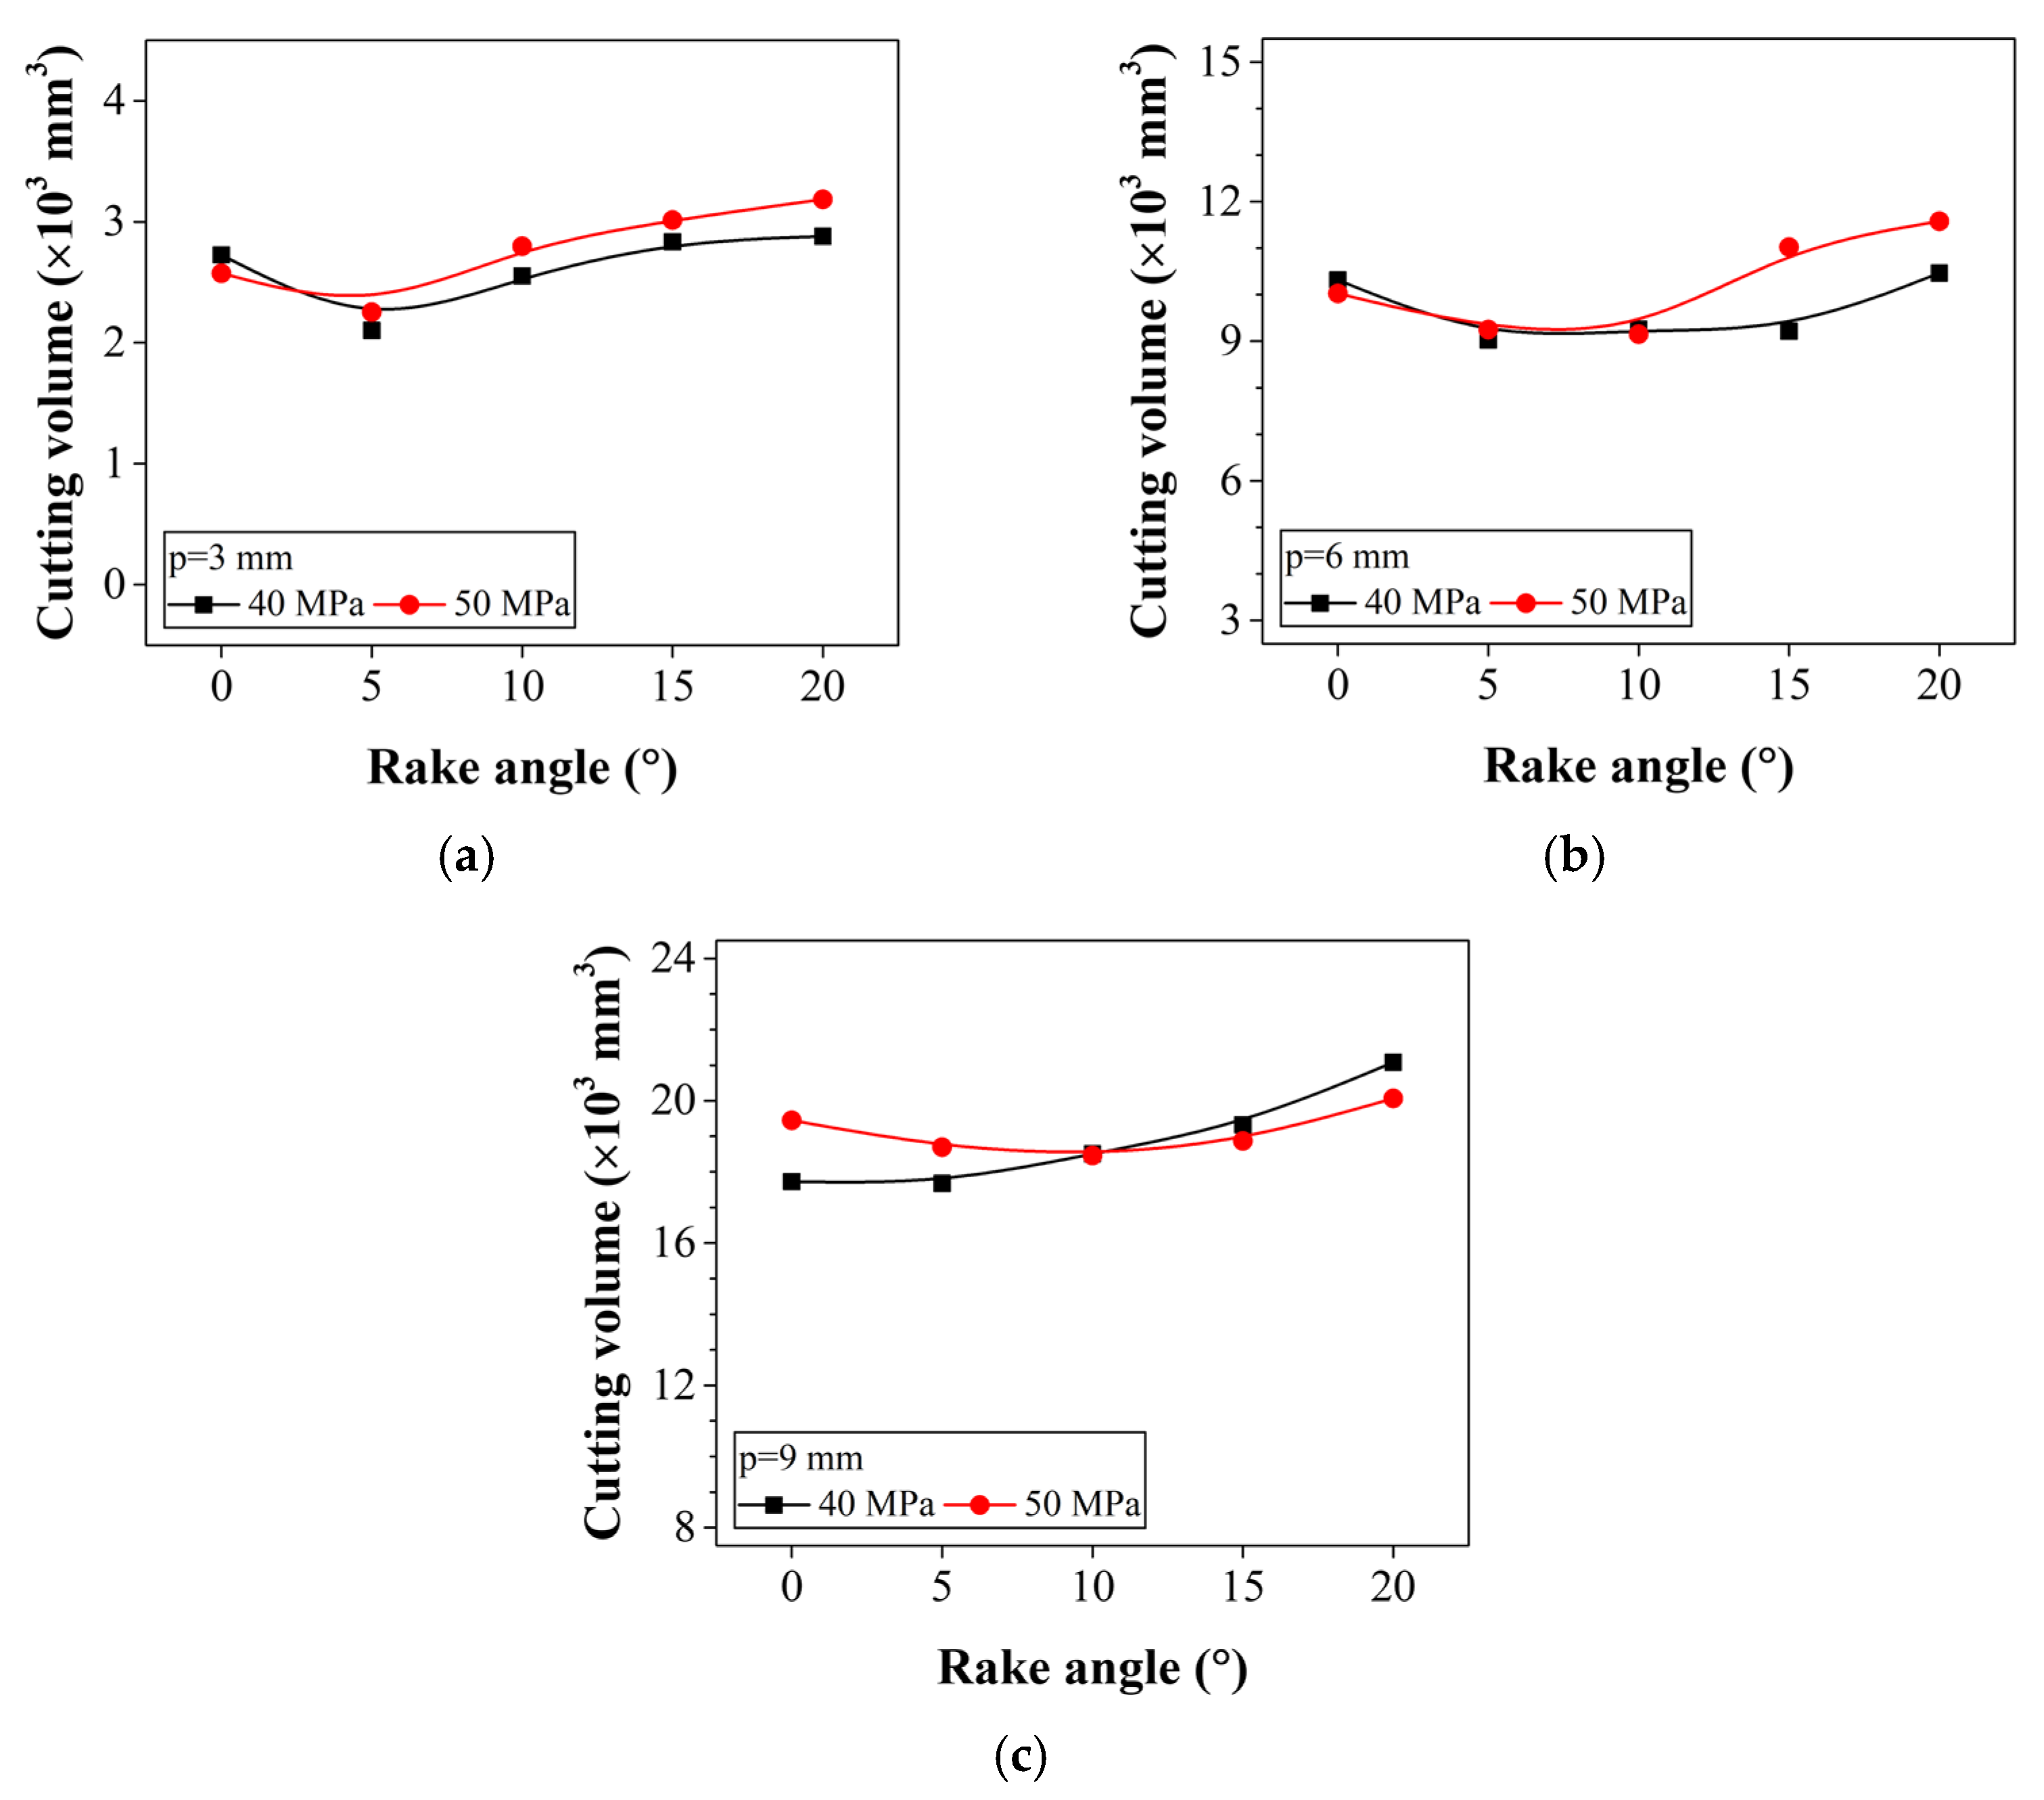
3.4. Effect of the Cutting Volume
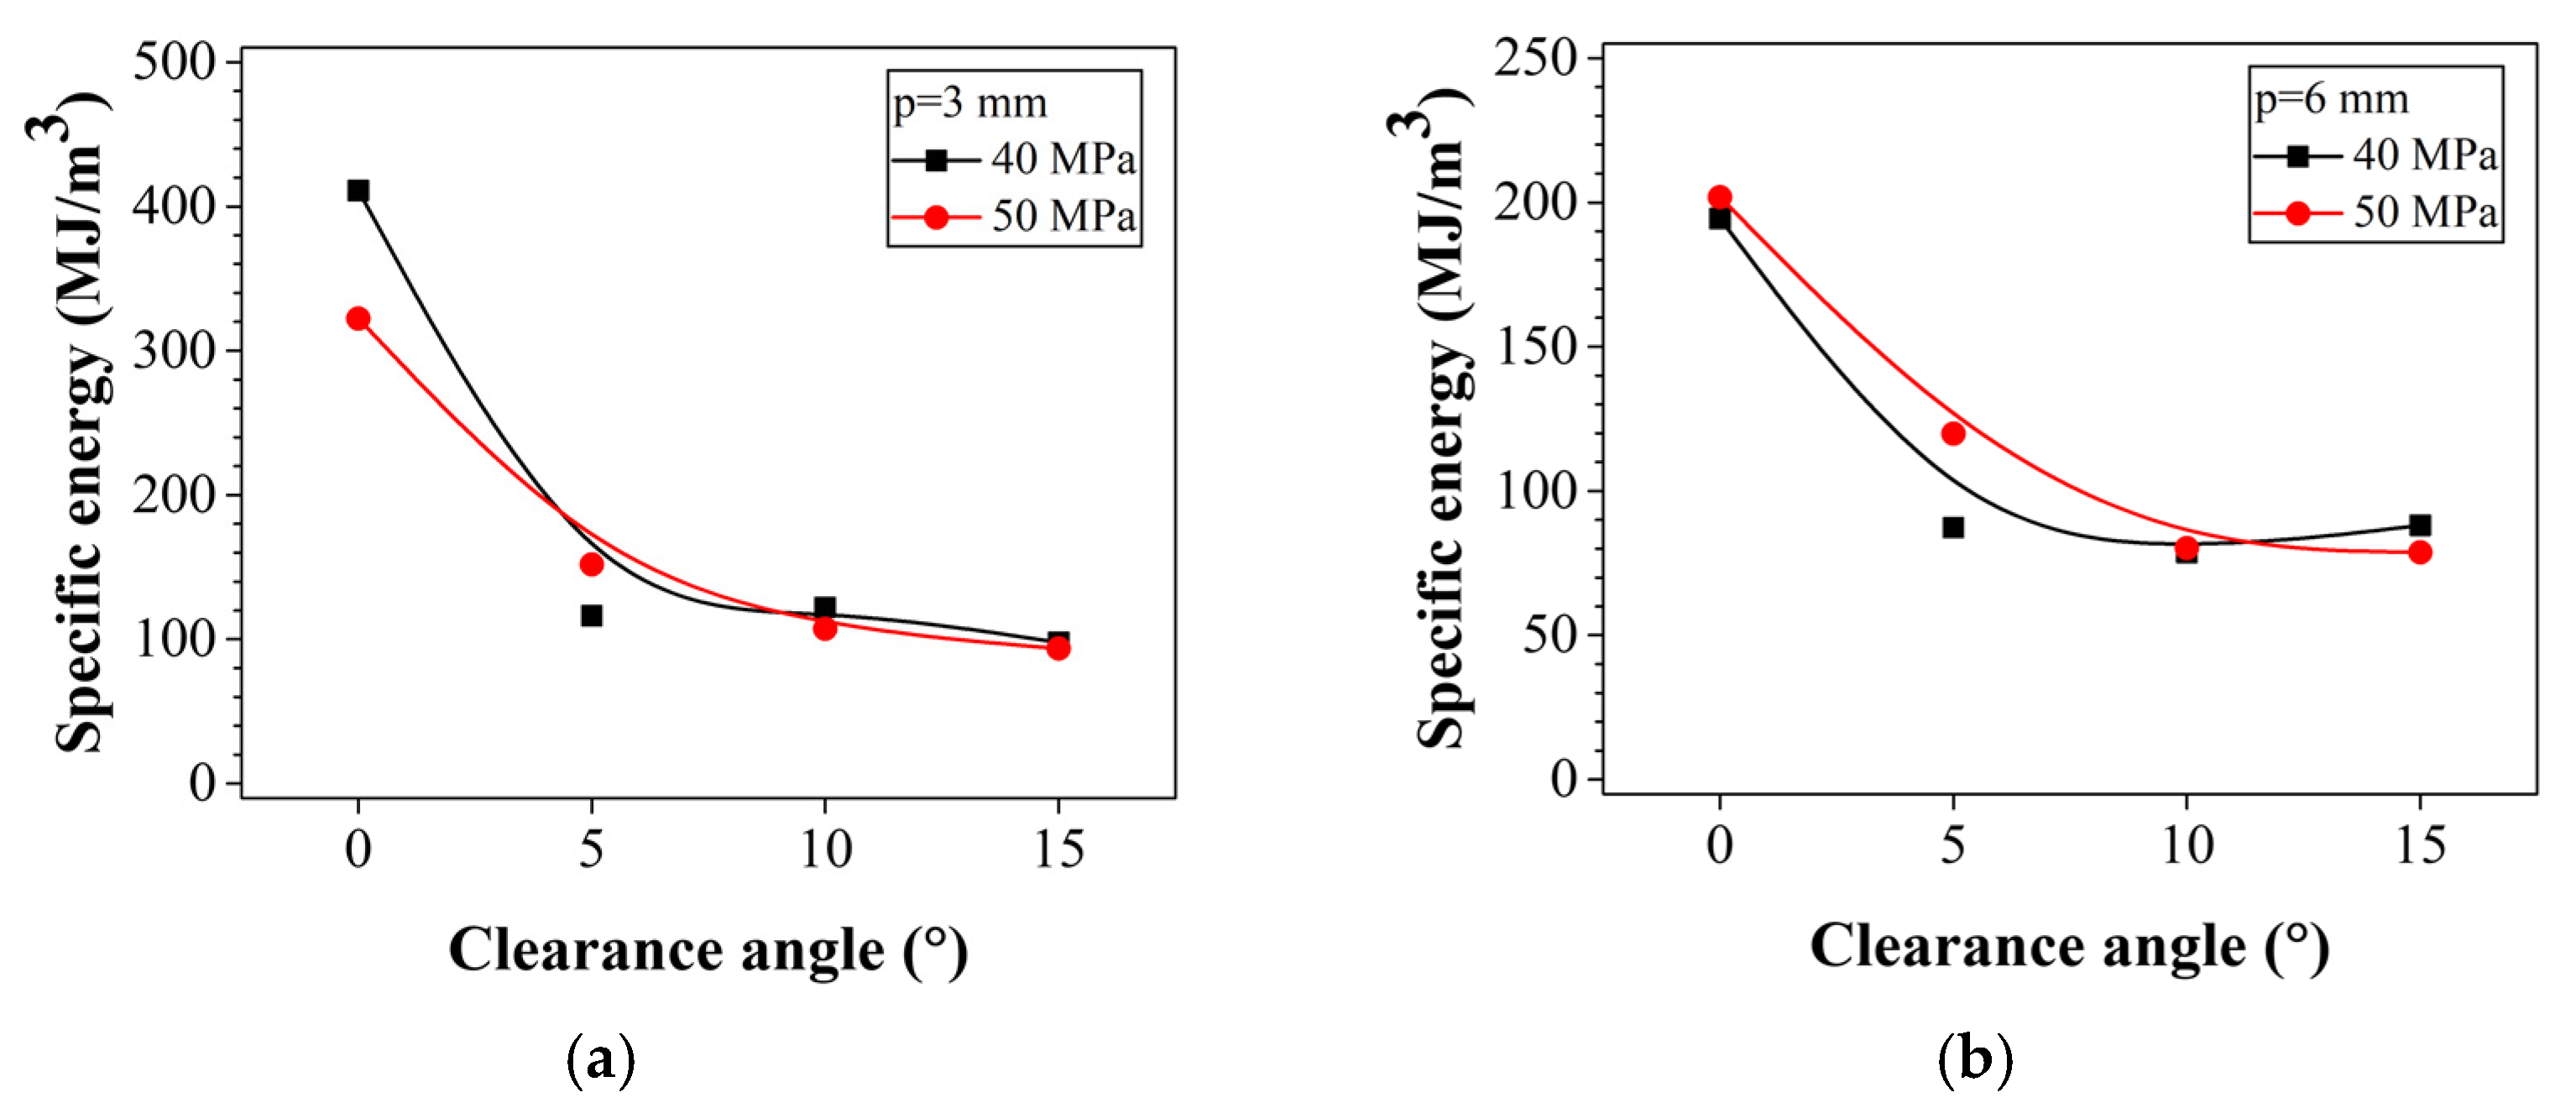
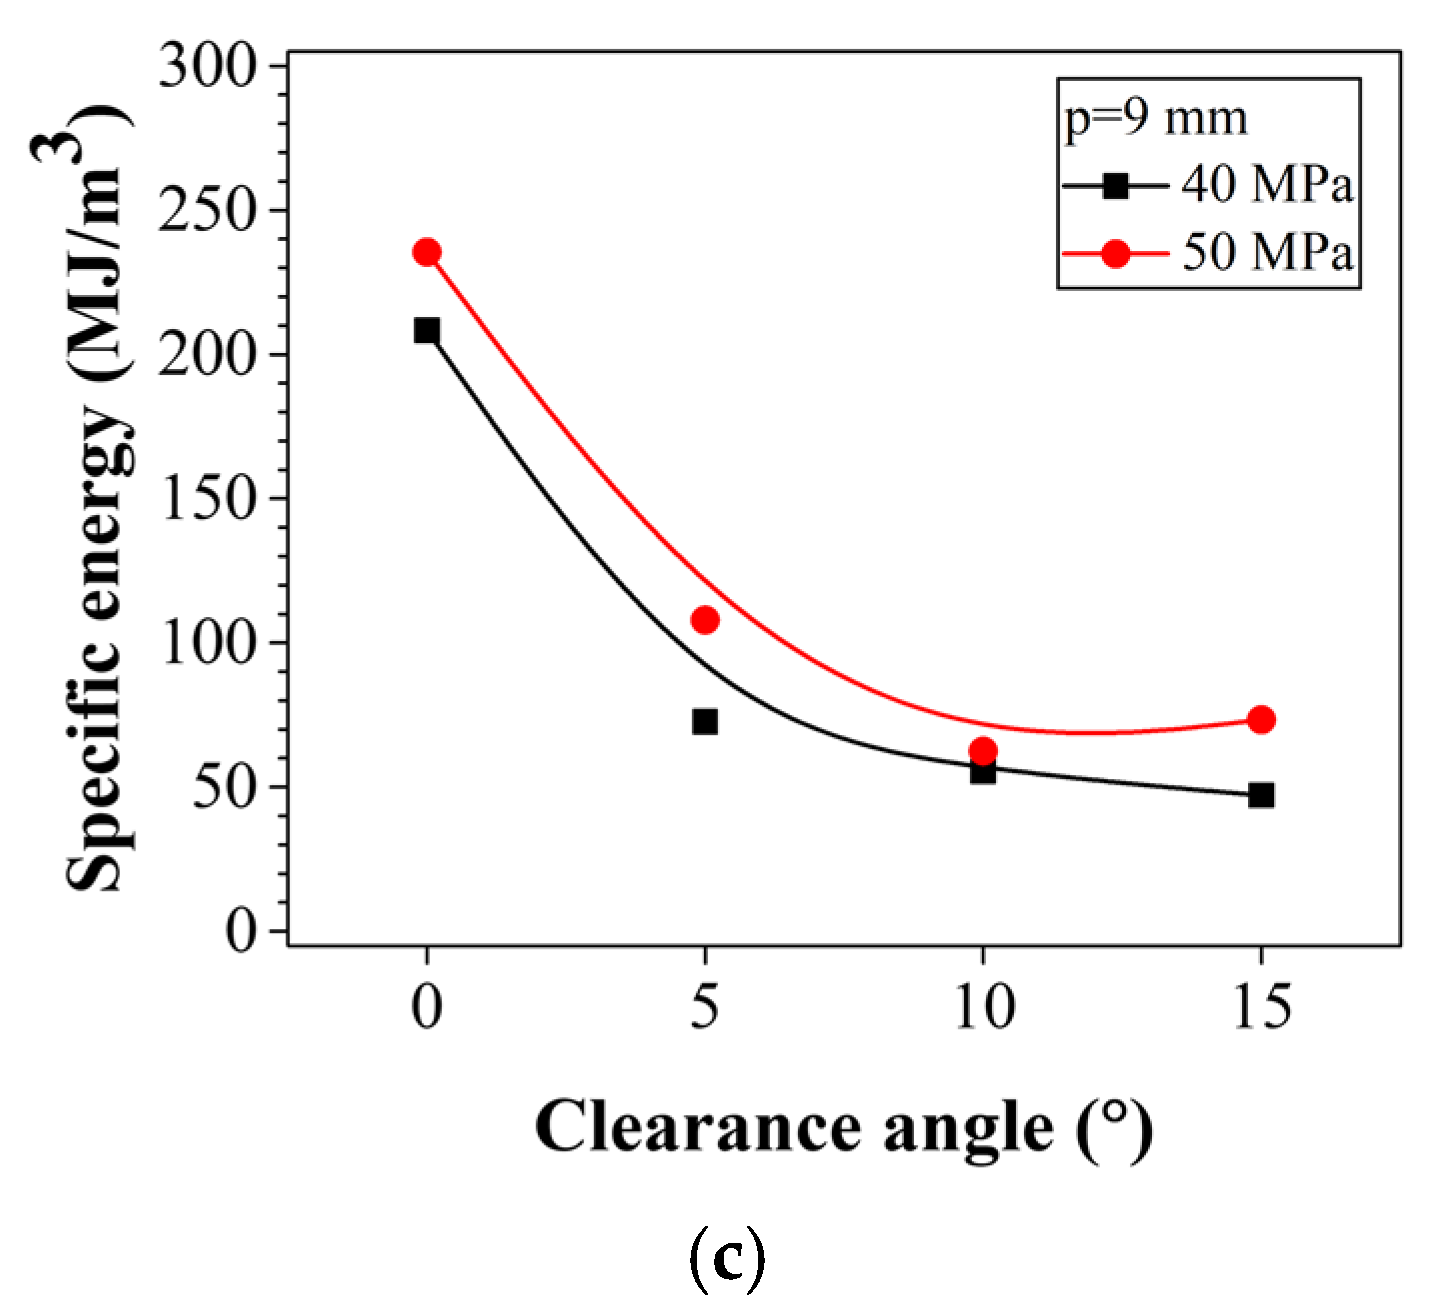
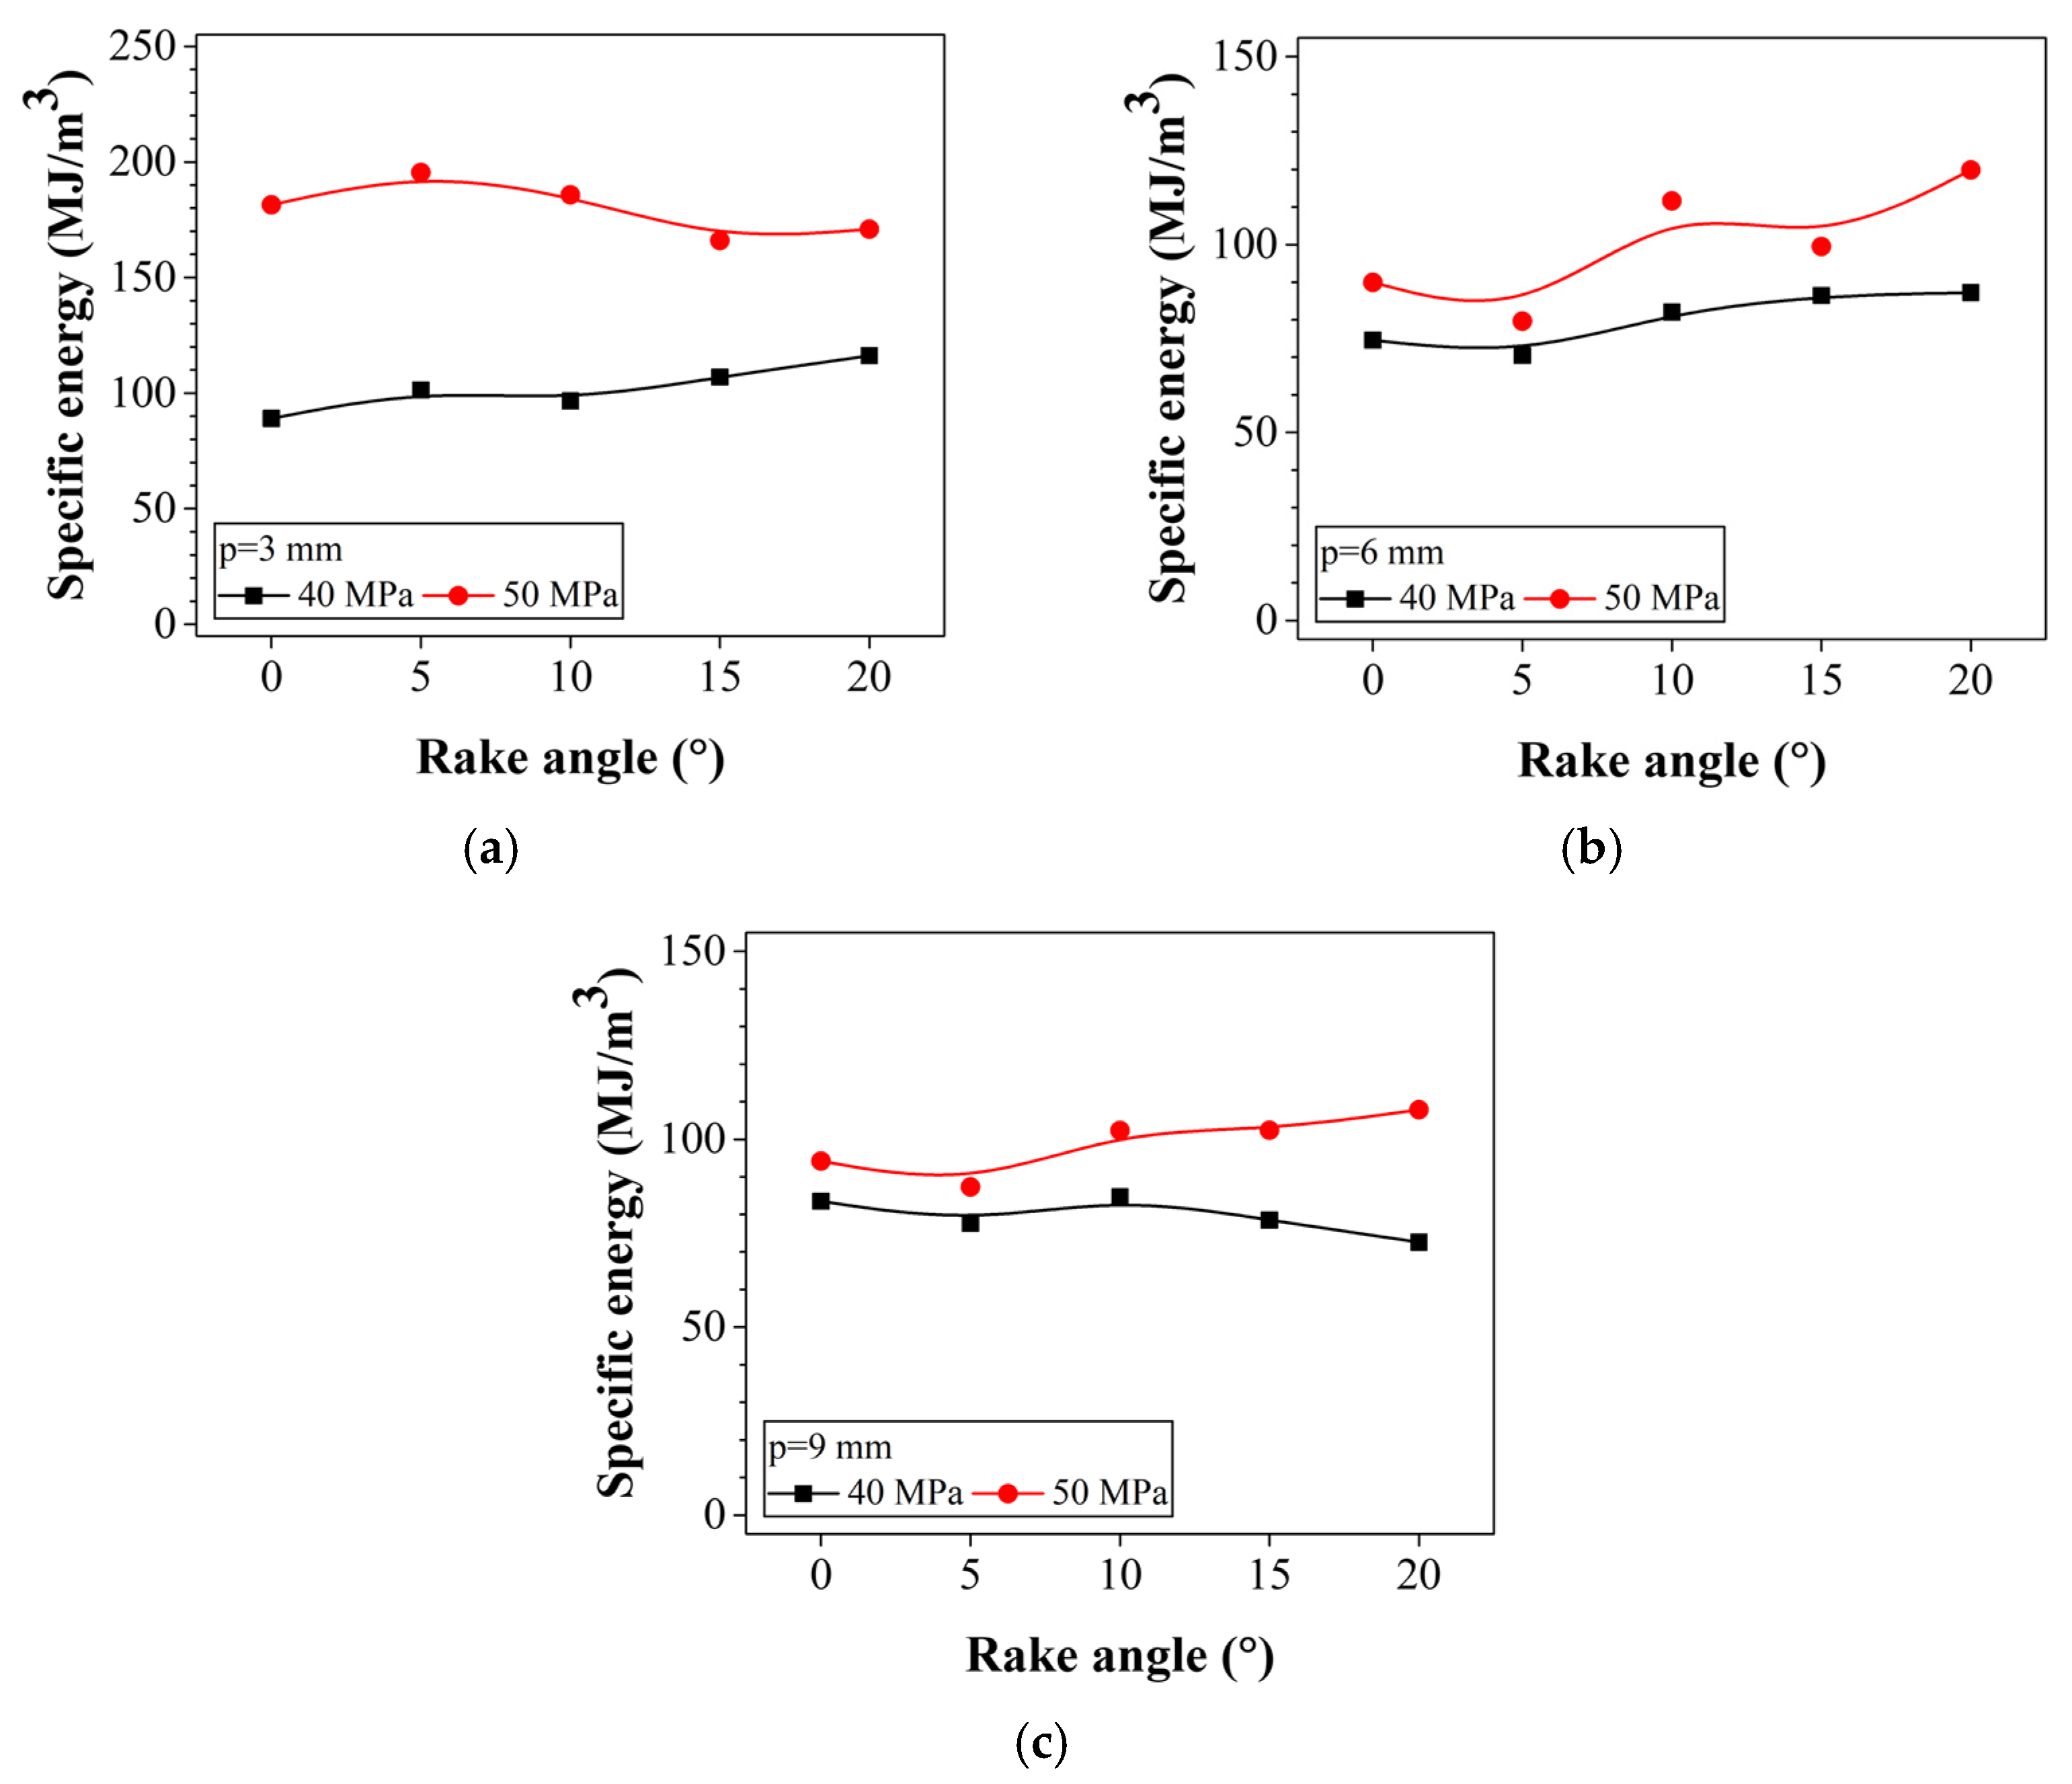
3.5. Effect on the Specific Energy
4. Conclusions
- The cutting force and clearance angle have an inverse relationship, and this relation is sharp as the angle increases from 0° to 5°. This sharp reduction occurs because of a dramatic decrease in the friction surface between the cutting tool and rock. Furthermore, when the angle exceeded 10°, it appeared to converge to a certain value.
- Similar to the cutting force, the clearance angle and cutting volume are inversely related; however, unlike the cutting force, the cutting volume decreases linearly as the angle increases. The specific energy decreased significantly from 0° to 5° and seemed to converge to a constant value after 10°, similar to the cutting force.
- The relationship between the rake angle and cutting force was direct and indirect before and after 5°, respectively. When the rake angle was increased from 0° to 5°, the cutting force decreased slightly. However, it increased subsequently owing to the increase in the friction surface of the cutting tool.
- As the rake angle increases, the cutting volume also increases, similar to the cutting force. Even when the rake angle increased from 0° to 5°, the cutting volume decreased slightly, similar to the cutting force. Subsequently, the volume increased with the angle. The specific energy also showed an increasing trend with increasing angles.
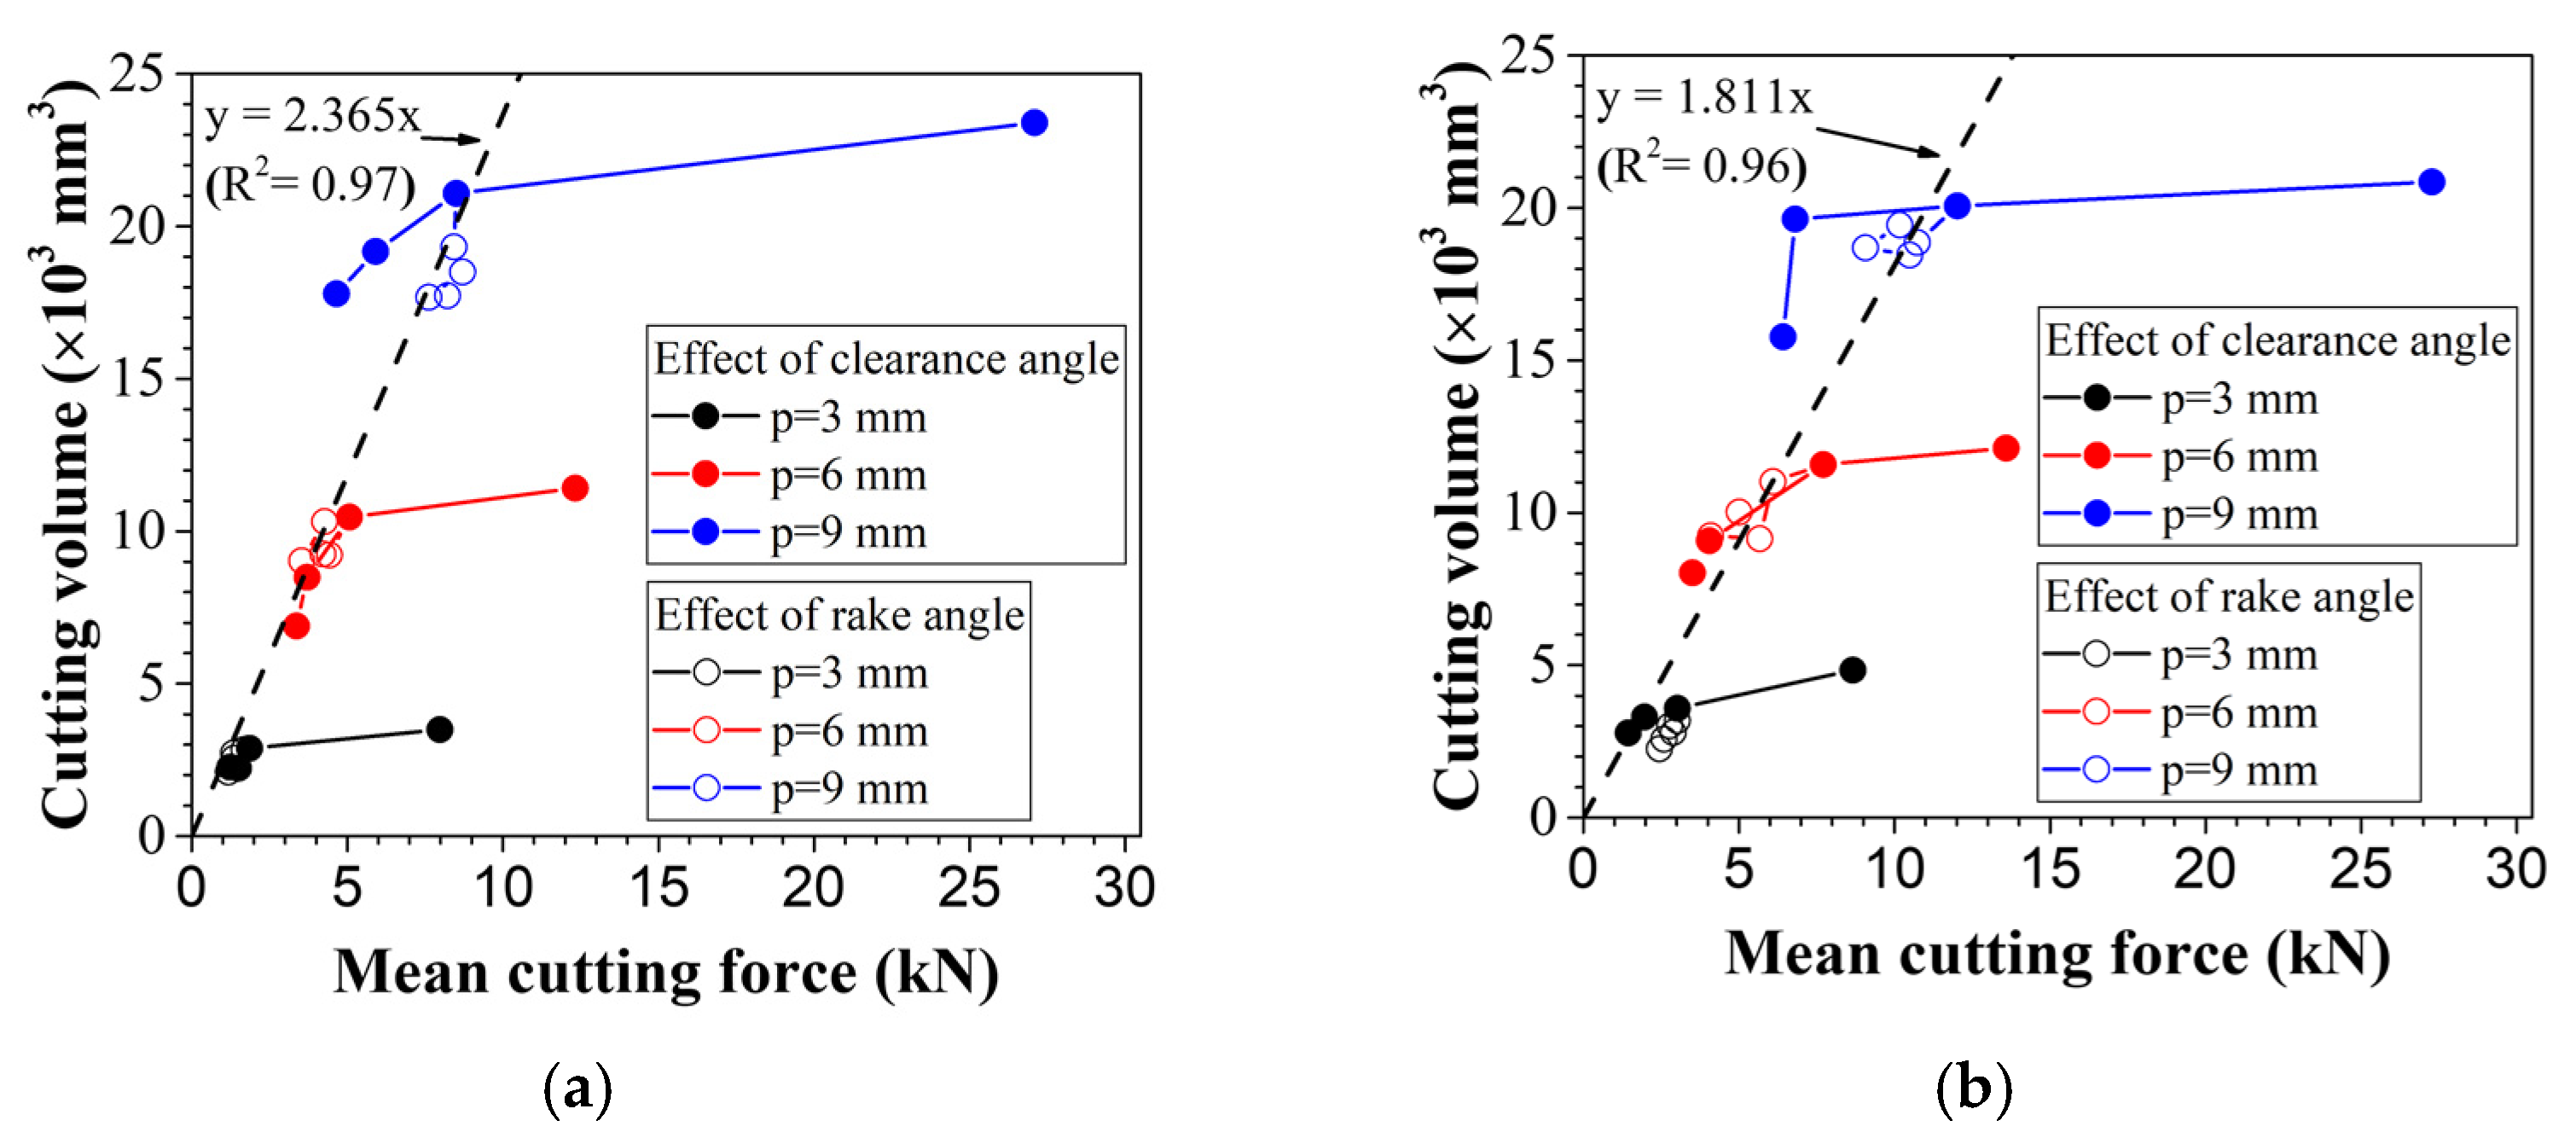
- Finally, the effect of the shape of the cutting tool appears to be mainly due to the friction between the cutting tool and rock. Among the shape variables of the cutting tool, the clearance angle has a greater effect on the cutting force, cutting volume, and specific energy. In addition, the linear relationship between the cutting force and cutting volume was confirmed.
Author Contributions
Funding
Institutional Review Board Statement
Informed Consent Statement
Data Availability Statement
Conflicts of Interest
References
- van Walsum, E. Mechanical Pre-cutting, A Rediscovered Tunneling Technique. Rock Mech. Rock Eng. 1991, 24, 65–79. [Google Scholar] [CrossRef]
- Wang, T.; Wang, X.; Tan, Z.; Li, K.; He, M. Studies on ground settlement and pre-arching stress of pre-cutting tunnelling method. Tunn. Undergr. Space Technol. 2018, 82, 199–210. [Google Scholar] [CrossRef]
- Bougard, J.F. The mechanical pre-cutting method. Tunn. Undergr. Space Technol. 1988, 3, 163–167. [Google Scholar] [CrossRef]
- Lunardi, G.; Belfiore, A.; Selleri, A.; Trapasso, R. Widening the “Montedomini” tunnel in the presence of traffic: The evolution of the “Nazzano” method. In Proceedings of the ITA-AITES World Tunnel Congress 2014 (WTC 2014), Foz do Iguaçu, Brazil, 9–14 May 2014; pp. 1–10. [Google Scholar]
- Lunardi, G.; Agresti, S.; Basta, D. The widening of the “Montedomini” A14 Motorway Tunnel in the presence of traffic. In Proceedings of the ITA-AITES World Tunnel Congress 2016 (WTC 2016), San Francisco, CA, USA, 22–28 April 2016; pp. 1–10. [Google Scholar]
- Yasar, S.; Yilmaz, A.O. Drag Pick Cutting Tests: A comparison between experimental and theoretical results. J. Rock Mech. Geomech. Eng. 2018, 10, 893–906. [Google Scholar] [CrossRef]
- Rostami, J.; Ozdemir, L.; Nilson, B. Comparison between CMS and NTH hard rock TBM performance prediction models. In Proceedings of the Annual Technical Meeting of the Institute of Shaft Drilling and Technology (ISDT), Las Vegas, NV, USA, 1–3 May 1996; pp. 1–11. [Google Scholar]
- Roxborough, F.F.; Phillips, H.R. Rock excavation by disc cutter. Int. J. Rock Mech. Min. Sci. Geomech. Abstr. 1975, 12, 361–366. [Google Scholar] [CrossRef]
- Rostami, J.; Ozdemir, L. A New Model for Performance Prediction of Hard Rock TBMs. In Proceedings of the Rapid Excavation and Tunneling Conference, Boston, MA, USA, 13–17 June 1993; pp. 793–809. [Google Scholar]
- Balci, C.; Tumac, D. Investigation into the effects of different rocks on rock cuttability by a V-type disc cutter. Tunn. Undergr. Space Technol. 2012, 30, 183–193. [Google Scholar] [CrossRef]
- Tumac, D.; Balci, C. Investigations into the cutting characteristics of CCS type disc cutters and the comparison between experimental, theoretical and empirical force estimations. Tunn. Undergr. Space Technol. 2015, 45, 84–98. [Google Scholar] [CrossRef]
- Nishimatsu, Y. The mechanics of rock cutting. Int. J. Rock Mech. Min. Sci. 1972, 9, 261–270. [Google Scholar] [CrossRef]
- Wang, X.; Wang, Q.F.; Liang, Y.P.; Su, O.; Yang, L. Dominant cutting parameters affecting the specific energy of selected sandstones when using conical picks and the development of empirical prediction models. Rock Mech. Rock Eng. 2018, 51, 3111–3128. [Google Scholar] [CrossRef]
- Aresh, B.; Khan, F.N.; Haider, J. Experimental investigation and numerical simulation of chip formation mechanisms in cutting rock-like materials. J. Petrol. Sci. Eng. 2022, 209, 109869. [Google Scholar] [CrossRef]
- Cho, J.W.; Jeon, S.; Jeong, H.Y.; Chang, S.H. Evaluation of Cutting Efficiency during TBM disc cutter excavation within a Korean granitic rock using linear-cutting-machine testing and photogrammetric measurement. Tunn. Undergr. Space Technol. 2013, 35, 37–54. [Google Scholar] [CrossRef]
- Zhang, X.; Xia, Y.; Tan, Q.; Wu, D. Comparison study on the rock cutting characteristics of disc cutter under free-face-assisted and conventional cutting methods. KSCE J. Civil Eng. 2018, 22, 4155–4162. [Google Scholar] [CrossRef]
- Copur, H.; Bilgin, N.; Balci, C.; Tumac, D.; Avunduk, E. Effects of different cutting patterns and experimental conditions on the performance of a conical drag tool. Rock Mech. Rock Eng. 2017, 50, 1585–1609. [Google Scholar] [CrossRef]
- Wang, S.; Li, X.; Du, K.; Wang, S. Experimental investigation of hard rock fragmentation using a conical pick on true triaxial test apparatus. Tunn. Undergr. Space Technol. 2018, 79, 210–223. [Google Scholar] [CrossRef]
- Li, B.; Zhang, B.; Hu, M.; Liu, B.; Cao, W.; Xu, B. Full-scale linear cutting tests to study the influence of pre-groove depth on rock-cutting performance by TBM disc cutter. Tunn. Undergr. Space Technol. 2022, 122, 104366. [Google Scholar] [CrossRef]
- Wang, S.; Sun, L.; Li, X.; Zhou, J.; Du, K.; Wang, S.; Khandelwal, M. Experimental investigation and theoretical analysis of indentations on cuboid hard rock using a conical pick under uniaxial lateral stress. Geomech. Geophys. Geo-Energy Geo-Resour. 2022, 8, 1–23. [Google Scholar] [CrossRef]
- Li, H.S.; Liu, S.Y.; Xu, P.P. Numerical simulation on interaction stress analysis of rock with conical picks. Tunn. Undergr. Space Technol. 2019, 85, 231–242. [Google Scholar] [CrossRef]
- Snowdon, R.A.; Ryley, M.D.; Temporal, J. A study of disc cutting in selected British rocks. Int. J. Rock Mech. Min. Sci. Geomech. Abstr. 1982, 19, 107–121. [Google Scholar] [CrossRef]
- Cho, J.W. Linear Cutting Test and Numerical Study on the Assessment of Rock Cuttability of a TBM Disc Cutter. Ph.D. Thesis, Seoul National University, Seoul, Korea, 2010. [Google Scholar]


| Name | Clearance Angle, α (Deg.) | Rake Angle, β (Deg.) |
|---|---|---|
| C00R20 | 0 | 20 |
| C05R20 | 5 | 20 |
| C10R20 | 10 | 20 |
| C15R20 | 15 | 20 |
| C05R00 | 5 | 0 |
| C05R05 | 5 | 5 |
| C05R10 | 5 | 10 |
| C05R15 | 5 | 15 |
| Target Strength (MPa) | Elastic Modulus (GPa) | Density (kg/m3) | Poisson’s Ratio | Uniaxial Compressive Strength, UCS (MPa) | Brazilian Tensile Strength, BTS (MPa) |
|---|---|---|---|---|---|
| 20 | 16.92 | 2214 | 0.3 | 18 | 2.06 |
| 30 | 33.35 | 2363 | 0.3 | 29.3 | 2.18 |
| 40 | 38.92 | 2382 | 0.3 | 42 | 2.51 |
| 50 | 44.47 | 2235 | 0.3 | 51.8 | 2.99 |
| UCS (MPa) | p (mm) | Clearance Angle (Deg.) | |||||||
|---|---|---|---|---|---|---|---|---|---|
| 0 | 5 | 10 | 15 | ||||||
| Fc (kN) | F’c (kN) | Fc (kN) | F’c (kN) | Fc (kN) | F’c (kN) | Fc (kN) | F’c (kN) | ||
| 20 | 3 | 4.74 | 8.47 | 0.88 | 2.44 | 0.39 | 1.52 | 0.41 | 1.38 |
| 6 | 8.42 | 15.05 | 2.12 | 5.30 | 1.53 | 4.25 | 1.68 | 4.11 | |
| 9 | 14.45 | 30.80 | 4.84 | 9.65 | 2.52 | 6.18 | 2.85 | 6.43 | |
| 30 | 3 | 7.48 | 9.75 | 1.65 | 3.68 | 1.05 | 2.54 | 0.99 | 2.40 |
| 6 | 9.04 | 14.18 | 3.40 | 6.96 | 2.49 | 5.64 | 2.65 | 5.76 | |
| 9 | 16.00 | 25.37 | 6.42 | 12.92 | 3.82 | 9.50 | 3.91 | 8.45 | |
| 40 | 3 | 7.98 | 10.68 | 1.86 | 3.55 | 1.51 | 3.08 | 1.23 | 2.53 |
| 6 | 12.33 | 21.60 | 5.07 | 9.86 | 3.71 | 7.92 | 3.37 | 6.77 | |
| 9 | 27.09 | 43.05 | 8.50 | 14.54 | 5.91 | 12.50 | 4.66 | 11.12 | |
| 50 | 3 | 8.66 | 11.28 | 3.02 | 5.94 | 1.97 | 4.85 | 1.45 | 3.57 |
| 6 | 13.59 | 21.25 | 7.71 | 12.85 | 4.05 | 9.89 | 3.51 | 8.16 | |
| 9 | 27.28 | 43.99 | 12.02 | 24.05 | 6.81 | 14.43 | 6.42 | 13.73 | |
| UCS (MPa) | p (mm) | Rake Angle (Deg.) | |||||||||
|---|---|---|---|---|---|---|---|---|---|---|---|
| 0 | 5 | 10 | 15 | 20 | |||||||
| Fc (kN) | F’c (kN) | Fc (kN) | F’c (kN) | Fc (kN) | F’c (kN) | Fc (kN) | F’c (kN) | Fc (kN) | F’c (kN) | ||
| 20 | 3 | 0.65 | 1.59 | 0.64 | 1.82 | 0.66 | 1.79 | 0.72 | 1.80 | 0.88 | 2.17 |
| 6 | 1.98 | 5.57 | 1.42 | 4.23 | 1.95 | 5.03 | 1.97 | 5.14 | 2.12 | 5.30 | |
| 9 | 4.04 | 10.11 | 3.91 | 9.01 | 4.29 | 9.24 | 4.38 | 9.50 | 4.84 | 9.65 | |
| 30 | 3 | 0.94 | 2.90 | 0.88 | 2.52 | 1.03 | 3.25 | 1.33 | 3.38 | 1.65 | 3.68 |
| 6 | 2.11 | 5.86 | 2.11 | 5.35 | 2.49 | 6.42 | 2.66 | 6.37 | 3.40 | 6.96 | |
| 9 | 5.25 | 11.00 | 5.11 | 10.71 | 5.14 | 11.45 | 5.58 | 11.64 | 6.42 | 12.92 | |
| 40 | 3 | 1.35 | 3.07 | 1.18 | 2.89 | 1.37 | 2.97 | 1.69 | 3.56 | 1.86 | 3.55 |
| 6 | 4.27 | 10.34 | 3.53 | 8.26 | 4.22 | 9.43 | 4.43 | 8.78 | 5.07 | 9.86 | |
| 9 | 8.22 | 15.79 | 7.62 | 14.41 | 8.71 | 15.34 | 8.43 | 14.98 | 8.50 | 14.54 | |
| 50 | 3 | 2.59 | 5.57 | 2.45 | 5.10 | 2.89 | 5.90 | 2.78 | 6.25 | 3.02 | 5.94 |
| 6 | 5.01 | 11.55 | 4.09 | 9.38 | 5.67 | 11.57 | 6.09 | 11.83 | 7.71 | 12.85 | |
| 9 | 10.18 | 19.33 | 9.07 | 17.46 | 10.50 | 20.12 | 10.73 | 21.22 | 12.02 | 24.05 | |
| UCS (MPa) | p (mm) | Clearance Angle (Deg.) | |||||||
|---|---|---|---|---|---|---|---|---|---|
| 0 | 5 | 10 | 15 | ||||||
| Vc (mm3) | SE (MJ/m3) | Vc (mm3) | SE (MJ/m3) | Vc (mm3) | SE (MJ/m3) | Vc (mm3) | SE (MJ/m3) | ||
| 40 | 3 | 3495 | 411.0 | 2880 | 116.2 | 2229 | 122.0 | 2267 | 97.9 |
| 6 | 11,416 | 194.4 | 10,463 | 87.2 | 8489 | 78.6 | 6892 | 88.1 | |
| 9 | 23,400 | 208.3 | 21,082 | 72.6 | 19,180 | 55.5 | 17,788 | 47.1 | |
| 50 | 3 | 4840 | 322.2 | 3585 | 151.8 | 3306 | 107.2 | 2779 | 93.6 |
| 6 | 12,124 | 201.8 | 11,580 | 119.8 | 9087 | 80.2 | 8030 | 78.7 | |
| 9 | 20,855 | 235.4 | 20,065 | 107.9 | 19,638 | 62.4 | 15,772 | 73.3 | |
| UCS (MPa) | p (mm) | Rake Angle (Deg.) | |||||||||
|---|---|---|---|---|---|---|---|---|---|---|---|
| 0 | 5 | 10 | 15 | 20 | |||||||
| Vc (mm3) | SE (MJ/m3) | Vc (mm3) | SE (MJ/m3) | Vc (mm3) | SE (MJ/m3) | Vc (mm3) | SE (MJ/m3) | Vc (mm3) | SE (MJ/m3) | ||
| 40 | 3 | 2726 | 89.0 | 2102 | 101.3 | 2551 | 96.6 | 2835 | 107.0 | 2880 | 116.2 |
| 6 | 10,317 | 74.5 | 9026 | 70.5 | 9258 | 82.0 | 9217 | 86.4 | 10,463 | 87.2 | |
| 9 | 20,744 | 83.5 | 17,675 | 77.6 | 18,504 | 84.7 | 19,323 | 78.5 | 21,082 | 72.6 | |
| 50 | 3 | 2574 | 181.4 | 2254 | 195.4 | 2799 | 185.8 | 3014 | 166.0 | 3185 | 170.9 |
| 6 | 10,027 | 89.9 | 9252 | 79.6 | 9150 | 111.6 | 11,025 | 99.5 | 11,580 | 119.8 | |
| 9 | 19,448 | 94.2 | 18,693 | 87.3 | 18,457 | 102.4 | 18,866 | 102.4 | 20,065 | 107.9 | |
Publisher’s Note: MDPI stays neutral with regard to jurisdictional claims in published maps and institutional affiliations. |
© 2022 by the authors. Licensee MDPI, Basel, Switzerland. This article is an open access article distributed under the terms and conditions of the Creative Commons Attribution (CC BY) license (https://creativecommons.org/licenses/by/4.0/).
Share and Cite
Kim, H.-e.; Nam, K.-m.; Kyeon, T.-s.; Rehman, H.; Yoo, H.-k. Analysis of the Effect of the Tool Shape on the Performance of Pre-Cutting Machines during Tunneling Using Linear Cutting Tests. Appl. Sci. 2022, 12, 4489. https://doi.org/10.3390/app12094489
Kim H-e, Nam K-m, Kyeon T-s, Rehman H, Yoo H-k. Analysis of the Effect of the Tool Shape on the Performance of Pre-Cutting Machines during Tunneling Using Linear Cutting Tests. Applied Sciences. 2022; 12(9):4489. https://doi.org/10.3390/app12094489
Chicago/Turabian StyleKim, Han-eol, Kyoung-min Nam, Tae-su Kyeon, Hafeezur Rehman, and Han-kyu Yoo. 2022. "Analysis of the Effect of the Tool Shape on the Performance of Pre-Cutting Machines during Tunneling Using Linear Cutting Tests" Applied Sciences 12, no. 9: 4489. https://doi.org/10.3390/app12094489
APA StyleKim, H.-e., Nam, K.-m., Kyeon, T.-s., Rehman, H., & Yoo, H.-k. (2022). Analysis of the Effect of the Tool Shape on the Performance of Pre-Cutting Machines during Tunneling Using Linear Cutting Tests. Applied Sciences, 12(9), 4489. https://doi.org/10.3390/app12094489