1. Introduction
Since the beginning of 2020, the SARS-CoV-2 virus (Severe Acute Respiratory Syndrome-Corona Viruses-2) has triggered the outbreak of a world-wide pandemic, leading to restrictive measures of isolation and closure. To face the health emergency, hospitals increased the number of beds in intensive care units (ICUs) and introduced novel indicators for prioritizing patient admission and predicting patient outcome.
A reverse-transcriptase polymerase chain reaction (RT-PCR) assay from nasopharyngeal swabs or bronchoalveolar lavage is the reference test for diagnosing SARS-CoV-2 infection [
1]. Chest Computed Tomography (CT) has recently been considered to be a potential non-invasive method for independently confirming the diagnosis of suspected COVID-19 patients with a sensitivity of 97%, specificity of 25%, and accuracy of 68% [
2]. Consequently, many COVID-19 patients underwent CT scans to evaluate the extent of the damage and improve prognosis estimation thus increasing the possibility of an overdiagnosis.
In addition, CT-based radiological findings (e.g., Ground Glass Opacity [GGO], Crazy Paving, Lung Consolidation) can detect SARS-CoV-2 virus based on 2D/3D imaging techniques in one or both lungs and can be used as a surrogate of disease severity. These findings were reached by means of a consensus in the European Society of Radiology (ESR) [
3].
Furthermore, images can convey a large amount of information which the human eye cannot objectively quantify, providing other potential predictive or prognostic factors related to the COVID-19 disease. For this reason, the field of radiomics uses rigorous mathematical definitions and well-defined approaches [
4] to quantitatively describe the image-based properties contained within radiological images, such as texture and shape/volumetric information.
Semi-automatic segmentation has recently been suggested as a tool for quickly sectioning the lungs or the COVID-19 lesions, enabling the extraction of the radiomic features in order to improve the prediction of several clinical endpoints, including ICU admission, need for ventilators [
5,
6,
7,
8,
9,
10], and severe vs. critical conditions [
9]. However, only a limited number of papers have investigated patient mortality as an outcome, often having only a relatively limited patient cohort or a short patient follow-up [
5,
6,
7,
8,
9,
10].
The former limitation is likely related to the manual nature of the segmentation methods used in the papers published, which represents a very time-consuming task. During the pandemic, various semi-automatic segmentation COVID-19-dedicated tools became available; therefore, the performance of Machine Learning models built on the radiomic features extracted was investigated, using one of these tools for predicting mortality in a high-risk COVID-19-positive group.
2. Materials and Methods
2.1. Study Design
The study, regarding the prognostic value of radiomic features, was conducted and included all patients suitable for analysis, according to the guidelines of the Declaration of Helsinki. The study was approved by the Institutional Review Board (or Ethics Committee) of the IRCCS University Hospital of Bologna (protocol code no. EM949-2020_507/2020/Oss/AOUBo, approved on 16 September 2020).
All patients identified according to the inclusion/exclusion criteria before the Ethics committee approval were included retrospectively, while the remaining population (after 16 September 2020) was included prospectively; informed consent forms were obtained. All the clinical data were retrieved from an ad hoc clinical database for SARS-CoV-2 patient management, while the radiological data and CT chest images were retrieved from structured reports and Digital Image Communication in Medicine (DICOM) files available from the Radiology Information System (RIS) and Picture Archiving and Communication System (PACS), respectively.
2.2. Patient Cohort
The patient cohort was made up of a subset of patients, confirmed positive for COVID-19 using RT-PCR, admitted to the IRCCS University Hospital of Bologna–Polyclinic Sant’Orsola-Malpighi (IRCCS AOSP), redirected from neighboring hospitals from February 2020 to March 2021 since the authors’ Institute is a regional emergency hub capable of managing patients at high risk of SARS-CoV-2 infection [
11]. Consequently, the present cohort of hospitalized patients was considered at high risk irrespective of the referring hospital.
Chest CT scan findings (radiological and radiomics) and the clinical data available at patient admission were used to develop a predictive model of patient mortality.
The inclusion criteria were the following: having a chest CT scan with slice thicknesses of between 1 and 1.25 mm without contrast medium acquired after patient admission and recorded on the RIS-PACS of the IRCCS AOSP associated with radiological findings, and a complete set of clinical baseline information including RT-PCR positivity to COVID-19. When multiple CT scans were available, only that closest to the date of admission was analyzed.
The duration of hospitalization is reported in
Supplementary Materials Table S1 according to patient outcome as well as period of first diagnosis (first or second wave). Moreover, the days elapsed between the CT scan and the hospitalization date were not statistically significantly different (
p-value = 0.29) using a standard
t-test comparing patients by outcome. The average days of survival were 21 and 14 in the patients hospitalized in the first and second wave, respectively; this difference showed a trend (
p-value = 0.074), indicating that patients with severe disease were better selected during the second wave, albeit with expected improvement in the treatment strategies available over time.
The inclusion criteria were fulfilled by 436 patients, i.e., 286 males (65.6%) and 150 females (34.4%). The main patient characteristics and baseline comorbidities are reported in
Table 1. The median age was 68.5 (21–99) years; a hypertension status was recorded in 241 patients. Two-hundred and fifty-one had a fever (Temperature ≥ 38°) at hospital admission. The choice of using this cutoff for fever was based on the variability of body temperature occurring on the day of admission. Information regarding fever and hypertensive state were included in the routine admission procedure and, hence, were available for all patients; however, no additional details were recorded at admission.
It is also worth noting that the present cohort presented a large prevalence of obese individuals (83%). This could have been a bias as since an estimation of the visceral fat surface and muscular surface obtained with the segmentation software by segmenting a slice at the height of vertebra T12 of the thoracic region was available, the authors expected some dependency on body composition to arise from the respective radiomic feature, which allowed much more nuance in patient characterization.
The CT scans were obtained using an Ingenuity CT (Philips Medical Systems, Cleveland, OH, USA) in 56% of patients, a Lightspeed VCT (General Electric Healthcare, Chicago, IL, USA) in 41% of patients, and an ICT SP (Philips Medical Systems, Cleveland, OH, USA) in 3% of patients.
The scanners can be considered equivalent as the CT chest acquisition protocols were set to produce comparable image quality as verified during the Quality Assurance (QA) controls. In addition, the acquisition protocols remained unchanged during the entire data collection period.
For the most part, the kilovolt peaks (kVps) were set to 120 kV (91.5% scans), with a few exceptions which were set to 100 kV (5.0% scans) or 140 kV (3.5% scans), according to patient characteristics.
2.3. Image Segmentation
Sophia DDM for Radiomics [
12] is a CE/FDA-marked software for SARS-CoV-2 patients which offers a CT-based automated workflow for whole-lung segmentation and disease quantification. It was used for both lung and disease volume of interest (VOI) segmentation as well as for radiomic feature extraction [
12].
The segmentation was based on region growing techniques, and used gradient detection and volume stability to regulate the convergence of the process. The majority of the radiomic features were defined and extracted following the workflow as per Image Biomarker Standardization Initiative (IBSI) [
4] regulations.
Sophia Radiomics also uses two thresholds which correspond qualitatively to the portion of GGO (from −740 HU to −400 HU) and the range of pixel values representing the vascular tree (from −400 HU to about 1000 HU).
These voxels are counted and kept as a measure of damage volume (in mL). In particular, these ranges are generally appropriate for differentiating GGO from the vascular tree; they may affect the quality of the radiomic features extracted and can be manually modified by the user upon visual inspection, if required.
The software produces one-hundred and seventy-seven features relative to both lungs as a single VOI. In addition, quantification of the visceral fat and abdominal mass surface, as a surrogate of Sarcopenia, was computed using manual segmentation of the abdominal cavity on a single slice at the height of vertebra T12. These surfaces identified via the thresholding method were computed by counting the pixels identified and were expressed in cm2. In all cases in which the segmentation obtained semi-automatically was incomplete, the patients were eliminated from the study both in cases of partial imaging scans as well as in cases of widespread infection affecting software segmentation capability. All patients were checked manually after the segmentation process for a final approval of inclusion.
2.4. Patient and Image Characteristics
The dataset was composed of 436 patients, each with a set of assigned features. For convenience, the features were categorized into three subsets: Clinical, Radiomic, and Radiological.
The clinical features available at hospital admission were divided into (a) continuous: age at the time of the CT exam and respiratory rate in breaths/min, and (b) binary: Sex of the patient, obesity status, fever at the hospital admission, hypertension condition, and smoking history.
One-hundred and seventy-nine radiomic features were supported by the segmentation software, the majority of which were described in [
4], with the addition of visceral fat and abdominal mass.
The six radiological features included the acquisition parameters (kVp, current, and slice thickness) extracted from the DICOM header and Boolean features (such as the bilaterality of the lung damage, the presence of GGO, lung consolidations, and crazy paving) assessed by expert radiologists and extracted from the structured medical report.
Different models were built using each of the feature groups to compare performance in a single and/or combined fashion and evaluate the potential benefits in terms of prognostic value. The structure of the training and testing, reported below in this section, was the same in all subsets regardless of the input features; the models were named using the same name as the family given in the input features. The outcome investigated was the mortality observed in 78/436 patients.
2.5. Predictive Models
All the analyses were conducted using Python-3 [
13], utilizing the scikit-learn libraries [
14], imblearn [
15], pandas [
16], numpy [
17], scipy [
18], and ELI5 [
19], while the plotting was carried out using matplotlib [
20] and seaborn [
21].
The data were analyzed using Machine Learning (ML) methods, including regression regularized via Least Absolute Shrinkage and Selection Operator (LASSO) [
22], the Random Forest classifier [
23], or the Fully connected Neural Network (FcNN) [
24].
Details regarding the implementation of all the algorithms can be found in the scikit-learn [
14] documentation of LASSO cross-validation (LassoCV), Random Forest classifier, and Multi-layer Perceptron Classifier (FcNN Classifier) functions. Lasso CV has been utilized with all the default parameters since they are automatically optimized by means of a built-in cross-validation procedure. The random forest was built using 200 decision trees with balanced class weights, and the FcNN classifier was utilized with alpha = 10, a single hidden layer with five nodes, max number of iterations = 1000, activation function ReLu, and “lbfgs” solver. The RF hyper-parameters were chosen using a parametric scan to explore the main possible combination of values including number of estimators, max depth, max number of features, and oob score. In addition, the impact of dataset dimensionality reduction was also investigated for the RF approach.
Different pre-processing procedures were followed for the different algorithms. Since the present dataset was heavily unbalanced (18% mortality), the Random Forest, which was the most sensitive to imbalances in the dataset, was preceded by a Synthetic Minority Oversampling Technique [
25] which created new instances of the minority class using the convex combination of a set of samples in the minority class. The Standard Scaler was used to carry out z-score scaling on all the features before Random Forest implementation.
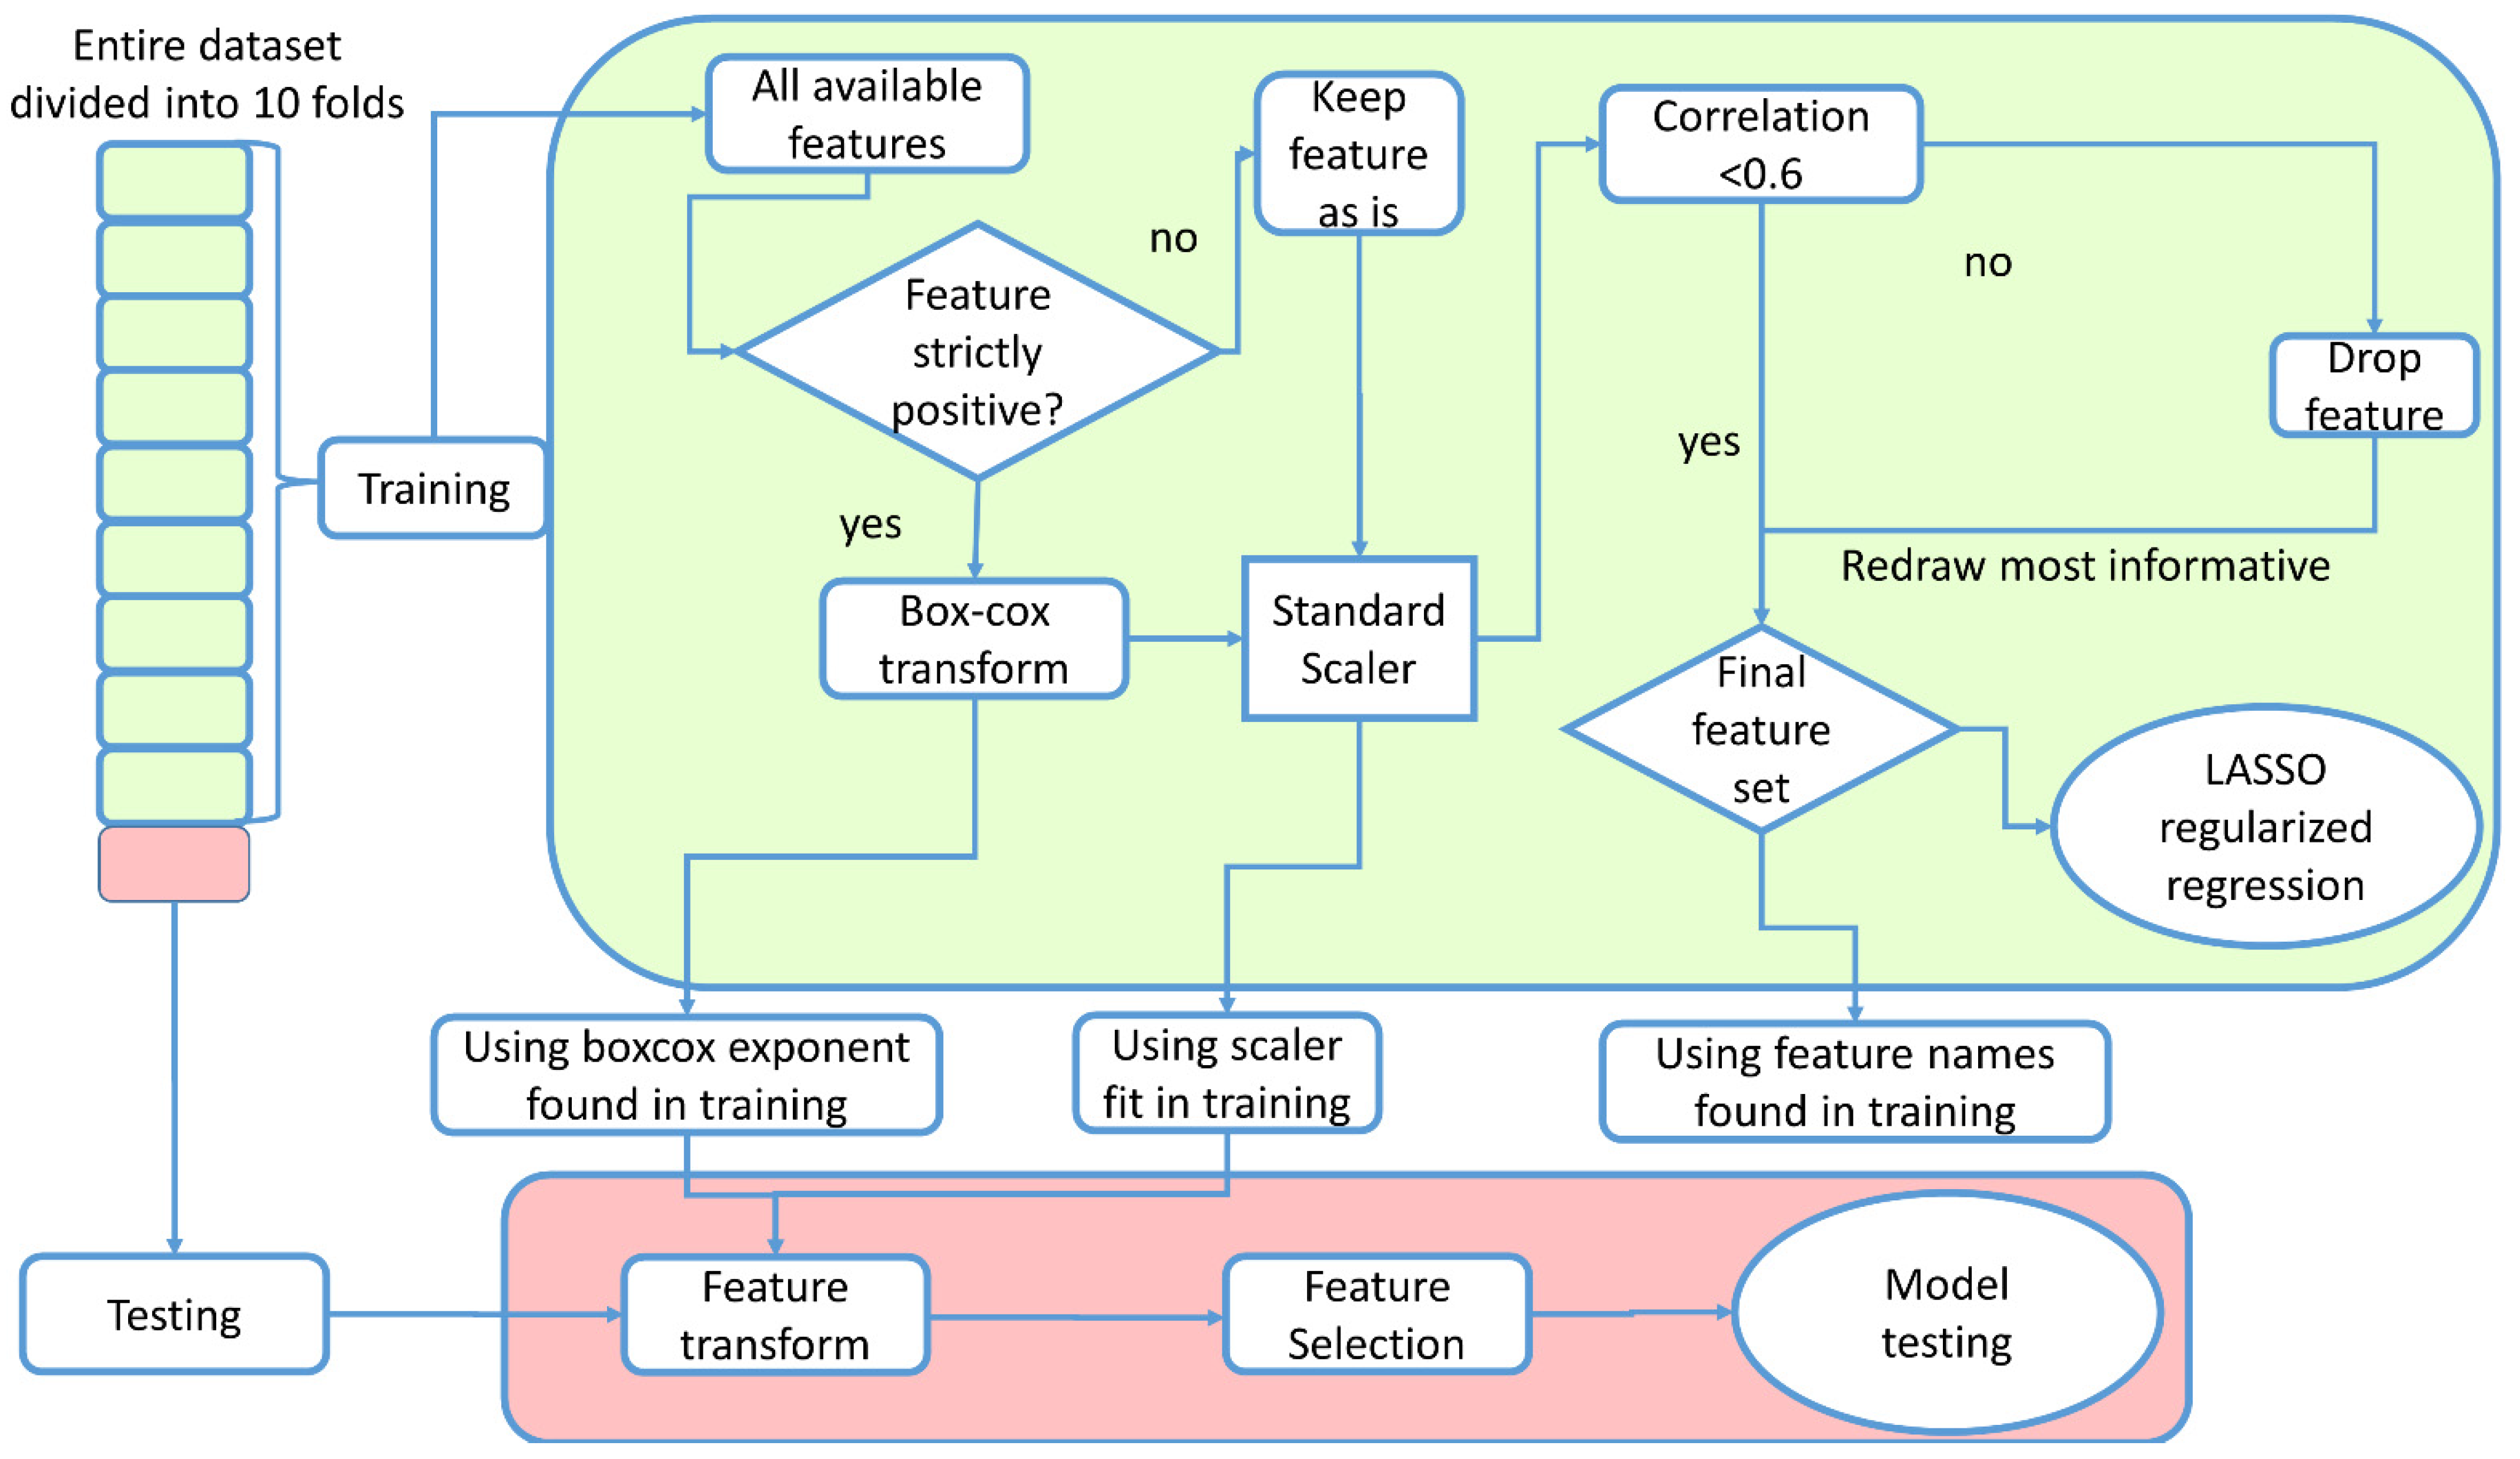
In the case of LASSO and FcNN, normalization and scaling of the features was achieved using the Box–Cox transformation and the Standard Scaler, respectively. The number of features was reduced by using a threshold of 0.6 in the Spearman correlation. In addition, the single feature which was best correlated with the patient outcome using the Spearman correlation test was re-included in the set of remaining features.
For all the algorithms, evaluation of the models was carried out using a 10-fold cross-validation approach, with stratification with respect to the outcome, to obtain a more realistic evaluation of the model performance, using the “cross-val-predict” scikit-learn function. The data analysis pipeline is represented schematically in
Figure 1.
The hyperparameter search for the Lasso was carried out automatically, using an additional stratified 10-fold cross-validation in the training phase. To avoid data leakage, the entire cross-validation procedure was managed using the scikit-learn library.
In all cases, performance was evaluated using the Area Under the Curve (AUC) of the respective Receiver Operator characteristic (ROC) curves as well as sensitivity and specificity.
3. Results
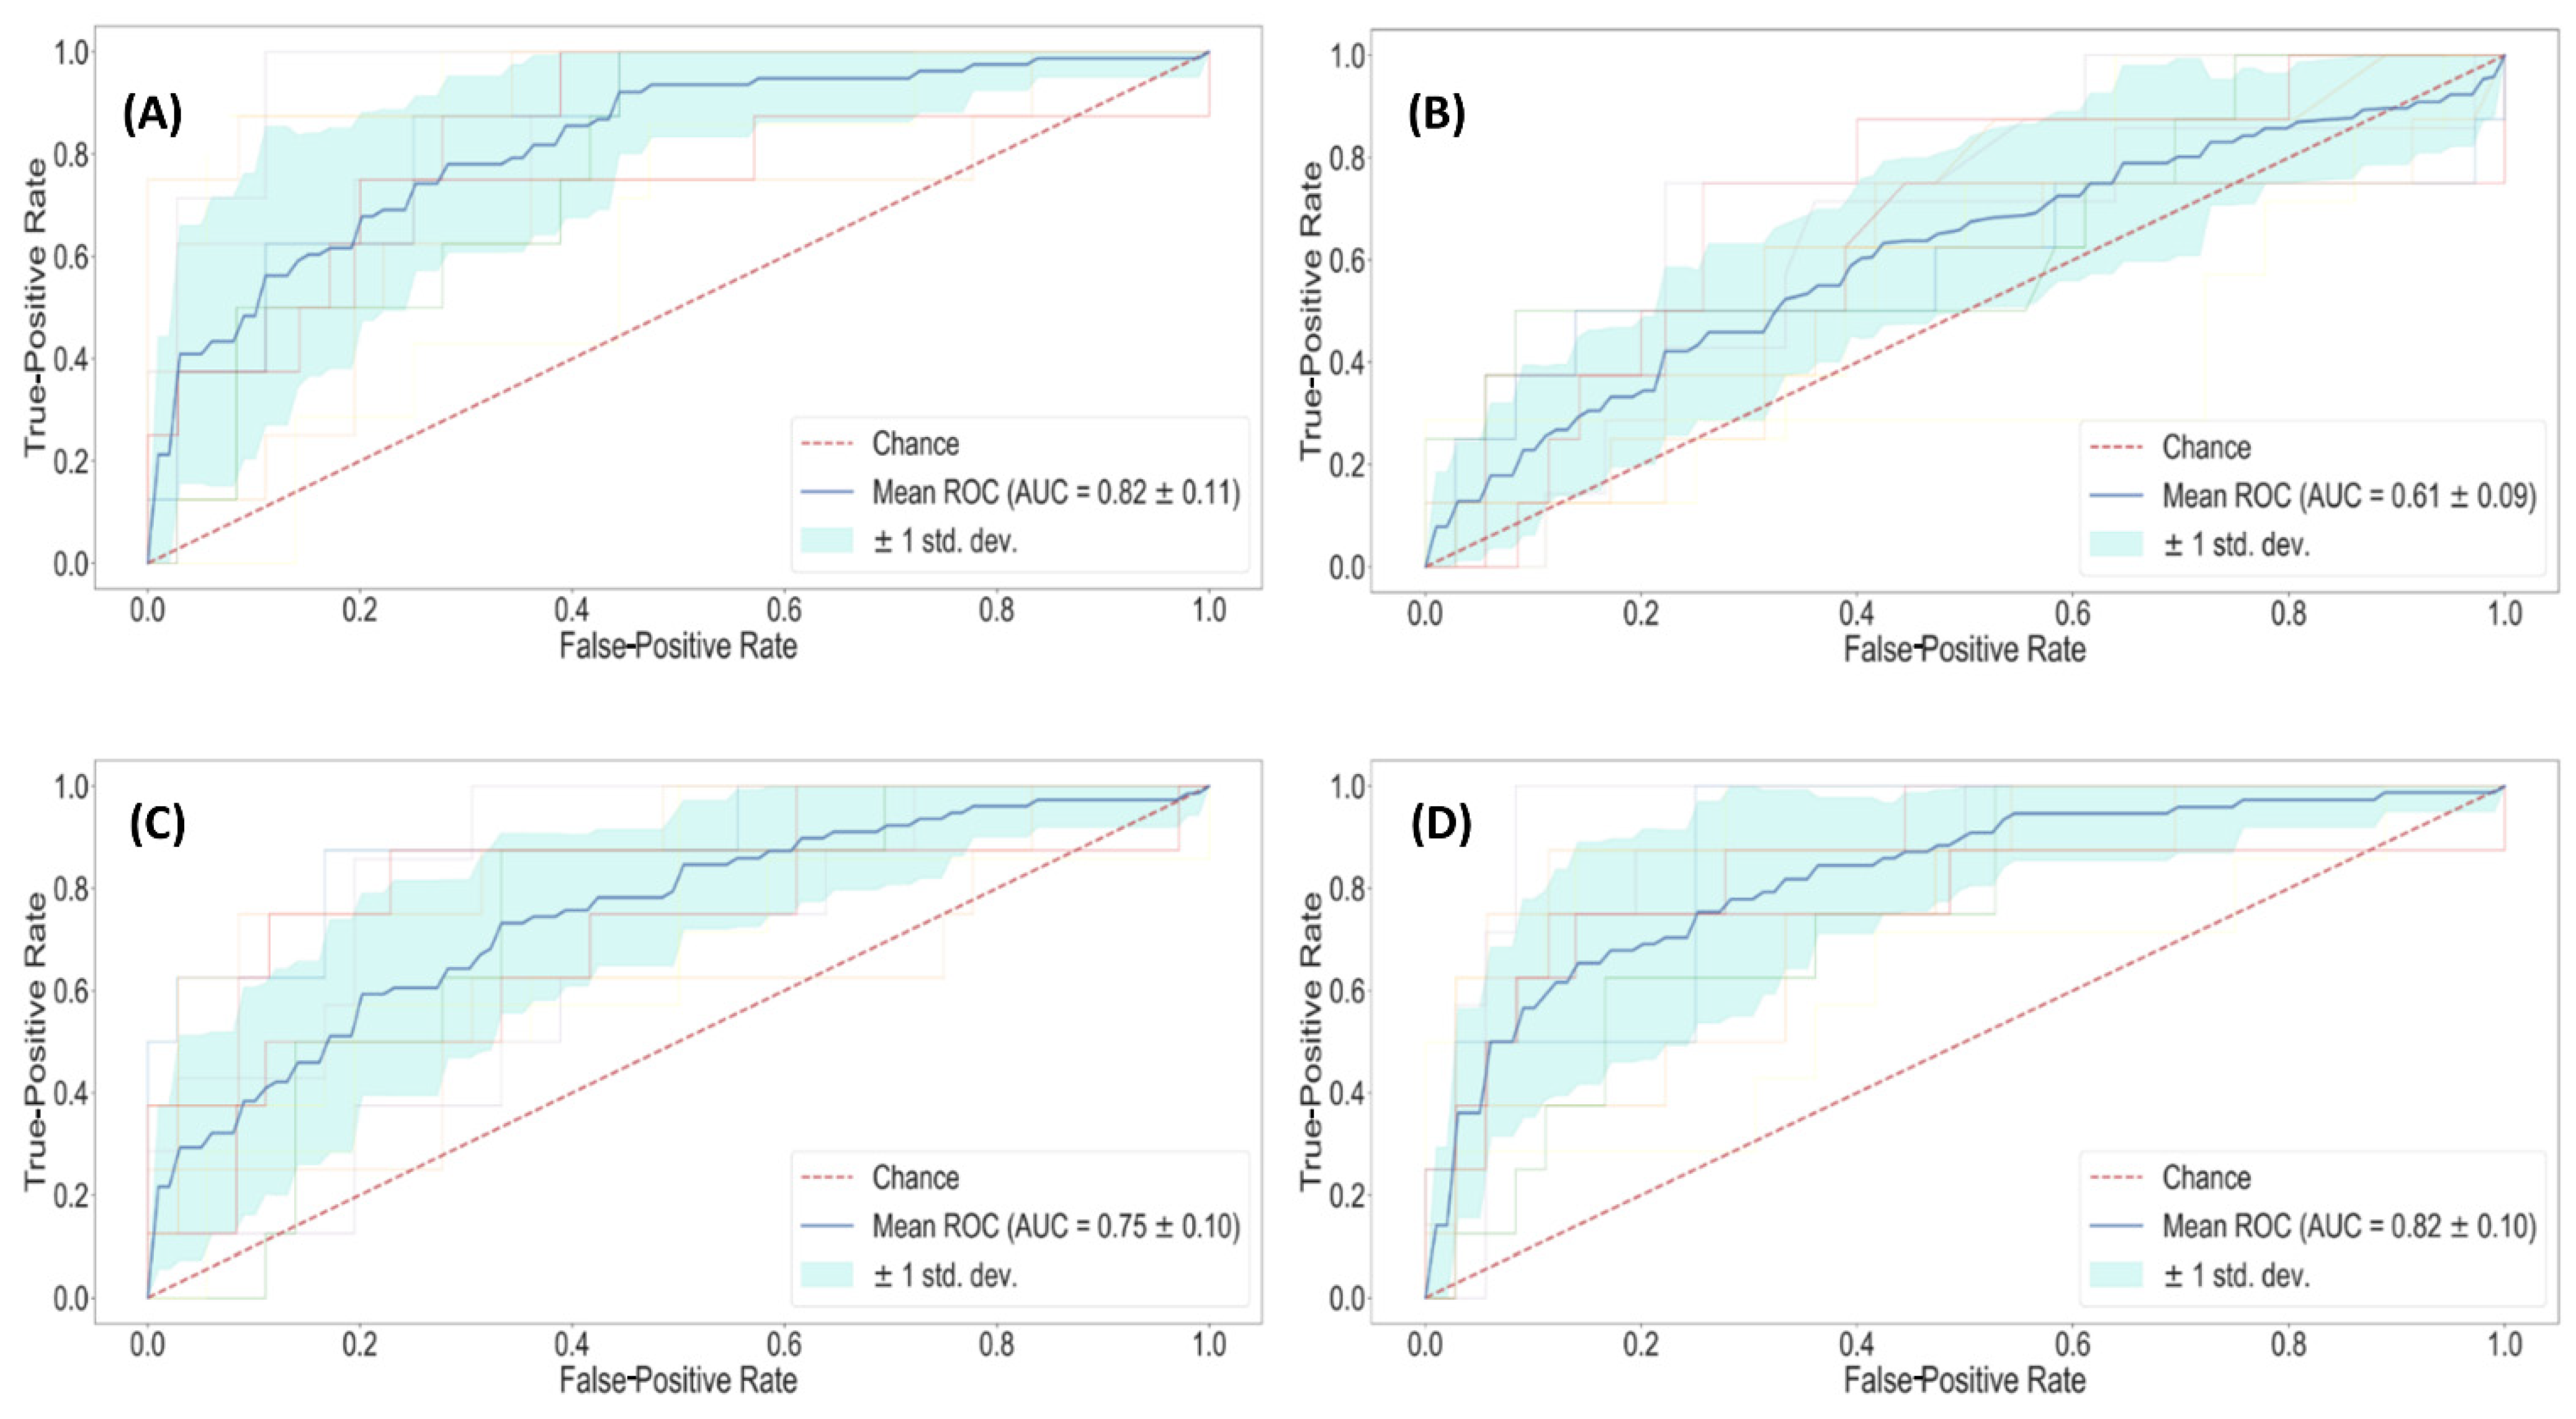
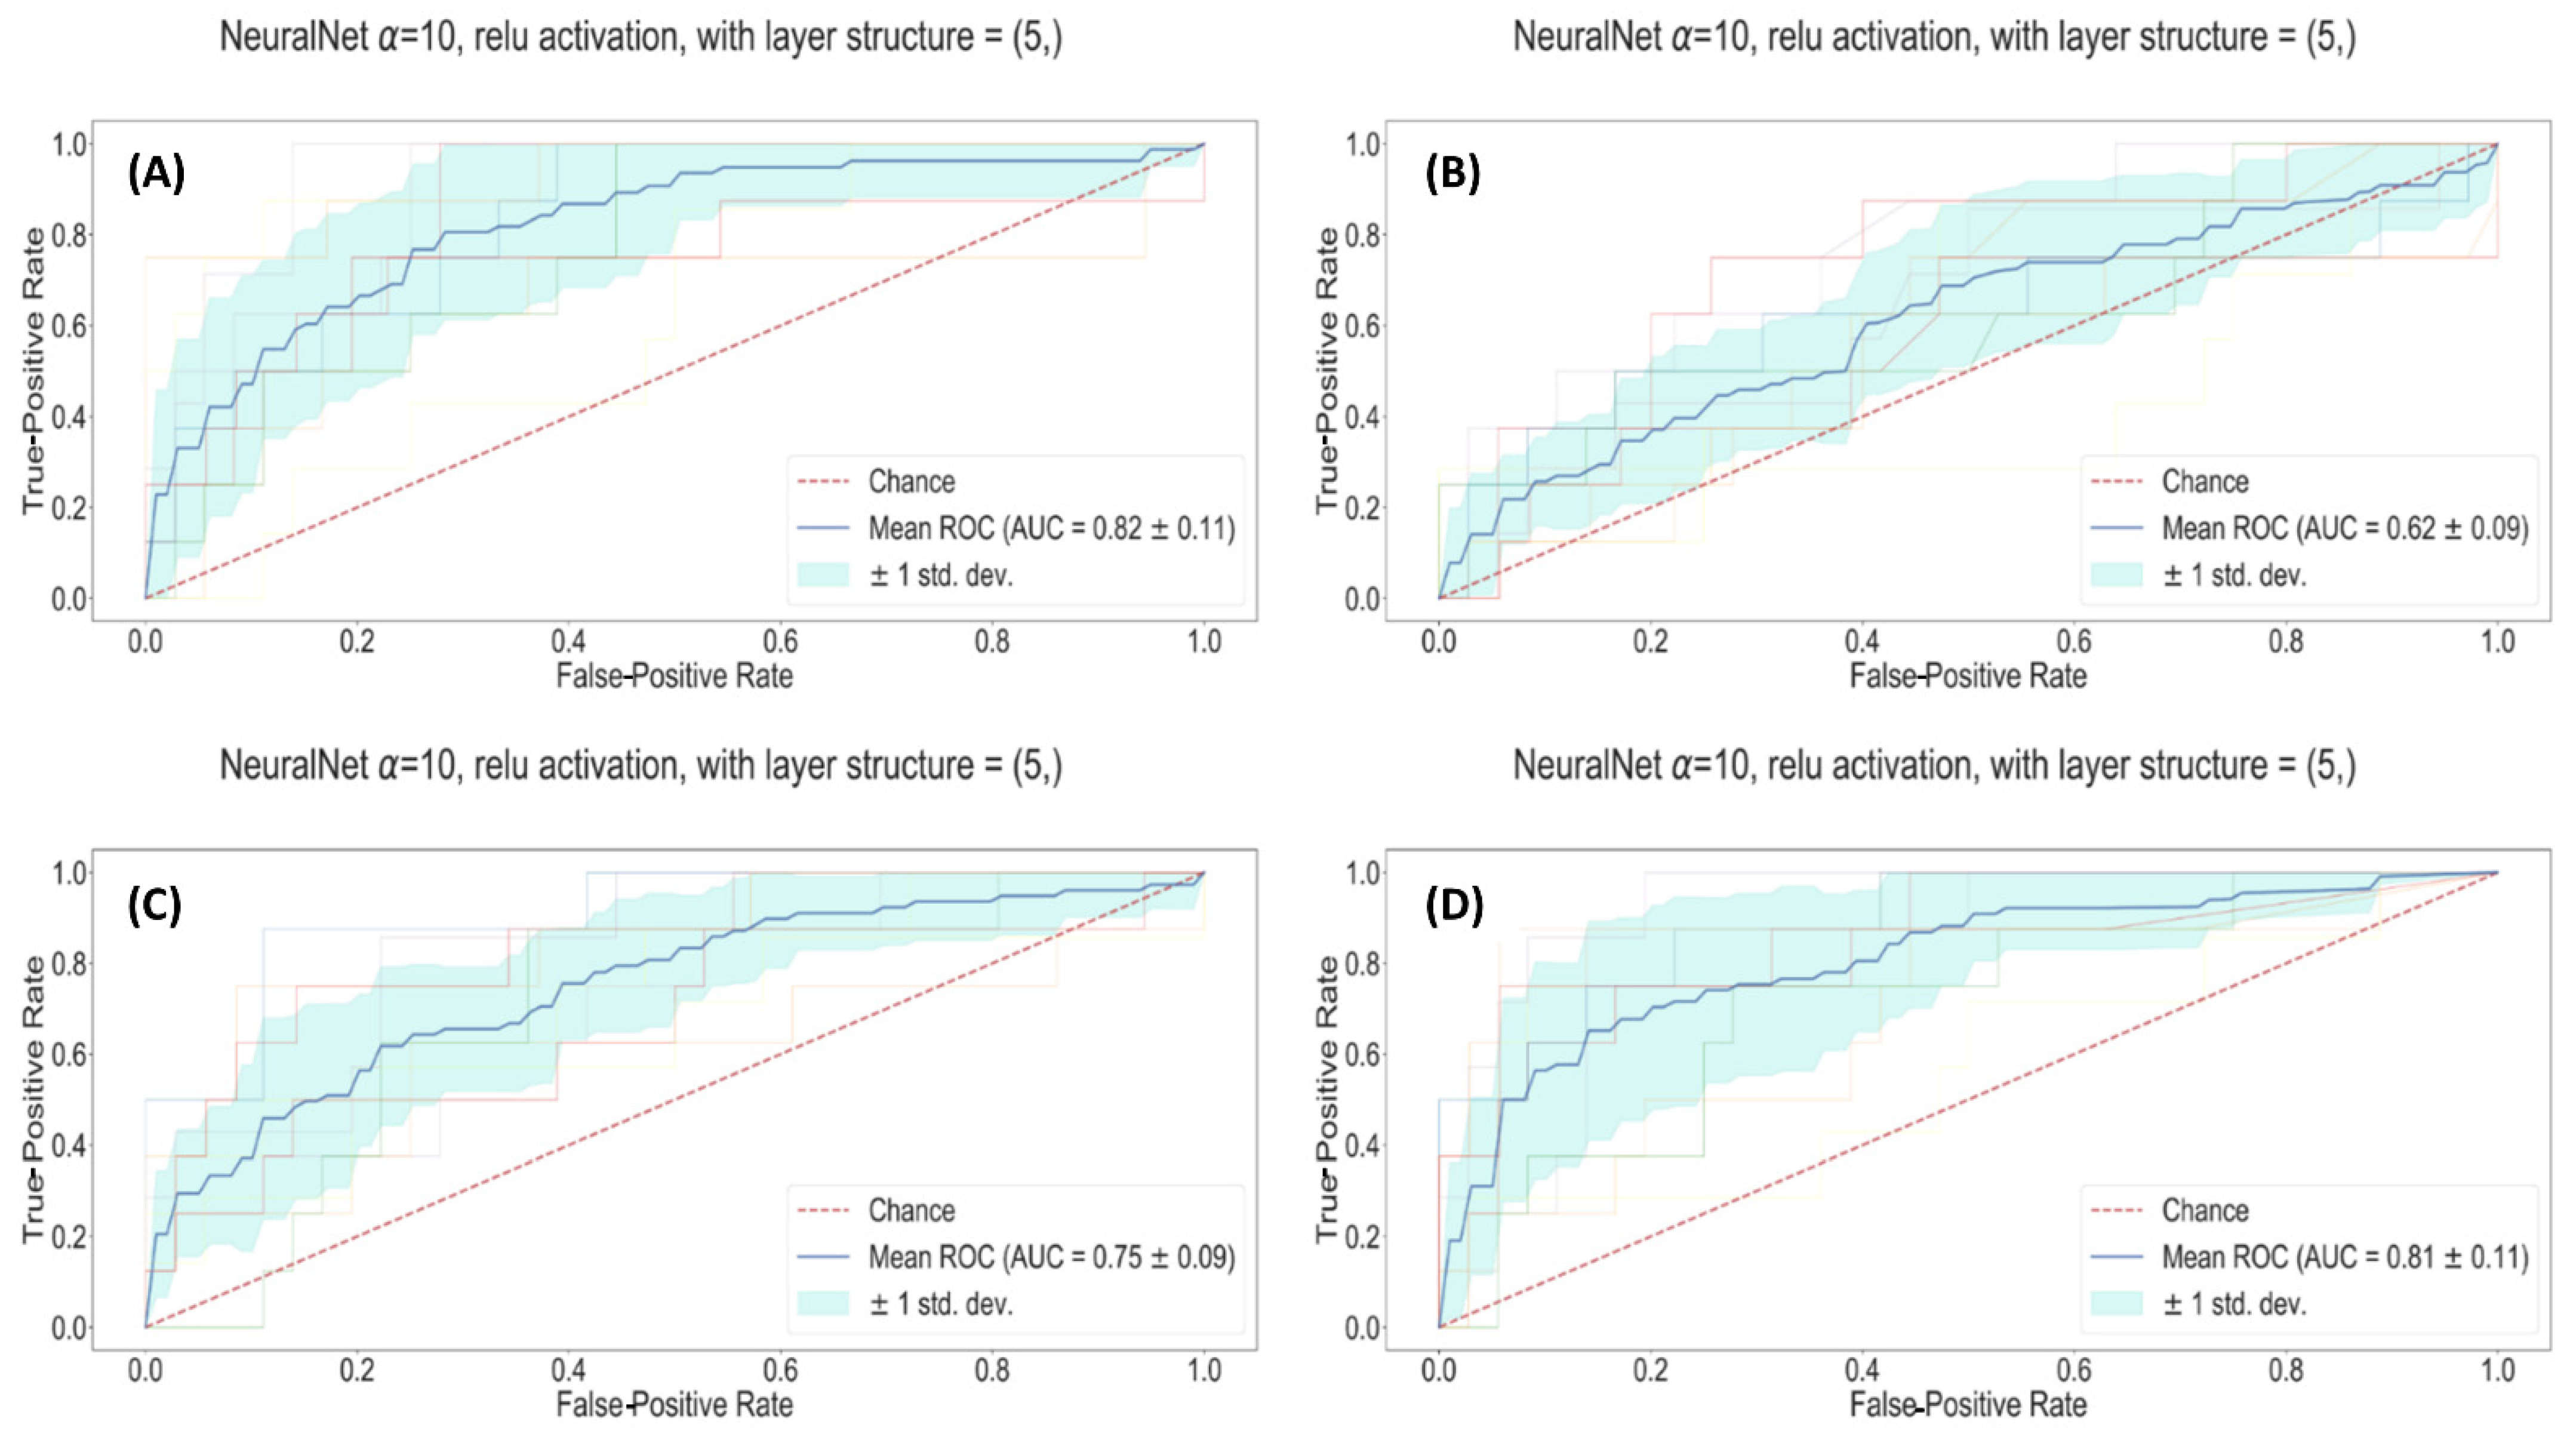
The plots in
Figure 2,
Figure 3 and
Figure S1 are ROC curves relative to the LASSO, FcNN, and RFC methods, respectively. In all cases, the fainter lines represent the 10 curves relative to the 10 testing phases. The bold blue line is the average performance, the turquoise bands represent the standard deviation around the mean, and the red line is the performance of a random guesser blindly predicting mortality. The performances of all the developed models are reported in
Table 2. To investigate the capabilities of the LASSO model based on all the available features to describe our cohort irrespective of admission rate, the present cohort was divided into two groups according to hospitalization date (before or after 20 July 2020). The AUCs were determined, resulting in 0.73 and 0.76, which were found not to be statistically significantly different in demonstrating the capability of the model to describe the present dataset, irrespective of the wave of belonging. Similar results have been reported in [
26] using a semi-quantitative score based on a database including only radiological information.
DeLong’s tests were used to compare the ROCs. Without considering the radiological models, only the Lasso clinical and the Lasso radiomic models were statistically different, with a p-value of 0.044.
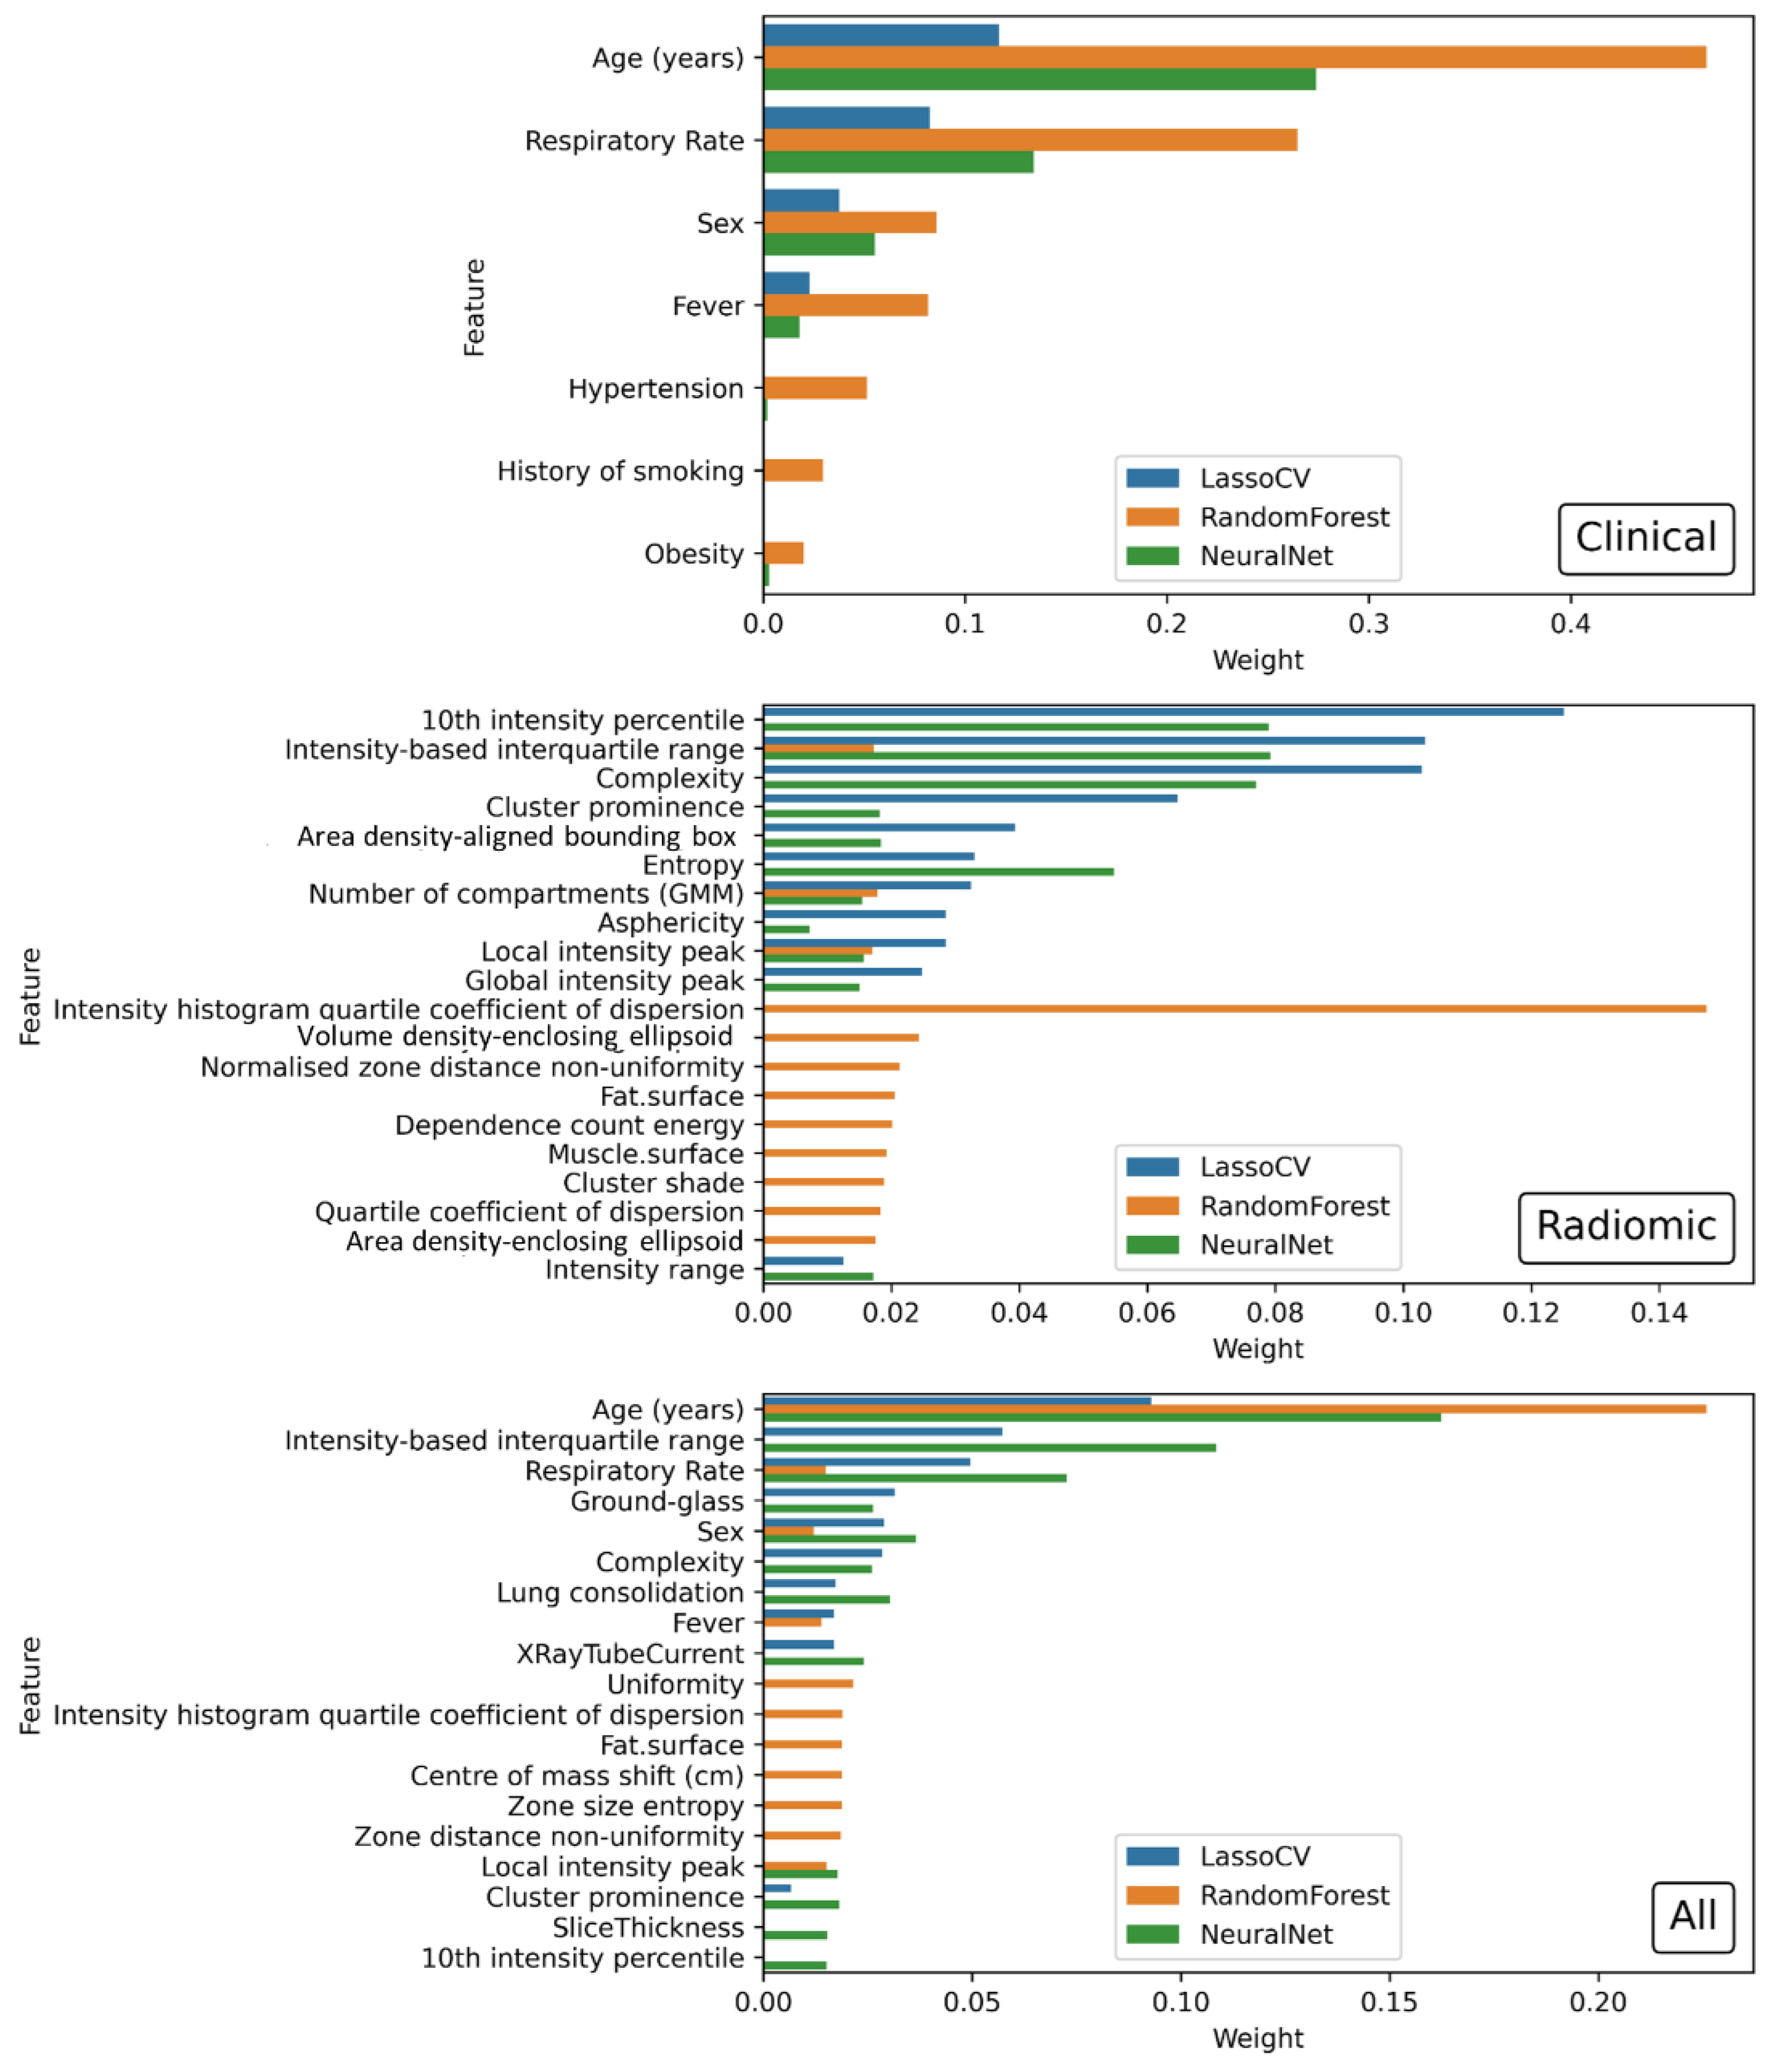
The relevant features in the Lasso models are reported in
Table 3; a graphical representation of the importance of the features in each model is reported in
Figure 4.
For the Lasso regularized regression, the importance is expressed by the coefficient of the feature in the linear combination. For the RFC, the importance is the Gini importance built into the implementation of the sklearn function, and for the FcNN, the importance is obtained using a Permutation Importance approach implemented in the ELI5 library (25). It should be noted that the performances, as well as the values of the importance produced by the models, are directly affected by the kind of regularization, or lack thereof, employed in the training. This can also be seen in the performance evaluation of the train dataset, which is obtained as the average over the different folds used for the cross-validation. Regularized models (i.e., LASSO and FcNN) tend to perform better while non-regularized models (i.e., RF) have slightly worse performances. It is also worth mentioning that the lack of balance in the training labels particularly affects the performance of the RFs, despite the attempts made to reduce these effects.
To clarify the impact of regularization on performance of the RF approach, a dataset of reduced dimensionality obtained using the LASSO approach was implemented. However, the resulting performance in terms of AUC of this second attempt (data not shown) remained very similar to the authors’ previous attempt. Thus, the sub-optimal result was likely due to the application of this classifier on a strongly imbalanced dataset [
27]. In addition, the RF hyper-parameters were chosen using a parametric scan to explore the main possible combination of values, including number of estimators, max depth, max number of features, and oob score. None of these parameter combinations produced any relevant improvement in the RF models when applied to the dataset being tested.
Figure S2 shows an example of how age and SARS-CoV-2 disease affect CT image appearance and grey level inhomogeneities, consequently impacting the values of the radiomic features. One such example is entropy, which did not remain in the final model, being related to patient age. In particular, the entropy values obtained from the images were 8.29, 9.96, 8.22, and 9.97 for the patients illustrated in panels A, B, C, and D, respectively. A and C were both under 70 years of age while B and D were both older. A and B were successfully discharged from the hospital while C and D died from SARS-CoV-2 disease.
These findings suggested investigating the impact of ageing on several relevant radiomic features, as shown in
Supplementary Materials Figure S3 (entropy/complexity).
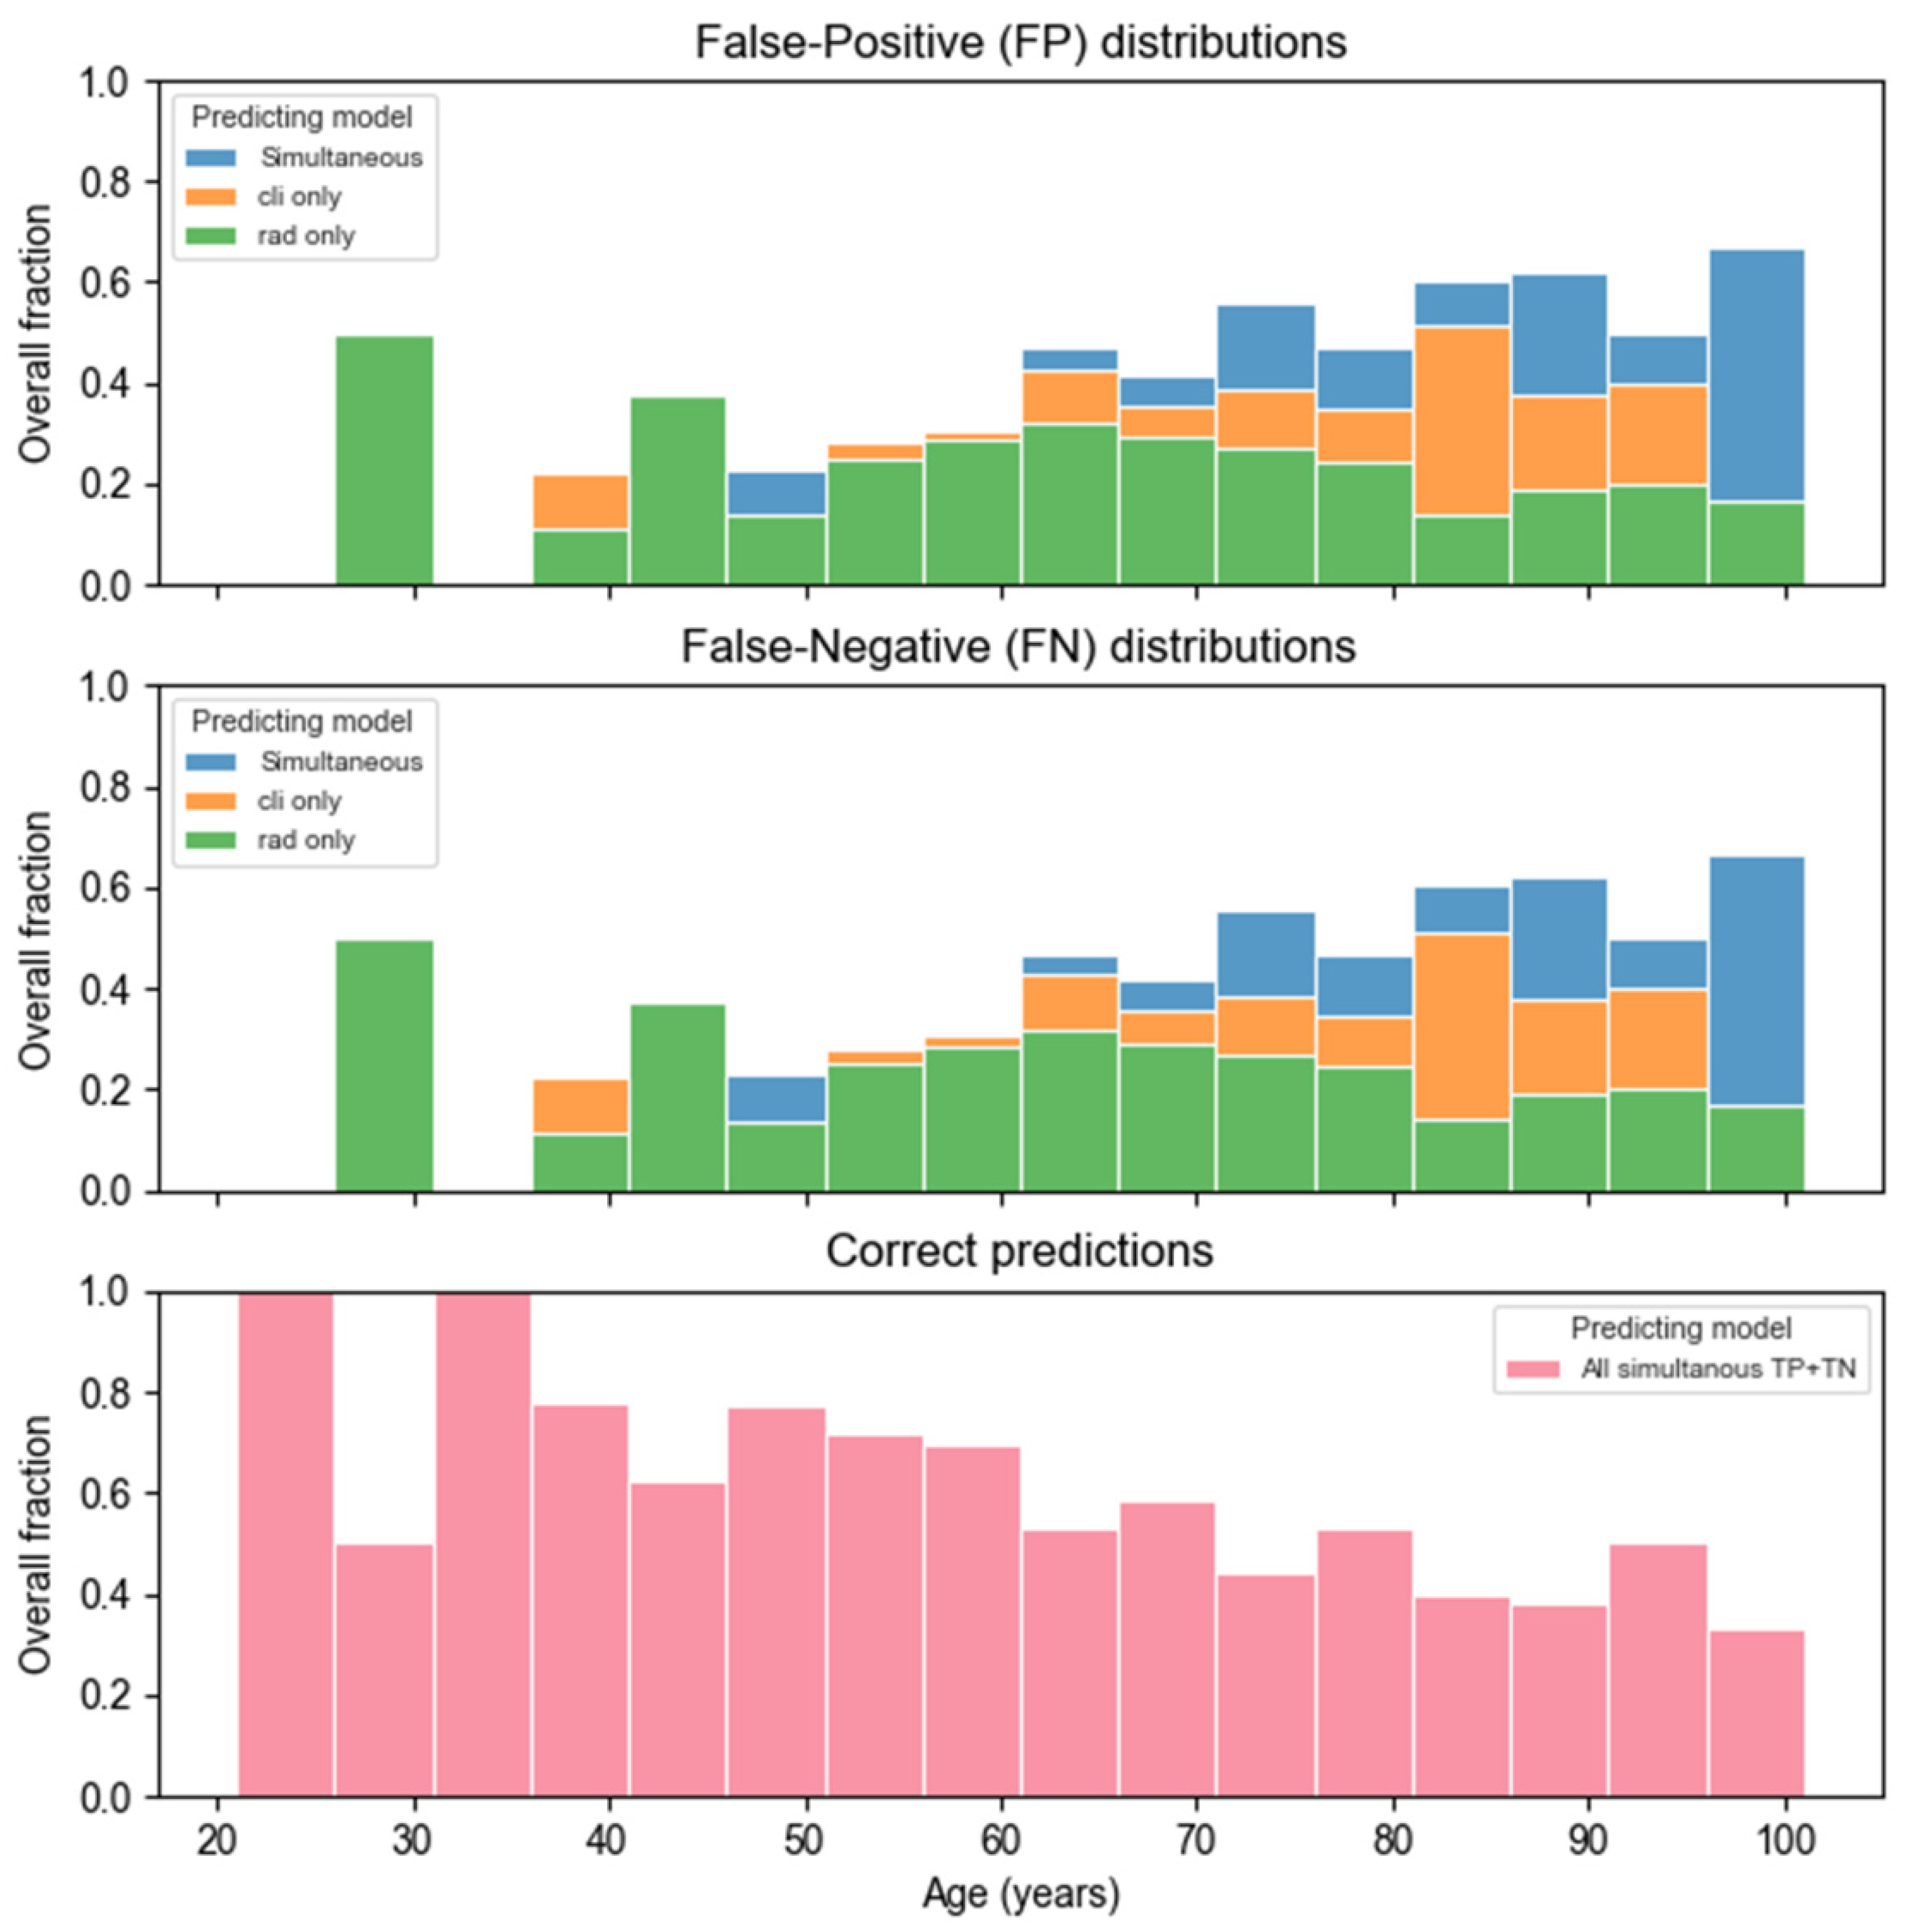
Figure 5 shows the misclassification distribution with respect to patient age (which was, in all cases, the most relevant feature included in the Lasso model). Moreover, from
Figure 5, it can be noted that the radiomic and clinical models seem to have different weaknesses while having a slight overlap in patient misclassification.
This peculiar behavior suggested that, in the clinical model, the risk for older patients was overestimated (more False Positives) and was somewhat underestimated (more False Negatives) in the younger population, while the opposite was true for the radiomic model. Similar behavior was found for the FcNN classifier, as reported in
Supplementary Materials Figure S4.
4. Discussion
The radiological findings extracted from the clinical database and assessed by expert radiologists have, in no instance, proven to be informative regarding the outcome investigated. Correspondingly, in all cases, the radiological model was statistically different from all others as well as the worst performing.
At no point in the analysis did the history as a smoker seem to be relevant within the models in this study, despite what was shown by [
8]. This could be due to the present dataset having a high percentage of patients with a smoking history. Although this variable could be indirectly associated with hypertension, respiratory rate, or other clinical variables (i.e., age and sex) in the present dataset, history as a smoker was found not to be correlated above the correlation threshold set at 0.6 before the preprocessing phases.
The set of clinical variables in the present study contained fewer features which attempted to predict prognosis than the majority of those used in the available literature [
8,
28]. Of note, the clinical model used in the present study had a performance (AUC = 0.82) comparable to that obtained by [
28] and slightly worse than that of Shiri et al. [
8].
In concordance with what was found in [
29], the present model outperformed the radiological assessment obtained by the expert radiologists who took part in the study cited.
As one would have expected from the World Health Organization (WHO) guidelines [
30], when included in the present dataset, age was the most relevant variable in the model, followed by respiratory rate and sex.
In this study, three different ML models were investigated in terms of ability to predict the relevant clinical outcome, i.e., death. The combination of the segmentation method with predictive models was chosen with the intent of identifying the most important predictive features while keeping the interpretation of the results as simple as possible and facilitating their application in clinical practice. The authors recognized that Convolutional Neural Networks could be applied to image analysis and segmentation [
31]. However, these approaches require large computational power as well as large training datasets and can be of difficult interpretability, often resulting as black boxes [
32].
Looking at
Figure 4, it can be noted that the features contributing the most to the compared models are the same irrespective of the algorithm adopted which included age (years), respiratory rate, ground glass (GGO), and intensity-based interquartile range.
It should also be noted that the relative importance (weight) of the features in each model was similar in the two models (i.e., Lasso and FcNN) which better described the present cohort. Their performance, as well as the magnitude of the importance estimated, can be attributed to the regularized nature of the methods utilized.
Furthermore, these findings supported the presence of an association between patient outcome, clinical parameters (e.g., age and respiratory rate), and radiological (e.g., GGO) and hidden image properties not noticeable by the human eye but requiring ad hoc computation (e.g., intensity-based interquartile range). All of the above features enabled taking into consideration the deterioration of lung tissues related to SARS-CoV-2 disease as well as the ageing process.
The most relevant radiomic variables in the model used in the present study were related to the Gray-Level distribution and disorder/inhomogeneity in the image (i.e., entropy, complexity, 10th intensity percentile). Some of these features were found in models developed by [
28] and were also informative in a univariate analysis carried out by [
33].
As expected, looking at the same univariate analysis as in the study of [
33], the performance of a more complex model is consistently better than that of a single radiomic variable.
The dimensionality (2D vs. 3D) of the images probably affected performance; in fact, the present models consistently outperformed those obtained using radiographic chest images as in the studies of [
6,
28,
33].
The authors hypothesized that ageing of pulmonary tissue may affect several of the relevant radiomic features left after the LASSO feature reduction, as shown in
Supplementary Materials Figure S3. Unfortunately, the current dataset used in the study did not allow discriminating the impact of lung tissue ageing, even when using the Neural Network approach.
Figure S2 highlights how disorder and inhomogeneity in the grey levels are related to damage in the lungs as well as to the age of the patient. To the best of the authors’ knowledge, this has not previously been highlighted.
As a final consideration, it is important to note that the semi-automatic segmentation tool significantly reduced human costs in terms of manpower and time with respect to a manual approach. Moreover, the segmentation of a single patient may require from 10to 60 min when performed manually against the 2–6 min necessary with an automatic tool, depending on computer and software specifics. It is noteworthy that manual segmentation, which is feasible only with small patient cohorts, may achieve a slightly better predictive performance [
6,
8]. On the other hand, the time utilized by trained radiologists to manually segment all the chest CT images may be unavailable in a busy department, especially during pandemic events.
Some of the limitations of the present study include the imbalanced nature of the majority of the clinical variables available as well as the reduced number of clinical features available.
However, this may also represent one of the strong points of the study, since it showed that, even with a basic amount of information, it was still possible to obtain acceptable results.
Another similar point is that of the length of time from the date of the CT scan to the outcome. It is a clear limitation since only the first CT was considered, hence concealing all the disease progression after the first scan. However, it showed that it was possible to have a quick and reliable evaluation of patients at admission, allowing better allocation of hospital resources.
Some future prospects in this regard may include an additional analysis of the dataset in a delta-radiomics setting in which disease progression is also included in the patient evaluation by looking at the changes in radiomic features in successive CT scans.
Another interesting prospect would be to additionally investigate the relationship between patient characteristics, such as age, and radiomic variables extracted from various organs.


 ,
, 


