Article

Mental Health and Safety Assessment Methods of Bus Drivers

1
School of Transportation, Jilin University, Changchun 130022, China
2
China Academy of Transportation Sciences, Beijing 100029, China
*
Author to whom correspondence should be addressed.
Appl. Sci. 2023, 13(1), 100; https://doi.org/10.3390/app13010100
Submission received: 18 November 2022 / Revised: 12 December 2022 / Accepted: 16 December 2022 / Published: 21 December 2022
(This article belongs to the Special Issue Ergonomics and Human Factors in Transportation Systems)

Abstract

:
To explore the influence of the health psychology characteristics of bus driver on the probability of traffic accidents, such as the severity of unhealthy psychology and negative and impulsive personality. Combined with the demographic questionnaire, SCL-90 scale, and Y-G scale, the psychological factors of drivers causing traffic accidents were evaluated. The key factors selected by binary logistic regression analysis are used as node variables, and the Bayesian network structure was established by combining the K2 algorithm and expert knowledge. The EM algorithm was used for parameter learning. The work identified seven key factors that made bus drivers prone to accidents. The most likely factors were moderate depression, mild anxiety, and mild somatization. Bus drivers in the accident group were significantly more anxious, depressed, and more hypersensitive and emotionally unstable than drivers in the non-accident group. The psychological scale and a Bayesian network model were used to evaluate the mental health and traffic safety of bus drivers. It shows that different degrees of depression, anxiety, and different degrees of subjective and cyclical personality of bus drivers had different effects on traffic safety.

1. Introduction

In China, road traffic accidents are a serious social problem, and personal factors, vehicles, road conditions, and environmental conditions may lead to traffic accidents. Previous research results confirm that about 86% of traffic accidents in China are caused by human factors [1]. As of 2021, there are 589,961 public-transport vehicles in operation in China [2], with a large number of bus drivers. As special practitioners integrating the characteristics of technical post and service post, bus drivers require proficient driving skills, good personalities, and healthy psychological levels to ensure the safety of people’s lives and properties. However, in recent years, major traffic accidents of commercial vehicles have occurred frequently in China due to the poor mental state and personality characteristics of drivers. Therefore, the mental health and safety of drivers have become hot, difficult issues in road traffic safety.
Human mental health includes two closely related and distinguishable parts: mental state and mental adjustment ability, and the premise of mental health is the harmony and unity of personality characteristics. The SCL-90 scale is an internationally recognized psychological measurement scale with high reliability and validity for distinguishing healthy people from patients with physical and mental illnesses. It contains a wide range of psychological symptoms and can accurately describe the psychological symptoms of subjects in different degrees [3]. Recently, this scale has been used in mental health at home and abroad to investigate the mental health of different occupational groups, especially in assessing the mental health of drivers, and the effect is ideal [4]. However, the SCL-90 scale mainly measures a person’s mental state in a certain period, ignoring its ability to regulate.
At the same time, personality tests widely popular in the world are compiled according to trait theory. The Y-G personality scale breaks through their respective limitations because it takes into account the advantages of type theory and trait theory. The reliability and validity of the scale are relatively high, and the number of questions is relatively moderate. Therefore, it has been widely used in evaluating human personality. However, the Y-G personality scale mainly reflects a person’s stable psychological adjustment ability, and relatively ignores the psychological state. Therefore, the Y-G personality scale and SCL-90 scale were combined to evaluate the personality and psychology of bus drivers in the work. Besides reflecting the degree of symptom pain in a certain aspect of drivers and the breadth of the personality characteristics of the assessed object, it can screen the factors affecting the drivers’ psychology.
On the other hand, most use statistical methods and logistic regression models in analyzing traffic accidents based on the psychological factors of drivers [5,6,7]. Although revealing some drivers’ psychological influencing factors in traffic accidents, these methods ignore the relationship between accidents and influencing factors and the degree of influence of each factor on the occurrence of accidents. Moreover, they cannot reflect the complicated logical relationship among traffic accident causes, the occurrence of traffic accidents, and consequences of traffic accidents, in lack of analyzing the impact and sensitivity of traffic accidents from different demographic characteristics, psychology, and personalities.
Therefore, the work applied the Bayesian network model to the analysis of drivers’ mental health and established a Bayesian network model for evaluating bus drivers’ mental health and traffic safety. The model visually displayed the correlation between various influencing factors in a complex system, and the model’s accident prediction results were accurate. Key factors of a traffic accident were quickly identified to find the most likely combination of factors. It made up for the shortcomings of previous studies only considering single factors instead of combined factors. Further, the drivers’ psychology and personalities were divided into different levels according to the factor scores of the scale. The Bayesian network model was used to study the influence of different levels of psychology and personalities on the probability of accidents of bus drivers, expecting to make up for the lack of related research.
The drivers’ mental health and safety are analyzed from their personalities and psychological symptoms. The research results help companies better distinguish the extreme personality and unhealthy mental state of drivers. Effective intervention measures can be taken to resolve the psychological pressure and negative emotions of bus drivers, thus improving the drivers’ mental health. In addition, companies can select mentally healthy bus drivers to improve the safety of public transportation.

2. Current Status at Home and Abroad
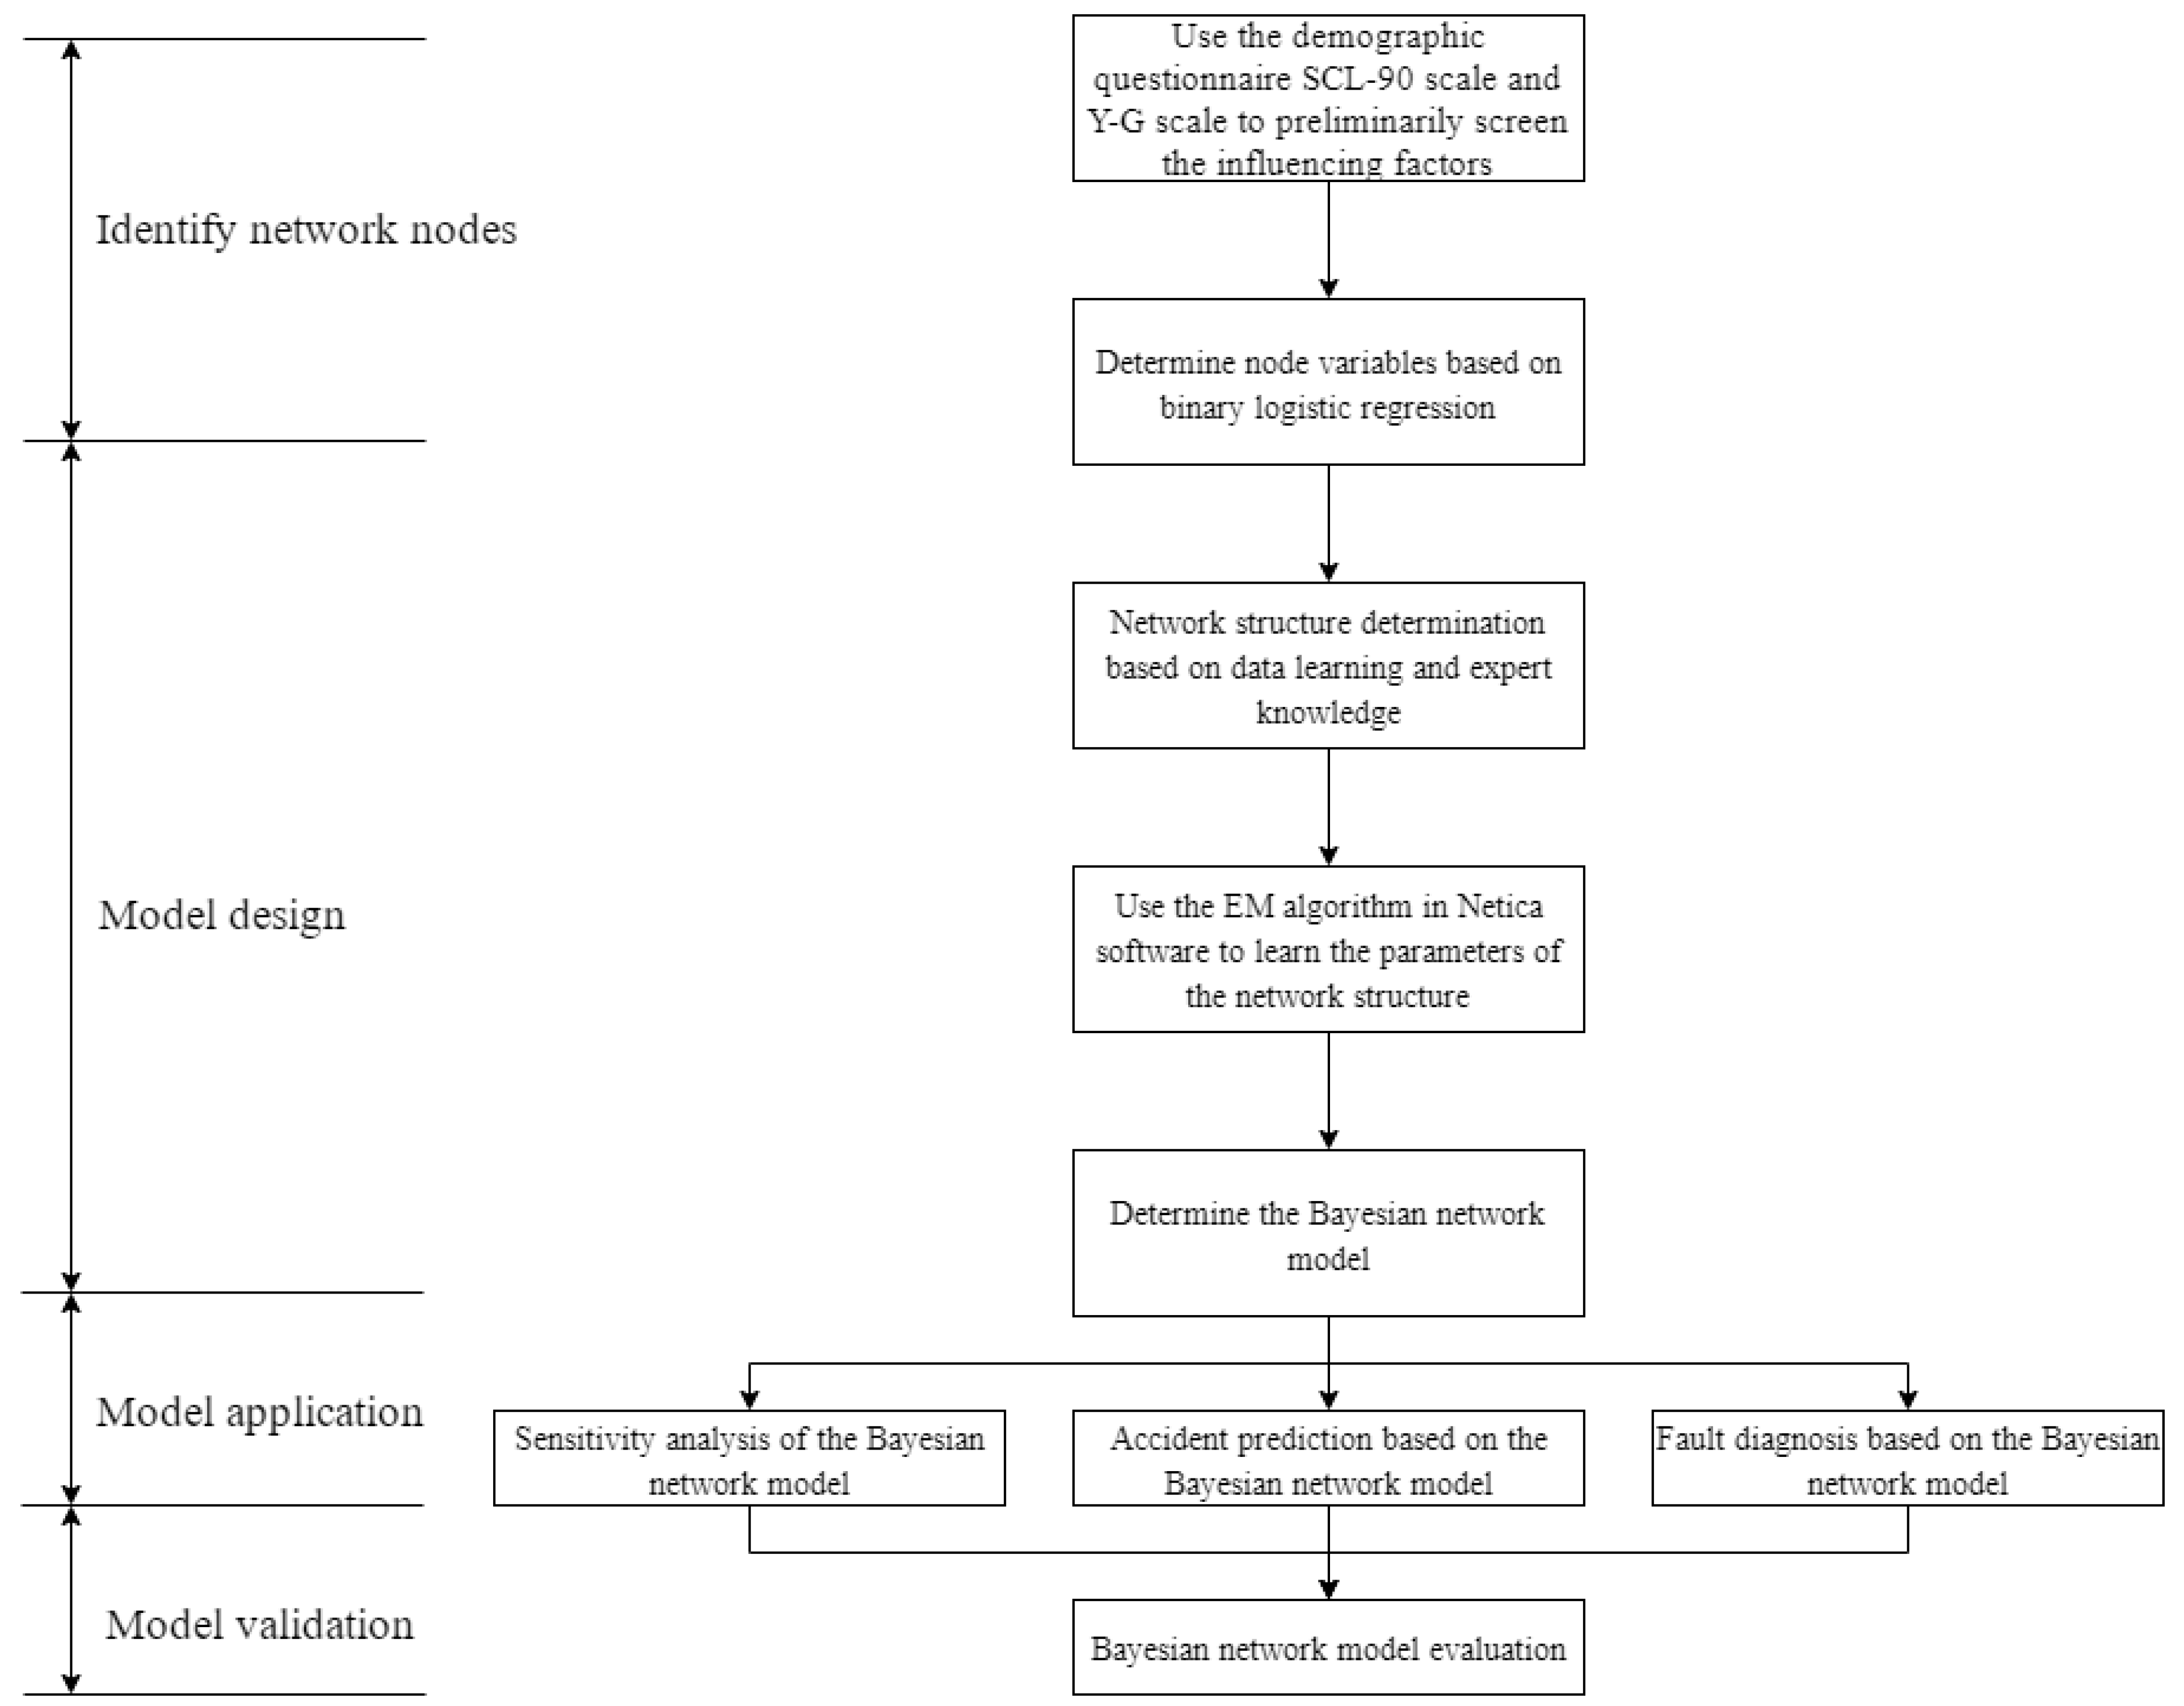
Bus drivers are an occupational group that engage in high-risk operations for a long time. The work is relatively monotonous and lonely due to the fixed daily operation route, lacking a social mode. They are under pressure from companies, passengers, and families, which affects their physical and mental health and driving behaviors. It is directly related to the safety of public transport operations.
Previous studies have found that people’s mental health closely involves stress [8]. Some of the stress sources of bus drivers are different from other drivers, especially for time pressure, shift work, lack of social support, and passengers’ harassment and violence. All these stresses can exacerbate unhealthy psychological conditions of bus drivers, such as anxiety, depression, anger, depression, and fatigue.
In terms of time pressure, Wu et al. found that bus drivers are under pressure from traffic jams, inflexible running schedules, and shift patterns [9]. Moreover, these pressures increase their anxiety and fatigue, which in turn causes drivers to drive dangerously. In terms of work stress, Luis Montoro et al. found that work stress is positively correlated with driving anger [10]. Work stress and driving intensity can increase the risk of dangerous driving for motor vehicle drivers. Silva et al. thought that the drivers are forced to sit for a long time in a narrow working space due to professional characteristics, resulting in fewer opportunities for physical activities. It is easy for drivers to suffer from headaches, backaches, and musculoskeletal diseases, and overwork increases the risk of cardiovascular disease in professional drivers [11]. Regarding the pressure of service targets, Tu et al. found that the quality of passengers varies. The requirements for service quality are getting higher and higher, which can easily lead to disputes [12]. In the driving process, bus drivers will encounter drunk or low-quality passengers. These passengers will provoke, harass, or even beat bus drivers, which significantly affects the physical and mental health of bus drivers.
A large number of studies have shown that sensitivity, anxiety, hostility, depression, and other unhealthy mental states in drivers’ interpersonal relationships as well as extroversion, neuroticism, aggressiveness, and other personalities can cause bad driving behaviors and increase the probabilities of accidents. In terms of unhealthy psychology such as depression and anxiety, Chalmers et al. found that drivers with depression and anxiety, hostility, and sensitivity to interpersonal relationships are more likely to have unhealthy driving behaviors such as getting too close to vehicles and speeding, which increases the drivers’ risk of traffic accidents [13,14,15]. Huang et al. found that drivers’ social anxiety interacts and can affect their abnormal driving behaviors [16]. In terms of aggressive personality, Kovaceva et al. found that drivers with an aggressive personality are more likely to have common illegal behaviors such as speeding and running red lights, which in turn increases the risk of accidents and the frequency of tickets [17,18,19,20]. In terms of extroversion and neurotic personality, Wang et al. proposed that extroversion and neuroticism are important factors affecting traffic violations. Extroversion and neuroticism are prone to unhealthy psychology such as irritability and anxiety and further lead to distracted driving, thereby increasing the risk of traffic accidents [21,22].
A Bayesian network, an ideal and effective method to deal with uncertainty problems, can clearly express the correlation between multiple factors and analyze qualitative factors quantitatively [23,24]. It has been widely used in pattern recognition, data mining, fault diagnosis, intelligent decision-making, and other fields. Netica is a Bayesian network learning software developed by Norsys Software Company in Canada [25]. Its advantages are as follows: having an intuitive graphical modeling interface and intuitive display of probability parameters, operating multiple node variables simultaneously, and updating the network accordingly. It is expert at prediction, diagnosis, decision analysis, probability modeling, reliability analysis, and statistical analysis.

3. Research Methods

We targeted the main factors affecting the demographic characteristics, psychology, and personality of bus drivers prone to traffic accidents. At the same time, the probability of the impact of different degrees of negative impulsive personality and unhealthy psychology on traffic accidents was considered, and the work combined the SCL-90 scale with the Y-G personality scale. Drivers’ mental health and safety were analyzed from their personality characteristics and psychological symptoms to build a Bayesian network model for evaluating their mental health and traffic safety. In addition, we completed the inference analysis of the model with the help of Netica software. The specific ideas of the work are as follows:
(1)
Randomly select a certain sample of bus drivers.
(2)
Use the demographic questionnaire, SCL-90 scale, and Y-G personality scale to measure the sample drivers. Obtain basic data and perform data processing to initially analyze the factors that may affect traffic accidents.
(3)
Use binary logistic regression to analyze the risk factors of bus drivers’ accidents and use the risk factors as the node variables of the Bayesian network analysis model of traffic accidents.
(4)
Use k-means cluster analysis to discretize data and assign values to node variables. Combine expert knowledge and experience with the k2 algorithm to construct the Bayesian network structure.
(5)
Use the EM algorithm to learn the parameters of the Bayesian network structure.
(6)
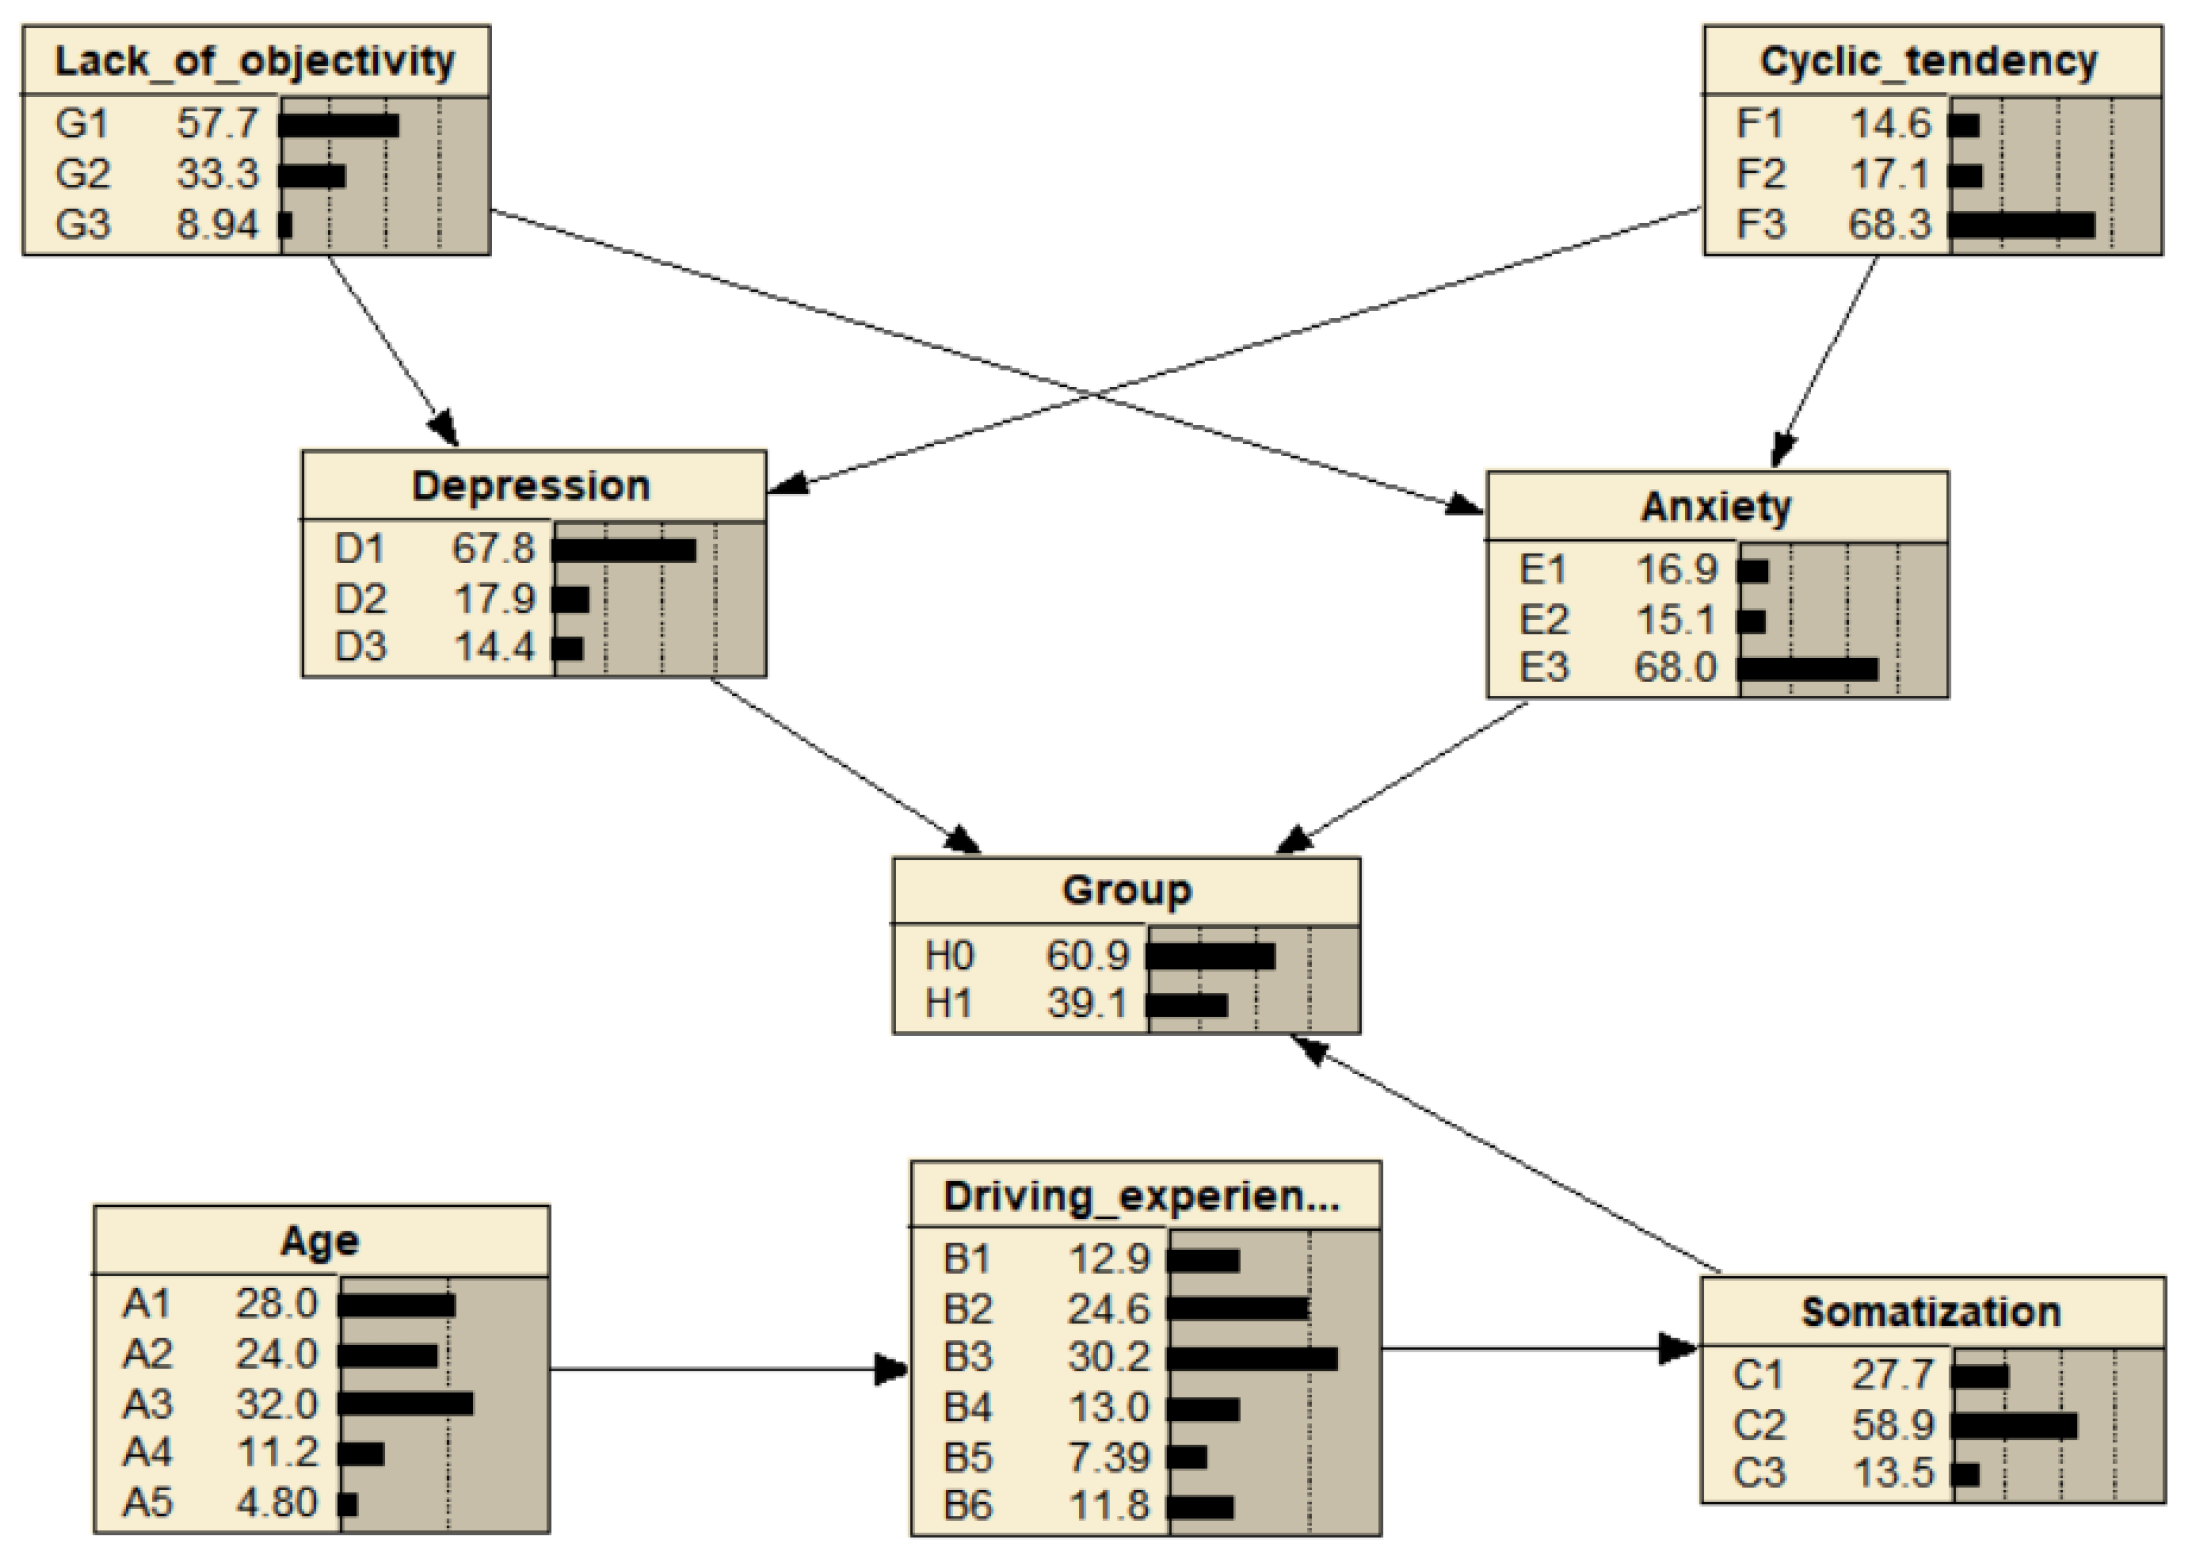
Establish a Bayesian network model for evaluating bus drivers’ mental health and traffic safety, and then use Netica software to perform inference analysis on the model.
(7)
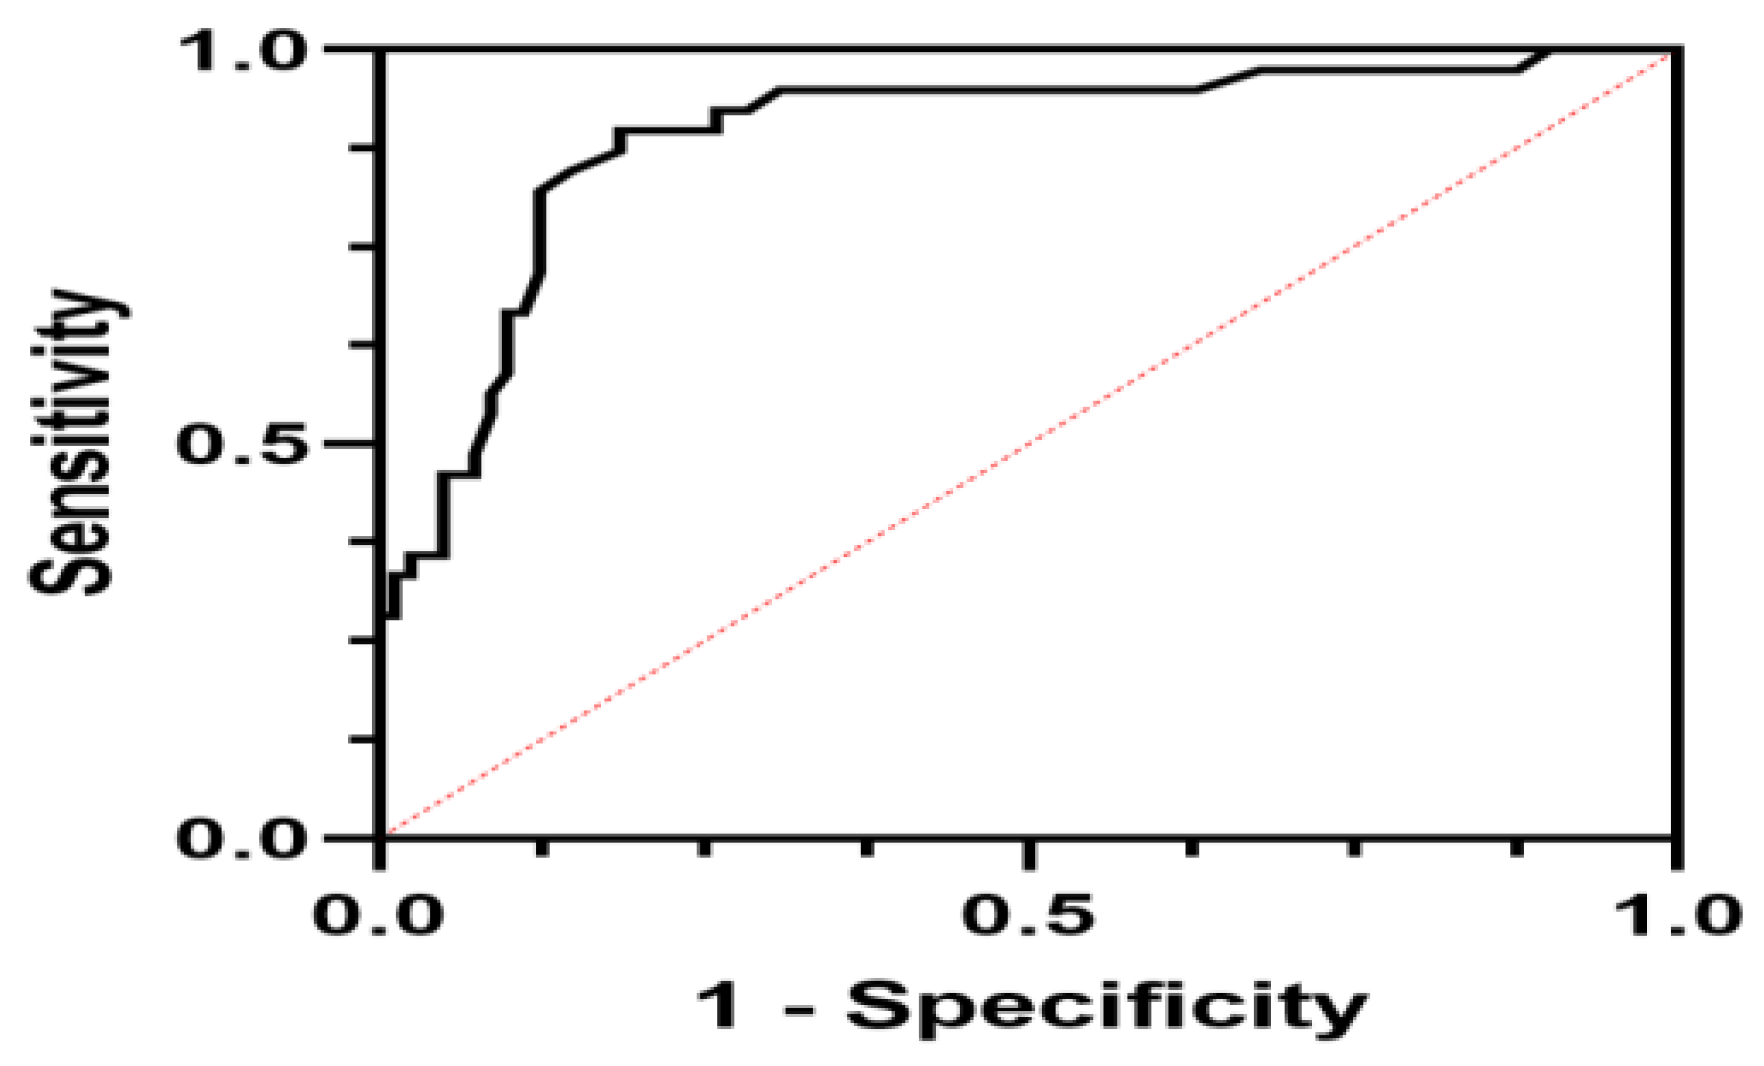
Use the ROC curve to evaluate the effectiveness of the model.
Specific research ideas and process are shown in Figure 1.

4. Identification of Risk Factors for Bus Drivers Prone to Accidents

4.1. Data Source

The survey was conducted from 21 April to 11 May 2021, on the drivers of a bus company in Changchun. Since there were fewer female drivers, they were not included in the scope of this survey. Before the questionnaire was distributed, we first communicated with Changchun Public Transport Co., Ltd., Jilin Province, China. And explained the purpose, significance, precautions, distribution method, collection method, etc., of the questionnaire in detail. The 122 male drivers, randomly selected from the driver population, were required to be healthy and free from major diseases such as heart disease and cerebral thrombosis. After obtaining the drivers’ informed consent, the basic information of the drivers’ demographic characteristics, personality characteristics, and recent psychological symptoms were collected through questionnaire surveys. If an individual had missing items and logical errors in answering the question, it was considered an ineffective questionnaire, excluding the scope of the research objects. The number of valid questionnaires returned was 120, 98.4% of which were effective questionnaires. After completing the above steps, the driver processed the data of the questionnaire. The Exce12003 tool was mainly used to collate data, and the statistical software SPSS25.0 was used for the reliability test, difference analysis, correlation analysis, etc., inspection level ɑ = 0.05. The Bayesian structural equation model was analyzed using AMOS25.0. It was divided into the accident group and non-accident group.
Drivers were divided into the accident group and the non-accident group. A driver in the accident group was defined as one who has had a traffic accident in the past two years due to one or more of drivers’ traffic violations (including drunk driving, speeding, running a red light, scraping, collision, rolling, and rollover). It was confirmed that there were 40 drivers (33.33%) in the accident group and 80 (66.67%) drivers in the non-accident group.

4.2. Socio-Demographic Characteristics Analysis

Demographic information includes drivers’ age, driving experience (driving experience refers to the number of years for a motor vehicle driver to obtain the driving qualification, which starts from the date when the driver obtained their driving qualification), marital status (married/unmarried), and education (below junior high school, high school, and technical secondary school, junior college, or above). Drivers’ ages were divided into five groups: ≤25, 26–35, 36–45, 46–55 and >55 years old; driving experience was divided into six groups: ≤2, 3–5, 6–10, 11–15, 16–20 and >21 years [26].
Table 1 compares the demographic information of the accident group and the non-accident group of bus drivers. The average age of drivers in the accident group was 37.73 ± 9.371 years old, and that of drivers in the non-accident group was 37.1 ± 8.102 years old. The average driving experience in the accident group was 11.91 ± 11.007 years, and that in the non-accident group was 7.43 ± 9.177 years. The Chi-square test was used to analyze drivers’ ages and driving experience; the results showed that the drivers’ age and driving age were different and statistically significant (p < 0.05 or p < 0.01). The non-parametric, rank-sum test was used to analyze marriage and education, and the results indicated that marital status and education were not statistically significant (p > 0.05). Therefore, driving age and age may be influencing factors in bus-driver accidents.

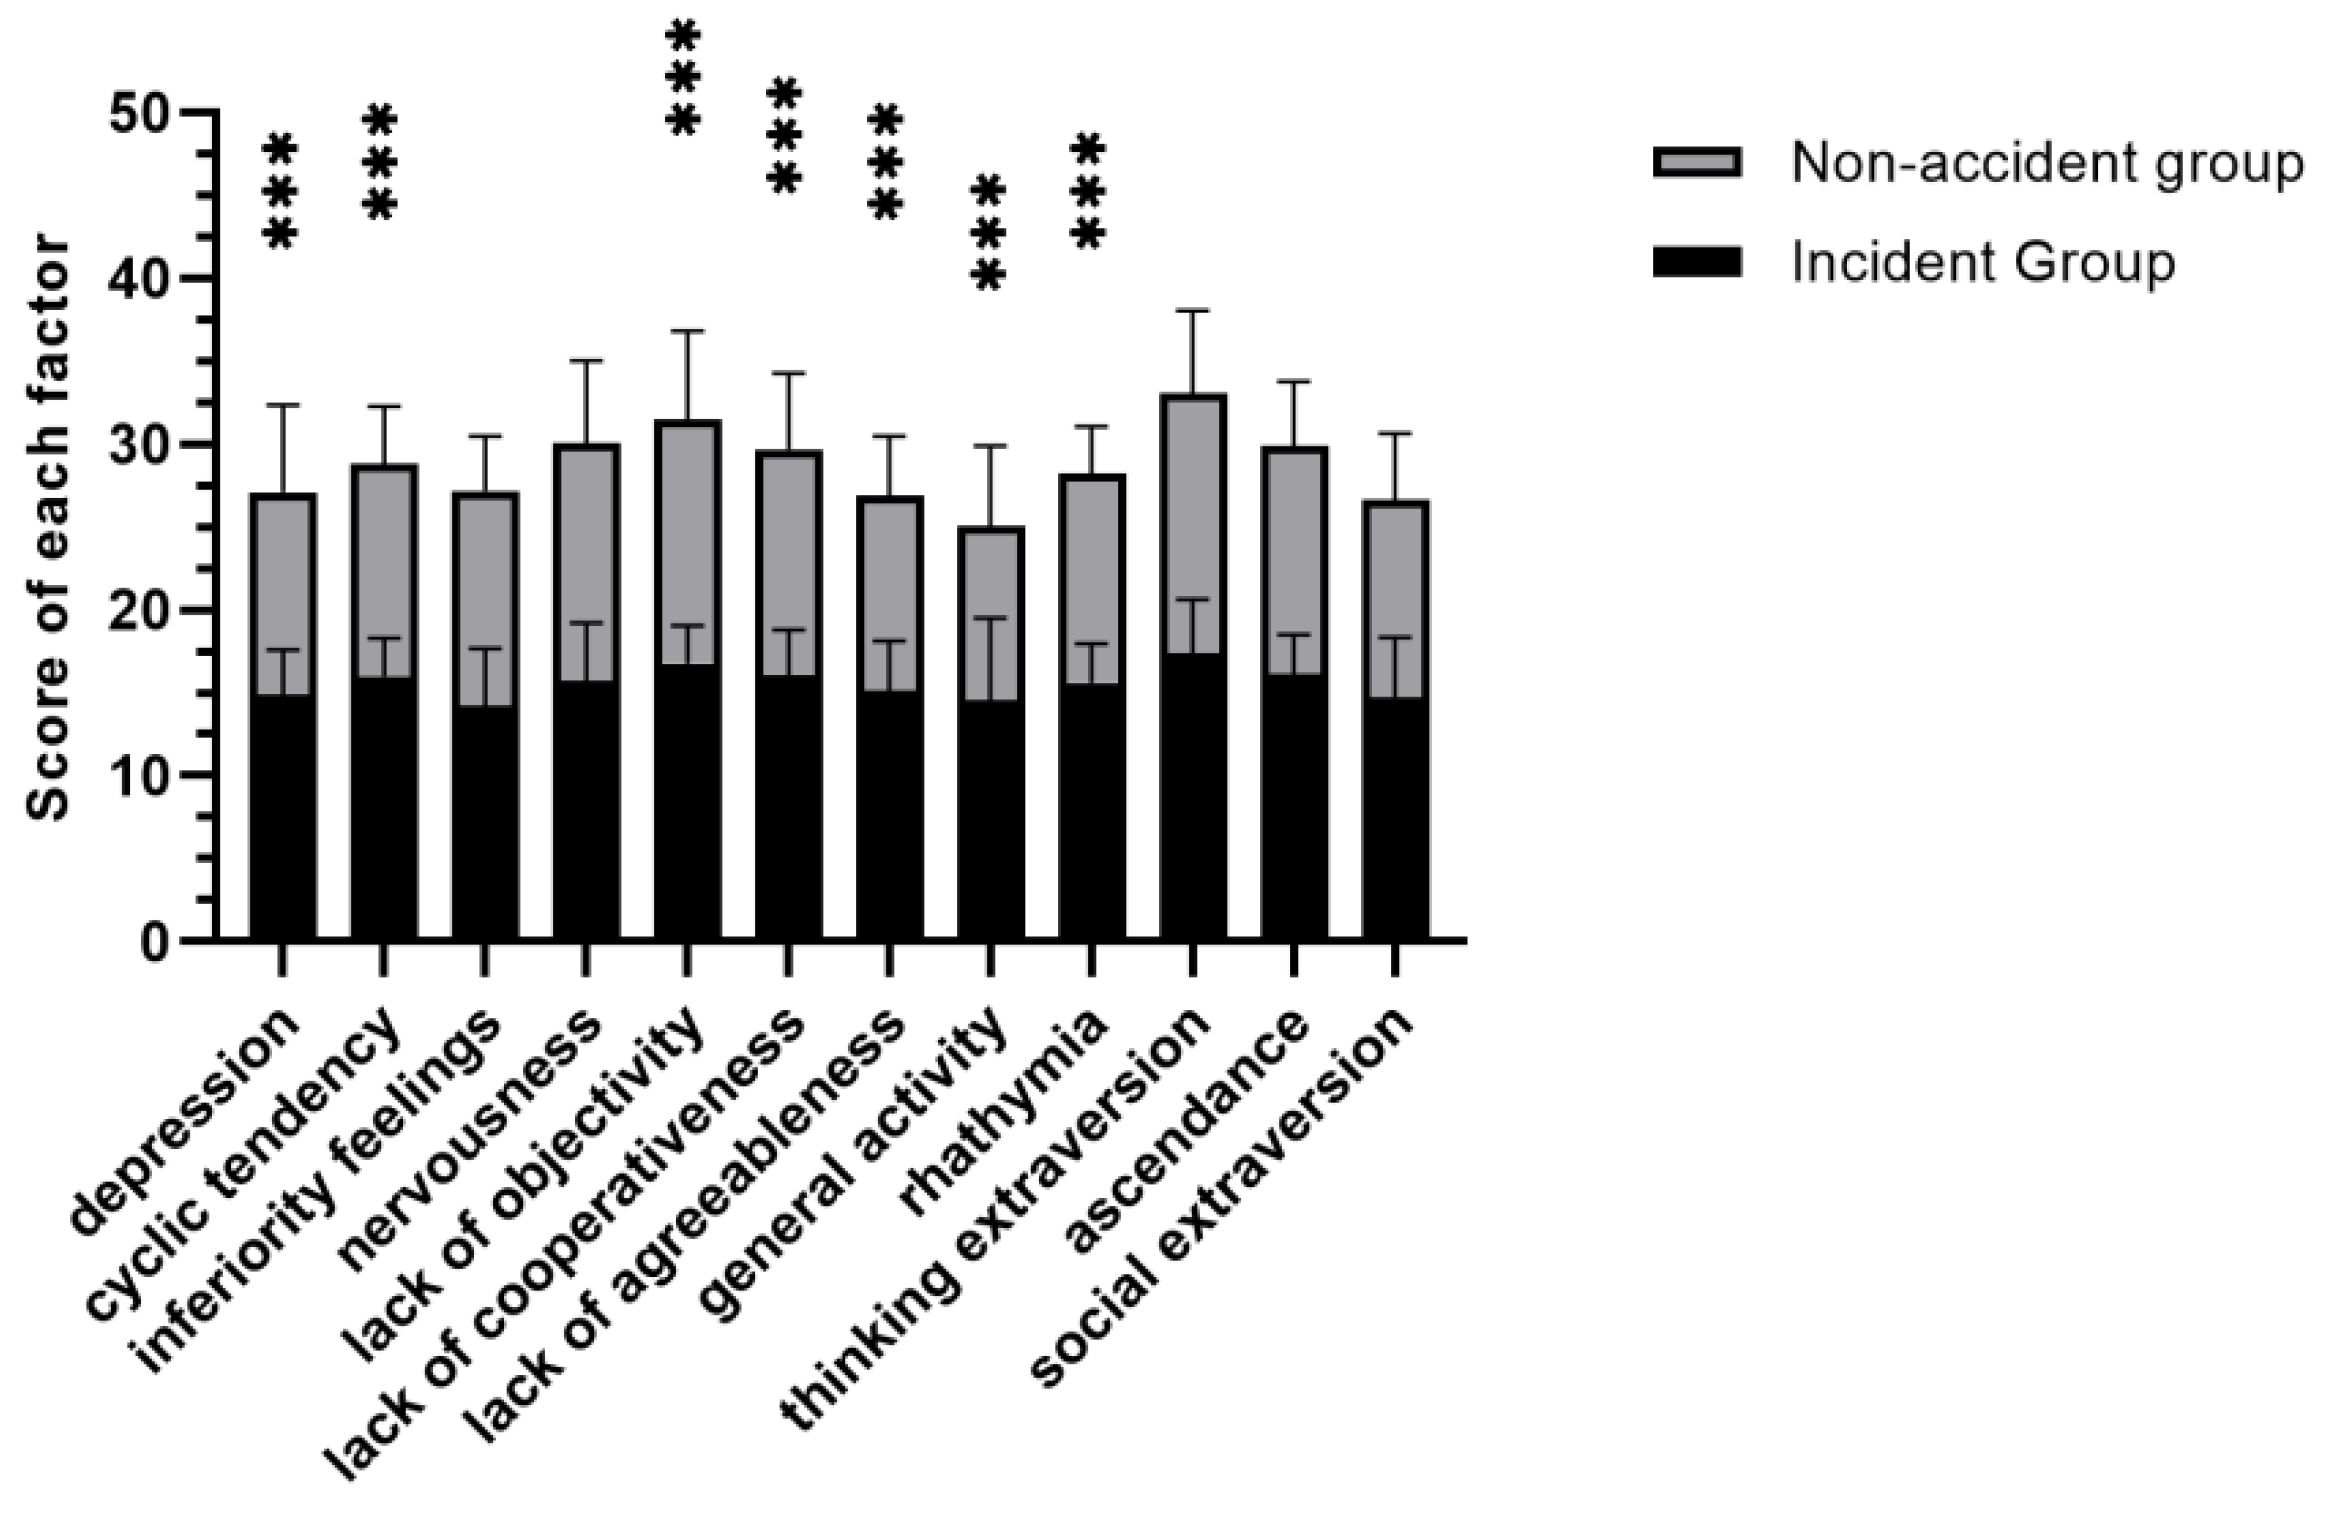
4.3. Characteristic Analysis of the Y-G Scale

Figure 2 compares the personality characteristics of the bus drivers in the accident group and the non-accident group. The scores of depression, cyclic tendency, lack of objectivity, lack of cooperativeness, and lack of agreeableness for the accident group were significantly higher than scores for non-accident group drivers, and their scores in general activity and rhathymia were lower than those in the non-accident group with significant differences. The results of the t-test showed that the difference was statistically significant (p < 0.05). That is to say, depression, cyclic tendency, lack of objectivity, lack of cooperativeness, and lack of agreeableness, general activity, and rhathymia may be the personality factors affecting drivers’ traffic accidents.

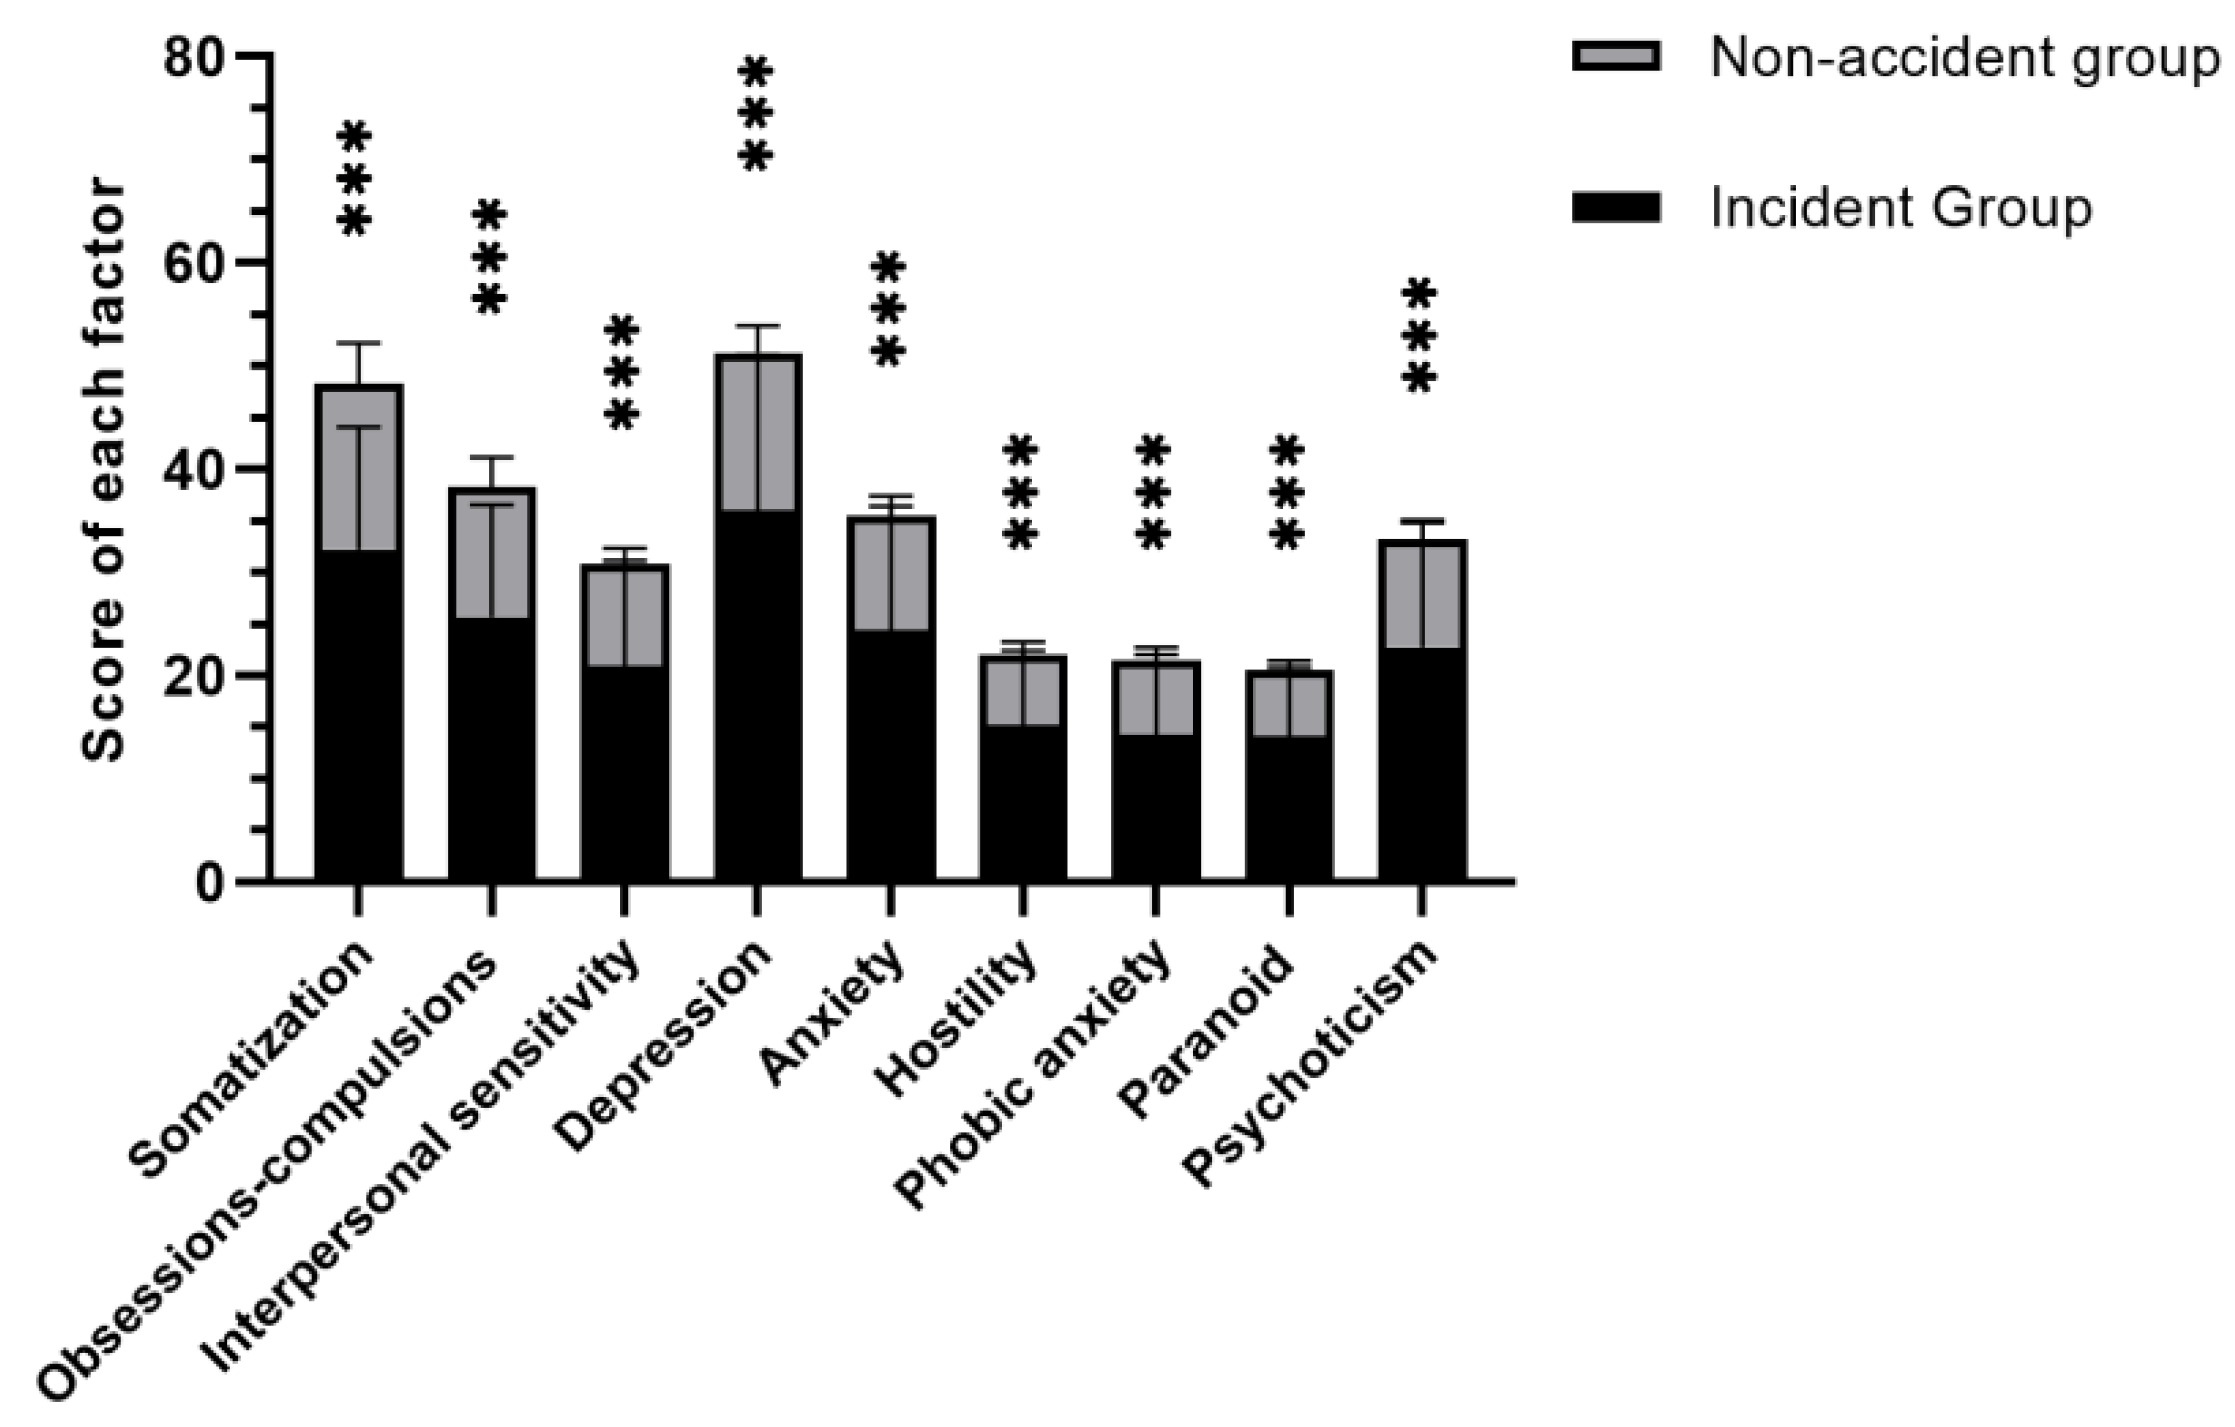
4.4. Analysis of Psychological Characteristics of the SCL-90 Scale

Figure 3 compares the nine dimensions of adverse psychological symptoms of bus drivers in the accident group and the non-accident group. The scores of drivers in the accident group on nine factors such as somatization, obsessive-compulsive disorder, and interpersonal sensitivity were significantly higher than those in the non-accident group. The results of the t-test showed that the difference was statistically significant (p < 0.01). That is to say, nine factors such as somatization and obsessions-compulsions may be the psychological factors of drivers in traffic accidents.

4.5. Binary Logistic Regression Analysis

Taking groups as dependent variables (accident group = 1; non-accident group = 0), single-factor analysis was used to screen out the factors with significant differences in the occurrence of traffic accidents as independent variables, including age, driving experience, depression, cyclic tendency, lack of objectivity, lack of cooperativeness, lack of agreeableness, general activity, and rhathymia, and nine factors of the SCL-90 scale. Binary logistic regression was used to analyze the risk factors affecting traffic accidents, and the Hosmer-Lemeshow goodness-of-fit test model fit well (p = 0.941 > 0.05). Table 2 shows that age, driving experience, somatization, depression, anxiety, cyclic tendency, and lack of objectivity are the seven factors prone to traffic accidents (p < 0.05). Compared with drivers aged ≤ 25 years old, only drivers aged 26–35 were 83.4% less likely to have a traffic accident (OR: 0.166; 95% CI: 0.011–0.389). Compared with a driving experience > 2 years, the risk of traffic accident for driving experience ≤ 2 years increased approximately 2.4 times (OR: 2.432; 95% CI: 0.480–6.65).
In terms of personality and mental health, cyclic tendency and lack of objectivity were the influencing factors of traffic accident behaviors (OR: 1.41, and 95% CI: 1.1–1.808; OR: 1.188, and 95% CI: 1.057–1.336). Further, drivers with somatization had a two-fold increase in the risk of traffic accident behaviors (OR: 2.326; 95% CI: 1.141-4.743). Drivers with depression and anxiety increased the risk of traffic accident behaviors by 3 and 1 times (OR: 3.251, and 95% CI: 1.153–7.049; OR: 1.449, and 95% CI: 1.091–1.924), respectively.

5. Construction of the Bayesian Network Model

5.1. Basic Principles

A Bayesian network is a directed acyclic graph (DAG) composed of nodes, directed connections between nodes, and conditional probability tables. The directed graph expresses the causal relationship between various information elements and the degree of mutual influence [27], and each information element refers to the node variable in the network. The Bayesian network model is intuitive with a high degree of high generalization to the data, and model visualization can visually display the correlation between various influencing factors in a complex system. Therefore, a Bayesian network model is used to describe the relationship between the mental health of bus drivers and traffic safety in the work; the joint probability is defined as
P ( X ) = i = 1 n P ( X i | π i )
where X i = { X 1 , X 2 , , X n } ; X i represents the node of the variable; π i the set of parent nodes of the variable X i .

5.2. Node Determination

The work combined the logistic regression results in Section 4.4 with background knowledge to determine eight nodes involved in constructing the Bayesian network model, including the driver’s age, driving experience, cyclic tendency, lack of objectivity, somatization, depression, anxiety, and group. Before structure learning, the nodes were discretized. K-means cluster analysis was used to rank cyclic tendency, lack of objectivity, somatization, depression, and anxiety, and the variation range of each variable was divided into three categories: mild, moderate, and severe. Table 3 shows the discretized values and descriptions of variables.

5.3. Structural Learning

The K2 algorithm and expert knowledge were combined to construct the Bayesian network structure. Based on the K2 algorithm, FullBNT-1.0.7 was used for structural learning through Matlab. Figure 4 shows the network structure of the Bayesian network model for evaluating the mental health and traffic safety of bus drivers, and the lines between these nodes indicate the relationship between variables. For example, “depression factors are affected by lack of objectivity and cyclic tendency personality factors, and somatization is affected by driving experience”.

5.4. Parameter Learning

Few missing data existed because the driver survey was in the form of questionnaires; therefore, the EM algorithm was used for parameter learning under incomplete sample data. A Bayesian network structure was established in Netica. Then the EM algorithm was used for the parameter learning of the network structure of the Bayesian network model. The final bayesian network model of bus driver mental health and traffic safety assessment is shown in Figure 5.

6. Analysis of the Bayesian Network Model

6.1. Sensitivity Analysis

Sensitivity analysis was used to identify sensitivity factors significantly affecting the accidents of bus drivers from multiple uncertain factors in order to take effective measures to reduce the probability of these sensitive factors. Mutual information refers to the direct- or indirect-information flow rate, indicating whether two nodes depend on each other and the degree of dependence between nodes [28]. The group was selected as the target node, and the sensitivity analysis module in Netica was used to obtain Table 4. The results showed that the mutual information of depression of 0.07657 was the most significant factor in bus driver accidents. The mutual information of anxiety and somatization were 0.03511 and 0.03344, respectively. These two factors were also strong decisive factors for traffic accidents of bus drivers. Cyclic tendency was followed, with mutual information of 0.01041. Although other factors have fewer impacts, they cannot be ignored.

6.2. Model Reasoning

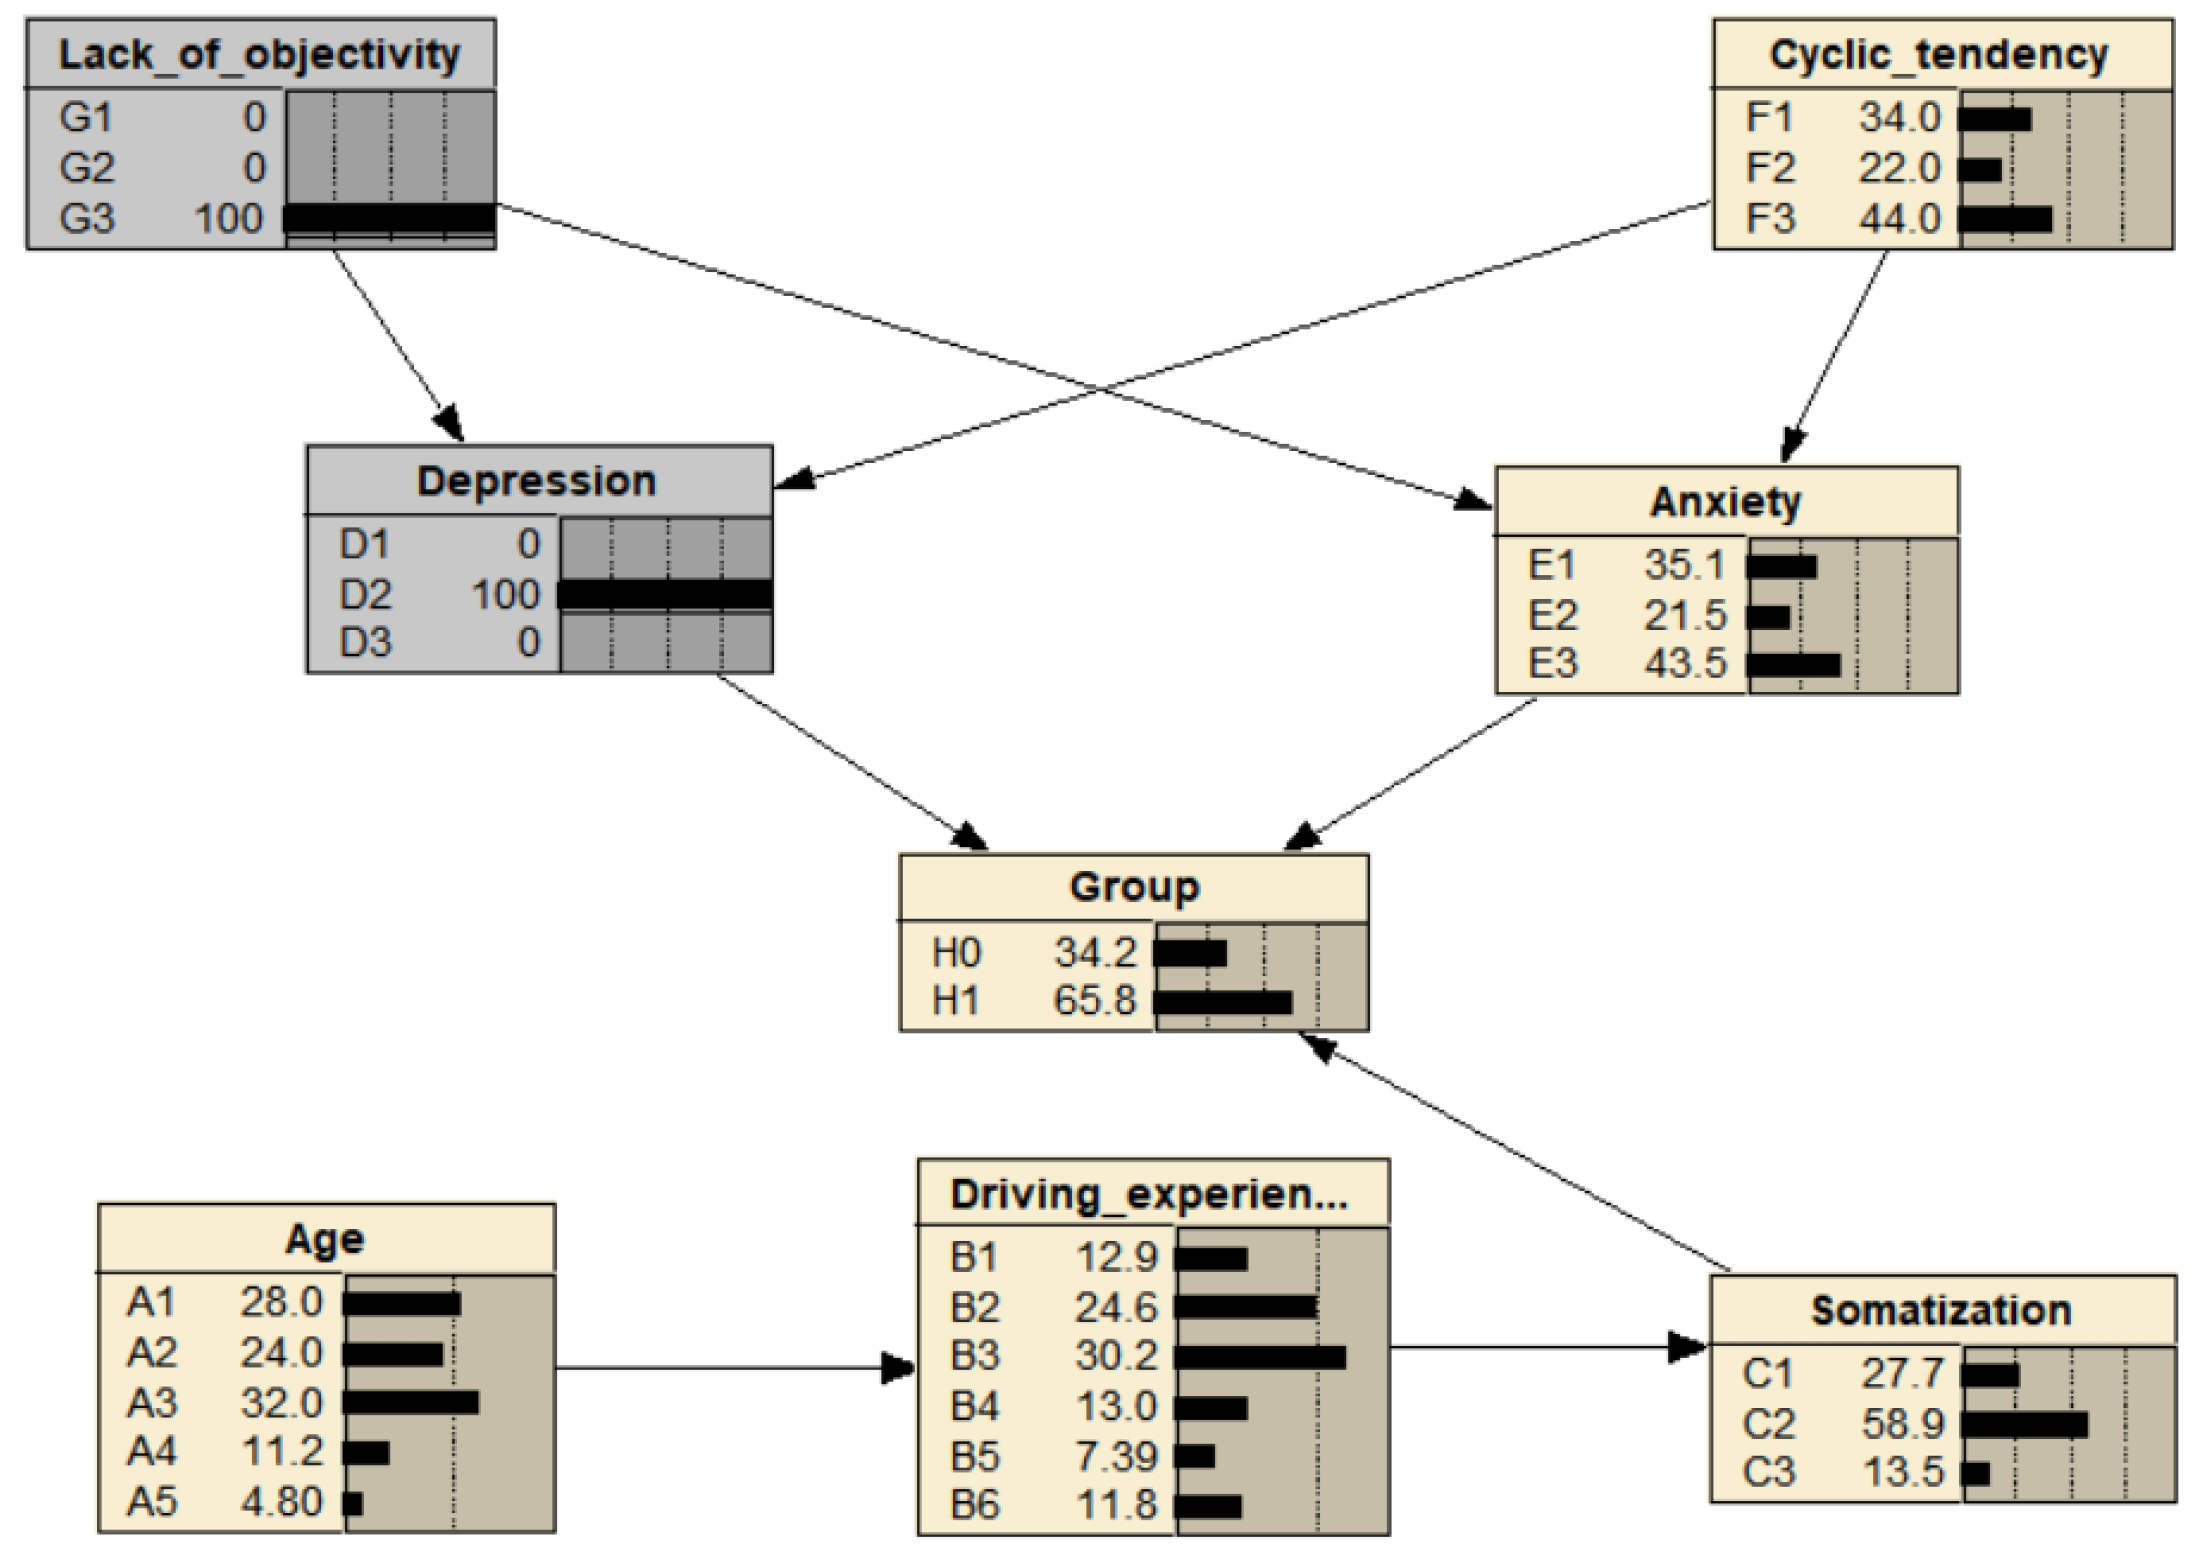
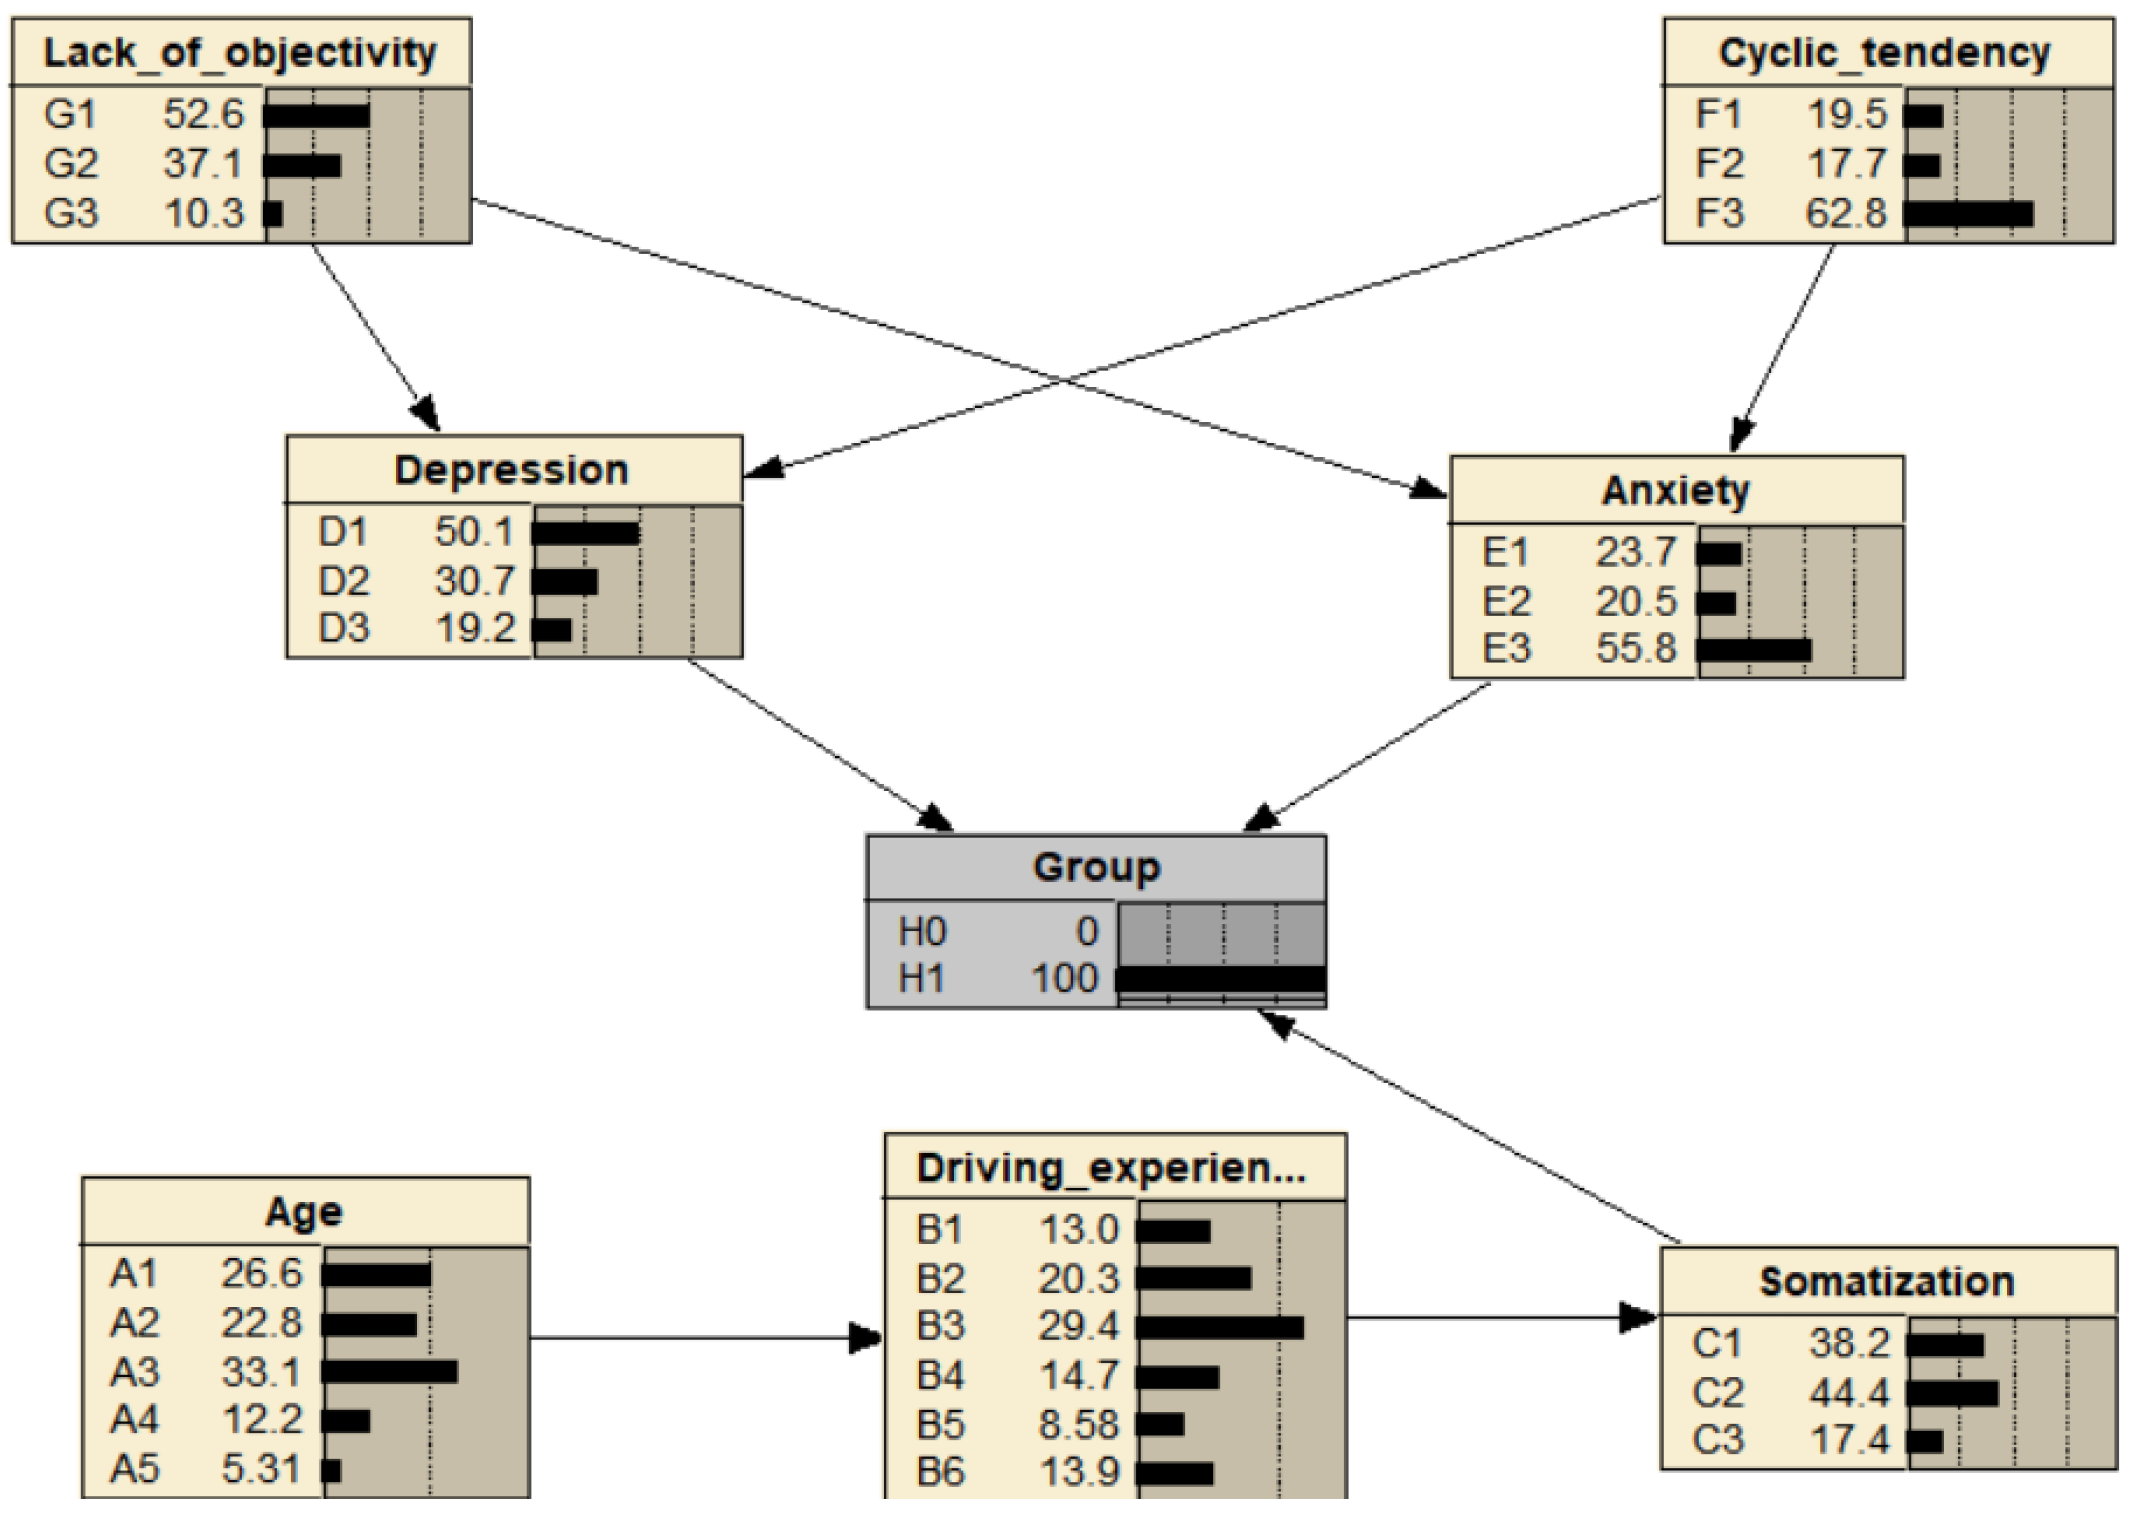
6.2.1. Accident Prediction

The node status of each factor was set to 100%, the state of single node which influenced the probability of accident occurrence to increase significantly was obtained. Compared with the results of Figure 5, the probabilities of accidents changed greatly after the node statuses (such as B2, C1, C3, D2, D3, E1, E2, F1, and G3) in Table 5 were updated.
Any two-node states in Table 5 were set to 100%, updating the network. Compared with the results of Figure 5, the results with more obvious accident probability were shown in Table 6. For example, in Netica, setting the status of “G3” and “D2” to 100% determined the status of the evidence variable. The changes in the probabilities of relevant nodes were observed by updating the probability of the entire network, namely the probability changes of “Group” and other nodes (see Figure 6). In this case, the probability of an accident increased from the initial 39.1 to 65.8%. This suggests that if the bus driver is depressed with high subjectivity, the probability of an accident increases significantly.

6.2.2. Diagnosis of Accident Causes

Accident causes are diagnosed inferentially. Assuming that an accident must happen, the state probability is 100%. In Figure 7, after entering the evidence, the probability of moderate depression increases from 17.9 to 30.7%, and the probability of mild anxiety from 16.9 to 23.7% through Netica’s automatic updates. The probability of mild somatization increases from 27.7 to 38.2%, and the changes in other factors are not as significant as these three. Therefore, in the absence of other evidence, from these three factors, we can make corresponding improvement measures to the psychological factors of drivers in traffic accidents.

6.3. Model Evaluation

The ROC curve and AUC are used as criteria to measure the effectiveness of the Bayesian network model. An AUC of 1 represents a perfect test; an AUC of 0.5 indicates that the test is worthless. When the AUC value is greater than 0.5, the model is deemed useful; when the AUC value is 0.7–0.9, it can be considered an excellent model [29]. The method is simple and intuitive—the accuracy of the analysis model can be observed through the diagram, and the judgment can be made with naked eyes. The ROC curve was used to evaluate the effectiveness of the model (see Figure 8 for the results). The AUC value of the Bayesian network model was 0.89 (95% CI: 0.825–0.956), which proves that the model has a high use value.

7. Discussion and Conclusions

The purpose of this study is to explore the relationship between the demographic characteristics of bus drivers and the severity of unhealthy psychology and negative and impulsive personality on the probability of a driver’s traffic accident. By constructing a Bayesian network model of bus driver mental health and traffic safety assessment, the key factors and combination factors of traffic accidents can be quickly and accurately identified. The results of survey experiments and analysis of sample drivers show the following:
(1) Analysis of demographic factors showed that drivers aged 36–45 were 83.4% less likely to be involved in a traffic accident. This may be because most middle-aged and elderly drivers have rich practical experience in driving, their psychological quality has matured, and their driving adaptability tends to be relatively perfect. There are many situations that do not need to be thought about. With years of driving experience, you can deal with them subconsciously, and creatively overcome various difficulties under conditions that are not conducive to your own driving. Drivers with less than 2 years of driving experience have an approximately 2.4-fold increase in the risk of traffic accidents, which may be due to the lack of driving experience of drivers with low driving experience. They are more sensitive to external stimuli, and most of them are young and high-spirited, and their ability to regulate their emotions is not strong. This is prone to the phenomenon of driving fast and fighting cars, which can easily lead to traffic accidents [16].
(2) The results of the analysis of psychological factors showed that a driver with somatization increased the risk of traffic accident behavior by two times. Drivers with depression and anxiety have a 3-fold and 1-fold increased risk of traffic accident behavior, respectively. This may be due to the relatively fixed driving posture of the bus driver. Moreover, the driver’s seat design of most buses in China is not suitable for long-term driving. Due to long hours of work, bus drivers have little time for activities and relaxation, and cannot adjust their bodies well, and are prone to suffer from occupational diseases such as headache, muscle pain, cervical spondylosis, stomach disease, and lumbar disc herniation. In addition, drivers with depression and anxiety are more prone to impulsiveness, more irritable, experience a lack of self-confidence and low self-esteem in the process of talking with people, often feel depressed, lose interest in life, are pessimistic, lack energy in usual work, and feel bored with things. If this type of driver encounters congestion on the bus lane and the bus lane is occupied, compared with the non-accident group drivers, they are more likely to become impatient, anxious, and impulsive, and will produce irrational behaviors such as borrowing other lanes to overtake. These illegal or dangerous traffic behaviors are more likely to lead to accidents.
(3) The results of the analysis of personality factors showed that the risk of traffic accidents increased by 1.4 and 1.1 times for cyclic tendency and lack of objectivity drivers. Drivers with this type of personality are emotionally changeable, prone to fatigue, and easily excited. Once they encounter overtaking, giving way, and traffic jams, they will feel unhappy and become pessimistic, and are more likely to have traffic accidents. Moreover, such drivers usually take small things to heart, and they are fanciful and cannot judge things calmly and objectively. This character trait is very detrimental to driving safety.
(4) The analysis results of the Bayesian network model of bus drivers’ mental health and traffic safety assessment showed that the single node states that affect the probability of accidents significantly increase are B2, C1, C3, D2, D3, E1, E2, F1, G3. The two-node states with significantly increased accident probability are (B2, D2); (C1, E1); (C1, F1); (C1, D1); (C3, D2); (D2, F1); (D2, G3); (D2, E1); (D2, E2). In the absence of other evidence, the most probable causes of the accident can be obtained by diagnosing the cause of the accident through the Bayesian network model are moderate depression, mild anxiety, and mild somatization. It can be inferred that bus drivers with moderate depression, mild anxiety, and mild somatization are more likely to become emotional, feel nervous, and easily have mood swings, thereby increasing the risk of road traffic accidents.
(5) In view of the fact that personality is a stable psychological characteristic, it is not easy to change in the process of human growth and behavioral intervention, so it is suggested that enterprises should select stable and optimistic drivers when selecting bus drivers. At the same time, psychological evaluation methods such as the evaluation method proposed in this paper should be used to regularly detect and evaluate the mental health of drivers on duty, and they should be classified and adjusted by effective management measures such as humanistic care, education and training, and psychological intervention.
Practical Applications: The work’s method can help transportation companies to accurately assess whether on-the-job drivers have psychological problems and the reasons for the problems, such as serious psychological pressure and negative emotions, so that they can take education and training, treatment, psychological guidance, and other methods to give timely interventions. In order to prevent drivers from causing traffic accidents due to psychological problems, it can help transportation companies to distinguish which candidate drivers have personality or psychological defects and to judge the severity of such defects, so as to screen out those who are not suitable for driving work in advance, and only hire healthy drivers who are more competent for the work. This would improve the safety of public transport. The role of the above two aspects of the research method has been reflected and confirmed in the selection and employment, daily safety, and health management of more than 100 drivers in a bus company in Jilin Province, China.

Author Contributions

J.X.: Conceptualization, Formal analysis, Investigation, Methodology, Project administration. P.W.: Writing—original draft, Writing—review & editing. T.D.: Conceptualization, Investigation, Writing—original draft, Writing—review & editing. J.T.: Investigation, Methodology, Writing—review & editing. Z.L.: Investigation, Writing—original draft, Writing—review & editing. All authors have read and agreed to the published version of the manuscript.

Funding

This work was supported by National Key R&D Program of China [2021YFC3001500] the project of Analysis of Influencing Factors and Countermeasures of Passenger Drivers’ Post-qualification Status [20210503].

Data Availability Statement

The data presented in this study are openly available in SCIENCE DATA BANK at 10.57760/sciencedb.j00052.00009.

Acknowledgments

The authors gratefully the crucial role of collaborating public transport companies and participants, and they helped us in collecting the necessary data for the research. We are also deeply indebted to Meng Fanyun for his assistance and guidance in doing this research.

Conflicts of Interest

The authors declare that they have no competing interests.

References

  1. Parker, D.; Reason, J.T.; Manstead, A.; Stradling, S.G. Driving errors, driving violations and accident involvement. Ergonomics 1995, 38, 1036–1048. [Google Scholar] [CrossRef] [PubMed]
  2. National Bureau of Statistics of the PRC. Available online: https://data.stats.gov.cn/easyquery.htm?cn=C01&zb=A0B07&sj=2020 (accessed on 16 May 2020).
  3. Preti, A.; Carta, M.G.; Petretto, D.R. Factor structure models of the SCL-90-R: Replicability across community samples of adolescents. Psychiatry Res. 2018, 272, 491–498. [Google Scholar] [CrossRef]
  4. Hubicka, B.; Källmén, H.; Hiltunen, A.; Bergman, H. Personality traits and mental health of severe drunk drivers in Sweden. Soc. Psychiatry Psychiatr. Epidemiol. 2009, 45, 723–731. [Google Scholar] [CrossRef]
  5. Alavi, S.S.; Mohammadi, M.R.; Souri, H.; Kalhori, S.M.; Jannatifard, F.; Sepahbodi, G. Personality, Driving Behavior and Mental Disorders Factors as Predictors of Road Traffic Accidents Based on Logistic Regression. Iran. J. Med. Sci. 2017, 42, 24–31. [Google Scholar]
  6. Alavi, S.S.; Mohammadi, M.R.; Soori, H.; Ghanizadeh, M. The Cognitive and Psychological Factors (Personality, Driving Behavior, and Mental Illnesses) As Predictors in Traffic Violations. Iran. J. Psychiatry 2017, 12, 78–86. [Google Scholar]
  7. Tao, D.; Zhang, R.; Qu, X. The role of personality traits and driving experience in self-reported risky driving behaviors and accident risk among Chinese drivers. Accid. Anal. Prev. 2017, 99, 228–235. [Google Scholar] [CrossRef]
  8. Segerstrom, S.C.; O’Connor, D.B. Stress, health and illness: Four challenges for the future. Psychol. Health 2012, 27, 128–140. [Google Scholar] [CrossRef]
  9. Wu, W.T.; Tsai, S.S.; Wang, C.C.; Lin, Y.J.; Wu, T.N.; Shih, T.S.; Liou, S.H. Professional Driver’s Job Stress and 8-year Risk of Cardiovascular Disease: The Taiwan Bus Driver Cohort Study. Epidemiology 2019, 30 (Suppl. S1), S39–S47. [Google Scholar] [CrossRef]
  10. Montoro, L.; Useche, S.; Alonso, F.; Cendales, B. Work Environment, Stress, and Driving Anger: A Structural Equation Model for Predicting Traffic Sanctions of Public Transport Drivers. Int. J. Environ. Res. Public Health 2018, 15, 497. [Google Scholar] [CrossRef] [Green Version]
  11. Silva, D.; Cunha, L.; Barros, C.; Baylina, P. Preparing the Future Scenario of Automated Vehicles: Recommendations Drawn from the Analysis of the Work Activity of Road Transport Workers. In International Conference on Healthcare Ergonomics and Patient Safety; Springer: Cham, Switzerland, 2019. [Google Scholar]
  12. Tu, Z.; He, J.; Zhou, N.; Shen, X. Driver-passenger communicative stress and psychological distress among Chinese bus drivers: The mediating effect of job burnout. BMC Public Health 2021, 21, 547. [Google Scholar] [CrossRef]
  13. Wang, X.; Huang, K.; Yang, L. Effects of socio-demographic, personality and mental health factors on traffic violations in Chinese bus drivers. Psychol. Health Med. 2019, 24, 890–900. [Google Scholar] [CrossRef] [PubMed]
  14. Chalmers, T.; Maharaj, S.; Lal, S. Associations Between Workplace Factors and Depression and Anxiety in Australian Heavy Vehicle Truck Drivers. Ann. Work Expo. Health 2021, 65, 581–590. [Google Scholar] [CrossRef] [PubMed]
  15. Delhomme, P.; Gheorghiu, A. Perceived stress, mental health, organizational factors, and self-reported risky driving behaviors among truck drivers circulating in France. J. Saf. Res. 2021, 79, 341–351. [Google Scholar] [CrossRef] [PubMed]
  16. Huang, Y.-W.; Lin, P.-C.; Wang, J. The influence of bus and taxi drivers’ public self-consciousness and social anxiety on aberrant driving behaviors. Accid. Anal. Prev. 2018, 117, 145–153. [Google Scholar] [CrossRef]
  17. Lambert-Bélanger, A.; Dubois, S.; Weaver, B.; Mullen, N.; Bédard, M. Aggressive driving behaviour in young drivers (aged 16 through 25) involved in fatal crashes. J. Saf. Res. 2012, 43, 333–338. [Google Scholar] [CrossRef]
  18. Smorti, M.; Guarnieri, S. Do aggressive driving and negative emotional driving mediate the link between impulsiveness and risky driving among young Italian drivers? J. Soc. Psychol. 2016, 156, 669–673. [Google Scholar] [CrossRef]
  19. Kovaceva, J.; Isaksson-Hellman, I.; Murgovski, N. Identification of aggressive driving from naturalistic data in car-following situations. J. Saf. Res. 2020, 73, 225–234. [Google Scholar] [CrossRef]
  20. Wang, X.; Jiao, Y.; Huo, J.; Li, R.; Zhou, C.; Pan, H.; Chai, C. Analysis of safety climate and individual factors affecting bus drivers’ crash involvement using a two-level logit model. Accid. Anal. Prev. 2021, 154, 106087. [Google Scholar] [CrossRef]
  21. Guo, M.; Wei, W.; Liao, G.; Chu, F. The impact of personality on driving safety among Chinese high-speed railway drivers. Accid. Anal. Prev. 2016, 92, 9–14. [Google Scholar] [CrossRef]
  22. Wang, X.; Wang, K.; Huang, K.; Wu, X.; Huang, W.; Yang, L. The association between demographic characteristics, personality, and mental health of bus drivers in China: A structural equation model. Physiol. Behav. 2020, 229, 113247. [Google Scholar] [CrossRef]
  23. Xin, Z.; Long, Y.W. A bayesian network approach to causation analysis of road accidents using netica. J. Adv. Transp. 2017, 2017, 2525481. [Google Scholar] [CrossRef] [Green Version]
  24. Kourou, K.; Exarchos, K.P.; Papaloukas, C.; Fotiadis, D.I. A Bayesian Network-based approach for discovering oral cancer candidate biomarkers. In Proceedings of the 2015 37th Annual International Conference of the IEEE Engineering in Medicine and Biology Society (EMBC), Milan, Italy, 25–29 August 2015; pp. 7663–7666. [Google Scholar] [CrossRef]
  25. Zhiteneva, V.; Carvajal, G.; Shehata, O.; Hübner, U.; Drewes, J.E. Quantitative microbial risk assessment of a non-membrane based indirect potable water reuse system using Bayesian networks. Sci. Total Environ. 2021, 780, 146462. [Google Scholar] [CrossRef] [PubMed]
  26. Zhang, G.; Yau, K.K.; Chen, G. Risk factors associated with traffic violations and accident severity in China. Accid. Anal. Prev. 2013, 59, 18–25. [Google Scholar] [CrossRef] [PubMed]
  27. Fuster-Parra, P.; Vidal-Conti, J.; Borràs, P.; Palou, P. Bayesian networks to identify statistical dependencies. A case study of Spanish university students’ habits. Inform. Health Soc. Care 2016, 42, 166–179. [Google Scholar] [CrossRef] [PubMed]
  28. Zhang, Y.; Weng, W. A Bayesian Network Model for Seismic Risk Analysis. Risk Anal. 2021, 41, 1809–1822. [Google Scholar] [CrossRef]
  29. Ma, H.; Bandos, A.I.; Rockette, H.E.; Gur, D. On use of partial area under the ROC curve for evaluation of diagnostic performance. Stat. Med. 2013, 32, 3449–3458. [Google Scholar] [CrossRef]
Figure 1. Flow of constructing the Bayesian network model for evaluating bus drivers’ mental health and traffic safety.
Applsci 13 00100 g001
Figure 2. Comparison of the scores of each factor of the Y-G personality scale between drivers in the accident group and non-accident group. Note: *** p < 0.001.
Applsci 13 00100 g002
Figure 3. Comparison of the scores of each factor of the SCL-90 scale between drivers in the accident group and non-accident group. Note: *** p < 0.001.
Applsci 13 00100 g003
Figure 4. Network structure of the Bayesian network model for evaluating bus drivers’ mental health and traffic safety. 1—Age; 2—Driving experience; 3—Somatization; 4—Depression; 5—Anxiety; 6—Cyclic tendency; 7—Lack of objectivity; 8—Group.
Applsci 13 00100 g004
Figure 5. Bayesian network model of bus drivers’ mental health and traffic safety assessment after Netica parameter learning.
Applsci 13 00100 g005
Figure 6. Accident prediction when the evidence variables are “G1 mild” and “D2 moderate”.
Applsci 13 00100 g006
Figure 7. Evidence variable as the diagnosis of accident causes.
Applsci 13 00100 g007
Figure 8. ROC curve of the accident prediction of the Bayesian network model.
Applsci 13 00100 g008
Table 1. Comparison of demographic information between the accident group and non-accident group of bus drivers.
Demographic InformationAccident Group (n = 40)Non-Accident Group (n = 80)p
Number of PeopleProportion (%)Number of PeopleProportion (%)
Age≤25 years old123078.80.005 *
26–35 years old922.52126.3
36–45 years old6153442.5
46–55 years old615911.3
>55 years old717.5911.3
Driving experience≤2 years1332.58100.026 *
3–5 years717.51012.5
6–10 years6152227.5
11–15 years4101316.3
16–20 years6151012.5
>21 years4101721.3
Marital statusMarried307568850.184
Unmarried10251215
Education backgroundJunior high school and below12301417.50.860
High school and technical secondary school16405467.5
Junior college and above12301215
Note: * p < 0.05.
Table 2. Analysis of the risk factors that drivers are prone to traffic accidents.
OR95% CIp
Age (reference: ≤ 25 years old)
26–350.1660.0810.3890.003 *
36–450.6270.1912.0690.442
46–550.1650.0122.3580.184
<551.0380.2993.6120.478
Driving experience (reference: >21 years)
≤22.4320.4806.650.017 *
3–51.2440.3775.5850.649
6–101.8120.1874.2370.290
11–151.0800.1582.3450.322
16–200.6080.2581.3590.628
Y-G
Cyclic tendency1.411.1001.8080.007 *
Lack of objectivity1.1881.0571.3360.001 *
SCL-90
Somatization2.3261.1414.7430.02 *
Depression3.2511.1537.0490.023 *
Anxiety1.4491.0911.9240.030 *
Note: * p < 0.05.
Table 3. Variables used to construct the Bayesian network.
Variable NameSymbolVariable Value
AgeAA1: ≤25
A2: 26–35
A3: 36–45
A4: 46–55
A5: >55
Driving experienceBB1: ≤2
B2: 3–5
B3: 6–10
B4: 11–15
B5: 16–20
B6: >21
SomatizationCC1 mild: 12–20
C2 moderate: 21–36
C3 severe: 37–57
DepressionDD1 mild: 13–23
D2 moderate: 24–42
D3 severe: 43–65
AnxietyEE1 mild: 10–15
E2 moderate: 16–30
E3 severe: 31–50
Cyclic tendencyFF1 mild: 5–10
F2 moderate: 11–16
F3 severe: 17–20
Lack of objectivity,GG1 mild: 4–9
G2 moderate: 10–15
G3 severe: 16–20
GroupHH0: Non-accident group
H1: Accident group
Table 4. Sensitivity analysis of node groups.
NodeMutual infoPercentVariance of Beliefs
Group0.960091000.2362969
Depression0.076577.980.0253391
Anxiety0.035113.660.0116539
Somatization0.033443.480.0109792
Cyclic tendency0.010411.080.0034847
Driving experience0.006450.6720.0021072
Lack of objectivity0.005650.5890.0018577
Age0.001360.1410.0004463
Table 5. Single node status affecting the probabilities of accidents.
Node StatusB2C1C3D2D3E1E2F1G3
Probability of the updated accident47.1%54%50.6%67.2%52.254.8%53.1%52.1%48.3%
Variable quantity in probability8.0%14.9%11.5%28.1%13.1%15.7%14.0%13.0%9.2%
Table 6. Two-node states affecting the probabilities of accidents.
Node StatusProbability of the Updated AccidentVariable Quantity in Probability
B2, D266%26.9%
C1, E169.5%30.4%
C1, F162.823.7
C1, D177.3%38.2%
C3, D265.2%26.1%
D2, F164.5%25.4%
D2, G365.8%26.7%
D2, E165.4%26.3%
D2, E260.2%21.1%
Disclaimer/Publisher’s Note: The statements, opinions and data contained in all publications are solely those of the individual author(s) and contributor(s) and not of MDPI and/or the editor(s). MDPI and/or the editor(s) disclaim responsibility for any injury to people or property resulting from any ideas, methods, instructions or products referred to in the content.

