Article

Comparative Analysis of Grapevine Epiphytic Microbiomes among Different Varieties, Tissues, and Developmental Stages in the Same Terroir

by
Murad Awad
1,†,
Georgios Giannopoulos
1,
Photini V. Mylona
2 and
Alexios N. Polidoros
1,*
1
School of Agriculture, Aristotle University of Thessaloniki, 54124 Thessaloniki, Greece
2
Institute of Plant Breeding & Genetic Resources, HAO-DEMETER, 57001 Thermi, Greece
*
Author to whom correspondence should be addressed.
Current address: Biotechnology Research Unit, National Agriculture Research Center (NARC), Ministry of Agriculture, Jenin P226, Palestine.
Appl. Sci. 2023, 13(1), 102; https://doi.org/10.3390/app13010102
Submission received: 28 October 2022 / Revised: 7 December 2022 / Accepted: 16 December 2022 / Published: 21 December 2022

Abstract

:
There is limited knowledge about the relationships of epiphytic microbiomes associated with the phyllosphere of different Vitis vinifera cultivars in the same vineyard and terroir. To address this research gap, we investigated the microbiome compositionof 36 grapevine genotypes grown in the same vineyard in different plant sections during the growing season. Using high-throughput NGS-based metagenomic analysis targeting the ITS2 and the V4 regions of the 16S ribosomal gene of fungal and bacterial communities, respectively, weassessed the impact of grapevine genotypes on microbial assemblages in various parts of the phyllosphere. The results indicated that different phyllosphere tissues display high microbial diversity regardless of the cultivars’ identity and use. The selected three phyllosphere parts representing three distinct phenological stages, namely bark and bud, berry set, and fruit harvest, had almost a similar number of fungal OTUs, while a difference was recorded for the bacterial species. The fruit harvest stage hosted the highest number of bacterial OTUs, whereas the bark and bud stage contained the lower. Bacterial dominant phyla were Proteobacteria, Bacteroidetes, Actinobacteria, and Firmicutes, and the genera were Gluconacetobacter, Erwinia, Gluconobacter, Zymobacter, Buchnera, Pseudomonas, Pantoea, Hymenobacter, Pedobacter, Frigoribacterium, Sphingomonas, and Massilia. For fungi, the dominant phyla were Ascomycota and Basidiomycota, and the genera were Aureobasidium, Cladosporium, Alternaria, Aspergillus, Davidiella, Phoma, Epicoccum, Rhodosporidium, Glomerella, Botryosphaeria, Metschnikowia, Issatchenkia, and Lewia. Both the genotype of the cultivar and the phenological stage appeared to considerably impact the shape of microbial diversity and structure within the same terroir. Taken together, these results indicate that microbiome analysis could be proved to be an important molecular fingerprint of cultivars and provide an efficient management tool for the traceability of wine and grape end products. Moreover, the unique identity of cultivars’ microbial signatures highlights the need for further development of precision management to support viticulture sustainability in the face of climate change.

1. Introduction

The grapevine (Vitis vinifera) is a major fruit crop of high economic importance related to a range of valuable products, including table fruits and wines, worldwide. In Europe alone, wine production exceeds an annual revenue of more than 30 billion € [1]. Grape yield and quality traits, including color, flavor, and aroma, are differentially controlled by biotic and abiotic factors throughout the grapevine developmental and processing stages [2,3,4,5,6,7,8,9,10,11,12,13,14]. Vitis microbiome is a dynamic biotic factor, receiving great attention due to is inherent link with grapevine productivity, plant health, and product quality traits [10,13]. The dynamic nature of the Vitis microbiome has been largely ignored, and our current knowledge is limited to selected microbes, i.e.,pathogens [15] or single-point studies of metagenomes prior to fermentation [16,17]. However, our understanding of how grapevine cultivars and genotypes impact the Vitis associated microbiome in various tissues throughout the cultivation period remains scant [5,17,18,19,20,21,22,23,24,25].
The most widely studied Vitis-associated microbes are known pathogens and fermentative yeasts. Those include bacteria and fungi such as Agrobacterium spp. [26], Xylella fastidiosa [27], Xylophilus ampelinus [21], Botrytis cinerea [28], Erysiphe necator [29], and Plasmopara viticola [30], causing crown gall, Pierce’s disease, blight, gray mold, powdery mildew, and downy mildew, respectively. Among fermentative yeasts (either Saccharomyces or non-Saccharomyces species), S. cerevisiae predominates in must fermentation [31,32,33]. Based on the knowledge derived from such studies, technologies have been developed for controlling Vitis pathogens with biological antagonists, improving soil fertility with rhizobial inocula, and improving the wine fermentation process and quality traits with biological commercial products. Nevertheless, Vitis-associated microbes reflect direct and indirect relationships with their host and environment [5,6,10,13,17,23,34,35,36,37,38,39,40]. In a fundamental study, Bokulich et al., 2014 [4] reported that Vitis microbiomes present strong biogeographic regionalization, indicating that local environment shapes distinct microbial consortia, comprising Vitis microbial terroir. Further in-depth analysis implied that the host cultivar might also have an additional controlling effect on Vitis microbial communities across different environments. Thus, apart from the environment, the effect of Vitis genotype on the composition of the hosted microbiome needs to be thoroughly investigated. Additionally, the nature of genotype interaction with tissue and developmental stage on microbiome composition is largely unknown.
A recent metagenomic study revealed that the host genotype may influence Vitis associated bacteria in the same farming system and vineyard [17]. This exciting new evidence leads to three key questions:(a) Does the host genotype influence the structure of associated fungal communities as well? (b) Does developmental stage and tissue type affect the composition of microbial communities? Lastly,(c) is there a common core microbiome linked to all Vitis cultivars? Considering the recent view of individual plants as holobionts, where hosted microorganisms are involved in major plant functions such as nutrition and resistance to biotic and abiotic stresses [41], the composition and organization of the microbial community could be a major determinant when selecting a grapevine cultivar. However, the detailed microbial colonization process of grapevine is still poorly understood [42].
Thus, the aim of this study was to comprehensively characterize the role of Vitis cultivar genotype on the structure of the associated microbiome, targeting different epiphytic sections and developmental stages. We sampled microbial communities associated with 36 domestic and international grapevine varieties to provide insights into microbial community size and structure in the semi-conventional vineyard throughout the growing season. Using a high-throughput metagenome analysis for bacterial and fungal fingerprints, the microbiome communities were assessed, for the first time to our knowledge, in such a large collection of grapevine cultivars under the same environment and farming system.

2. Materials and Methods

2.1. Vineyard, Vine Cultivars and Sampling

Plant material was collected from the Vine Cultivar Collection (VCC), School of Agriculture, Aristotle University of Thessaloniki (AUTh). The vineyard is located at the University Farm (N40.53829, E22.99633). The soil is calcareous sandy loam, and the cultivation follows a semi-conventional low-input system. More specifically, synthetic fertilizers are applied after soil fertility evaluation as needed, and plant protective fungicides, sulfurand Bordeaux mix, are applied three times per year. Fungicide (Switch; Syngenta, Greece) is applied against Botrytis once per year.
The VCC collection hosts more than 150 grapevine varieties of Greek origin along with several of the most important international varieties, including Cabernet Sauvignon, Sauvignon Blanc, Merlot, Syrah, and Riesling, among others. Tissue samples were collected from 36 varieties (names of the varieties are indicated in Tables S1 and S2) and consisted of bark and buds in early spring (March 2019), immature berries at the phenological stages of berry set in the spring season (May–June 2019), and mature berries at harvest (August–September 2019).
Bark and bud tissue samples (10 g) were collected aseptically from a single cane per vine and 5 independent vines (trees) from each cultivar, pooled together, equally mixed, and stored at −80 °C for further analyses [17]. For berry sampling, undamaged berries, including their pedicels at the phenological stages of berry set (Stage I, 20 g per sample) and harvest (Stage II, 60 g per sample), were taken from 5 plants from each cultivar. The samples from each phenological stage were placed in 0.5 L sterilized bottles, filledup with TENP buffer (30 mL and 100 mL, respectively), and shaken using a horizontal shaker for 1h at 100 RPM. The supernatants were centrifuged, and subsequently, pellets were collected and stored at −80 °C for DNA extraction.

2.2. DNA Extraction

DNA extraction was performed using the NucleoSpin Plant II kit (Macherey-Nagel GmbH, Dylan, Germany) following the instructions. DNA samples were quantified with the NanoDrop 1000 spectrophotometer (Thermo Fisher Scientific, Inc., Walsham, MA, USA) and visualized in 1.0% agarose gel electrophoresis. Samples were kept at −20 °C until further analysis.

2.3. High-Throughput Sequencing and Statistical Analysis

To decipher bacterial community diversity, the V4 region of the 16S rDNA gene was amplified using primers 515F (5′-GTGCCAGCMGCCGCGGTAA-3′) and 806R (5′-GGACTACHVGGGTWTCTAAT-3′). For fungal communities, ITS9 (5′-GAACGCAGCGAAATGCGA-3′) and ITS4 (5′-TCCTCCGCTTATTGATATGC-3′) primers were used that target the ITS2 region [23]. Amplifications were performed at a final volume of 50 μL for 35 cycles at annealing temperatures of 52 °C for V4 and 60 °C for ITS2, using the Invitrogen™ Platinum™ II Hot-Start PCR Master Mix (2X) kit (#14000-013, Thermo Fisher Scientific, Inc., USA). Subsequently, 20 μL of each sample’s ITS2 and V4 amplicons (40 μL total) were pooled together. Amplicons were purified and tagged, then quantified and library prepped according to the manufacturer’s instructions (#A26216, #4471250, #4474009, #4474518 Thermo Fisher Scientific, Inc., USA). Subsequently, the metagenomic library was sequenced the Sequencing Facility of the Laboratory of Plant Genetics and Breeding at Aristotle University of Thessaloniki, using the Gene Studio S5 platform (Thermo Fisher Scientific, Inc., USA). After checking quality parameters and performing necessary modifications (QC-, adaptor-, and barcode trimmed) through the Ion Torrent Suite, raw sequences were uploaded on the MG-RAST server [43] under the project number mgp97325. Processing of submitted samples included MG-RAST QC dynamic error removal (DRISEE), dynamic trimming (DYNAMICTRIM), denoising, and normalization (FASTQ-MCF). Taxonomy was assigned at 97% identity (e value 10−5) using Silva rRNA databases: SSU for bacteria and LSU for fungi. The resulting taxonomy matrix (OTUs Table [18] was used for all subsequent analysis. The PAST3 software [44] was used to calculate diversity indices (α-diversity, rarefaction curves) and statistics (PCoA, Bray–Curtis and UPGMA clustering, PERMANOVA, and ANOSIM). Venn diagrams were carried out according to Heberle et al. [45].

3. Results

3.1. Diversity Assessment among Phenological Stages

A total of 4,032,594 high-quality sequences (Table 1A,B) were generated from all studied samples (n = 108). About 1,988,518 sequences were bacterial, with an average of 18,412 sequences per sample, whereas the rest (2,044,076) were fungal sequences, with an average of 18,926 sequences per sample. Moreover, α-diversity indices such as Chao1, Shannon, etc. were calculated as shown in Table 1A,B. The Chao1 scores ranged for bacteria from 192.2 (for bark and bud) to 339.3 (for fruit harvest stage), and for fungi from 172.2 (for bark and bud) to 214.3 (for berry set), whereas the Shannon scores ranged for bacteria from 1.76 (for berry set) to 2.35 (for harvest) and for fungi from 1.53 (for bark and bud) to 1.62 (for berry set). Good’s coverage of fungi and bacteria reached 99.5% and 98.8% (Table 1A,B), respectively, indicating that most of the microbial diversity was captured through sequencing [18].
Sequences were grouped into 789 OTUs for fungi and 1961 OTUs for bacteria (both at the 97% similarity level) (Table 1A,B). After removing singletons, the OTUs’ numbers were 603 for fungi and 1296 for bacteria (Figure 1A,B). The different bacterial OTUs were assigned to 22 phyla, 35 classes, 70 orders, 162 families, and 418 genera. In the case of fungi, the OTUs corresponded to 4 phyla, 17 classes, 53 orders, 124 families, and 267 genera.

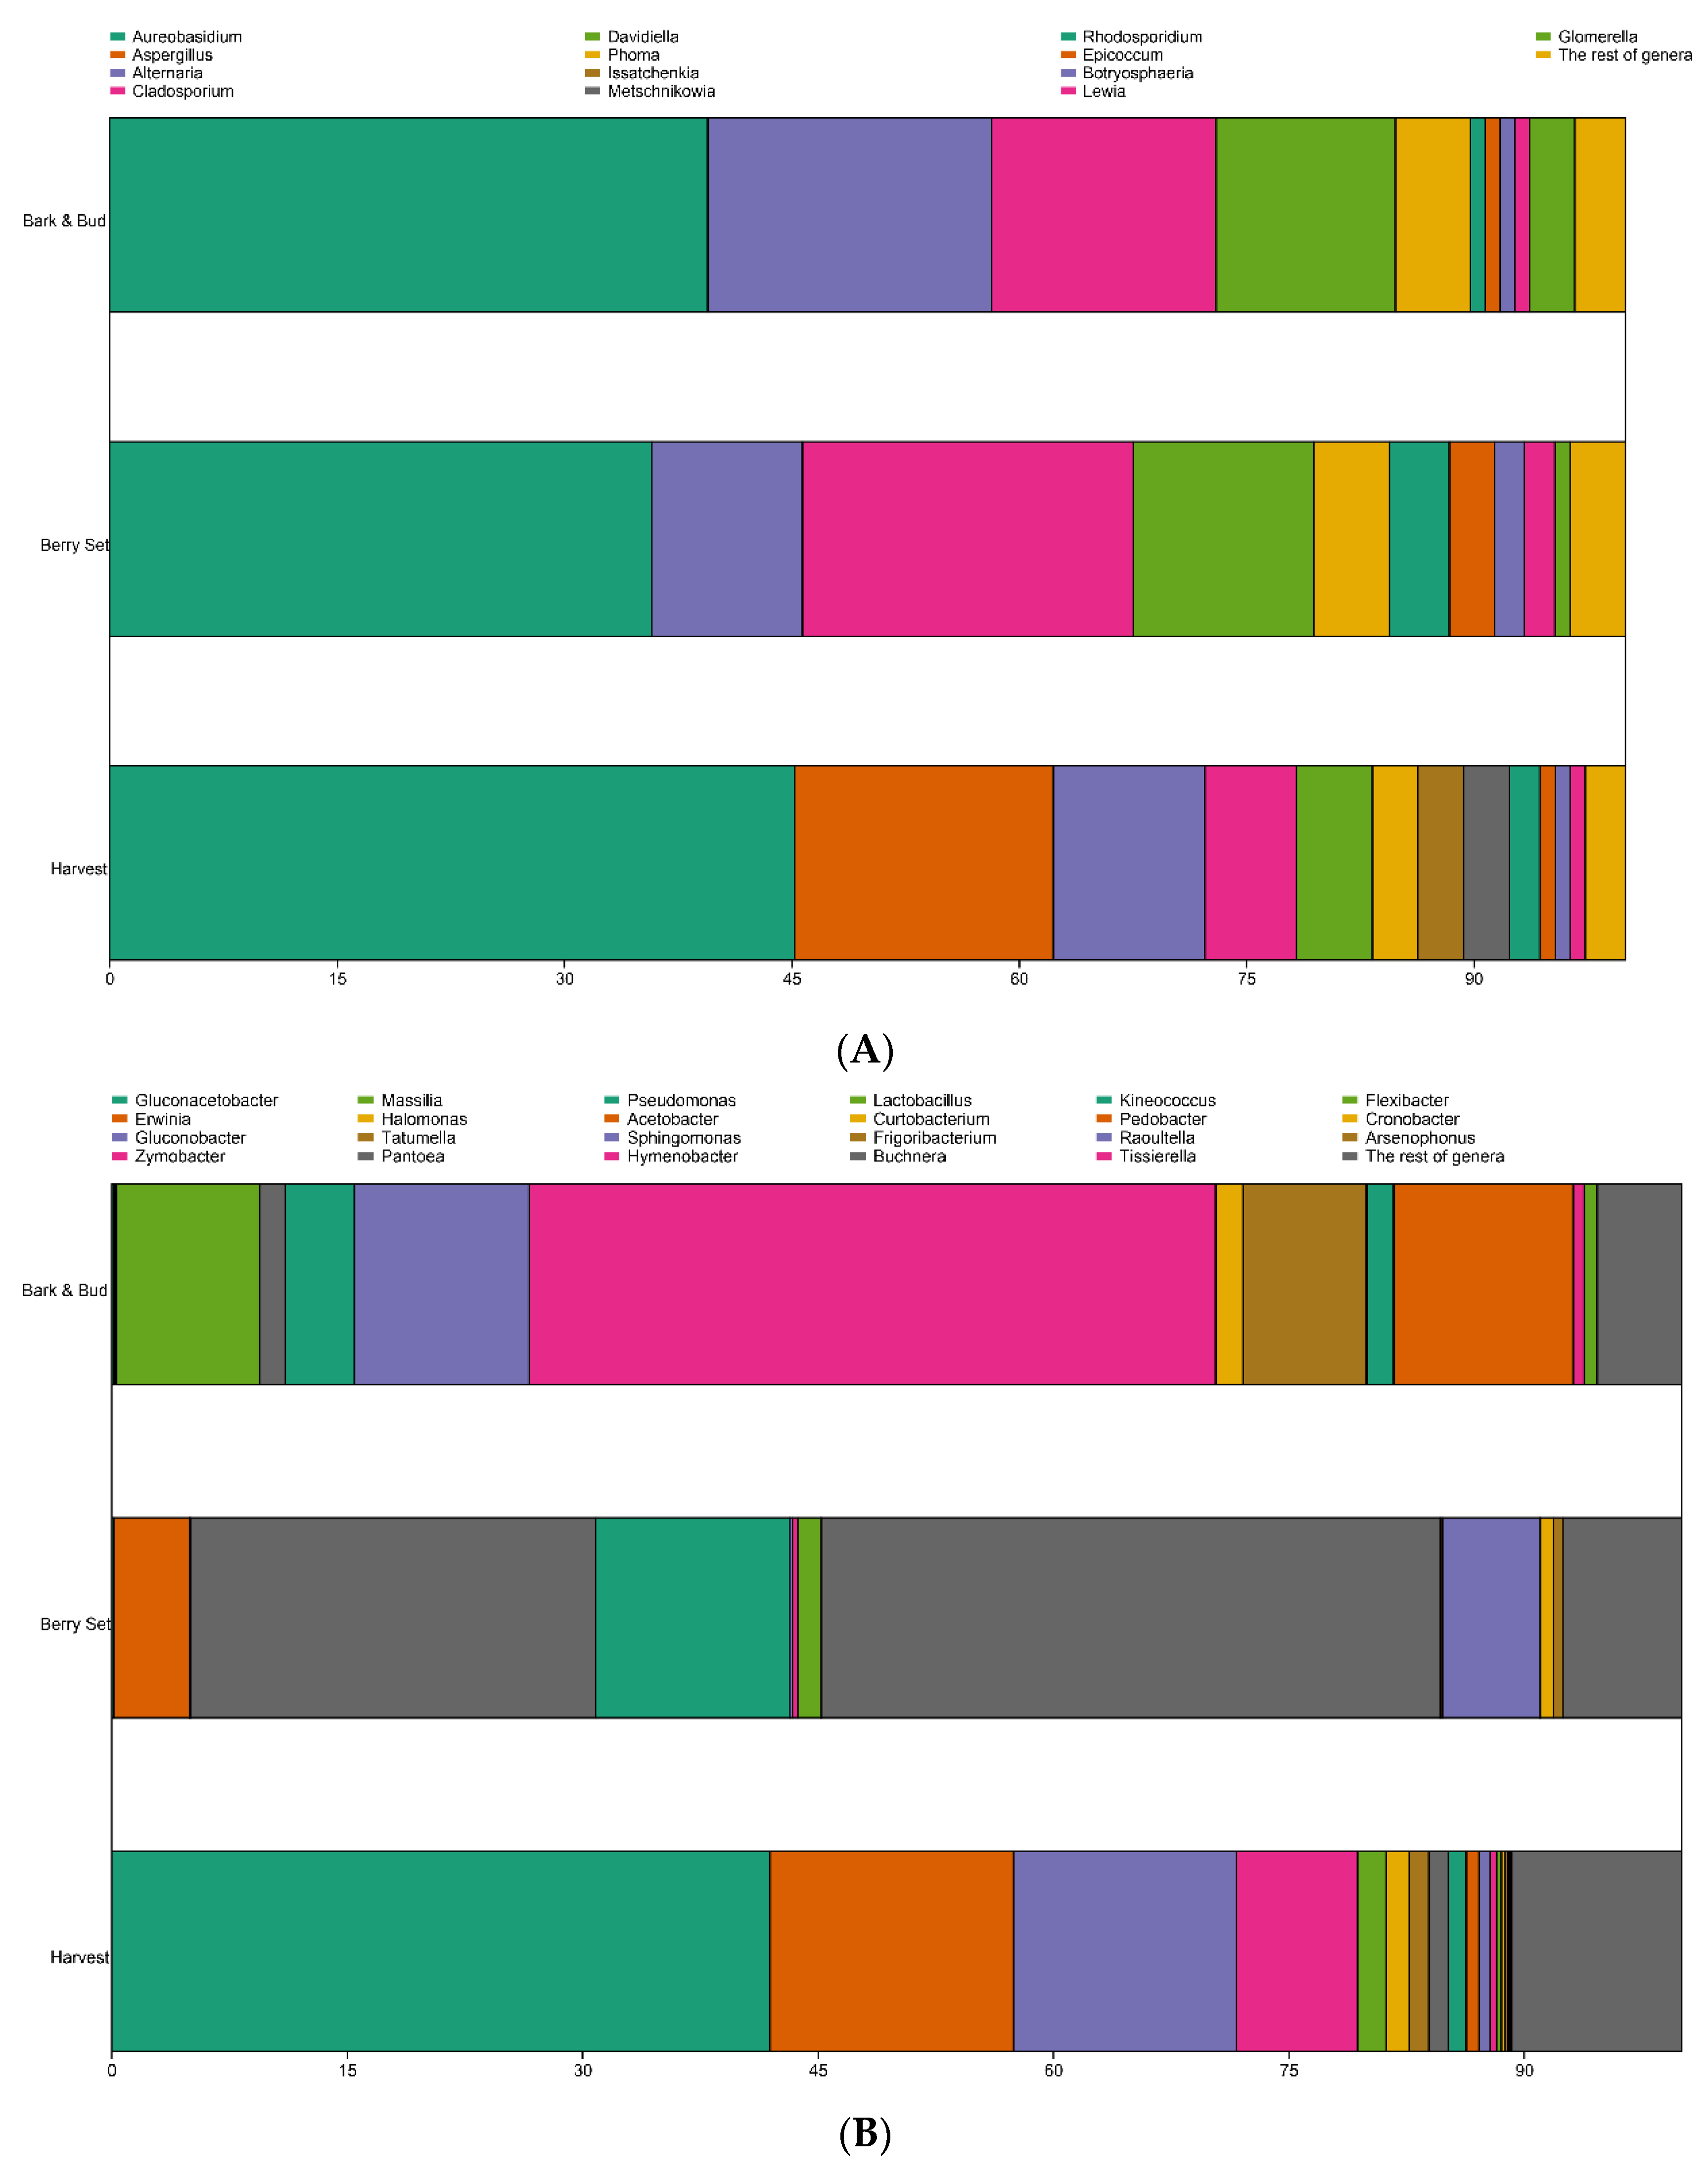
3.2. Microbiome Varies According to Grapevine Phenological Stage

In the three phenological stages (bark and bud, berry set, and fruit harvest), fungal OTUs were 442, 433, and 448, respectively(Figure 1A).The bacterial OTUs were 371,713, and 975(Figure 1B), for thebark and bud, berry set, and harvesting phenological stage, respectively.Out of all fungal OTUs identified in the present study, 48% were detected in more than one phenological stage, almost half (311, 52%) of which represented a core across all sample types (Figure 1A). However, many fungal OTUs were unique. A percentage of 11.3%, 11.1%, and 10% (Figure 1A) of the detected OTUs were exclusively observed in berry set, harvest, and bark and bud samples, respectively. The three phenological stages have an almost similar number of fungal OTUs. A percentage of 84% bacterial OTUs were uncovered in more than one grapevine phenological stage, a subset of which (212; 16%) OTUs were shared across all sample types (Figure 1A). A greater number of OTUs (975) were found at the fruit harvest stage, whereasbark and bud samples contained the least OTUs (371). About 48% and 27% of the OTUs detected at the harvest stage were shared with berry set andbark and bud stage, respectively. However, several OTUs were unique; for example, 35.3% of the detected OTUs were exclusively observed in harvest samples (Figure 1B).
Regardless of the phenological stage, Ascomycota was the most abundant fungal phylum, comprising 96.6% of all sequences, followed by Basidiomycota (3.4%), Chytridiomycota (4%), and Glomeromycota (0.02%). The major fungal genera were Aureobasidium, Cladosporium, Alternaria, Aspergillus, Davidiella, Phoma, Epicoccum, Rhodosporidium, Glomerella, Botryosphaeria, Metschnikowia, Issatchenkia, and Lewia, with relative abundance greater than 1.0% across all samples (Table 2A and Figure 2A). Some taxa associated with harvest samples, such as Issatchenkia and Metschnikowia, were almost absent (<0.001% relative abundance) in berry set and bark and bud samples. Aspergillus, having the second-highest relative abundance (17.4%) in harvest samples, showed significantly lower abundances (ANOVA, F = 4.325, p < 0.010) in berry set and bark and bud samples (Table 2A and Figure 2A). Others, such as Cladosporium and Alternaria, had more presence at berry set and bark and bud, respectively.
Compared with fungi, bacteria were more diverse. Proteobacteria was the most abundant bacterial phylum comprising 77.7% of all sequences, followed by Bacteroidetes 15.2%, Actinobacteria 4.8%, Firmicutes 1.9%, and the rest (Chloroflexi, Gemmatimonadetes, Deinococcus-Thermus, Cyanobacteria, Planctomycetes, Verrucomicrobia, Chlamydiae, Acidobacteria, Fusobacteria, Tenericutes, Fibrobacteres, Nitrospirae, Spirochaetes, Synergistetes, Aquificae, Chlorobi, Lentisphaerae, and Thermotogae) comprising <0.3% of all sequences. At the level of the phenological stage, Proteobacteria were more prevalent in berry set and harvest samples, while Bacteroidetes wereprominent in bark and bud samples. The major bacterial genera detected among the three phenological stages were Hymenobacter, Gluconacetobacter, Buchnera, Pantoea, Erwinia, etc., with a relative abundance of more than 3.0% across all samples (Figure 2B and Table 2B). Of these taxa, Gluconacetobacter, Gluconobacter, and Zymobacter were highly associated with harvest samples (ANOVA, F = 14.325, p < 0.001) compared to berry set and bark and bud samples (Figure 2B and Table 2B). Whereas Buchnera, Pantoea, Pseudomonas, and Raoultella; Hymenobacter, Pedobacter, Massilia, and Frigoribacterium were more associated with berry set and bark and bud samples (ANOVA, F = 7.09, p < 0.014; 4.22, p < 0.050) (Figure 2B and Table 2B), respectively.

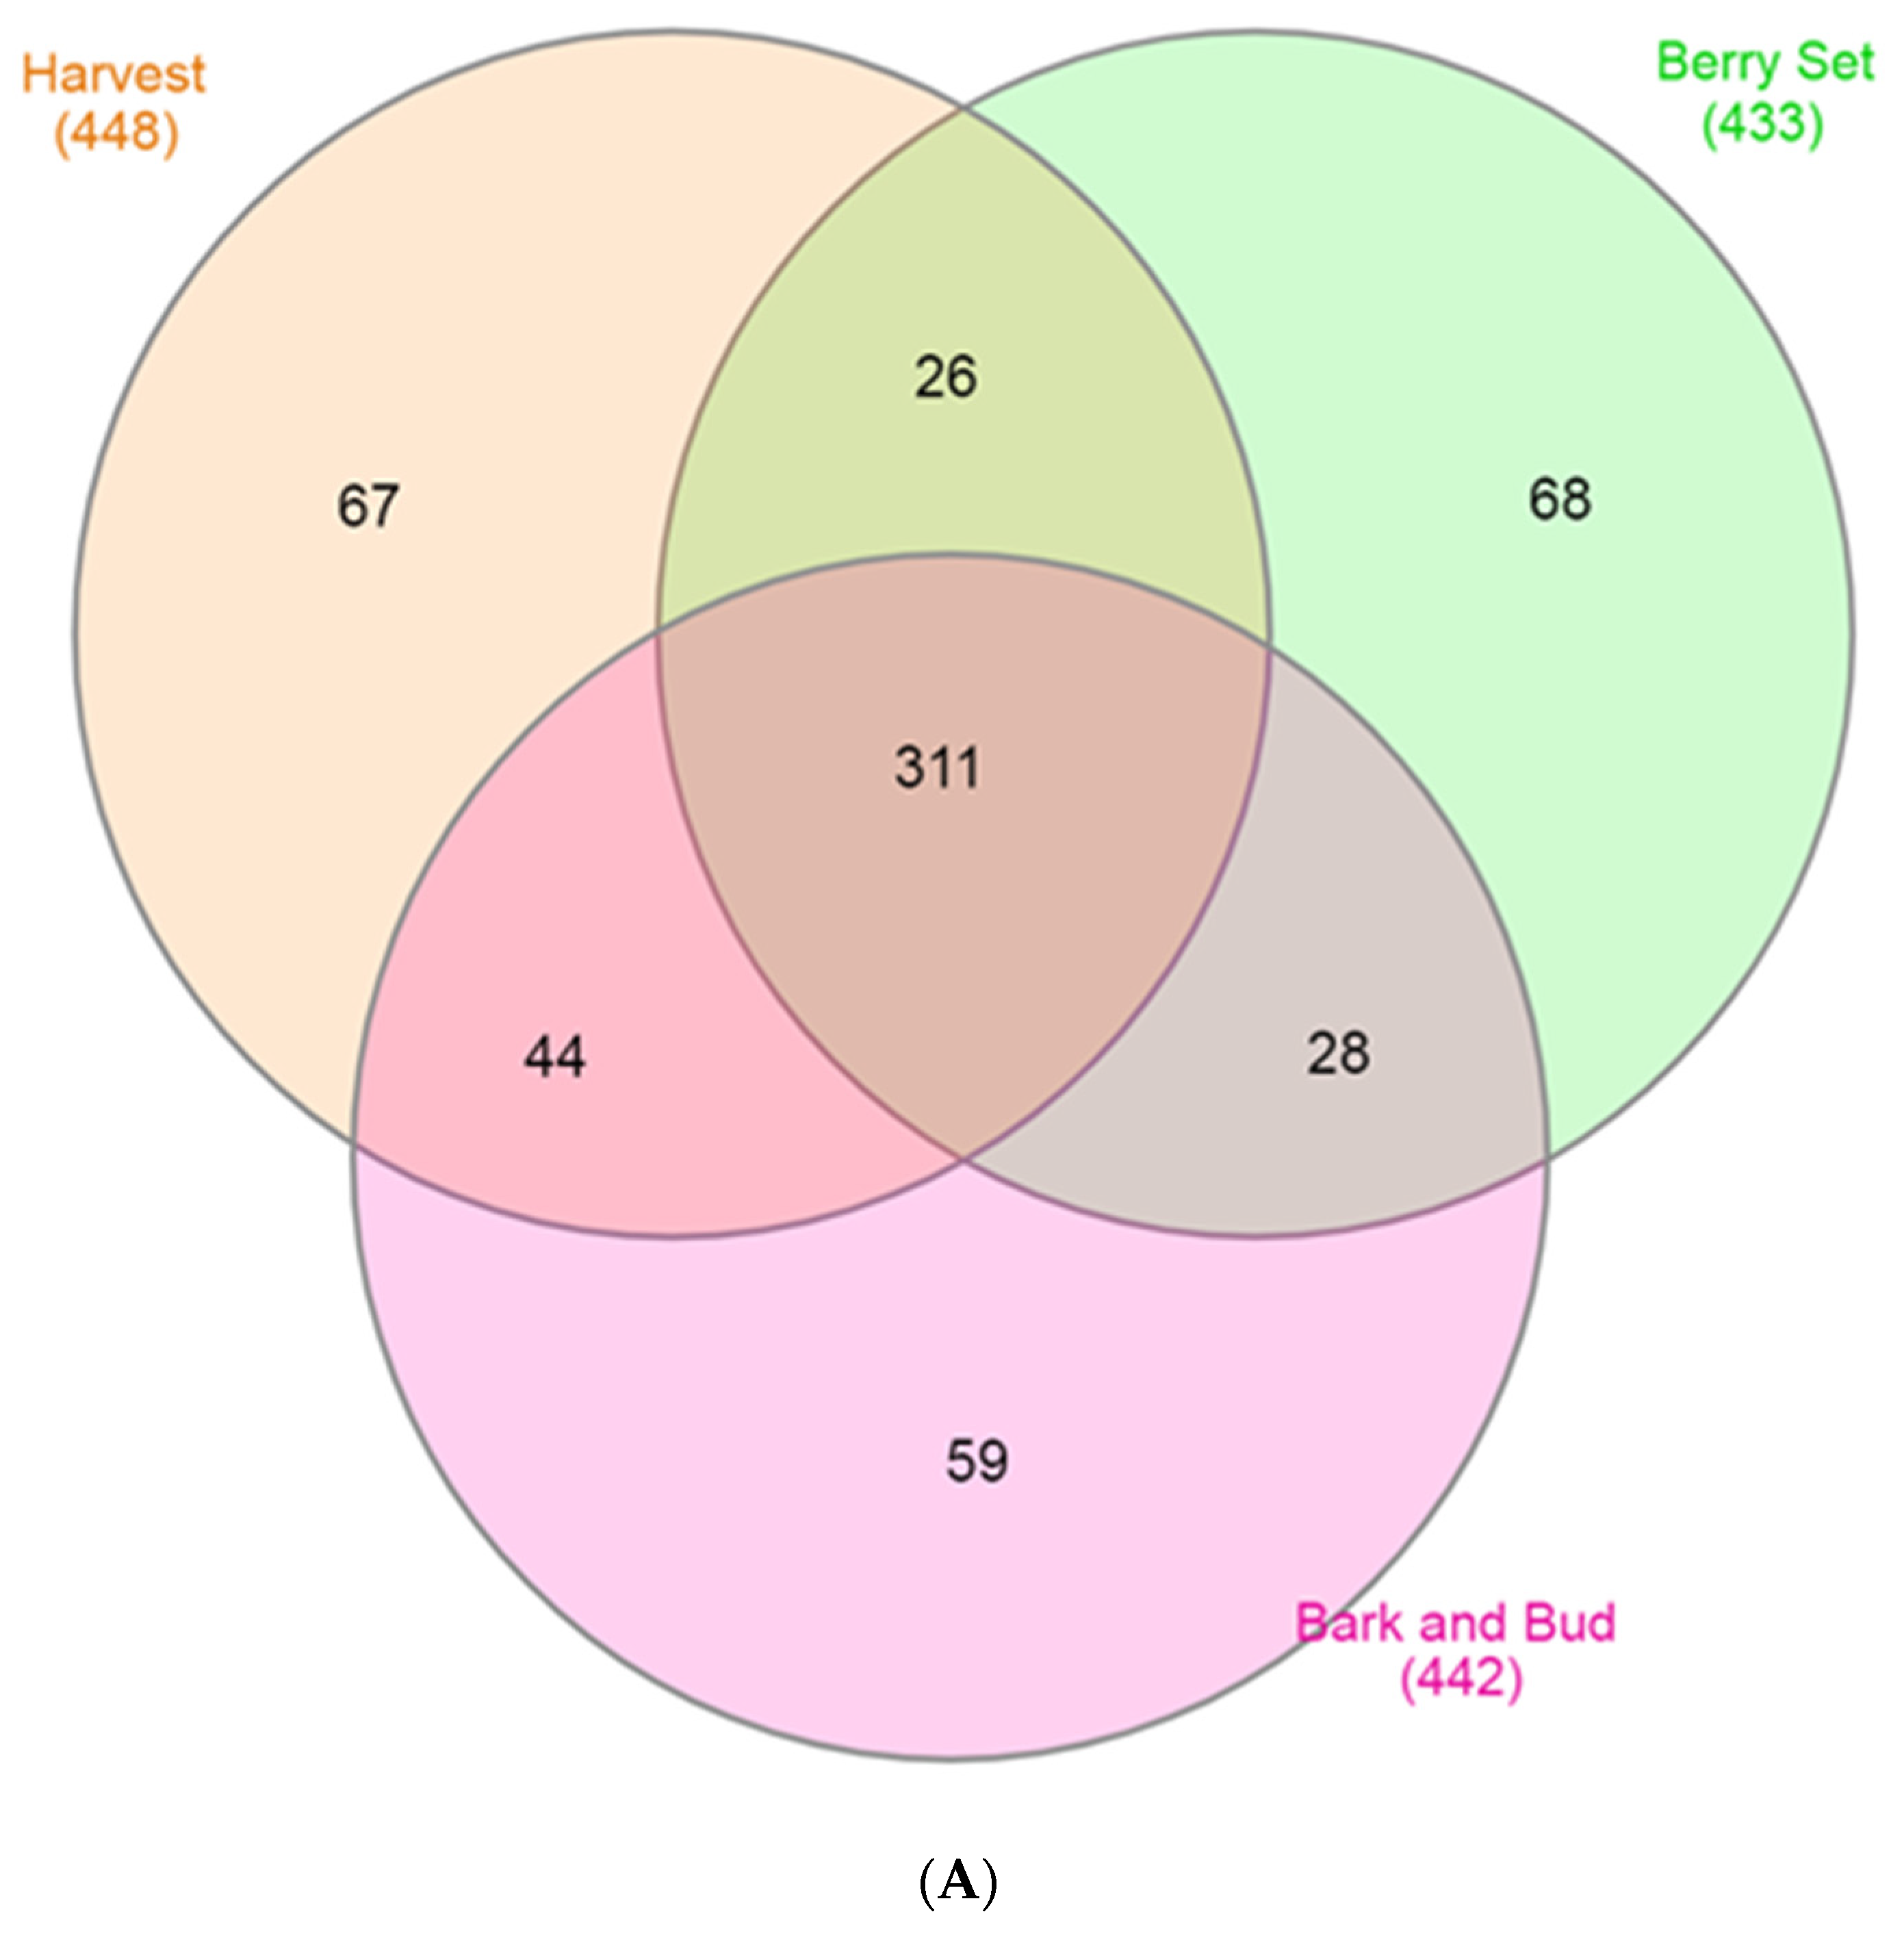
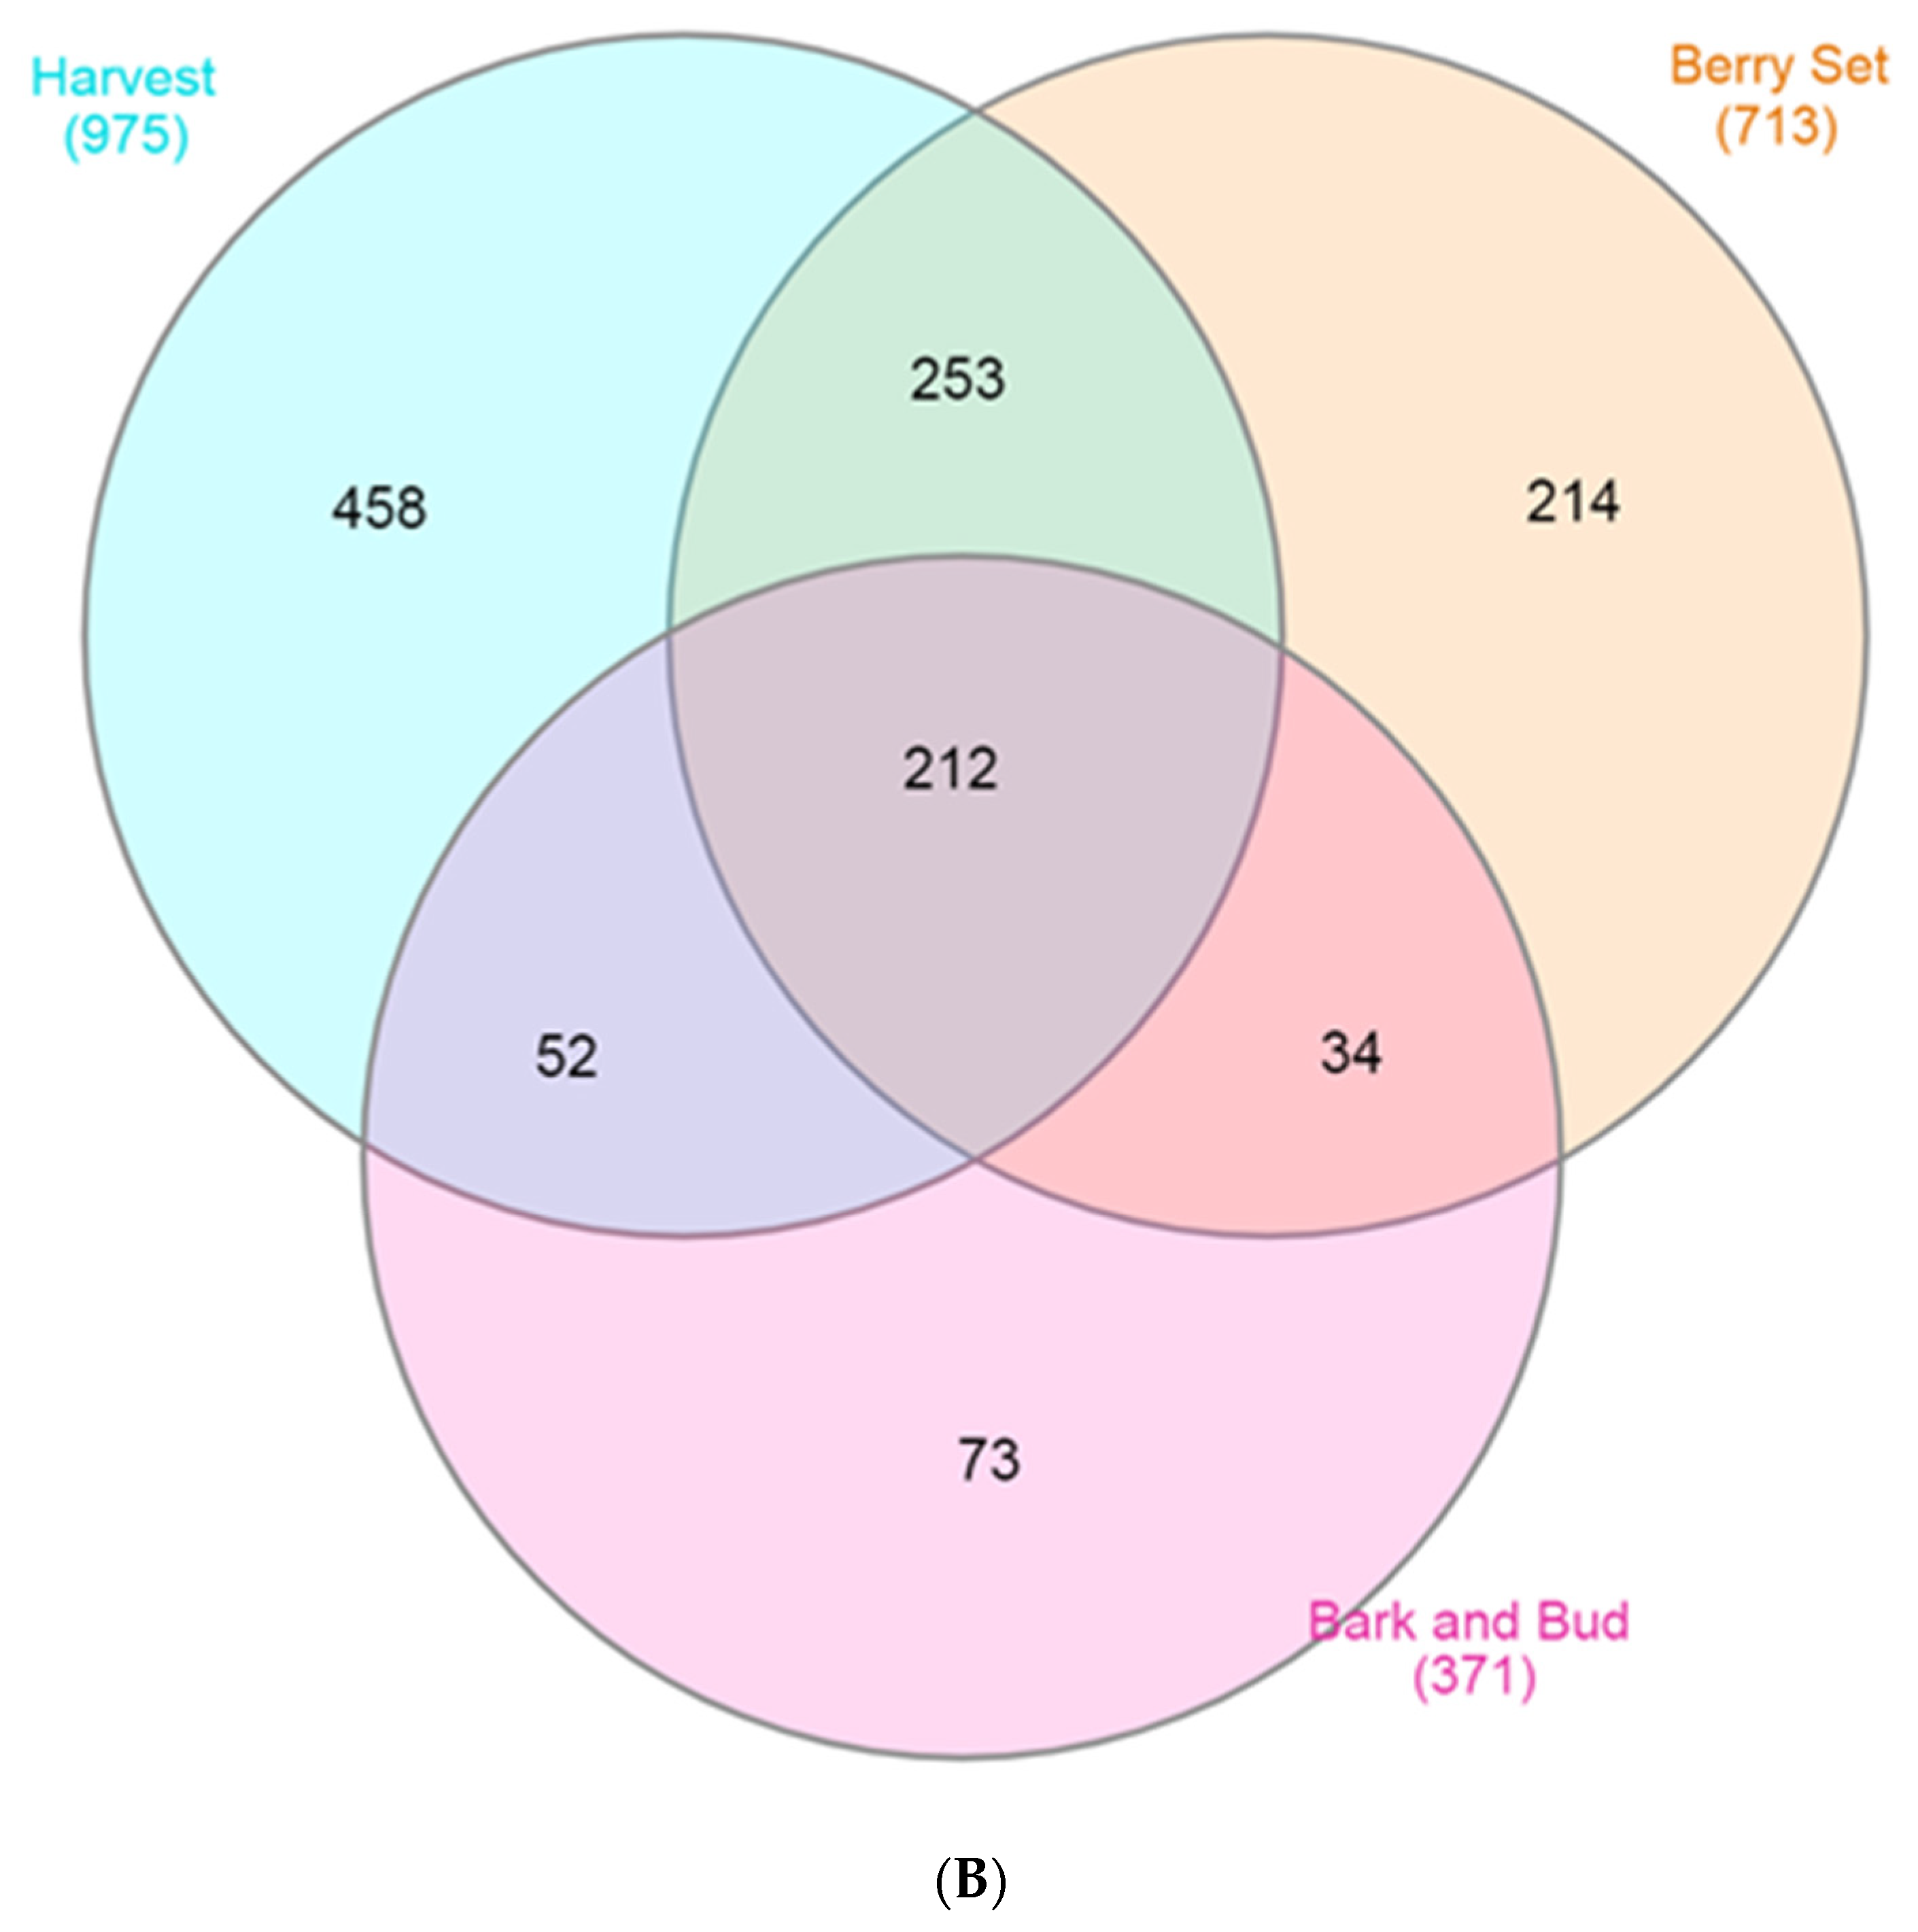
3.3. Core and Unique Microbiome Vary among the Cultivars in each Phenological Stage

Based on Venn diagram analyses [18], the core bacterial genera among the 36 cultivars assessed were as follows: at harvest 4 (Gluconacetobacter, Erwinia, Gluconobacter, and Zymobacter), at berry set 3 (Buchnera, Pseudomonas, and Pantoea), and at bark and bud 5 (Hymenobacter, Pedobacter, Frigoribacterium, Sphingomonas, and Massilia). The number of unique bacterial genera uncovered in each cultivar at each phenological stage is presented in detail in Table S1.
The core fungal genera among the 36 cultivars were the following: at harvest 8 (Aureobasidium, Botryosphaeria, Aspergillus, Cladosporium, Rhodosporidium, Phoma, Alternaria, and Davidiella), at berry set 13 (Cladosporium, Aureobasidium, Alternaria, Lewia, Rhodosporidium, Pleurotus, Sporobolomyces, Davidiella, Pyrenophora, Epicoccum, Phoma, Phaeosphaeria, and Neonectria), and at bark and bud samples 13 (Davidiella, Alternaria, Pyrenophora, Phoma, Lewia, Rhodosporidium, Epicoccum, Botryosphaeria, Cladosporium, Aureobasidium, Sporobolomyces, Phaeosphaeria, and Neonectria). The number of unique fungal genera uncovered in each cultivar at each phenological stage is presented in detail in Table S2.

3.4. Temporal Dynamics of Grapevine Microbial Communities through Phenological Stages

Grapevine-associated microbiome analysis in the three phenological stages revealed a very clear differentiation of bacteria community richness and diversity (α-diversity, Shannon index; ANOVA, F = 4.576, p = 0.01243) and taxonomic dissimilarity (β-diversity, Bray–Curtis distance; PERMANOVA, F = 24.95, p = 0.0001, and ANOSIM, R = 0.6432, p = 0.0001) (Table 3). Regarding fungi, no significant differences were detected in community richness and diversity (α-diversity, Shannon index; ANOVA, F = 1.250, p = 0.29030), but such differences were significant in taxonomic dissimilarity (β-diversity, Bray–Curtis distance; PERMANOVA, F = 12.1, p = 0.0001, ANOSIM, R = 0.2100, and p = 0.0001) (Table 3). Principal coordinate analysis (PCoA) showed the phenological stage-specific patterns (95% confidence interval) of bacterial and fungal communities, with 33.78% and 40.95% of total variance explained by the first two principal coordinate (PC) axes, respectively (Figure 3A,B).
These results indicated that each phenological stage has a unique microbial signature and that there is a significant difference in taxonomic compositions among the phenological stages. Based on Venn diagram analyses (Figure 4A,B), the abundance of phenological stage-specific genera ranged from 12 (for bark and bud) to 139 (for harvest) and from 22 (for bark and bud) to 56 (for berry set) for bacteria and fungi, respectively.

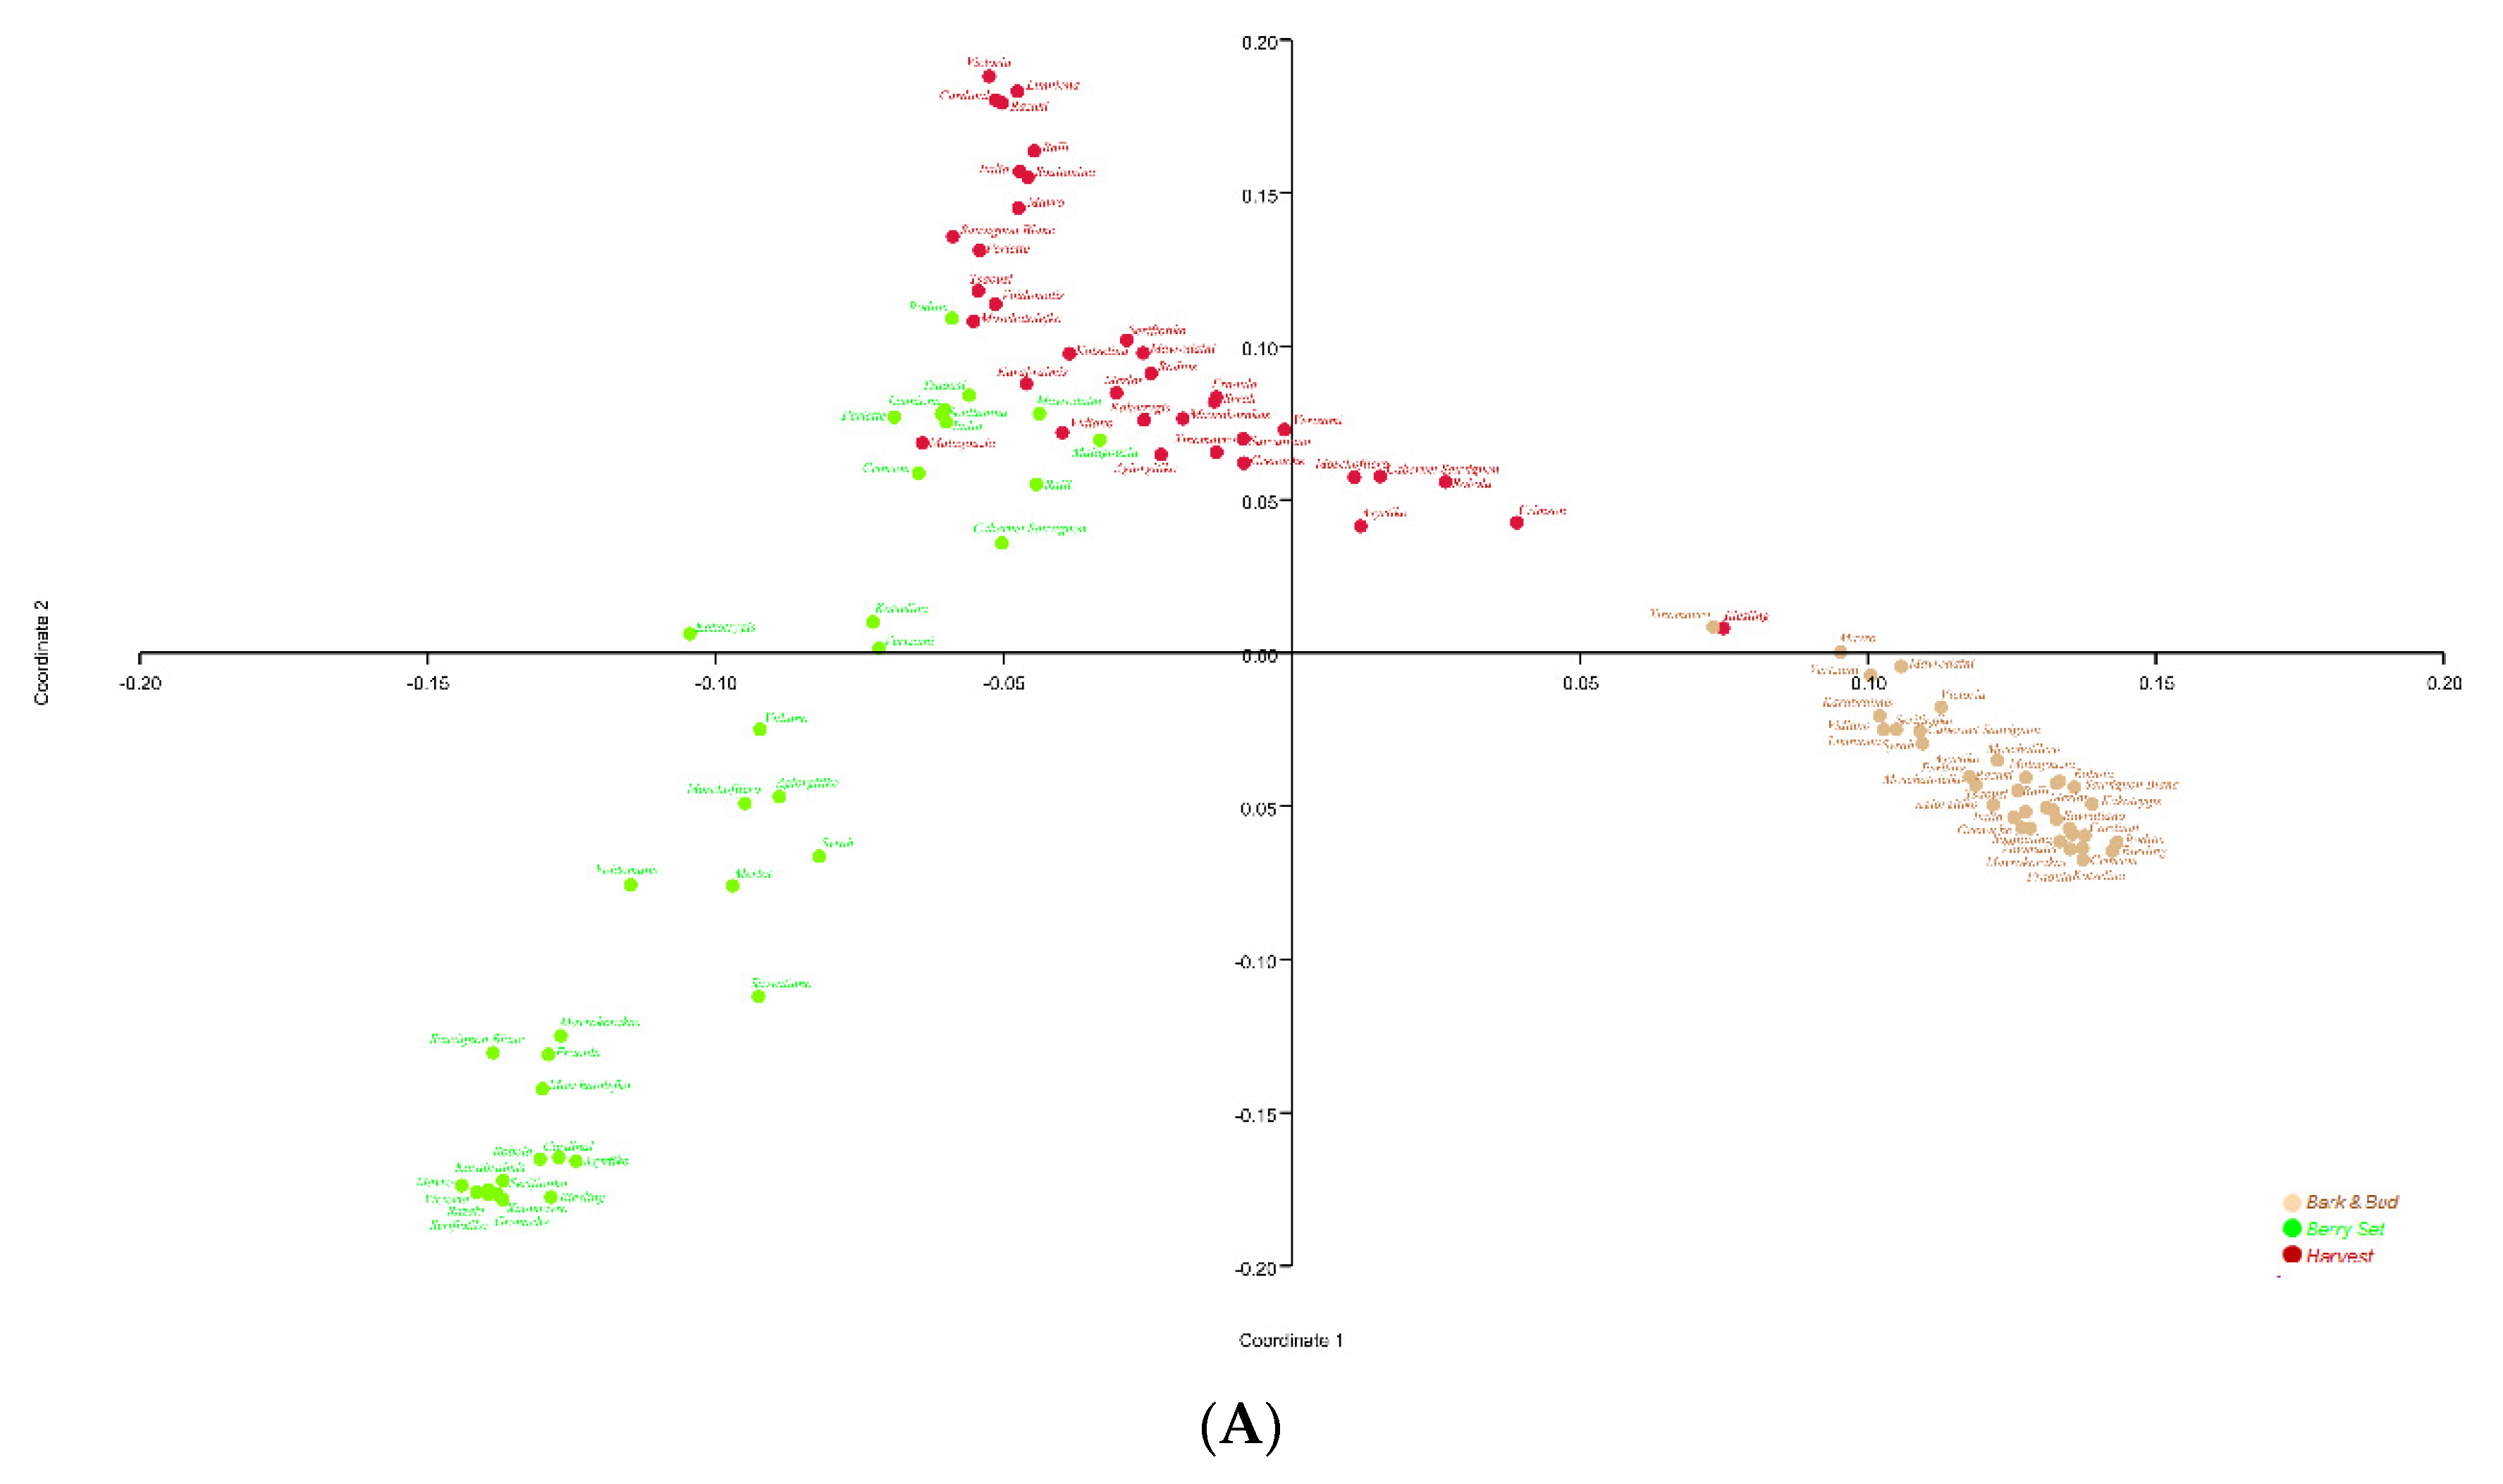
3.5. Grapevine Genotypes ShapeMicrobial Communities under the Phenological Stage Influence

Principal coordinate analyses on microbial abundance revealed that grapevine genotypessignificantly affect the shaping of their microbiome regardless ofphenological stage (Figures S1–S6). It is noteworthy that these genotypes clustered differently from one phenological stage to another.
At the bark and bud stage, for instance, where the first two PCoA axes (1 and 2) explain 48.7% of the total variation (Figure S1), the cultivars were significantly clustered into six groups based on their bacterial community structure, as confirmed by PERMANOVA (p = 0.0001 and F = 12.5) and ANOSIM (p = 0.0001 and R = 0.66) statistical analyses (Table 3). However, at the berry set stage, where the first two PCoA axes (1 and 2) explain a similar 53.1% of the total variation (Figure S2), the cultivars were clustered into five different groups instead of six, as also confirmed by PERMANOVA (p = 0.0001 and F = 13.1) and ANOSIM (p = 0.0001 and R = 0.76) statistical analyses (Table 3).
Permutational analysis of variance (PERMANOVA) and ANOSIM statistics (Table 3), according to grapevine genotypes and phenological stages, confirmed the hypothesis that these factors might be responsible for shaping the microbial community of the analyzed samples.

3.6. Microbial Diversity among Cultivars at the different Phenological Stages

Microbial diversity indices varied among cultivars at each phenological stage, as shown in the Supplementary Tables S1 and S2. Bacterial richness (Chao1) scores ranged among the cultivars from 88 (for Soultanina) to 899 (for Vertzami), from 62 (for Vidiano) to 494 (for Mavrokorakas), and from 98 (for Riesling) to 372 (for Limniona) in the harvest, berry set, and bark and bud, respectively (Table S1). Shannon diversity ranged from 0.57 (for Soultanina) to 4.98 (for Mavrokorakas), from 0.34 (for Italia) to 3.69 (for Limniona), and from 0.70 (for Agiorgitiko) to 2.79 (for Karabraimis) in the harvest, berry set, and bark and bud, respectively (Table S1). Simpson’s evenness index ranged from 0.184 (for Merlot) to 0.986 (for Mavrokorakas), from 0.132 (for Italia) to 0.927 (for Limniona), and from 0.231 (for Agiorgitiko) to 0.884 (for Karabraimis) in the harvest, berry set, and bark and bud, respectively (Table S1). Regarding OTUs both including and excluding singletons, the highest values were obtained by Vertzami (488, 275), Agiorgitiko (244, 121), and Limniona (153, 77) in the harvest, berry set, and bark and bud, respectively (Table S1), whereas the lowest values were shown by Moschatolefko (39, 9), Vidiano (31, 13), and Syrah (47, 17) in the harvest, berry set, and bark and bud, respectively (Table S1). For Good’s coverage, Soultanina (0.999), Italia (0.997), and Xinomavro (0.997) obtained the highest values, but Agiorgitiko (0.926), Syrah (0.905), and Mavrokorakas (0.977) had the lowest ones in the harvest, berry set, and bark and bud, respectively (Table S1). The number of genera and percentage of the most dominant genera of each cultivar are also indicated in the same table (Table S1).
As for fungi, Chao1 scores ranged from 89 (Asyrtiko) to 311 (Fraoula), from 132 (Razaki) to 351 (Roditis), and from 100 (Syrah) to 240 (Grenache) in the harvest, berry set, and bark and bud, respectively (Table S2). Shannon diversity ranged from 1.17 (Mavrodafni) to 2.18 (Soultanina), from 1.17 (Savvatiano) to 1.95 (Fraoula), and from 1.01 (Moschatolefko) to 1.99 (Mavrokorakas) in the harvest, berry set, and bark and bud, respectively (Table S2). Simpson’s evenness index ranged from 0.493 (Tsaousi) to 0.854 (Soultanina), from 0.526 (Savvatiano) to 0.792 (Fraoula), and from 0.466 (Moschatolefko) to 0.799 (Mavrokorakas) in the harvest, berry set, and bark and bud, respectively (Table S2). Regarding OTUs both including and excluding singletons, the highest values were obtained by Cabernet Sauvignon (152, 85), Mavrokorakas (167, 114), and Limniona (120, 73) in the harvest, berry set, and bark and bud, respectively (Table S2), whereas, the lowest values were shown by Italia (57, 34), Victoria (69, 40), and Soultanina (55, 30) in the harvest, berry set, and bark and bud, respectively (Table S2). For Good’s coverage, Kakotrygis (0.998), Vidiano (0.998), and Moschatolefko (0.997) obtained the highest values, but Razaki (0.991), Cardinal (0.983), and Tsaousi (0.988) had the lowest ones in the harvest, berry set, and bark and bud, respectively (Table S2). The number of genera and percentage of the most dominant genera of each cultivar are also indicated in the same table (Table S2).

3.7. Assessment of Vine Microbiome of Economic Importance

Several well-known microbial taxa with economic implications for viticulture and winemaking were uncovered in this study. Some taxa were phenological stage-specific and/or cultivar-specific. Agrobacterium tumefaciens, which is responsible for crown and cane gall disease, was mainly detected in very low abundance at the bark and bud stage in 39% of the studied grapevine cultivars (Voidomatis, Mavrodafni, Karabraimis, Savvatiano, Moschofilero, Asyrtiko, Moschatolefko, Kakotrygis, Ralli, Limniona, Robola, Cabernet Sauvignon, Perlette, and Mavrokorakas). Riesling also hosted A. Vitis as an additional species of Agrobacterium compared to others. Moreover, at the harvest stage, the acetic acid bacteria associated with wine production, Gluconobacter (oxydans and frateurii) and Gluconacetobacter (oboediens, saccharivorans, and hansenii), were detected in a very high abundance in almost all cultivars. Furthermore, Issatchenkia terricola, a non-Saccharomyces yeast associated with winemaking, was also uncovered at the harvest stage in all cultivars but with different relative abundances. For example, Limniona, Victoria, and Soultanina harbored the higher percentages of 43%, 39%, and 19%, respectively (Table S2). In addition, at the berry set stage, Cladosporium cladosporioides responsible for Cladosporiumrot disease of grapevines, was 1.5-fold more abundant than at bark and bud and 3.7-fold more abundant than at harvest stage, in all cultivars (Table 2A).

4. Discussion

To elucidate the role of Vitis genotype in microbiome assemblage, we examined the composition of epiphytic bacterial and fungal microbial communities in 36 distinct grapevine cultivars grown in the same vineyard and terroir, under the same farming system. We also characterized fluctuations of the microbial communities in different grapevine tissues and developmental stages, examining how such microbial populations change among three different phenological stages (bark and bud, berry set, and harvest) throughout the growing season. Unraveling the associated microbiomes, the relationships among them, and the impact of their hosts, could provide a tool for vine-growers and winemakers to efficiently manage microbiome structure.
Here we analyzed microbiomes in a large selection of 36 cultivars grown in the same environment, including cultivars used for edible grape production as well as for winemaking and colored or white ones. Other studies focused on microbiomes inhabiting the phylospheric compartments in one [5,10,19,20,25,34,46], few [22], or several cultivars [23]. High-throughput sequencing revealed rich fungal or bacterial OTUs, and both similarities and differences among microbial communities between the three phenological stages were uncovered. Patterns of microbiome similarity and divergence among cultivars became evident based on PCoA visualization (Figures S1–S6). Similar patterns of microbe divergence were also detected in our previous work [17] and in other studies with different cultivars [23,47]. In general, a core microbiome shared by all cultivars was discovered for each phenological stage. However, each cultivar hosted several different microbial species, characteristic of the host genotype. Moreover, the results revealed that some cultivars, such as Limniona (bark and bud), Agiorgitiko (berry set), and Vertzami (harvest), were unique regarding their hosted bacterial genera. Others, such as Savvatiano (bark and bud), Serifiotiko (berry set), and Cabernet Sauvignon (harvest), were also unique regarding their hosted fungal genera. Several studies have documented how geography and environment affect the diversity of microbial community structure [4,12,46]. In our study, geographic distance was not a factor controlling microbial diversity because all cultivars were in the same vineyard. Thus, any difference observed could at least partly be considered an effect of the host genotype. Consequently, the genotype of the cultivars appeared to have a drastic impact on the microbial community, influencing the fitness of certain V. vinifera-associated microbes.
A high percentage (79–87%) of fungal and a lower percentage (27–35%) of bacterial OTUs detected in berries could originate from barks and buds, including the majority of the dominant OTUs. Previous studies suggested that the vineyard soil may serve as an origin of primary inoculums of the plant associated microbiomes [10,19,21]. The detected microbial OTUs in our study include several taxa that have been typically identified in many studies across the world and suggest an important role of bark and buds as a microbial source (microbial terroir [24]) for secondary direct inoculation of other vines’ aerial parts.
The richness of fungal and bacterial species turned out to be lower than that discovered by Singh et al. [23], who targeted similar phylospheric compartments. Additionally, the bacterial OTUs (excluding singletons) uncovered in one-season-old canes’ barks and buds in this study were about 40% less than those found in our previous work [17]. The plausible explanation could be the different number of 16S RNA variable regions analyzed.
All fungal OTUs discovered in this study were classified similarly to other works [22]. On the contrary, about 40% of bacterial OTUs were unclassified for harvest, 48% for berry set, and 80% for bark and bud. This large percentage of unclassified bacterial OTUs, especially for bark and buds, has been encountered in our previous work [17]. It has been proposed that richer microbiomes inhabiting such tissues may contain many organisms less well described in the different databases [48] and thus unclassified in these studies. There is also a possibility that the grapevine genotype applies a selection pressure on the microbiome [17,23], and vineyards consisting of different grape cultivars appear to harbor more diverse microbiomes with a higher probability of containing unclassified accessions than those consisting of a single variety.
Fungal richness was lower than that of bacteria, reflecting generally lower fungal diversity and occurrence. Such a difference between bacteria and fungi has been recorded in other studies [5,23,25,46,49],, regardless of the sample type or even the number of cultivars analyzed. Considering the phenological stage, the richness and diversity of the detected bacterial and fungal OTUs on the harvest samples were considerably higher (particularly for bacteria) than that of the berry set, followed by that of the bark and bud samples. This might possibly be due to nutrient availability provided by berries at harvest stage. Such nutrients can support the occurrence and diversity of microbes [19].
Our results on the detected fungal and bacterial species are largely in agreement with findings reported by other investigators. Comparisons of fungal communities showed that the predominant phyla in all the phenological stages and genotypes were in agreement with previous studies [25,36,46,50,51,52,53]. The same is true for the more prevalent genera detected in berries at harvest [20,21,25,34,54]. Similarly, the most abundant bacterial phyla detected were in accordance with the findings of others [20,22,23,24,25,36,46,50,51,52,53,55,56,57,58,59,60,61]. In addition, phyla having a lower presence were also reported in other Vitis studies [20,24,25]. Prevalent bacterial genera among all cultivars were also reported at ripe berries in other studies [5,20,23,25,34,54]. Moreover, the genera of bark and bud were also detected in our previous work [17].
Several bacterial or fungal genera detected are known to have distinct beneficial or pathogenic roles. For instance, the presence of Aureobasidium pullulans, a fungus known to have antagonistic activity against Botrytis and Bacillus [23], could explain the lower occurrence of the pathogens. On the other hand, Cladosporium cladosporioides, a fungal species responsible for Cladosporium rot of grapevine [62] reducing yield and affecting the quality of wines [63], was also present. Notably, some economically important microbial genera such as Aspergillus, Acetobacter, Gluconobacter, etc. were observed in trivial abundance at the bark and bud stage with no observable effect, but they became dominant at the harvest stage. Our findings point to the conclusion that grapevine tissues host both beneficial and pathogenic taxa that inflict important economic consequences in viticulture. The dynamics of these beneficial and pathogenic taxa on the three different tissues through seasonal grapevine growth were described.
The evident connection between Vitis microbiomes and the host genotype suggests a genetic component to the host–microbial interactions. Similar interactions were indicated earlier in biogeographic investigations, where local environmental and viticultural practices could not be excluded. Many of the core or unique Vitis microbiota may play an essential role in the quality of grapes and the fermentation or sensory aspects of wines. Viticultural practices such as agrochemical application, canopy thinning, and trellising are commonly applied to regulate Vitis growth and microclimate. Building upon the new evidence reported in this study and the superior capacity of high-throughput sequencing to decipher microbiomes, it could be possible to customize viticultural practices specific to Vitis cultivars and their hosted associated microbiomes.

5. Conclusions

The composition of microbial communities of 36 grapevine cultivars in three different tissues/developmental stages was studied using NGS. Microbiome structure was significantly different not only among the different tissues/developmental stages but also among the grapevine genotypes and cultivars. This supports the conclusion that even within a terroir, in the same vineyard, and under identical viticultural practices, the cultivar’s genotype has a key role in shaping the microbial community. Under these circumstances, all cultivars share a common core microbiome. Remarkably, unique microbial fingerprints were unraveled for each specific cultivar, offering a unique microbial signature of terroir and cultivar/genotype interactions. Further understanding of the host-microbe interactions responsible for the unique signature of grapevine cultivars and microbial distribution could provide a tool to promote precision viticulture for high-quality production with a minimal chemical footprint and climate change impacts.

Supplementary Materials

The following supporting information can be downloaded at: https://www.mdpi.com/article/10.3390/app13010102/s1, Figure S1. PCoA constructed using Bray-Curtis at the bacterial genus level for 36 grapevines at the bark and bud stage. Figure S2. PCoA constructed using Bray–Curtis at the bacterial genus level for 36 grapevines at the berry set stage. Figure S3. PCoA constructed using Bray–Curtis at the bacterial genus level for 36 grapevines at harvest stage. Figure S4. PCoA constructed using Bray–Curtis at the fungal genus level for 36 grapevines at the bark and bud stage. Figure S5. PCoA constructed using Bray–Curtis at the fungal genus level for 36 grapevines at berry set stage. Figure S6. PCoA constructed using Bray–Curtis at the fungal genus level for 36 grapevines at the harvest stage. Table S1. Bacterial Alpha Diversity Indecies. Table S2. Fungal Alpha Diversity Indecies.

Author Contributions

Conceptualization, P.V.M. and A.N.P.; methodology, M.A., G.G., P.V.M. and A.N.P.; data curation and formal analysis, M.A. and G.G.; investigation, M.A. and G.G.; resources, P.V.M. and A.N.P.; writing—original draft preparation, M.A. and G.G.; writing—review and editing, M.A., G.G., P.V.M. and A.N.P.; project administration, A.N.P.; funding acquisition, P.V.M. All authors have read and agreed to the published version of the manuscript.

Funding

This work was partly supported by Greek national funds through the Public Investments Program (PIP) of the General Secretariat for Research & Innovation (GSRI), under the Emblematic Action “Routes of Vineyards”, Grant No. 6070.03.

Institutional Review Board Statement

Not applicable.

Informed Consent Statement

Not applicable.

Data Availability Statement

Microbial datasets were deposited in MG-RAST under project number mgp97325.

Acknowledgments

The authors wish to thank N. Nikolaou for providing Vitis samples and access to the Vine Cultivar Collection—AUTH.

Conflicts of Interest

The authors declare no conflict of interest.

References

  1. OIV; International Organisation of Vine and Wine. 2019 Statistical Report on World Vitiviniculture; OIV: Ensenada, Mexico, 2019; p. 23. [Google Scholar]
  2. Poni, S.; Gatti, M.; Palliotti, A.; Dai, Z.; Duchêne, E.; Truong, T.T.; Ferrara, G.; Matarrese, A.M.S.; Gallotta, A.; Bellincontro, A.; et al. Grapevine quality: A multiple choice issue. Sci. Hortic. 2018, 234, 445–462. [Google Scholar] [CrossRef] [Green Version]
  3. Döring, J.; Frisch, M.; Tittmann, S.; Stoll, M.; Kauer, R. Growth, yield and fruit quality of grapevines under organic and biodynamic management. PLoS ONE 2015, 10, e0138445. [Google Scholar] [CrossRef] [PubMed] [Green Version]
  4. Bokulich, N.A.; Thorngate, J.H.; Richardson, P.M.; Mills, D.A. Microbial biogeography of wine grapes is conditioned by cultivar, vintage, and climate. Proc. Natl. Acad. Sci. USA 2014, 111, E139–E148. [Google Scholar] [CrossRef] [PubMed] [Green Version]
  5. Swift, J.F.; Hall, M.E.; Harris, Z.N.; Kwasniewski, M.T.; Miller, A.J. Grapevine Microbiota Reflect Diversity among Compartments and Complex Interactions within and among Root and Shoot Systems. Microorganisms 2021, 9, 92. [Google Scholar] [CrossRef]
  6. Carbone, M.J.; Alaniz, S.; Mondino, P.; Gelabert, M.; Eichmeier, A.; Tekielska, D.; Bujanda, R.; Gramaje, D. Drought influences fungal community dynamics in the grapevine rhizosphere and root microbiome. J. Fungi 2021, 7, 686. [Google Scholar] [CrossRef]
  7. Bernardo, S.; Dinis, L.T.; Machado, N.; Moutinho-Pereira, J. Grapevine abiotic stress assessment and search for sustainable adaptation strategies in Mediterranean-like climates. A review. Agron. Sustain. Dev. 2018, 38, 66. [Google Scholar] [CrossRef] [Green Version]
  8. Gilbert, J.A.; Van Der Lelie, D.; Zarraonaindia, I. Microbial terroir for wine grapes. Proc. Natl. Acad. Sci. USA 2014, 111, 5–6. [Google Scholar] [CrossRef] [Green Version]
  9. Burns, K.N.; Kluepfel, D.A.; Strauss, S.L.; Bokulich, N.A.; Cantu, D.; Steenwerth, K.L. Vineyard soil bacterial diversity and composition revealed by 16S rRNA genes: Differentiation by geographic features. Soil Biol. Biochem. 2015, 91, 232–247. [Google Scholar] [CrossRef] [Green Version]
  10. Zarraonaindia, I.; Gilbert, J.A. Understanding grapevine-microbiome interactions: Implications for viticulture industry. Microb. Cell 2015, 2, 171–173. [Google Scholar] [CrossRef]
  11. Portillo, C.; Mas, A. Analysis of microbial diversity and dynamics during wine fermentation of Grenache grape variety by high-throughput barcoding sequencing. LWT-Food Sci. Technol. 2016, 72, 317–321. [Google Scholar] [CrossRef]
  12. Morrison-Whittle, P.; Lee, S.A.; Goddard, M.R. Fungal communities are differentially affected by conventional and biodynamic agricultural management approaches in vineyard ecosystems. Agric. Ecosyst. Environ. 2017, 246, 306–313. [Google Scholar] [CrossRef]
  13. Liu, D.; Howell, K. Community succession of the grapevine fungal microbiome in the annual growth cycle. Environ. Microbiol. 2020, 23, 1842–1857. [Google Scholar] [CrossRef] [PubMed]
  14. Tello, J.; Torres-Pérez, R.; Grimplet, J.; Carbonell-Bejerano, P.; Martínez-Zapater, J.M.; Ibáñez, J. Polymorphisms and minihaplotypes in the VvNAC26 gene associate with berry size variation in grapevine. BMC Plant Biol. 2015, 15, 253. [Google Scholar] [CrossRef] [PubMed] [Green Version]
  15. Armijo, G.; Schlechter, R.; Agurto, M.; Muñoz, D.; Nuñez, C.; Arce-Johnson, P. Grapevine Pathogenic Microorganisms: Understanding Infection Strategies and Host Response Scenarios. Front. Plant Sci. 2016, 7, 382. [Google Scholar] [CrossRef] [Green Version]
  16. Patanita, M.; Albuquerque, A.; Campos, M.D.; Materatski, P.; Varanda, C.M.R.; Ribeiro, J.A.; Félix, M.D.R. Metagenomic Assessment Unravels Fungal Microbiota Associated to Grapevine Trunk Diseases. Horticulturae 2022, 8, 288. [Google Scholar] [CrossRef]
  17. Awad, M.; Giannopoulos, G.; Mylona, P.V.; Polidoros, A.N. Genotype may influence bacterial diversity in bark and bud of Vitis vinifera cultivars grown under the same environment. Appl. Sci. 2020, 10, 8405. [Google Scholar] [CrossRef]
  18. Awad, M. Genetic Diversity in V. vinifera and Its Impact on Hosted Microbiota. Ph.D. Thesis, Aristotle University of Thessaloniki, Thessaloniki, Greece, 2020. [Google Scholar] [CrossRef]
  19. Zhang, S.; Chen, X.; Zhong, Q.; Huang, Z.; Bai, Z. Relations among epiphytic microbial communities from soil, leaves and grapes of the grapevine. Front. Life Sci. 2017, 10, 73–83. [Google Scholar] [CrossRef] [Green Version]
  20. Salvetti, E.; Campanaro, S.; Campedelli, I.; Fracchetti, F.; Gobbi, A.; Tornielli, G.B.; Torriani, S.; Felis, G.E. Whole-metagenome-sequencing-based community profiles of Vitis vinifera L. cv. Corvina berries withered in two post-harvest conditions. Front. Microbiol. 2016, 7, 937. [Google Scholar] [CrossRef] [Green Version]
  21. Martins, G.; Lauga, B.; Miot-Sertier, C.; Mercier, A.; Lonvaud, A.; Soulas, M.L.; Soulas, G.; Masneuf-Pomarède, I. Characterization of Epiphytic Bacterial Communities from Grapes, Leaves, Bark and Soil of Grapevine Plants Grown, and Their Relations. PLoS ONE 2013, 8, e73013. [Google Scholar] [CrossRef]
  22. Zhang, S.; Chen, X.; Zhong, Q.; Zhuang, X.; Bai, Z. Microbial Community Analyses Associated with Nine Varieties of Wine Grape Carposphere Based on High-Throughput Sequencing. Microorganisms 2019, 7, 668. [Google Scholar] [CrossRef] [Green Version]
  23. Singh, P.; Santoni, S.; This, P.; Péros, J.-P. Genotype-Environment Interaction Shapes the Microbial Assemblage in Grapevine’s Phyllosphere and Carposphere: An NGS Approach. Microorganisms 2018, 6, 96. [Google Scholar] [CrossRef] [Green Version]
  24. Vitulo, N.; Lemos, W.J.F.; Calgaro, M.; Confalone, M.; Felis, G.E.; Zapparoli, G.; Nardi, T. Bark and grape microbiome of Vitis vinifera: Influence of geographic patterns and agronomic management on bacterial diversity. Front. Microbiol. 2019, 9, 3203. [Google Scholar] [CrossRef] [PubMed] [Green Version]
  25. Wei, Y.J.; Wu, Y.; Yan, Y.Z.; Zou, W.; Xue, J.; Ma, W.R.; Wang, W.; Tian, G.; Wang, L.Y. High-throughput sequencing of microbial community diversity in soil, grapes, leaves, grape juice and wine of grapevine from China. PLoS ONE 2018, 13, e0193097. [Google Scholar] [CrossRef] [PubMed] [Green Version]
  26. Faist, H.; Keller, A.; Hentschel, U.; Deeken, R. Grapevine (Vitis vinifera) crown galls host distinct microbiota. Appl. Environ. Microbiol. 2016, 82, 5542–5552. [Google Scholar] [CrossRef] [PubMed] [Green Version]
  27. Aguilar, E.; Moreira, L.; Rivera, C. Confirmation of Xylella fastidiosa infecting grapes Vitis vinifera in Costa Rica. Trop. Plant Pathol. 2008, 33, 444–448. [Google Scholar] [CrossRef]
  28. Zheng, C.; Choquer, M.; Zhang, B.; Ge, H.; Hu, S.; Ma, H.; Chen, S. LongSAGE gene-expression profiling of Botrytis cinerea germination suppressed by resveratrol, the major grapevine phytoalexin. Fungal Biol. 2011, 115, 815–832. [Google Scholar] [CrossRef]
  29. Brewer, M.T.; Milgroom, M.G. Phylogeography and population structure of the grape powdery mildew fungus, Erysiphe necator, from diverse Vitis species. BMC Evol. Biol. 2010, 10, 268. [Google Scholar] [CrossRef] [Green Version]
  30. Gessler, C.; Pertot, I.; Perazzolli, M. Plasmopara viticola: A review of knowledge on downy mildew of grapevine and effective disease management. Phytopathol. Mediterr. 2011, 50, 3–44. [Google Scholar] [CrossRef]
  31. González-Alonso, I.; Walker, M.E.; Pascual-Vallejo, M.E.; Naharro-Carrasco, G.; Jiranek, V. Capturing yeast associated with grapes and spontaneous fermentations of the Negro Saurí minority variety from an experimental vineyard near León. Sci. Rep. 2021, 11, 3748. [Google Scholar] [CrossRef]
  32. Ganucci, D.; Guerrini, S.; Mangani, S.; Vincenzini, M.; Granchi, L. Quantifying the effects of ethanol and temperature on the fitness advantage of predominant Saccharomyces cerevisiae strains occurring in spontaneous wine fermentations. Front. Microbiol. 2018, 9, 1563. [Google Scholar] [CrossRef] [Green Version]
  33. Edwards, C.G.; Aplin, J.J. Application of Cool Fermentation Temperatures to Encourage Non-Saccharomyces Yeasts to Yield Lower Ethanol Concentrations in Wines. Fermentation 2022, 8, 421. [Google Scholar] [CrossRef]
  34. Mezzasalma, V.; Sandionigi, A.; Bruni, I.; Bruno, A.; Lovicu, G.; Casiraghi, M.; Labra, M. Grape microbiome as a reliable and persistent signature of field origin and environmental conditions in Cannonau wine production. PLoS ONE 2017, 12, e0184615. [Google Scholar] [CrossRef] [PubMed]
  35. Morrison-Whittle, P.; Goddard, M.R. From vineyard to winery: A source map of microbial diversity driving wine fermentation. Environ. Microbiol. 2018, 20, 75–84. [Google Scholar] [CrossRef] [PubMed] [Green Version]
  36. Morgan, H.H.; du Toit, M.; Setati, M.E. The grapevine and wine microbiome: Insights from high-throughput amplicon sequencing. Front. Microbiol. 2017, 8, 820. [Google Scholar] [CrossRef] [PubMed] [Green Version]
  37. Griggs, R.G.; Steenwerth, K.L.; Mills, D.A.; Cantu, D.; Bokulich, N.A. Sources and Assembly of Microbial Communities in Vineyards as a Functional Component of Winegrowing. Front. Microbiol. 2021, 12, 673810. [Google Scholar] [CrossRef] [PubMed]
  38. Marasco, R.; Rolli, E.; Fusi, M.; Michoud, G.; Daffonchio, D. Grapevine rootstocks shape underground bacterial microbiome and networking but not potential functionality. Microbiome 2018, 6, 3. [Google Scholar] [CrossRef] [PubMed] [Green Version]
  39. Darriaut, R.; Martins, G.; Dewasme, C.; Mary, S.; Darrieutort, G.; Ballestra, P.; Marguerit, E.; Vivin, P.; Ollat, N.; Masneuf-Pomarède, I.; et al. Grapevine decline is associated with difference in soil microbial composition and activity. OENO One 2021, 55, 67–84. [Google Scholar] [CrossRef]
  40. Gan, H.M.; Szegedi, E.; Fersi, R.; Chebil, S.; Kovács, L.; Kawaguchi, A.; Hudson, A.O.; Burr, T.J.; Savka, M.A. Insight into the microbial co-occurrence and diversity of 73 grapevine (Vitis vinifera) crown galls collected across the northern hemisphere. Front. Microbiol. 2019, 10, 1896. [Google Scholar] [CrossRef] [Green Version]
  41. Vandenkoornhuyse, P.; Quaiser, A.; Duhamel, M.; Le Van, A.; Dufresne, A. The importance of the microbiome of the plant holobiont. New Phytol. 2015, 206, 1196–1206. [Google Scholar] [CrossRef]
  42. Compant, S.; Mitter, B.; Colli-Mull, J.G.; Gangl, H.; Sessitsch, A. Endophytes of grapevine flowers, berries, and seeds: Identification of cultivable bacteria, comparison with other plant parts, and visualization of niches of colonization. Microb. Ecol. 2011, 62, 188–197. [Google Scholar] [CrossRef]
  43. Meyer, F.; Paarmann, D.; D’Souza, M.; Olson, R.; Glass, E.M.; Kubal, M.; Paczian, T.; Rodriguez, A.; Stevens, R.; Wilke, A.; et al. The metagenomics RAST server-A public resource for the automatic phylogenetic and functional analysis of metagenomes. BMC Bioinform. 2008, 9, 386. [Google Scholar] [CrossRef] [Green Version]
  44. Hammer, Ø.; Harper, D.; Ryan, P. PAST: Paleontological statistics software package for education education and data analysis. Palaeontol. Electron. 2015, 1, 1–9. [Google Scholar]
  45. Heberle, H.; Meirelles, V.G.; da Silva, F.R.; Telles, G.P.; Minghim, R. InteractiVenn: A web-based tool for the analysis of sets through Venn diagrams. BMC Bioinform. 2015, 16, 169. [Google Scholar] [CrossRef] [PubMed] [Green Version]
  46. Zhang, J.; Wang, E.T.; Singh, R.P.; Guo, C.; Shang, Y.; Chen, J.; Liu, C. Grape berry surface bacterial microbiome: Impact from the varieties and clones in the same vineyard from central China. J. Appl. Microbiol. 2019, 126, 204–214. [Google Scholar] [CrossRef] [PubMed]
  47. Compant, S.; Samad, A.; Faist, H.; Sessitsch, A. A review on the plant microbiome: Ecology, functions, and emerging trends in microbial application. J. Adv. Res. 2019, 19, 29–37. [Google Scholar] [CrossRef] [PubMed]
  48. Siegwald, L.; Touzet, H.; Lemoine, Y.; Hot, D.; Audebert, C.; Caboche, S. Assessment of common and emerging bioinformatics pipelines for targeted metagenomics. PLoS ONE 2017, 12, e0169563. [Google Scholar] [CrossRef] [Green Version]
  49. Zhang, Y.; Feng, L.; Fan, X.; Jiang, J.; Zheng, X.-b.; Sun, H.; Chonghuai, L. Genome-wide assessment of population structure, linkage disequilibrium and resistant QTLs in Chinese wild grapevine. Sci. Hortic. 2017, 215, 59–64. [Google Scholar] [CrossRef]
  50. Liu, D.; Chen, Q.; Zhang, P.; Chen, D.; Howell, K.S. Vineyard ecosystems are structured and distinguished by fungal communities impacting the flavour and quality of wine. bioRxiv 2020, 1–52. [Google Scholar] [CrossRef] [Green Version]
  51. Stefanini, I.; Cavalieri, D. Metagenomic approaches to investigate the contribution of the vineyard environment to the quality of wine fermentation: Potentials and difficulties. Front. Microbiol. 2018, 9, 991. [Google Scholar] [CrossRef]
  52. Pinto, C.; Pinho, D.; Cardoso, R.; Custódio, V.; Fernandes, J.; Sousa, S.; Pinheiro, M.; Egas, C.; Gomes, A.C. Wine fermentation microbiome: A landscape from different Portuguese wine appellations. Front. Microbiol. 2015, 6, 905. [Google Scholar] [CrossRef]
  53. Hendgen, M.; Hoppe, B.; Döring, J.; Friedel, M.; Kauer, R.; Frisch, M.; Dahl, A.; Kellner, H. Effects of different management regimes on microbial biodiversity in vineyard soils. Sci. Rep. 2018, 8, 9393. [Google Scholar] [CrossRef] [PubMed] [Green Version]
  54. Wang, S.; Chu, Z.; Ren, M.; Jia, R.; Zhao, C.; Fei, D.; Su, H.; Fan, X.; Zhang, X.; Li, Y.; et al. Identification of anthocyanin composition and functional analysis of an anthocyanin activator in Solanum nigrum fruits. Molecules 2017, 22, 876. [Google Scholar] [CrossRef] [PubMed]
  55. Canfora, L.; Vendramin, E.; Florio, A.; Benedetti, A.; Felici, B.; Tarricone, L. Vineyard microbiome variations during di ff erent fertilisation practices revealed by 16s rRNA gene sequencing. Appl. Soil Ecol. 2018, 125, 71–80. [Google Scholar] [CrossRef]
  56. Mezzasalma, V.; Sandionigi, A.; Guzzetti, L.; Galimberti, A.; Grando, M.S.; Tardaguila, J.; Labra, M. Geographical and cultivar features differentiate grape microbiota in Northern Italy and Spain vineyards. Front. Microbiol. 2018, 9, 946. [Google Scholar] [CrossRef] [PubMed]
  57. Chou, M.Y.; Vanden Heuvel, J.; Bell, T.H.; Panke-Buisse, K.; Kao-Kniffin, J. Vineyard under-vine floor management alters soil microbial composition, while the fruit microbiome shows no corresponding shifts. Sci. Rep. 2018, 8, 11039. [Google Scholar] [CrossRef] [Green Version]
  58. Dong, Z.; Liu, W.; Li, X.; Tan, W.; Zhao, Q.; Wang, M.; Ren, R.; Ma, X.; Tang, X. Genetic relationships of 34 grapevine varieties and construction of molecular fingerprints by SSR markers. Biotechnol. Biotechnol. Equip. 2018, 32, 942–950. [Google Scholar] [CrossRef] [Green Version]
  59. Gobbi, A.; Kyrkou, I.; Filippi, E.; Ellegaard-Jensen, L.; Hansen, L.H. Seasonal epiphytic microbial dynamics on grapevine leaves under biocontrol and copper fungicide treatments. Sci. Rep. 2020, 10, 681. [Google Scholar] [CrossRef] [Green Version]
  60. Leveau, J.H.J.; Tech, J.J. Grapevine microbiomics: Bacterial diversity on grape leaves and berries revealed by high-throughput sequence analysis of 16S rRNA amplicons. Acta Hortic. 2011, 905, 31–42. [Google Scholar] [CrossRef] [Green Version]
  61. Miura, T.; Sánchez, R.; Castañeda, L.E.; Godoy, K.; Barbosa, O. Is microbial terroir related to geographic distance between vineyards? Environ. Microbiol. Rep. 2017, 9, 742–749. [Google Scholar] [CrossRef]
  62. Briceño, E.X.; Latorre, B.A. Characterization of cladosporium rot in grapevines, a problem of growing importance in Chile. Plant Dis. 2008, 92, 1635–1642. [Google Scholar] [CrossRef]
  63. Latorre, B.A.; Briceño, E.X.; Torres, R. Increase in Cladosporium spp. populations and rot of wine grapes associated with leaf removal. Crop Prot. 2011, 30, 52–56. [Google Scholar] [CrossRef]
Figure 1. Venn diagrams showing the distribution of (A) fungal and (B) bacterial OTUs among the three phenological stages.
Applsci 13 00102 g001aApplsci 13 00102 g001b
Figure 2. The relative abundance of the dominant (A) fungal and (B) genera among the three phenological stages.
Applsci 13 00102 g002
Figure 3. Bray-Curtis distance PCoA of bacterial (A) and fungal (B) genera for the three phenological stages for 36 grapevines.
Applsci 13 00102 g003aApplsci 13 00102 g003b
Figure 4. Venn diagrams that show the fungal (A) and bacterial (B) genera distribution among the three phenological stages.
Applsci 13 00102 g004
Table 1. Bacterial (A) and fungal (B) Sequence Analysis: number of samples analyzed (n), number of OTUs with and without singletons detected, classified and unclassified individuals, alpha diversity indices (Simpson, Shannon, Chao1), in the three phenological stages.
A
Phenological StagenOTUs
Withsingletons
OTUs without SingletonsIndividuals (Classfied)Individuals (Unclassfied)SimpsonShannonChao1Good’s Coverage
Bark and bud36628371177,834721,6200.7101.91192.20.988
Berry Set361157713262,982239,8660.5911.76301.20.979
Harvest361450975349,639236,5770.6902.35339.30.978
Total10819611296790,4551,198,063
B
Phenological StagenOTUs
Withsingletons
OTUs without SingletonsClassfied IndividualsUnclassfied IndividualsSimpsonShannonChao1Good’s Coverage
Bark and bud36579422549,446-0.6791.53172.20.994
Berry Set36561433763,410-0.6911.62214.30.994
Harvest36568448731,220-0.6681.57174.30.995
Total1087896032,044,076-
Table 2. Relative abundance of (A) fungal and (B) bacterial genera with their percentages detected among the three phenological stages.
A
PhyllumFamilyGenusHarvestBerry SetBark and Bud
AscomycotaDothioraceaeAureobasidium45.3535.7439.80
AscomycotaTrichocomaceaeAspergillus17.390.100.02
AscomycotaPleosporaceaeAlternaria10.3110.0718.54
AscomycotaDavidiellaceaeCladosporium6.0722.4614.86
AscomycotaDavidiellaceaeDavidiella5.4912.4511.72
AscomycotaDidymellaceaePhoma3.174.684.76
AscomycotaSaccharomycetaceaeIssatchenkia2.720.000.00
AscomycotaMetschnikowiaceaeMetschnikowia2.530.000.00
AscomycotaDidymellaceaeEpicoccum1.342.840.78
AscomycotaBotryosphaeriaceaeBotryosphaeria0.661.591.09
AscomycotaPleosporaceaeLewia0.511.781.47
AscomycotaGlomerellaceaeGlomerella0.090.772.81
BasidiomycotaUstilaginaceaeRhodosporidium1.743.810.76
The rest of genera2.633.73.39
B
PhyllumFamilyGenusHarvestBerry SetBark and Bud
ProteobacteriaAcetobacteraceaeGluconacetobacter41.950.120.16
ProteobacteriaEnterobacteriaceaeErwinia15.504.810.10
ProteobacteriaAcetobacteraceaeGluconobacter14.210.030.03
ProteobacteriaHalomonadaceaeZymobacter7.710.010.00
ProteobacteriaOxalobacteraceaeMassilia1.810.029.15
ProteobacteriaHalomonadaceaeHalomonas1.500.000.00
ProteobacteriaEnterobacteriaceaeTatumella1.250.020.00
ProteobacteriaEnterobacteriaceaePantoea1.2325.801.62
ProteobacteriaPseudomonadaceaePseudomonas1.1612.374.40
ProteobacteriaAcetobacteraceaeAcetobacter0.790.010.00
ProteobacteriaSphingomonadaceaeSphingomonas0.720.1911.12
ProteobacteriaEnterobacteriaceaeBuchnera0.0739.410.05
ProteobacteriaEnterobacteriaceaeRaoultella0.036.200.00
ProteobacteriaEnterobacteriaceaeCronobacter0.010.820.00
ProteobacteriaEnterobacteriaceaeArsenophonus0.000.600.00
BacteroidetesCytophagaceaeHymenobacter0.410.3343.75
BacteroidetesSphingobacteriaceaePedobacter0.050.1511.44
BacteroidetesCytophagaceaeFlexibacter0.030.000.83
ActinobacteriaMicrobacteriaceaeCurtobacterium0.210.011.72
ActinobacteriaMicrobacteriaceaeFrigoribacterium0.180.047.87
ActinobacteriaKineosporiaceaeKineococcus0.070.061.69
FirmicutesLactobacillaceaeLactobacillus0.321.450.02
FirmicutesXI. Incertae SedisTissierella0.030.000.70
The rest of genera10.787.555.36
Table 3. Factors predicting α- and β-diversity on microbial communities in the vineyard.
FactorPCoA Axesα-Diversity (Shannon)β-Diversity (Bray-Curtis)
ANOVAPERMANOVAANOSIM
FPFPRP
16S
Data
Phenological stages1= 22.98%, 2= 10.8%4.580.012424.90.00010.640.0001
Bark and bud1= 34.5%, 2= 14.2%NANA12.50.00010.660.0001
Berry Set1= 36%, 2= 17.1%NANA13.10.00010.760.0001
Harvest1= 18.1%, 2= 9.1%NANA04.60.00010.420.0001
ITS2
Data
Phenological stages1= 21.05%, 2= 19.9%1.250.290312.10.00010.210.0001
Bark and bud1= 34.1%, 2= 26%NANA17.50.00010.820.0001
Berry Set1= 41.4%, 2= 19.2%NANA23.60.00010.810.0001
Harvest1= 50.5%, 2= 10.5%NANA15.50.00010.710.0001
NA: Not applied.
Disclaimer/Publisher’s Note: The statements, opinions and data contained in all publications are solely those of the individual author(s) and contributor(s) and not of MDPI and/or the editor(s). MDPI and/or the editor(s) disclaim responsibility for any injury to people or property resulting from any ideas, methods, instructions or products referred to in the content.

