Article

Analysis of Surface Deformation Induced by Backfill Mining Considering the Compression Behavior of Gangue Backfill Materials

1
State Key Laboratory of Coal Resources and Safe Mining, China University of Mining and Technology, Xuzhou 221116, China
2
School of Mines, China University of Mining and Technology, Xuzhou 221116, China
*
Author to whom correspondence should be addressed.
Appl. Sci. 2023, 13(1), 160; https://doi.org/10.3390/app13010160
Submission received: 9 November 2022 / Revised: 18 December 2022 / Accepted: 19 December 2022 / Published: 23 December 2022
(This article belongs to the Section Civil Engineering)

Abstract

:
Coal gangue, as a solid waste produced in the coal mining process, can be disposed by being prepared into backfill materials and then filled in underground goafs, thus controlling strata movement and surface subsidence. However, gangue backfill materials are non-continuous; therefore, research into the surface deformation induced by backfill mining should consider the creep compression behavior of gangue backfill materials. The research took a backfill panel in Tangshan Coal Mine (Tangshan City, Hebei Province, China) as the background. In addition, broken coal gangue was collected in the field to prepare specimens of gangue backfill materials, and their creep compression properties were measured. The corresponding constitutive equation of creep compression was then established and embedded in the numerical software, FLAC3D. By building the numerical model for surface deformation induced by backfill mining, the surface deformation above the backfill panel under conditions of different creep durations of backfill materials was simulated and evaluated. In addition, two measuring lines were arranged on the surface to monitor changes in surface subsidence. After surface subsidence stabilized, the maximum surface subsidence was 163.4 mm, which satisfied the fortification criterion of surface buildings. This means the backfill mining did not affect nearby buildings. The results provide a theoretical basis for predicting surface deformation induced by backfill mining and its effective control.

1. Introduction

During coal mining, overlying strata gradually subside and collapse with the mining of coal seams [1,2,3], thus causing surface subsidence [4], which may trigger water loss, soil erosion, subsidence, and withering of vegetation [5]. Meanwhile, coal mining and the operation of coal washeries produce a large amount of coal gangue [6], the production of which accounts for 15% to 20% of the total coal production, making coal gangue one of the most prevalent industrial solid wastes [7,8]. Stacking of coal gangue on the ground not only occupies land and pollutes groundwater but also has the potential to trigger geological disasters, such as landslides, and undergo spontaneous combustion, thus hindering the sustainable development of coal mines [9,10]. To solve problems caused by coal mining and gangue discharge, some scholars have proposed a disposal method to break coal gangue and then use it as fill in goafs [11,12]. Gangue backfill materials as a load-bearing material support the overlying strata [12,13,14,15], which can reach the goal of controlling surface subsidence and disposing coal gangue underground [16,17]. However, broken coal gangue in goafs is a granular material that is discontinuous [18], and its creep compression properties under overlying strata are completely different from those of cemented backfill materials and high-water-content backfill materials [19,20]. Therefore, the creep compression behaviors of gangue backfill materials need to be considered when studying surface deformation under the support of gangue backfill materials.
Scholars have investigated strata movement and surface deformation during backfill mining [21,22] by means of theoretical analysis, numerical simulation, and field monitoring to good effect [23,24]. To obtain accurate surface subsidence during strip-backfill mining, Zhu et al. [25] proposed a method of prediction that superimposes surface subsidence during backfill mining and strip-backfill mining based on the traditional probability integration method. They predicted the surface subsidence during strip-backfill mining and further investigated the surface subsidence characteristics during strip-backfill mining through physical similar simulation. To estimate the control effect of solid backfill mining on surface subsidence, Zhang et al. [26] changed the mining height indirectly by adjusting the compression ratio of the backfill materials. They also established a prediction model for surface subsidence induced by backfill mining based on the equivalent mining height theory. Yadav et al. [27] built an improved elastic model to simulate the strain-hardening properties of broken rocks in the goaf and then embedded the model in FLAC3D software, thus obtaining the stress distribution in the goaf through simulation. To explore the interaction between backfill stope and surrounding rocks, Qi et al. [28] proposed a simulation framework that considers temporal correlation between creep behaviors of rocks and backfill materials, thus studying the influences of creep behaviors of rocks on stress distribution in backfill stope. Mohammadali et al. [29] proposed a dimensional elasto-plastic finite element model to predict surface-induced ground movement of Diavik Diamond Mine; the average discrepancy between the measured data and finite element model predictions is 7.95%. Li et al. [30] investigated the influences of the particle size distribution of backfill materials on compressive deformation and then revealed surface deformation characteristics induced by backfill mining through simulation using FLAC3D based on the compression ratio of different backfill materials. Xu et al. [31] explored the movement and deformation characteristics of overlying strata during mining with paste backfill materials by combining physical similar simulation and numerical simulation. Mo et al. [32] studied the reinforcement effect of backfill materials on coal pillars through numerical simulation, revealing the influences of different backfill heights on deformation of coal pillars. By drilling monitoring boreholes from the ground surface, Xuan et al. [33] revealed the effects of the rigidity and distribution of grouts on control over surface subsidence in the grouting process in bed-separation zones. Existing research mainly focuses on prediction of surface subsidence induced by backfill mining using the traditional probability integration method and simulation of stress and surface subsidence in the backfill stope based on existing constitutive models of materials in numerical software. However, these studies did not consider the creep compression behaviors of gangue backfill materials and lack accurate predictions of surface deformation induced by backfill mining.
In view of this, an actual backfill panel in a mine was studied. The creep compression characteristics of gangue backfill materials were measured. The corresponding constitutive equation of creep compression was established and then embedded in FLAC3D numerical software. The surface deformation above the backfill panel was then simulated and evaluated. Meanwhile, survey lines were arranged on the surface to measure and analyze surface subsidence.

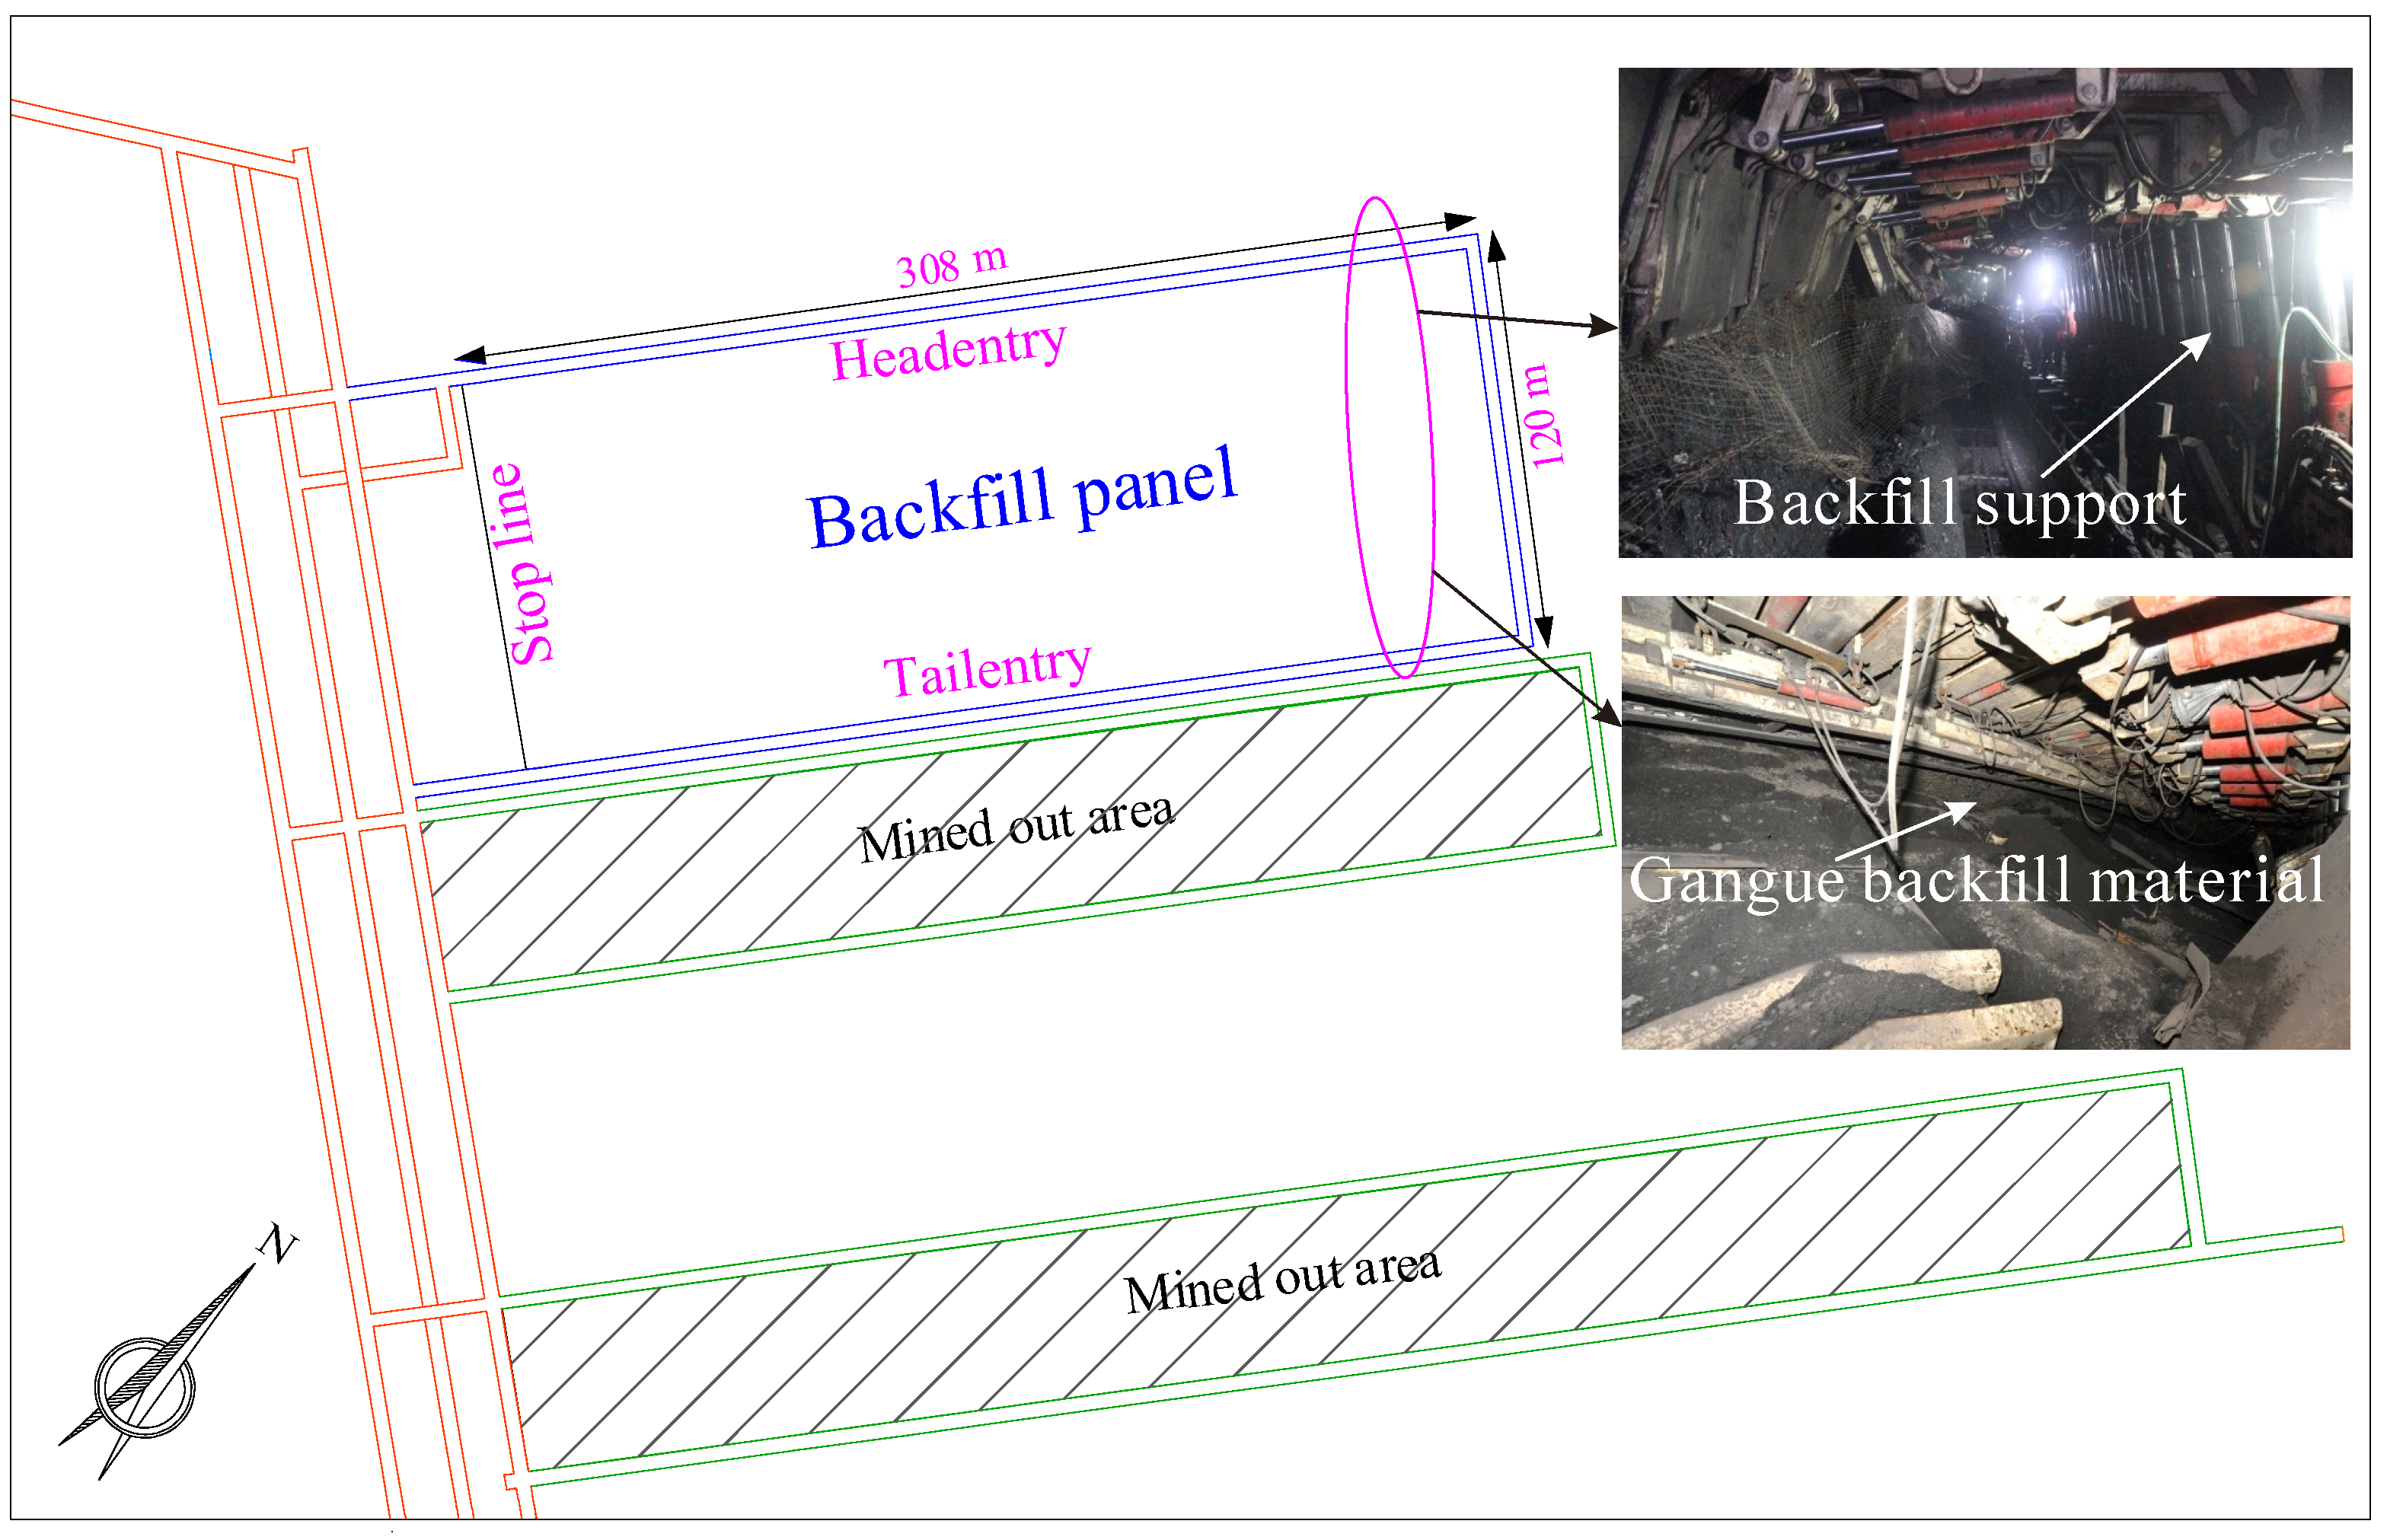
2. Engineering Background

2.1. Mining and Geological Conditions

Much coal gangue waste is stacked on the ground around Tangshan Coal Mine. To dispose of the stacked coal gangue and overcome problems, including environmental pollution and geological disasters caused thereby, the coal mine owners decided to backfill coal gangue wastes to support underground goafs. That is, coal gangue is broken, then transported underground through a vertical feeding system, and carried to the backfill panel using an underground transportation system. Afterwards, the broken coal gangue is filled into the goaf using equipment, including backfill supports and a conveyor. We took a backfill panel in Tangshan Coal Mine as the engineering background (Figure 1), which had a length of 120 m, a strike length of 308 m, an average coal seam thickness of 3.7 m, an average burial depth of 725 m, and design recoverable reserves of 2.176 × 10⁵ t. The immediate roof above the coal seam is fine sandstone with average thickness of 2.8 m, and the main roof mainly comprises medium-grained sandstone with average thickness of 4.5 m.

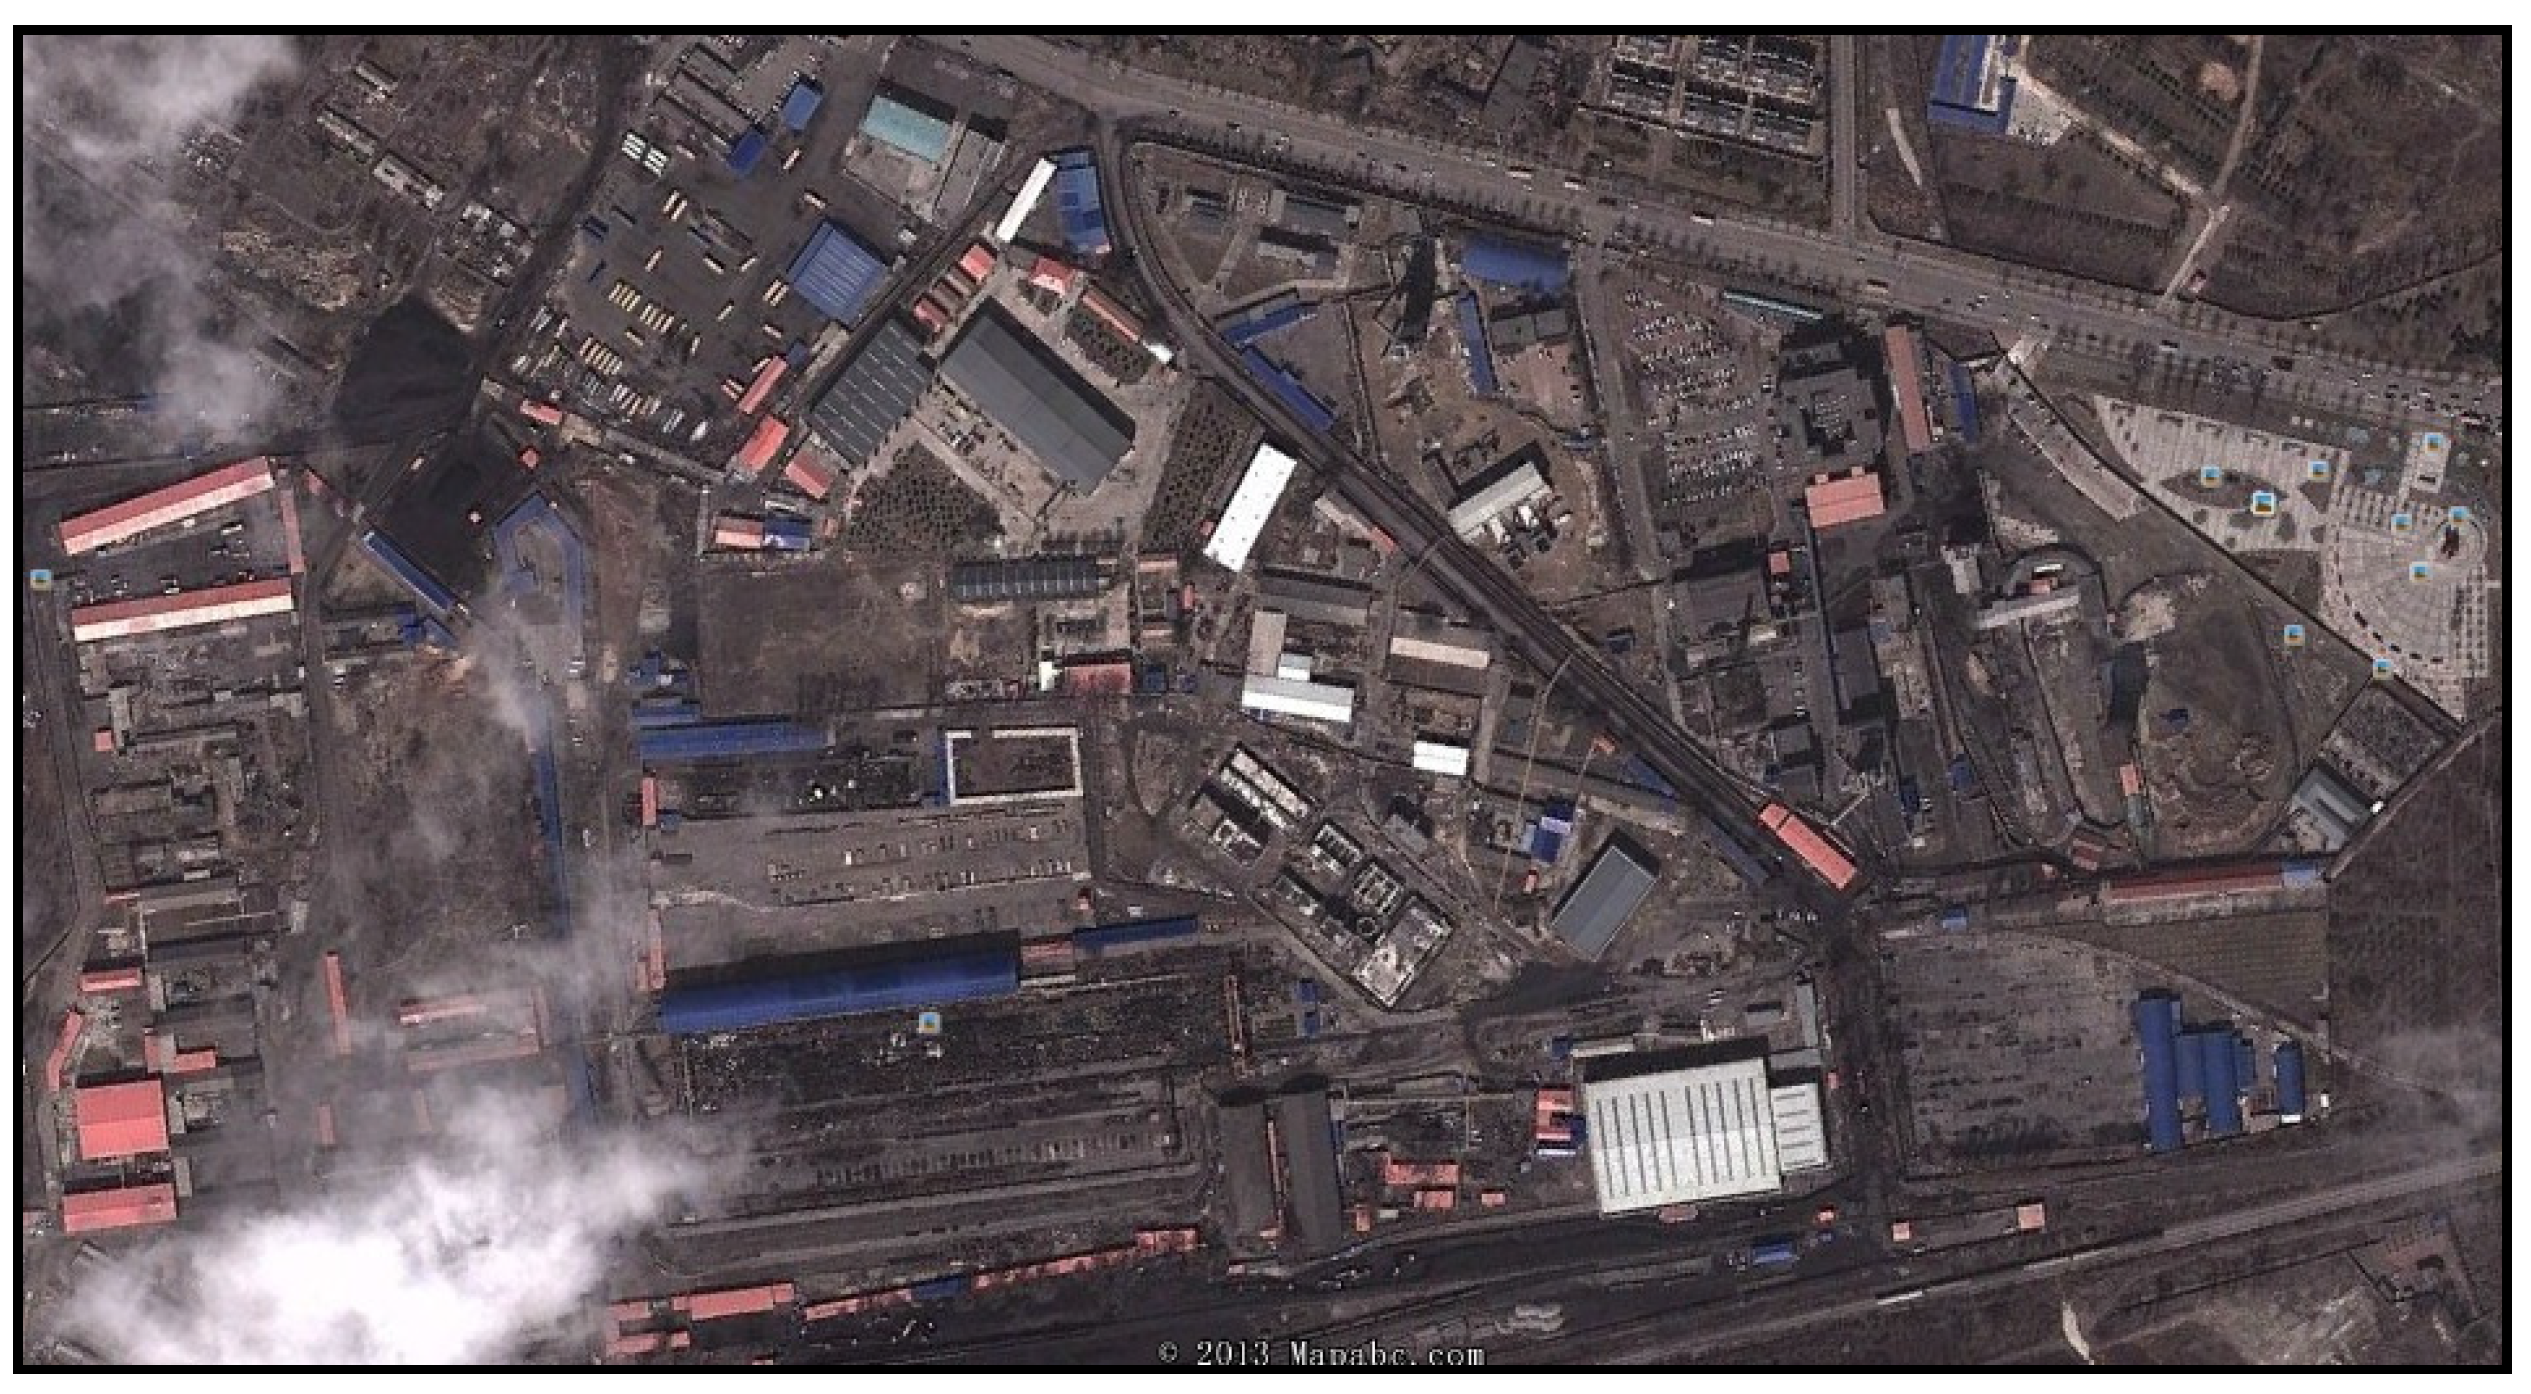
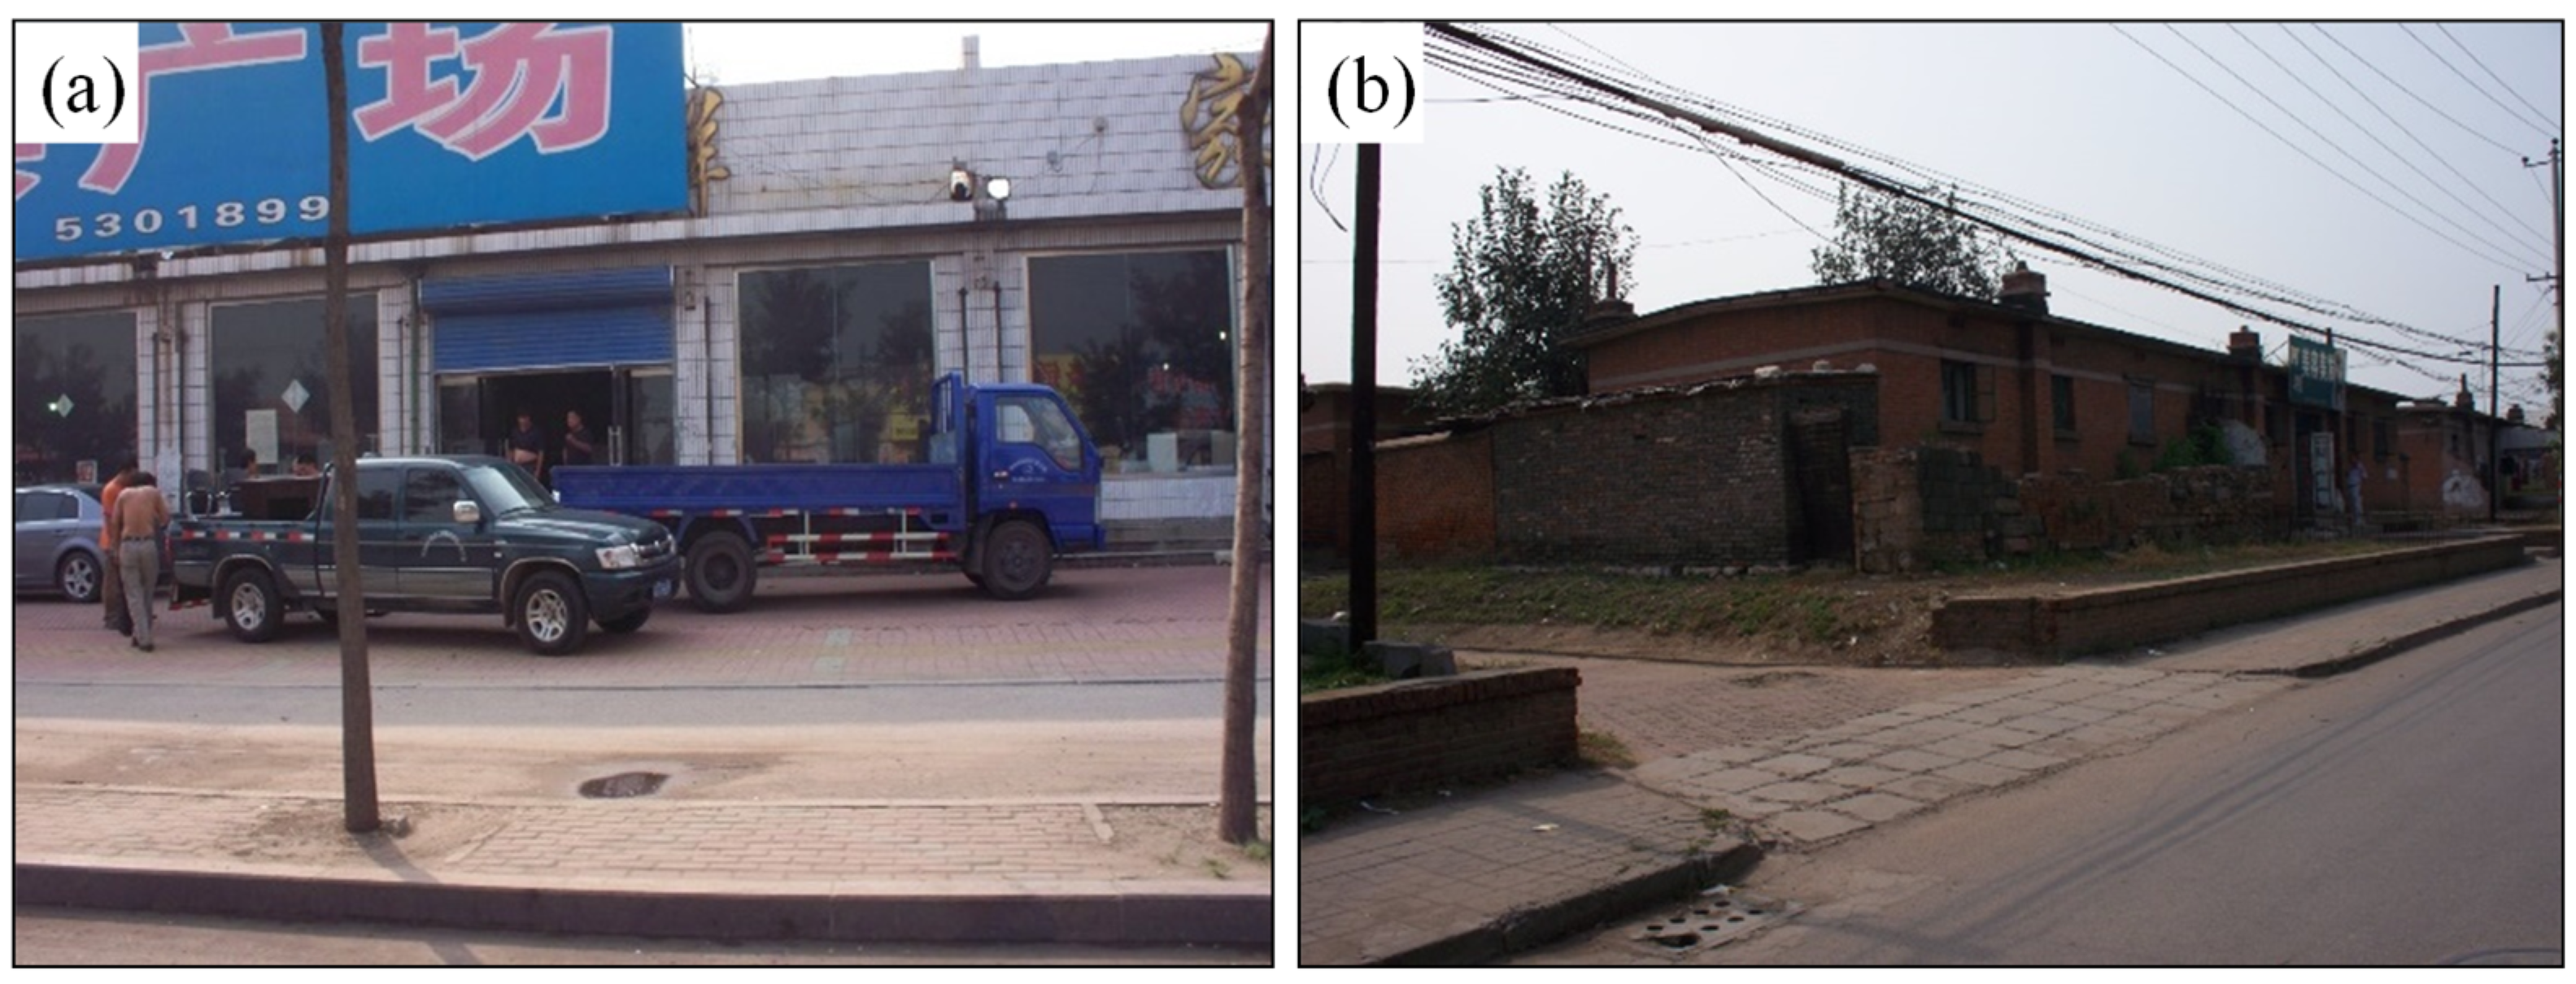
2.2. Surface Buildings and Structures and Control Criterion

The backfill panel is in the Tiesan area of the Tangshan Coal Mine. Surface buildings and structures in the area mainly include different types of companies, factories, commercial wholesale and retail outlets, and large, densely-populated residential areas newly constructed after the magnitude 7.8 Tangshan Earthquake (1976). The buildings have diverse dimensions, plan layouts, and structures, while they are mainly one-story houses with brick-concrete or masonry-timber structures (Figure 2). According to incomplete statistics, more than 800 enterprises and public institutions are based in the area, covering a building area of 1.8 × 10⁶ m2 and having a population of about 9 × 10⁴. Above the backfill panel is the eastern area of Lunan District of Tangshan City, where South Jianshe Road passes over the panel. Kailuan Coal Mining Administration and Labour Service and Construction Decoration Company are located directly above the backfill panel.
According to conditions of surface buildings and structures in the Tiesan area and the severity of damage to brick-concrete-structured buildings, the damage of backfill mining to surface buildings needs to be controlled below class-II damage (slight damage) to ensure normal use of these buildings and structures. In the meanwhile, buildings in the Tiesan area are also characterized by their dense distribution, unequal quality, and complex tenure. Considering these, the compressive and tensile deformation when surface buildings have class-II damage should not exceed −2.0 mm/m and 1.5 mm/m, respectively. Considering that excessive subsidence may cause poor drainage in the city, the surface subsidence should not exceed 500 mm.

3. Creep Compression Characteristics of Gangue Backfill Materials

3.1. Specimen Preparation and Test Schemes

The test specimens were broken coal gangue that was directly collected from Tangshan Coal Mine and then prepared in the laboratory. The coal gangue was mainly sandstone. To prepare the specimens, the coal gangue needed to be broken into particles with different particle sizes smaller than 30 mm. The breakage included two steps: firstly, the coal gangue was broken to particles smaller than 50 mm manually with a hammer; then a stone crusher was used to crush the manually broken coal gangue down to 30 mm to ensure homogeneity of broken coal gangue blocks. Standard stone screens were used to sieve the broken coal gangue level by level, and the coal gangue was divided into six groups with particle sizes of 0 to 5, 5 to 10, 10 to 15, 15 to 20, 20 to 25, and 25 to 30 mm. Then, coal gangue with different particle sizes was mixed to prepare the specimens.
The multi-stage loading mode was adopted in creep compression tests on gangue backfill materials. According to the field conditions of backfill mining and the lateral tamping function of backfill hydraulic supports, the lateral stress and the number of lateral loadings were separately set to be 2 MPa and 5 MPa. Meanwhile, four-stage loading was carried out in the creep compression tests at loading stress levels of 5, 10, 15, and 20 MPa to taking in situ stress of the coal seam at different burial depths into account. The loading applied in each stage was maintained for 60 h.

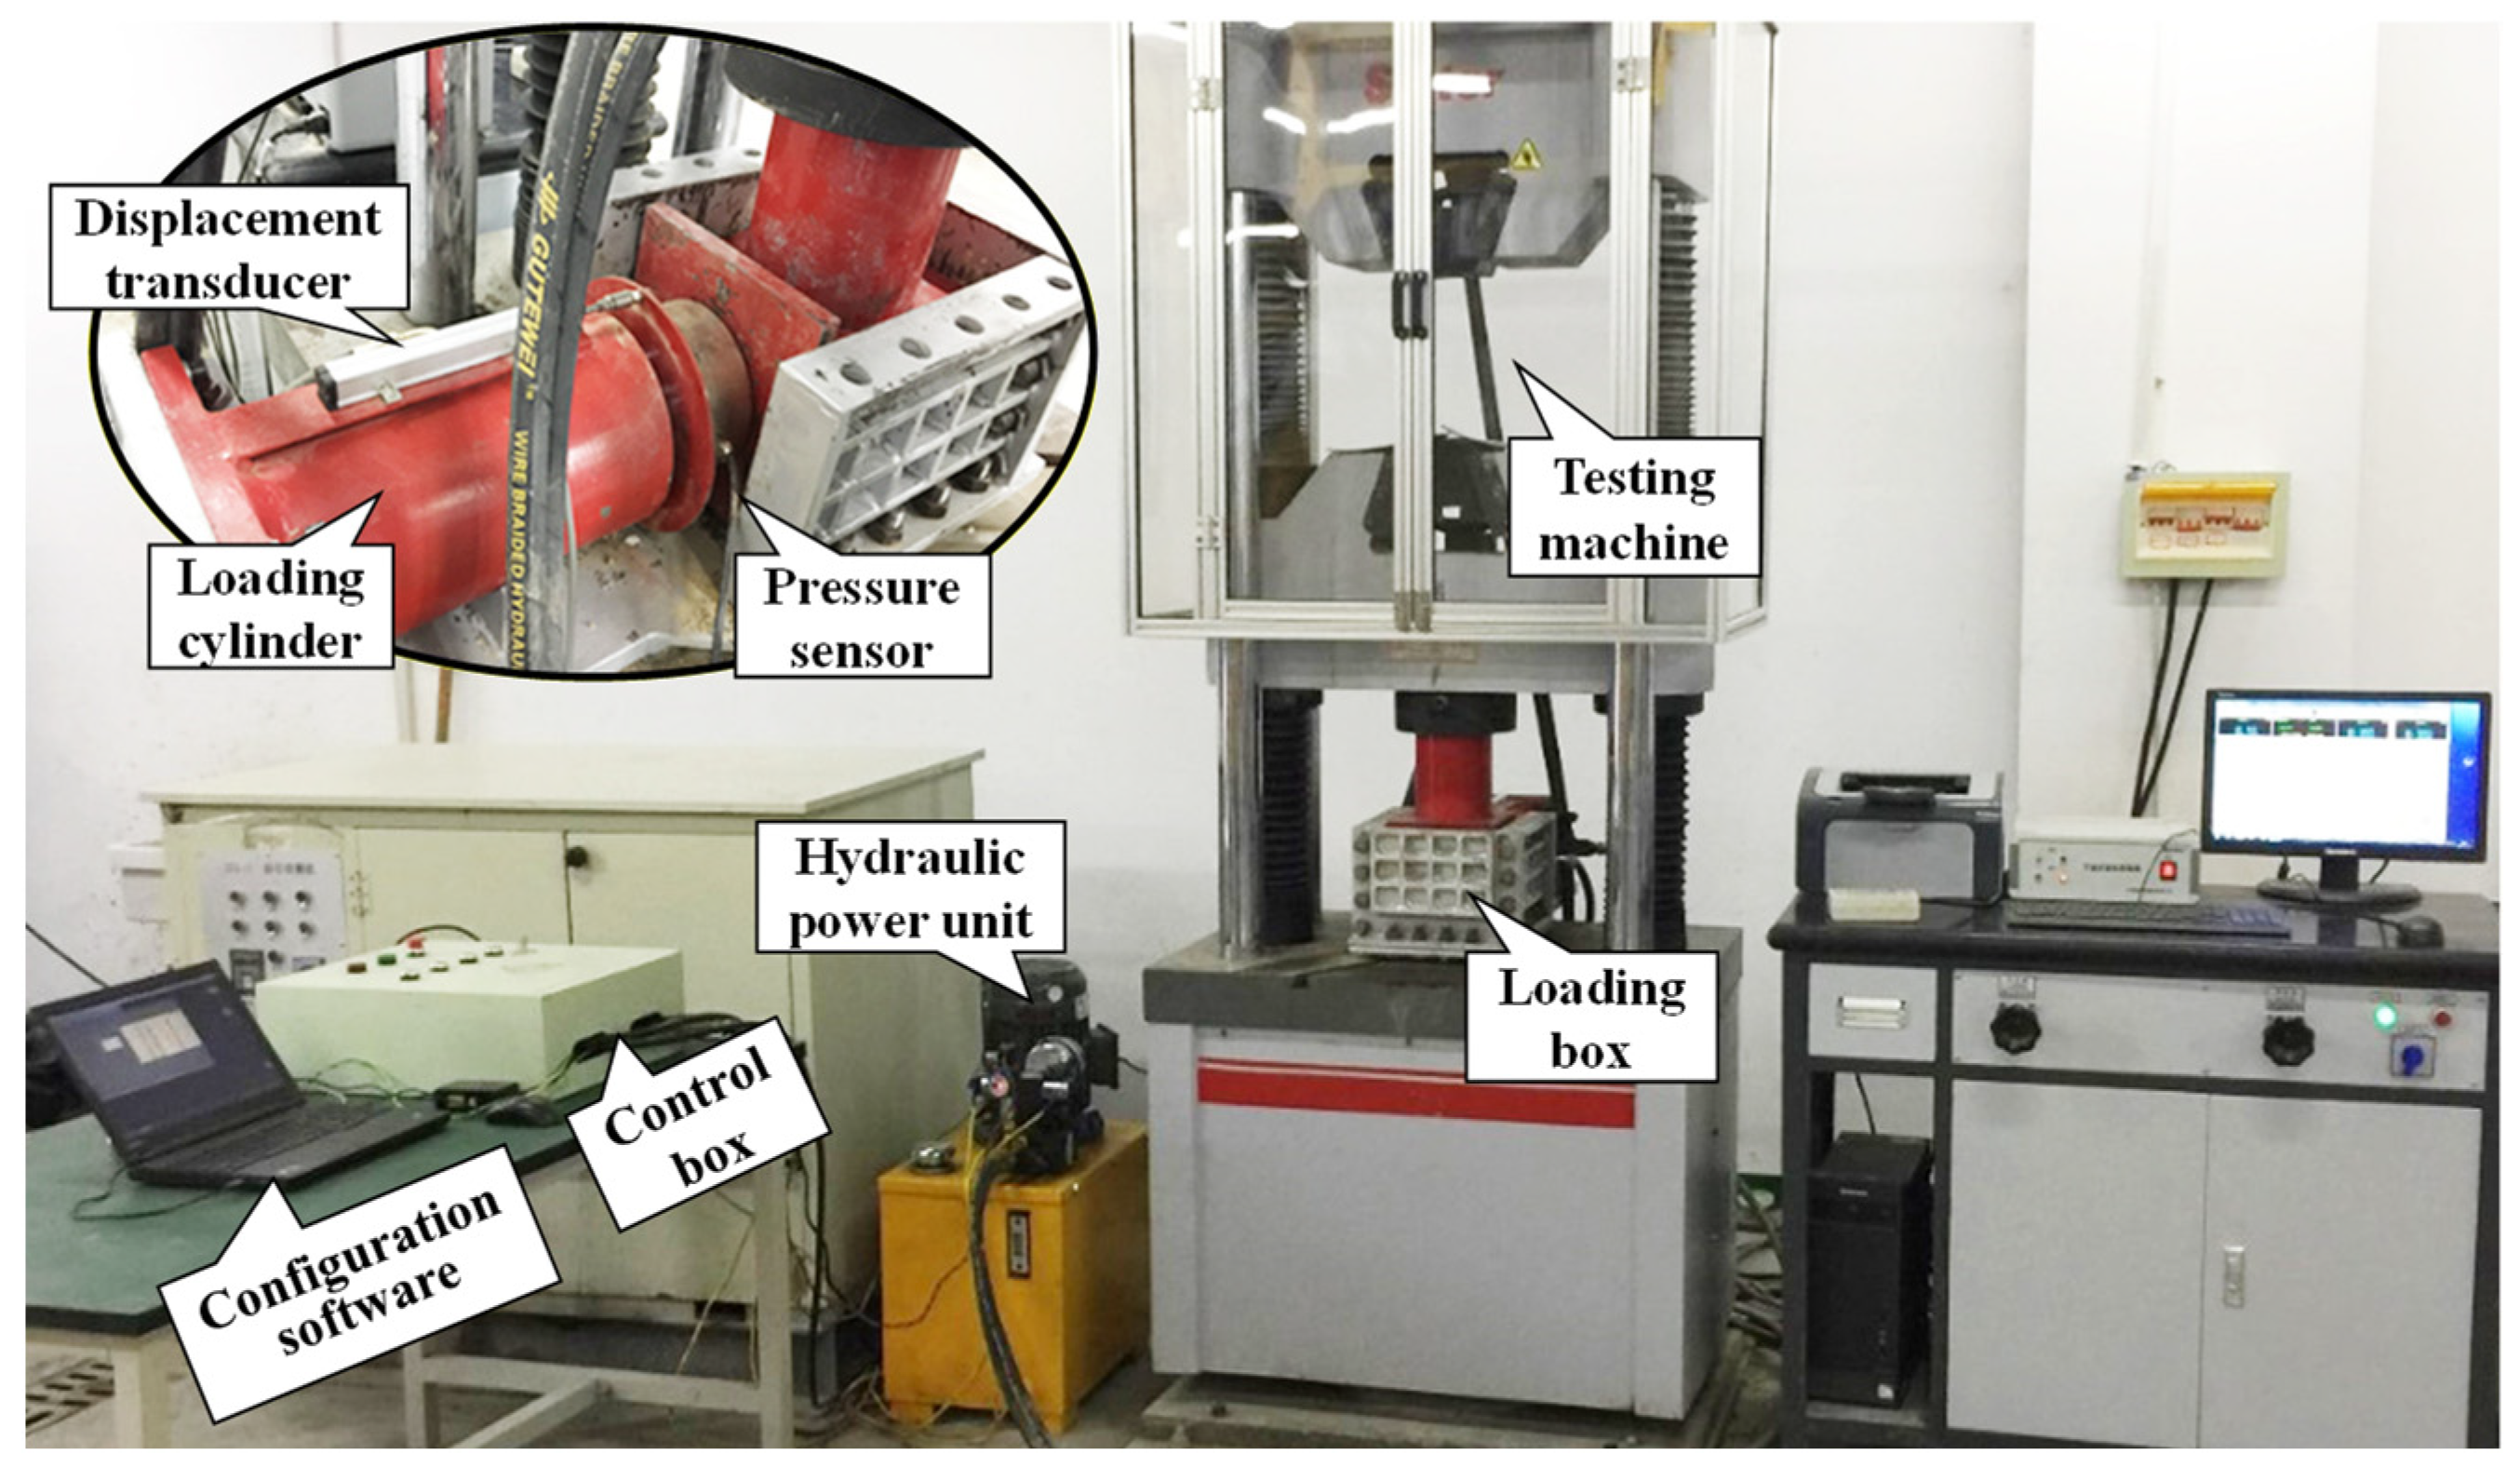
3.2. Test Devices and Test Procedure

The self-made loading test device for granular backfill materials was used to measure the creep compression characteristics of gangue backfill materials [34,35]. The system mainly consists of four parts: an axial loading system, a loading box, a lateral loading system, and a data-monitoring and acquisition system (Figure 3).
The axial loading system mainly comprised a WAW-1000D electro-hydraulic servo-motor universal testing machine, which could provide the maximum axial load of 1000 kN with a stroke of 0 to 250 mm. The loading box provided space for loading backfill materials, and its effective space measured 250 mm × 200 mm × 200 mm (length × width × height). The lateral loading system was composed of a hydraulic power unit, a loading cylinder, and a control box. The stroke range and maximum lateral pressure of the loading cylinder were 0 to 100 mm and 7 MPa, respectively. The data-monitoring and acquisition system, consisting of a displacement transducer, a pressure sensor, MCGS configuration software, and a laptop, could monitor changes in the pressure and displacement in the test process and acquire and store data (all in real time).
The specific test steps are described as follows:
  • Preparing specimens of gangue backfill materials
The preparation procedure is described in Section 3.1.
2.
Putting prepared specimens of gangue backfill materials in the loading box in layers
The prepared specimens were placed in the loading box in three to six layers. The specimens were pre-loaded after placing each layer until loading all layers of specimens in the box. The total height of each group of specimens in the tests was 200 mm, and the mass of specimens loaded in each group was recorded.
3.
Lateral loading and unloading of specimens of gangue backfill materials
Lateral loading and unloading were conducted on specimens of gangue backfill materials according to the lateral stress set in the test schemes. The lateral pressure and displacement in the process were monitored in real time and recorded.
4.
Axial multi-stage loading of specimens of gangue backfill materials.
After lateral loading and unloading, the testing machine was used to perform axial multi-stage loading on the specimens of gangue backfill materials, and the axial pressure and displacement in the process were monitored and recorded in real time.

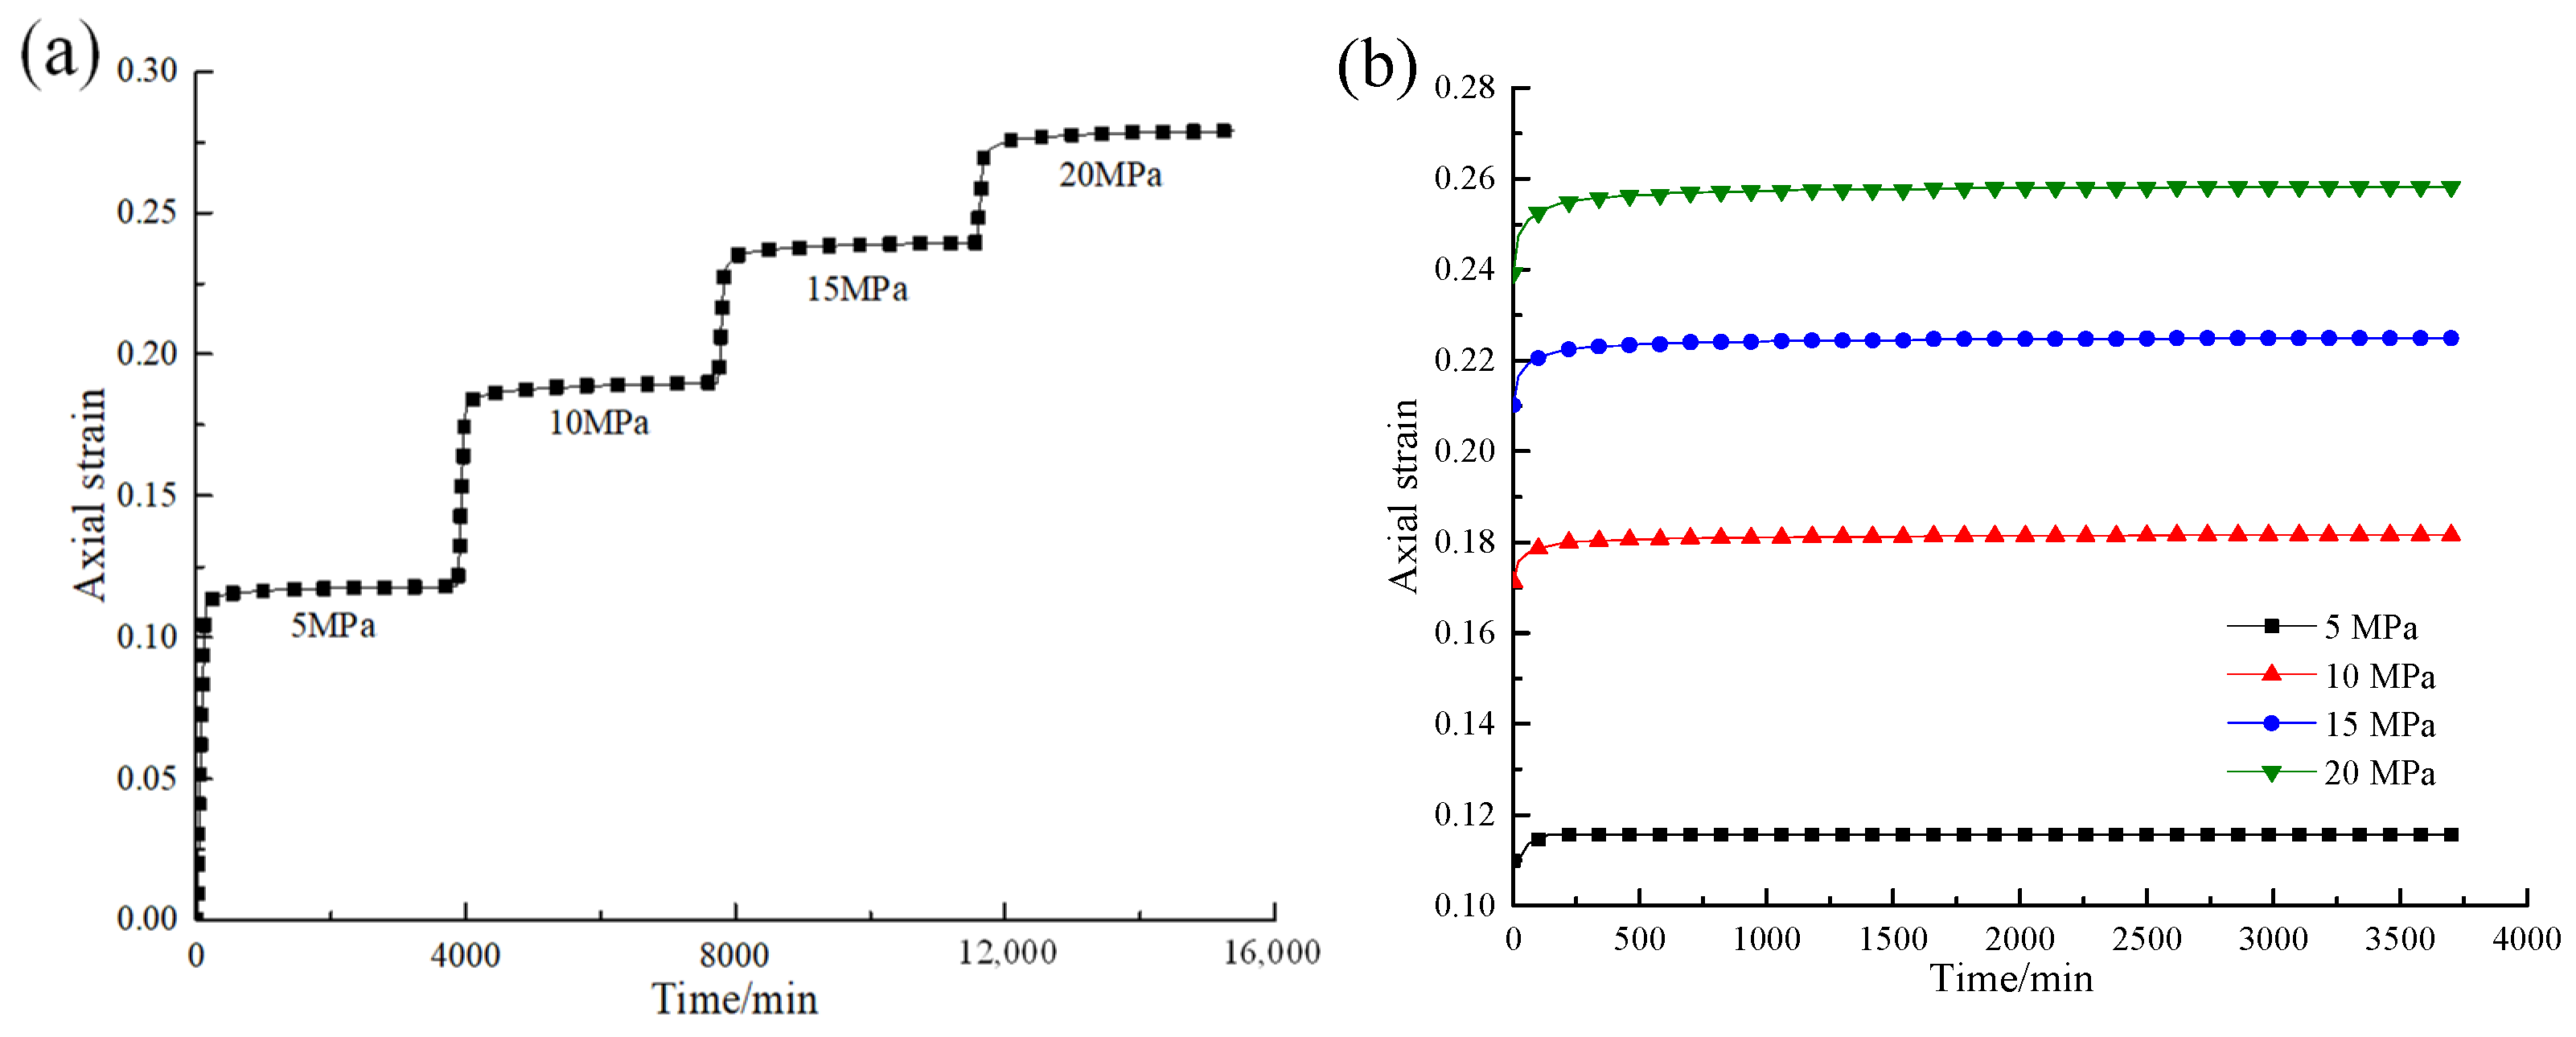
3.3. Analysis of Test Results

Multi-stage creep compression tests were conducted on gangue backfill materials (Figure 4a). The creep test data were processed using Chen’s method [36,37], thus attaining the creep compression curve clusters of gangue backfill materials (Figure 4b).
Analysis of Figure 4 shows the creep curves of specimens of gangue backfill materials at each applied stress include instantaneous deformation, attenuated creep deformation, and steady creep deformation. At a low applied stress, the deformation rate of creep curves begins to attenuate after experiencing instantaneous deformation, and then, after a period of time, the specimens enter a steady creep stage at a rate of zero, whereafter the creep deformation does not change any longer. At a high stress, the creep rate of creep curves begins to attenuate after experiencing instantaneous deformation. In time, the curves also enter the steady creep stage at a non-zero rate (i.e., low rate and small deformation).
As the applied load increases, the instantaneous strain and creep strain in specimens both increase gradually. As the loading stress increases from 5 MPa to 10, 15, and 20 MPa, the instantaneous strain of gangue backfill materials grows to 1.56, 1.91, and 2.17 times the original value, and the creep strain rises to 2.37, 3.67, and 4.96 times the original value.

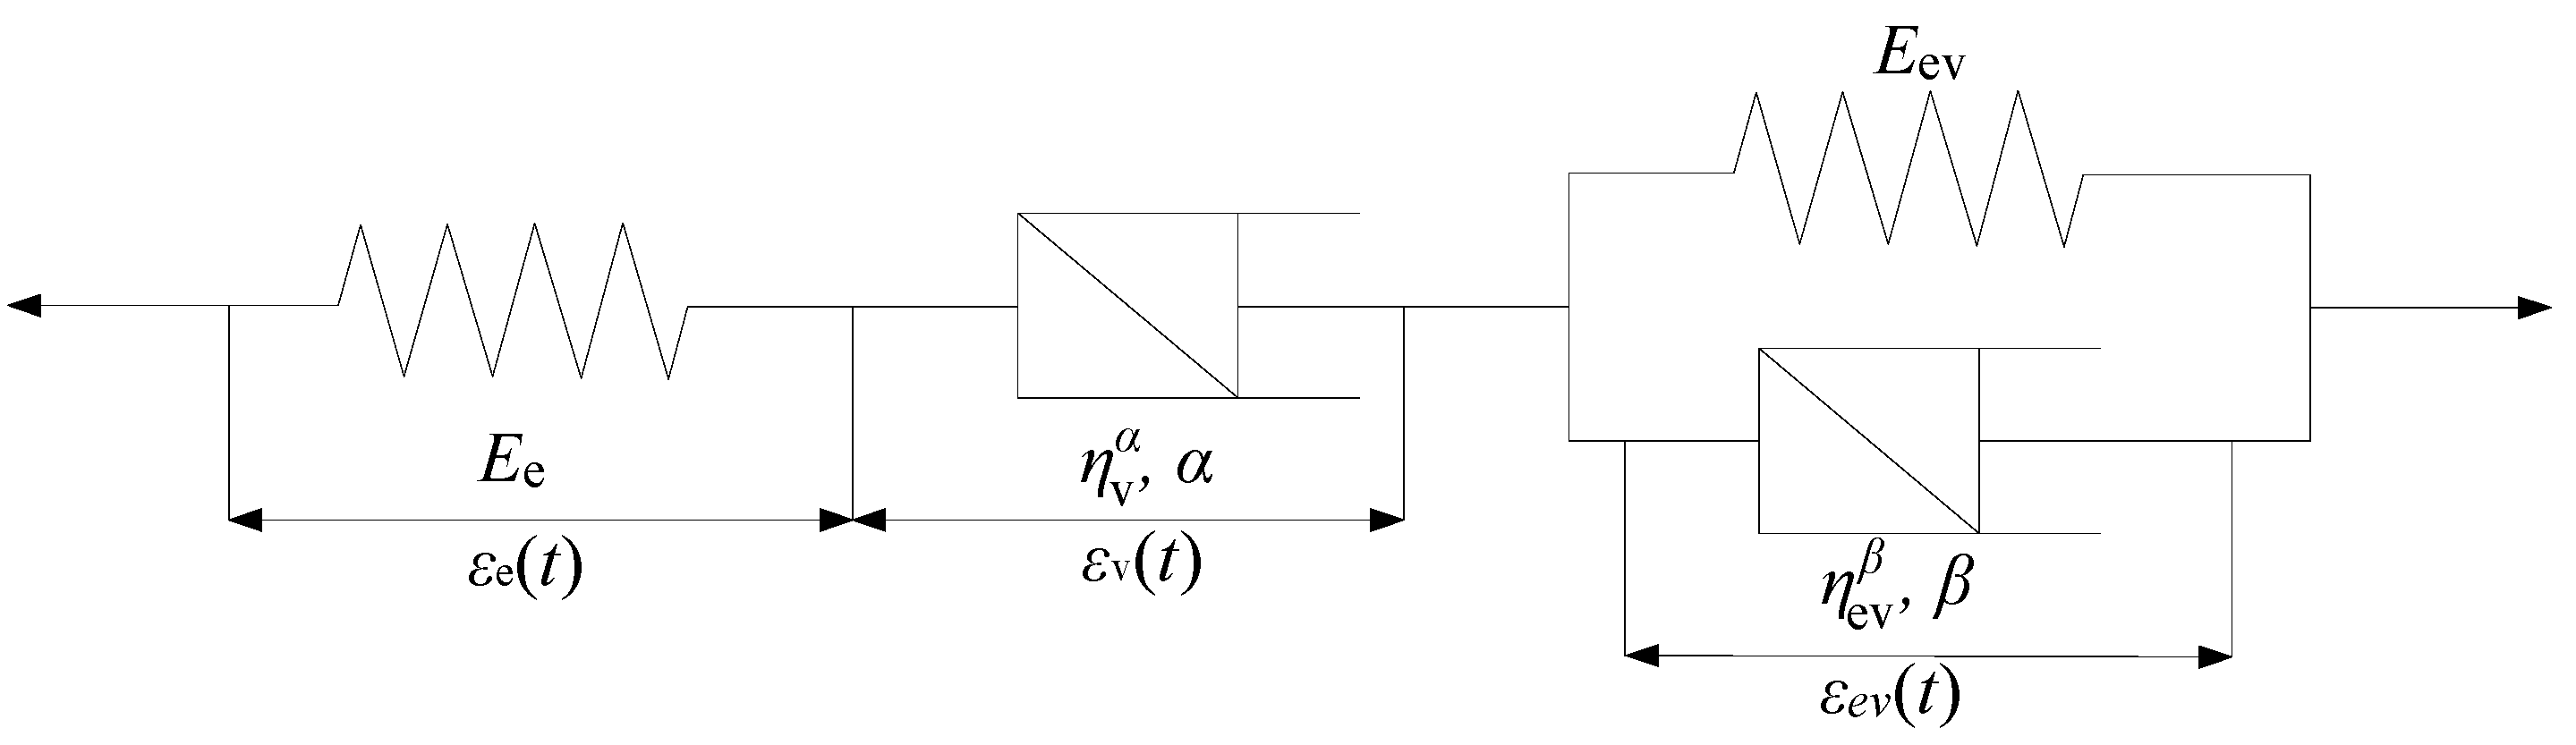
3.4. Constitutive Equation of Compression

There is no significant accelerated creep stage in the creep curves of the gangue backfill materials. Therefore, compressive creep deformation characteristics of gangue backfill materials can be described using the traditional Burgers’ model. However, there is a significant creep effect with time in the compression process of gangue backfill materials. The better to describe the non-linear progressive changes of creep curves of gangue backfill materials, the dashpot in the traditional Burgers’ model was replaced with an Abel dashpot. The fractional order was used to reflect the constant change in parameters of mechanical elements with time.
The improved fractional Burgers’ model consists of the fractional Maxwell model and fractional Kelvin model [38], and the structure of the model is illustrated in Figure 5.
According to the combination principle of basic elements, the total strain, ε, of the fractional Burgers’ model is the sum of strain of the fractional Maxwell model and fractional Kelvin model. The total stress, σ, is equal to the stress on the fractional Maxwell model and that on the fractional Kelvin model. The state equation of the fractional Burgers’ model is:
{ σ e = E e ε e ( t ) σ ev = η v α d α ε v ( t ) d t α   0 α 1 σ ev = E ev ε ev ( t ) + η ev β d β ε ev ( t ) d t β   0 β 1 ε = ε e + ε v + ε ev σ = σ e = σ v = σ ev
where Ee and Eev separately represent elastic moduli; η v α and η e v β are viscosity coefficients; α and β are fractional orders; t denotes the creep duration; εe(t), εv(t), and εev(t) represent the strain of elastic, viscous, and visco-elastic elements, respectively.
Equation (1) is solved, and the constitutive equation of the fractional Burgers’ model is obtained:
( E ev + β d β d t β + E e α ( d α d t α ) E e + α ( d α d t α ) ) σ ( t ) = ( ( E ev + β ( d β d t β ) ) E e α ( d α d t α ) E e + α ( d α d t α ) ) ε ( t )
When σ(t) = σ0, the creep equation of the fractional Burgers’ model is obtained by solving Equation (2).
ε ( t ) = σ 0 E e + σ 0 η v α t α Γ ( 1 + α ) + σ 0 η ev β t β E β , β + 1 ( E ev η ev β t β )
Combined with elasto-plastic mechanics, at the same time, stresses in both the x- and y-directions are the same in the creep compression process of gangue backfill materials, and then the following relationship is met:
σ = σ 1 = λ σ 2 = λ σ 3
where λ denotes the coefficient of lateral pressure, which can be measured in the creep compression test.
According to the properties of Mittag-Leffler function [39], the three-dimensional (3-d) creep equation of the fractional Burgers’ model is deduced to be
ε ( t ) = σ v ( 1 + 2 λ ) 9 K e + σ v ( 1 λ ) 3 G e + 2 σ v ( 1 λ ) 3 η v α t α Γ ( 1 + α ) + σ v ( 1 λ ) 3 G ev ( 1 e G ev η ev β t β )
where Ke represents the bulk modulus; Ge and Gev are shear moduli.
The creep data of gangue backfill materials were subjected to non-linear fitting, and the parameters of the fractional Burgers’ model were identified. Moreover, the model was compared with the traditional Burgers’ model (Figure 6).
Analysis of Figure 6 shows the traditional Burgers’ model and the fractional Burgers’ model both can reflect the trend of creep characteristic curves of gangue backfill materials. However, comparison reveals the theoretical curves obtained using the fractional Burgers’ model have better goodness of fit with the test data. The result indicates the established fractional Burgers’ model is more applicable to revealing creep characteristics of gangue backfill materials, which further verifies the reasonability of the fractional Burgers’ model.

4. Numerical Simulation of Surface Deformation Induced by Backfill Mining

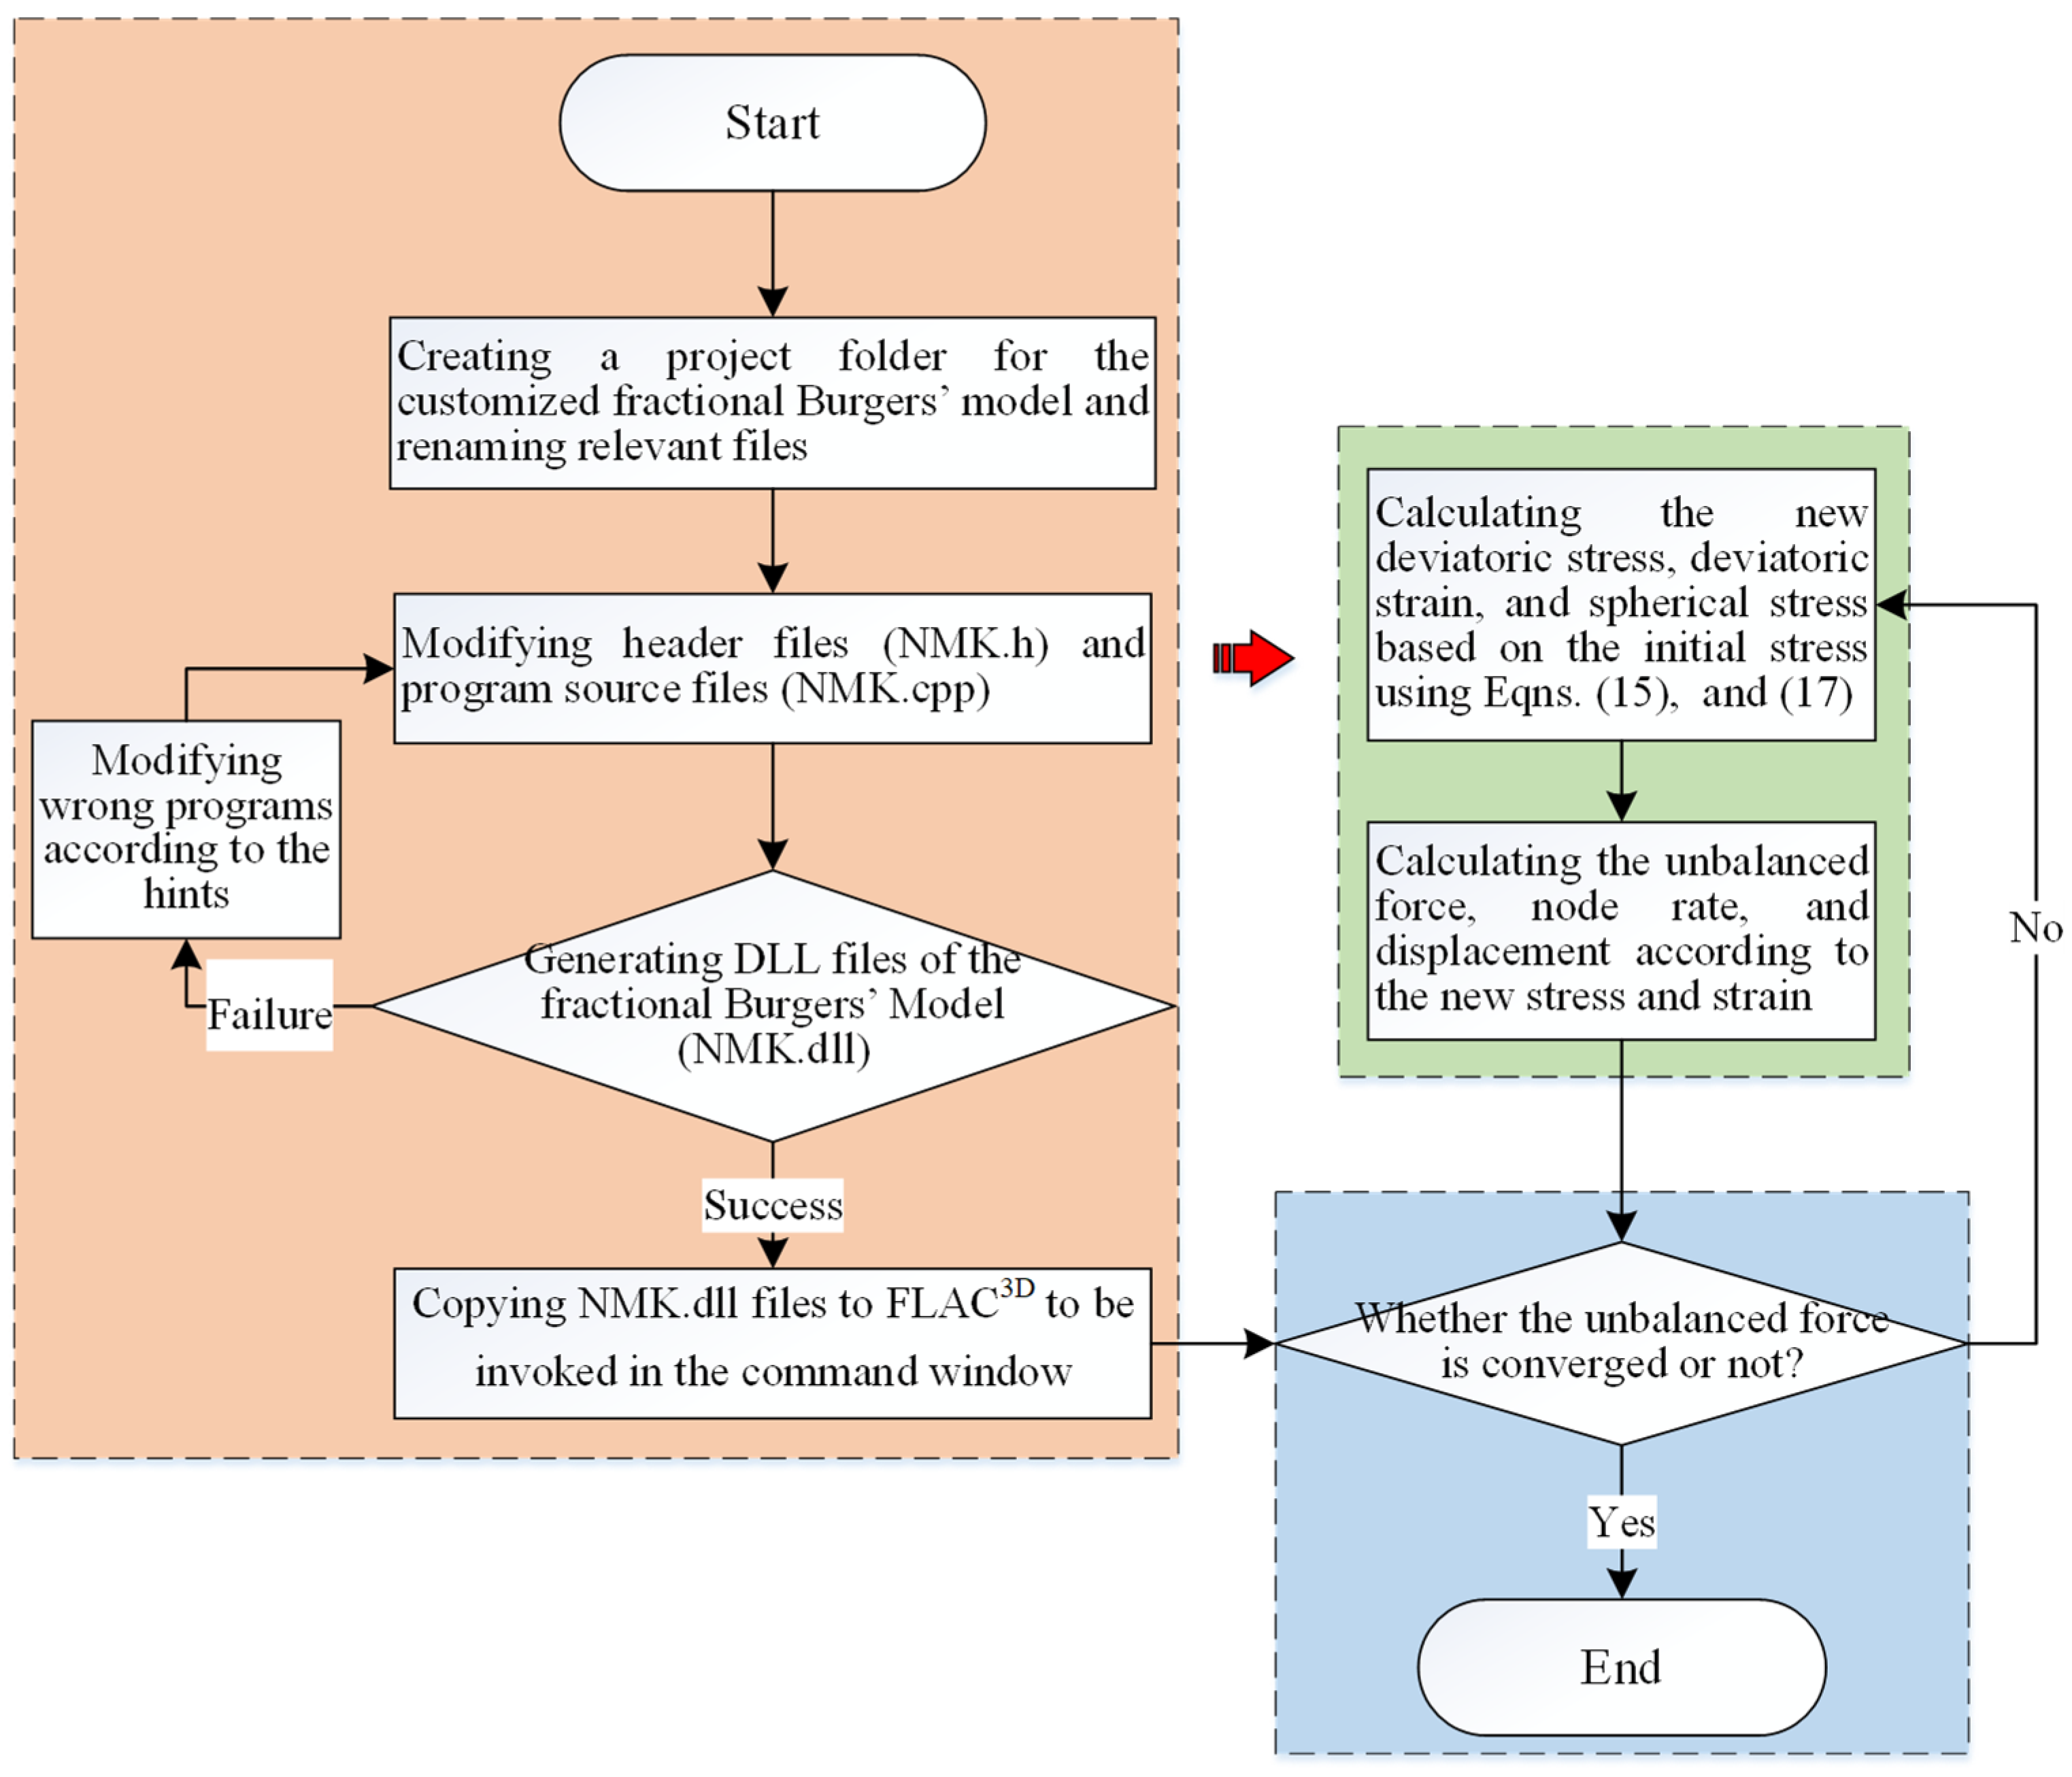
4.1. Simulation Methods of Gangue Backfill Materials

FLAC3D was used for secondary development of the fractional Burgers’ model; however, FLAC3D is based on use of the Lagrangian difference method [40,41]. Therefore, to realize the secondary development and utilization of a fractional Burgers’ model in FLAC3D, the 3-d creep equation of the fractional Burgers’ model needs to be transformed into a finite difference scheme.
The total strain ε of the fractional Burgers’ model is the sum of the strain of the fractional Maxwell and fractional Kelvin models; the total stress, σ, of the fractional Burgers’ model is equal to the stress on the fractional Maxwell model and that on the fractional Kelvin model:
{ S ij = S ij e = S ij v = S ij ev e ij = e ij e + e ij v + e ij ev
where S ij e , S ij v , and S ij ev separately represent the deviatoric stress on elastic elements, Abel dashpots, and fractional Kelvin model; e ij e , e i j v , and e i j e v denote the deviatoric strain of the deviatoric stress of elastic elements, Abel dashpots, and fractional Kelvin model, respectively.
The rate of change of the total deviatoric strain of the fractional Burgers’ model is
e ˙ i j = e ˙ i j e + e ˙ i j v + e ˙ i j e v
To facilitate numerical realization of the fractional Burgers’ model, Equation (7) is rewritten in incremental form:
Δ e ij = Δ e ij e + Δ e ij v + Δ e ij ev
The approximate difference scheme of the Riemann–Liouville fractional calculus is introduced
D ˜ β f ( t ) = Δ h β f ( t ) h β = f ( t ) Γ ( 1 + β ) Γ ( β ) h β = f ( t ) β f ( t h ) h β
The constitutive equation of the fractional Maxwell model is
e ˙ i j e + e ˙ i j v = S ˙ i j e 2 G e + S i j v 2 η v α
The constitutive equation of the fractional Kelvin model is
S i j e v = 2 G e v e i j v + 2 η e v β e ˙ i j e v
By changing Equation (10) into a central difference scheme, the following is obtained:
Δ e ij e + Δ e ij v = Δ S ij e 2 G e + S ¯ ij v Δ t α 2 η v α
Similarly, Equation (11) is also converted into the central difference scheme, and the following is attained:
S ¯ ij ev Δ t β = 2 G ev e ¯ ij ev Δ t + 2 η ev β Δ e ij ev
In Equations (12) and (13),
{ S ¯ ij = ( S ij N + S ij O ) / 2 e ¯ ij = ( e ¯ ij N + e ¯ ij O ) / 2 Δ e ij K k = e ij K k N e ij K k O Δ S ij K k = S ij K k N S ij K k O
where S i j N and S i j O separately represent the current and previous deviatoric stress tensors in a time step; e i j K k N and e i j K k O separately denote the current and previous deviatoric strain tensors in a time step; Kk is the Kkth part of the element model connected in tandem.
By solving Equations (12)–(14) simultaneously, the following relationships of current and previous deviatoric strain tensors in a time step in the fractional Burgers’ model can be obtained:
{ Δ e ij e = ( S ij e N - S ij e O ) / 2 G e Δ e ij v = ( S ij v N + S ij v O ) Δ t α / 4 η v α Δ e ij ev = ( ( S ij ev N + S ij ev O ) Δ t β + ( D / C 1 ) e ij ev O ) / C
C and D in Equation (15) have the following relationship:
{ C = 4 η ev β + 2 G ev Δ t β D = 4 η ev β 2 G ev Δ t β
By substituting Equation (15) into Equation (8) and combining the result with Equation (14), the relationship between the current and previous deviatoric stress tensors in a time step in the fractional Burgers’ model can be derived:
S ij N = 1 E ( Δ e ij + F S ij O ( D / C 1 ) e ij ev O )
E and F in Equation (17) satisfy the following relationship:
{ E = Δ t α C + 1 2 G v + Δ t α 4 η v α F = 1 2 G v Δ t α C + Δ t α 4 η v α
The fractional Burgers’ model is realized using object-oriented C++ programming. After compilation, the dynamic link library (DLL) files are generated and embedded in the numerical simulation software, FLAC3D, to be invoked by users. Based on the built-in Burgers constitutive model of FLAC3D, the fractional Burgers’ model is then developed, including three parts: modifying header files (.h files), modifying program source files (.cpp files), and generating DLL file (.dll).
In FLAC3D, the newly developed fractional Burgers’ model is invoked. The whole calculation is to calculate the new deviatoric stress, deviatoric strain, and spherical stress based on the initial stress using Equations (15) and (17); then, the unbalanced force, node rate, and displacement are calculated based on the new stress and strain and whether the unbalanced force is converged or not is judged. If the unbalanced force has converged, the calculation ends; otherwise, it returns to continue the next round of calculation.
The secondary development flowchart of the fractional Burgers’ model in FLAC3D is illustrated in Figure 7.
To test correctness of the secondarily developed fractional Burgers’ model, example verification was performed through numerical simulation under conditions identical to those used in the creep compression tests. The shape and dimensions of the model were the same as the specimens in the creep compression tests. Horizontal constraints were applied to as boundary conditions of four-side walls, the vertical constraint was applied to the bottom boundary, and axial stress was applied to the top boundary. The axial stresses applied in different stages were 5, 10, 15, and 20 MPa, respectively. The calculation model is shown in Figure 8.
Parameters of the fractional Burgers’ model are those identified by conducting creep compression tests (Table 1). By applying different levels of axial stress to the calculation model, the compressive creep deformation of the model can be simulated because the vertical displacement on the bottom boundary of the model was constrained and load was applied on the top boundary, the vertical displacement of the top differs from that of the bottom, and the closer to the bottom, the smaller the vertical displacement. By using the fractional Burgers’ model, the vertical displacements at the top were found to be 23.43, 36.48, 45.32, and 51.94 mm, which are consistent with the test results.
Meanwhile, the vertical displacement at monitoring points on the top of the model was monitored and recorded in the calculation process, and it was converted to the vertical strain of the model for comparison with creep curves of specimens obtained from creep compression tests (Figure 9).
Analysis of Figure 9 reveals the curves in the creep compression tests of gangue backfill materials have a similar trend to those of numerical simulation results: they both enter the steady creep stage after the attenuated creep stage, and the vertical strain remains unchanged thereafter. The result indicates the proposed fractional Burgers’ model can describe the creep compressive deformation characteristics of the gangue backfill materials, and it can be applied in engineering practice.

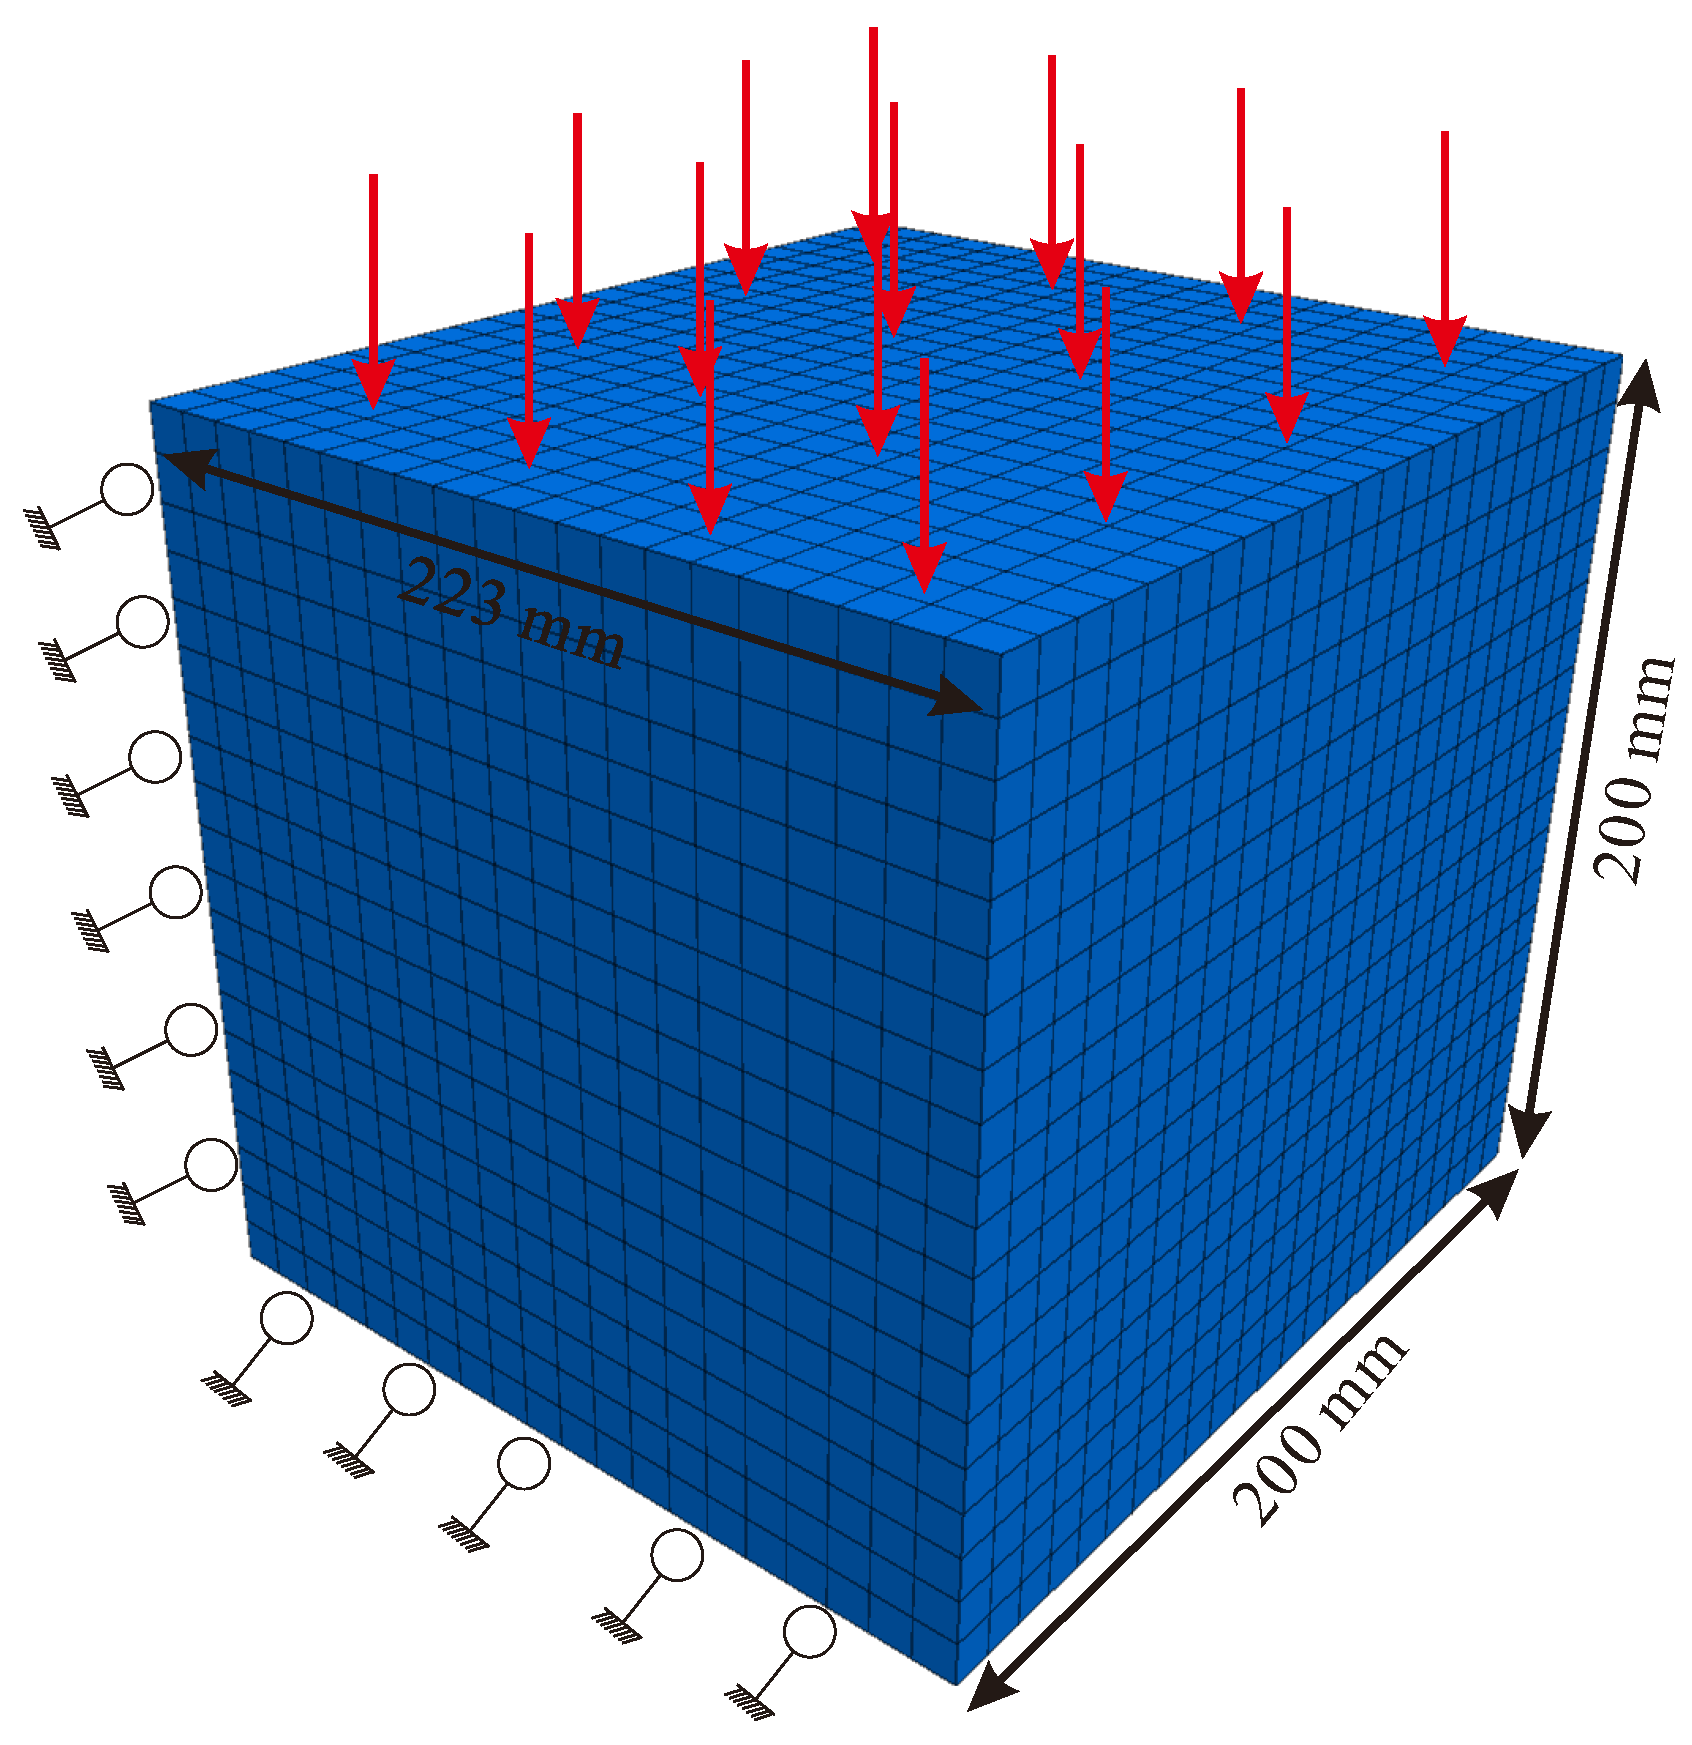
4.2. Model Establishment and Simulation Schemes

According to the specific geological conditions of the backfill panel in Tangshan Coal Mine and combined with the stratal movement characteristics, a model measuring 1500 m × 1200 mm × 725 m (length × width × height) was established. For the convenience of mesh generation, the thicknesses of the strata were rounded according to the actual conditions, and the grids of strata near the surface were refined. A total of 4,220,601 nodes and 4,140,000 elements were generated in the model. Horizontal constraints were applied to four sides of the model, the horizontal and vertical constraints were applied to the bottom boundary, and no constraint and load were applied to the top boundary. The Mohr–Coulomb model was adopted to coal, and the fractional Burgers’ model was used for the backfill. The numerical model is displayed in Figure 10.
The coal seam mined in the backfill panel was buried at an average depth below ground of 725 m, where the in situ stress was about 18 MPa. Therefore, the compressive creep deformation of gangue backfill materials was measured under an axial stress of 18 MPa. The fractional Burgers’ model was used for parameter identification of test data (Table 2), and the identified parameters were used as values of parameters of the backfill in the numerical simulation.
The mining and backfilling were simulated based on the actual conditions of the backfill panel. The surface deformation 30, 60, 90, 180, 270, and 360 d after mining and backfilling was simulated. Two measuring lines were arranged at central positions along the dip and strike directions of the backfill panel on the surface to monitor the horizontal and vertical displacement along the measuring lines.

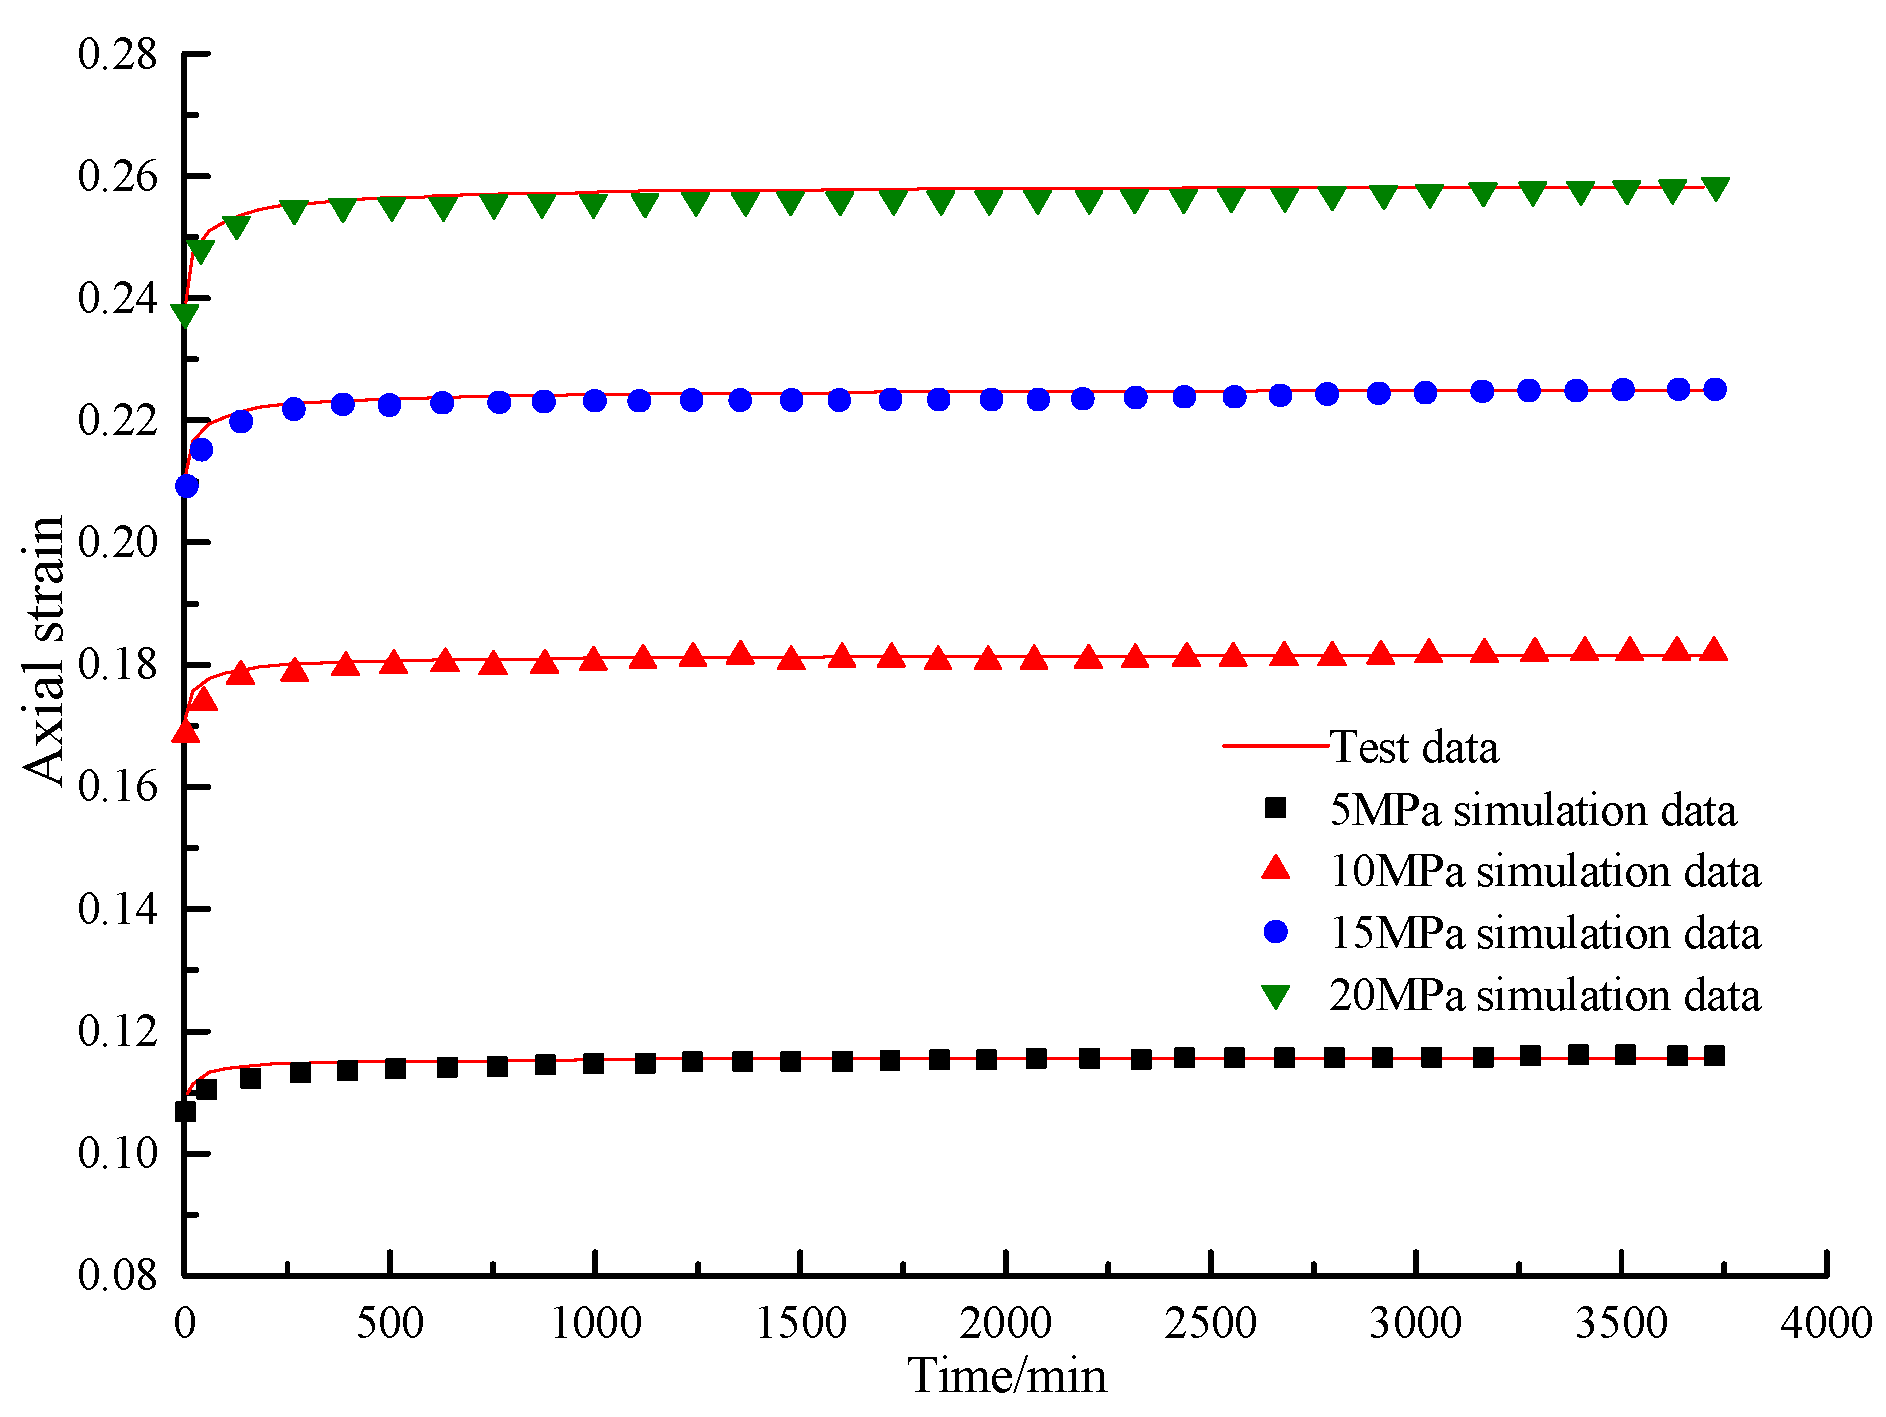
4.3. Simulation Results and Analysis

According to the simulation results for surface deformation above the backfill panel, 3-d mapping software was adopted to process the simulation data, thus obtaining 3-d surfaces representing the surface subsidence after different creep durations (Figure 11).
According to the analyses of Figure 11 and Figure 12:
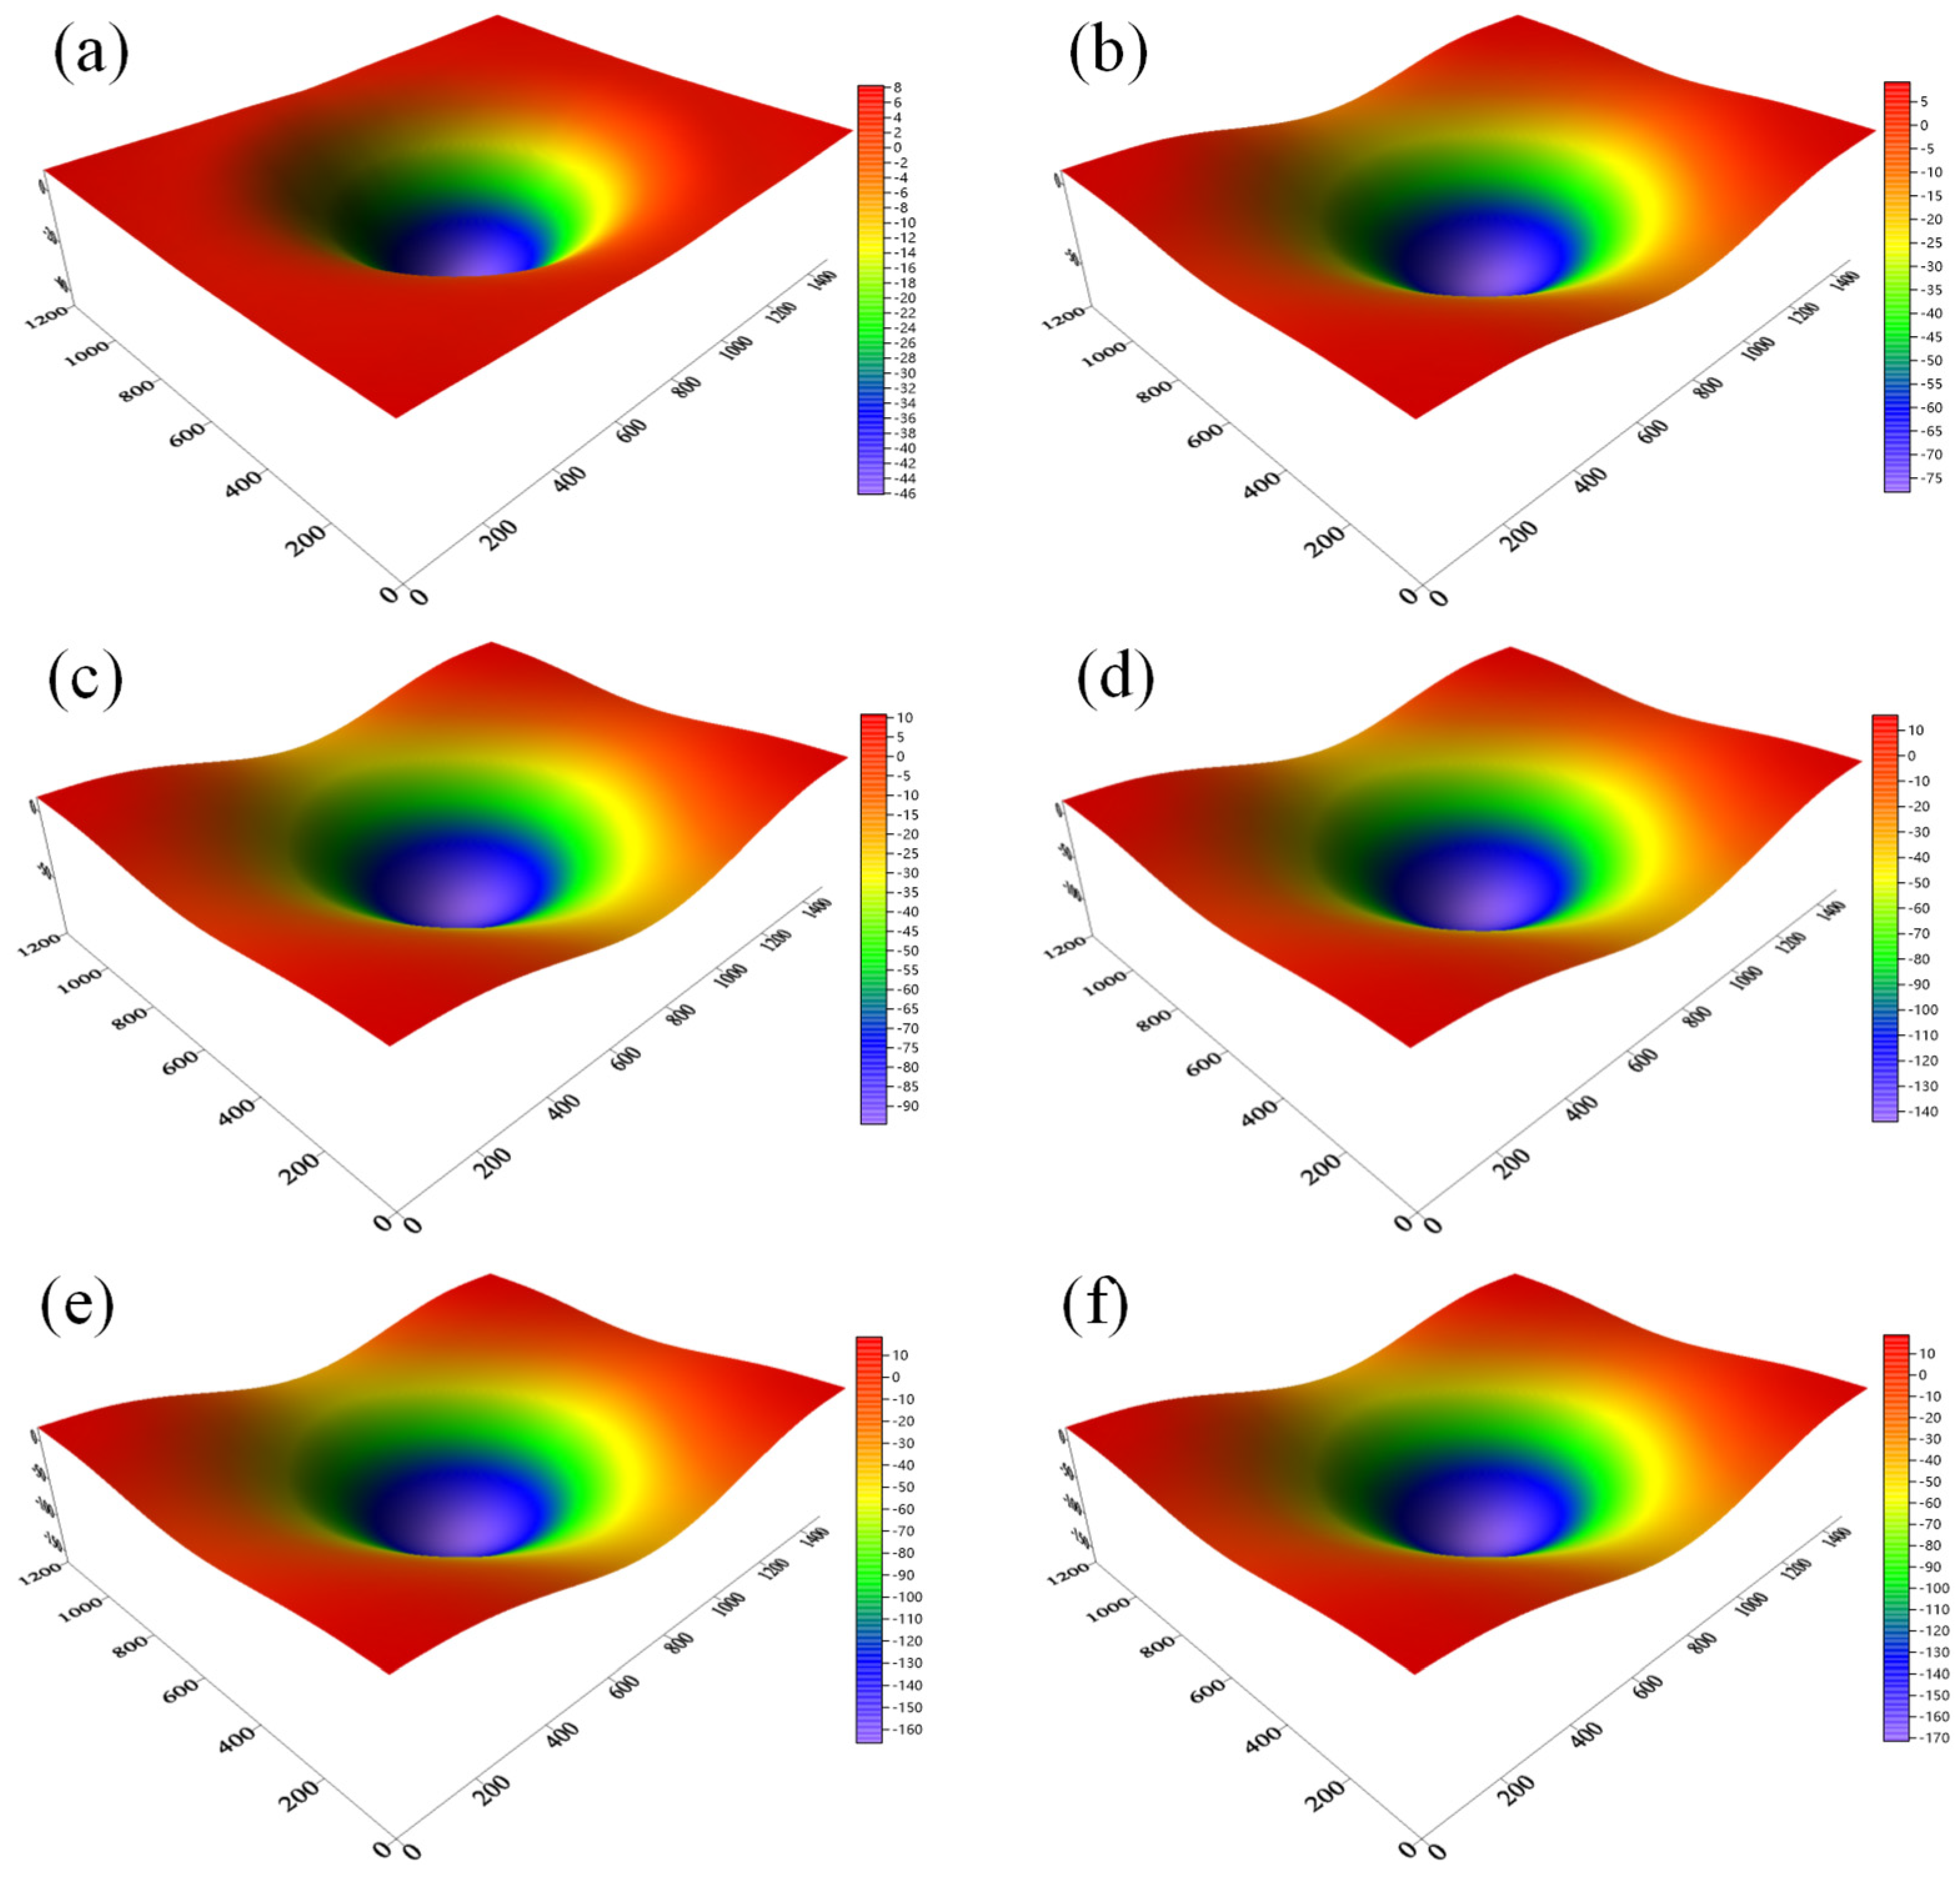
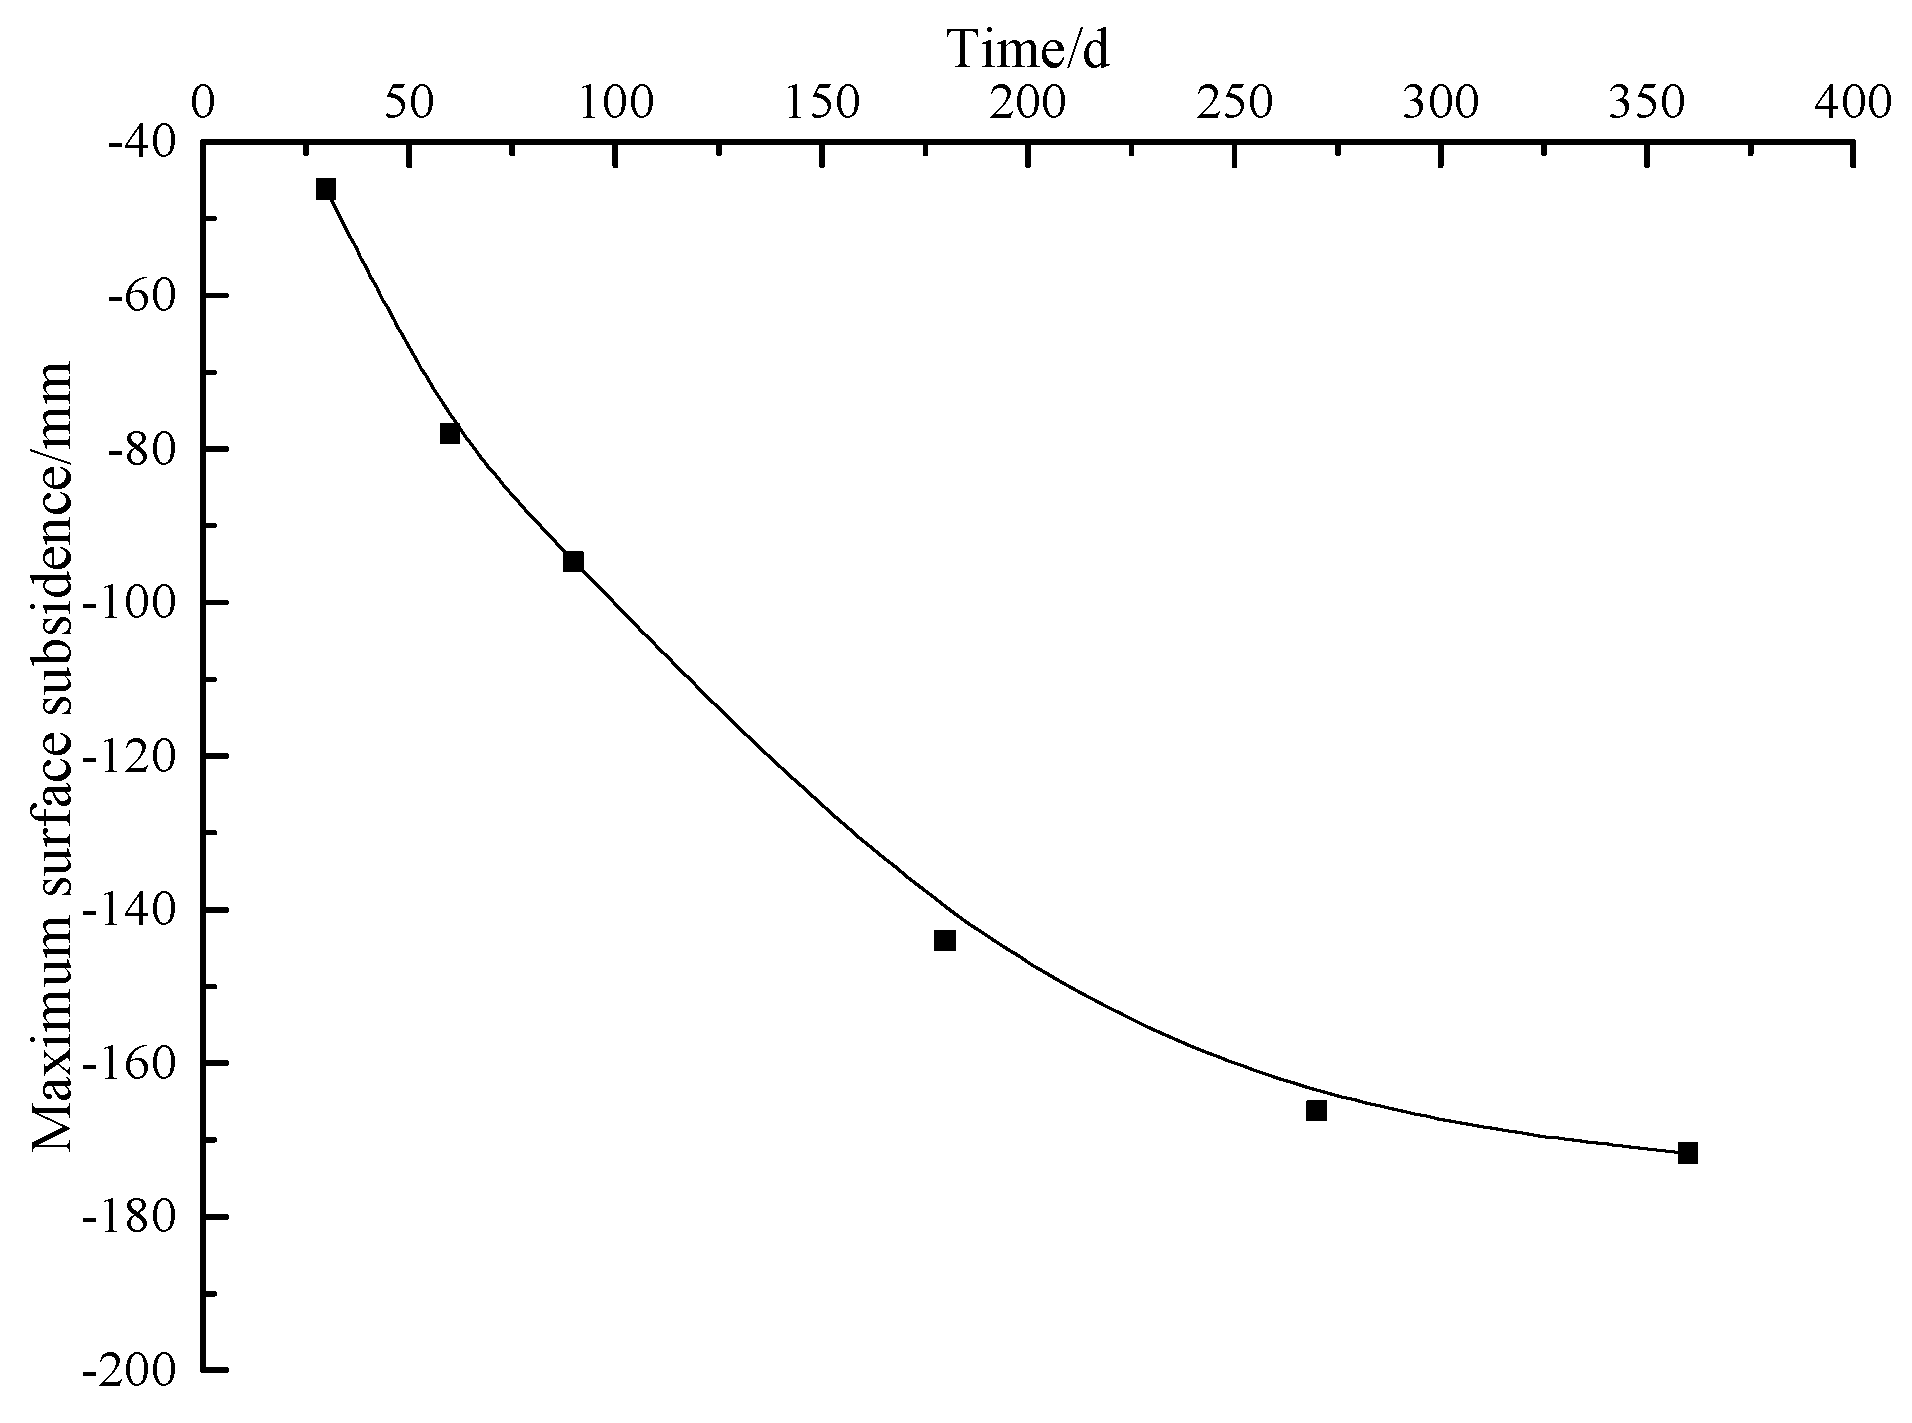
  • With the increase in the creep duration, the maximum surface subsidence gradually increases, while the increase amplitude constantly decreases. The surface subsidence reaches the maximum at the central area of the goaf of the backfill panel.
  • When the creep durations are 30, 60, 90, 180, 270, and 360 d, the maximum surface subsidence are 46.18, 78.04, 94.76, 144.11, 166.31, and 171.82 mm, respectively. Once the creep duration exceeds 270 d, the rate of surface subsidence decreases and finally tends to stabilize.
Based on definitions of surface deformation indices (subsidence, horizontal movement, inclination, curvature, and horizontal deformation), the simulation scheme with the creep duration of 360 d was used to process monitoring data from measuring lines 1 and 2 (Figure 13).
According to the analysis of Figure 13, the maximum values of surface subsidence, horizontal movement, inclination, curvature, and horizontal deformation are 171.82 mm, 56.38 mm, 0.38 mm/m, 0.002 mm/m2, and 0.29 mm/m, respectively. Therein, the horizontal compressive deformation and horizontal tensile deformation are separately −0.29 and 0.18 mm/m. The maximum surface subsidence and horizontal deformation both satisfy the fortification criterion of surface buildings above the backfill panel.

5. Monitoring and Analysis of Surface Subsidence

In accordance with surface conditions corresponding to the backfill panel and general trend in the mining-induced surface subsidence, two measuring lines for surface subsidence were arranged above the mining area in the test, separately along south-north direction and the direction of advance of the panel. The south-north measuring line with a length of 887 m was arranged to extend along the South Jianshe Road above the backfill panel, along which equidistant measuring points N1 to N22 were established. The measuring line along the direction of advance of the backfill panel was 218 m long and arranged above and along the backfill panel, along which equidistant points W1 to W7 were established. The layout of the measuring points is shown in Figure 14.
The surface deformation above the backfill panel was monitored on more than 10 occasions, and the measurement accuracy met the requirements outlined in the Code of Measurement Procedures in Coal Mines. The surface monitoring data were processed, thus attaining curves of accumulated surface subsidence along the two measuring lines, as illustrated in Figure 15.
Analysis of Figure 15 shows after mining of the backfill panel, overlying strata continue to move and subside due to the compressive creep deformation of backfill materials so the surface is also deformed to some extent; because the panel does not meet the requirement of full subsidence, the surface subsidence curves do not have a flat bottom. After the surface subsidence tends to stabilize, the maximum surface subsidence reaches 163.4 mm, which satisfies the fortification criterion of surface buildings above the backfill panel; surface buildings and structures are not influenced to any significant extent (Figure 16).

6. Conclusions

  • According to conditions of surface buildings and structures above the backfill panel in Tangshan Coal Mine, the control criterion of backfill mining for surface buildings was proposed; the compressive deformation, tensile deformation, and surface subsidence should not exceed −2.0 mm/m, 1.5 mm/m, and 500 mm, respectively. Coal gangue was collected from Tangshan Coal Mine and formed into test specimens in the laboratory. The creep compression characteristics of the gangue backfill materials were measured, the deformation characteristics during creep compression were explored, and the corresponding constitutive equation of creep compression was established.
  • Based on the constitutive equation of creep compression of gangue backfill materials, a method for the simulation of the materials was proposed. In addition, the numerical model for surface deformation induced by backfill mining was established to simulate and assess surface subsidence above the backfill panel after different creep durations of backfill materials. As the creep duration prolonged, the maximum surface subsidence increased (albeit at a decreasing rate). When the creep duration exceeded 270 d, the rate of surface subsidence decreased gradually and then tended to stabilize.
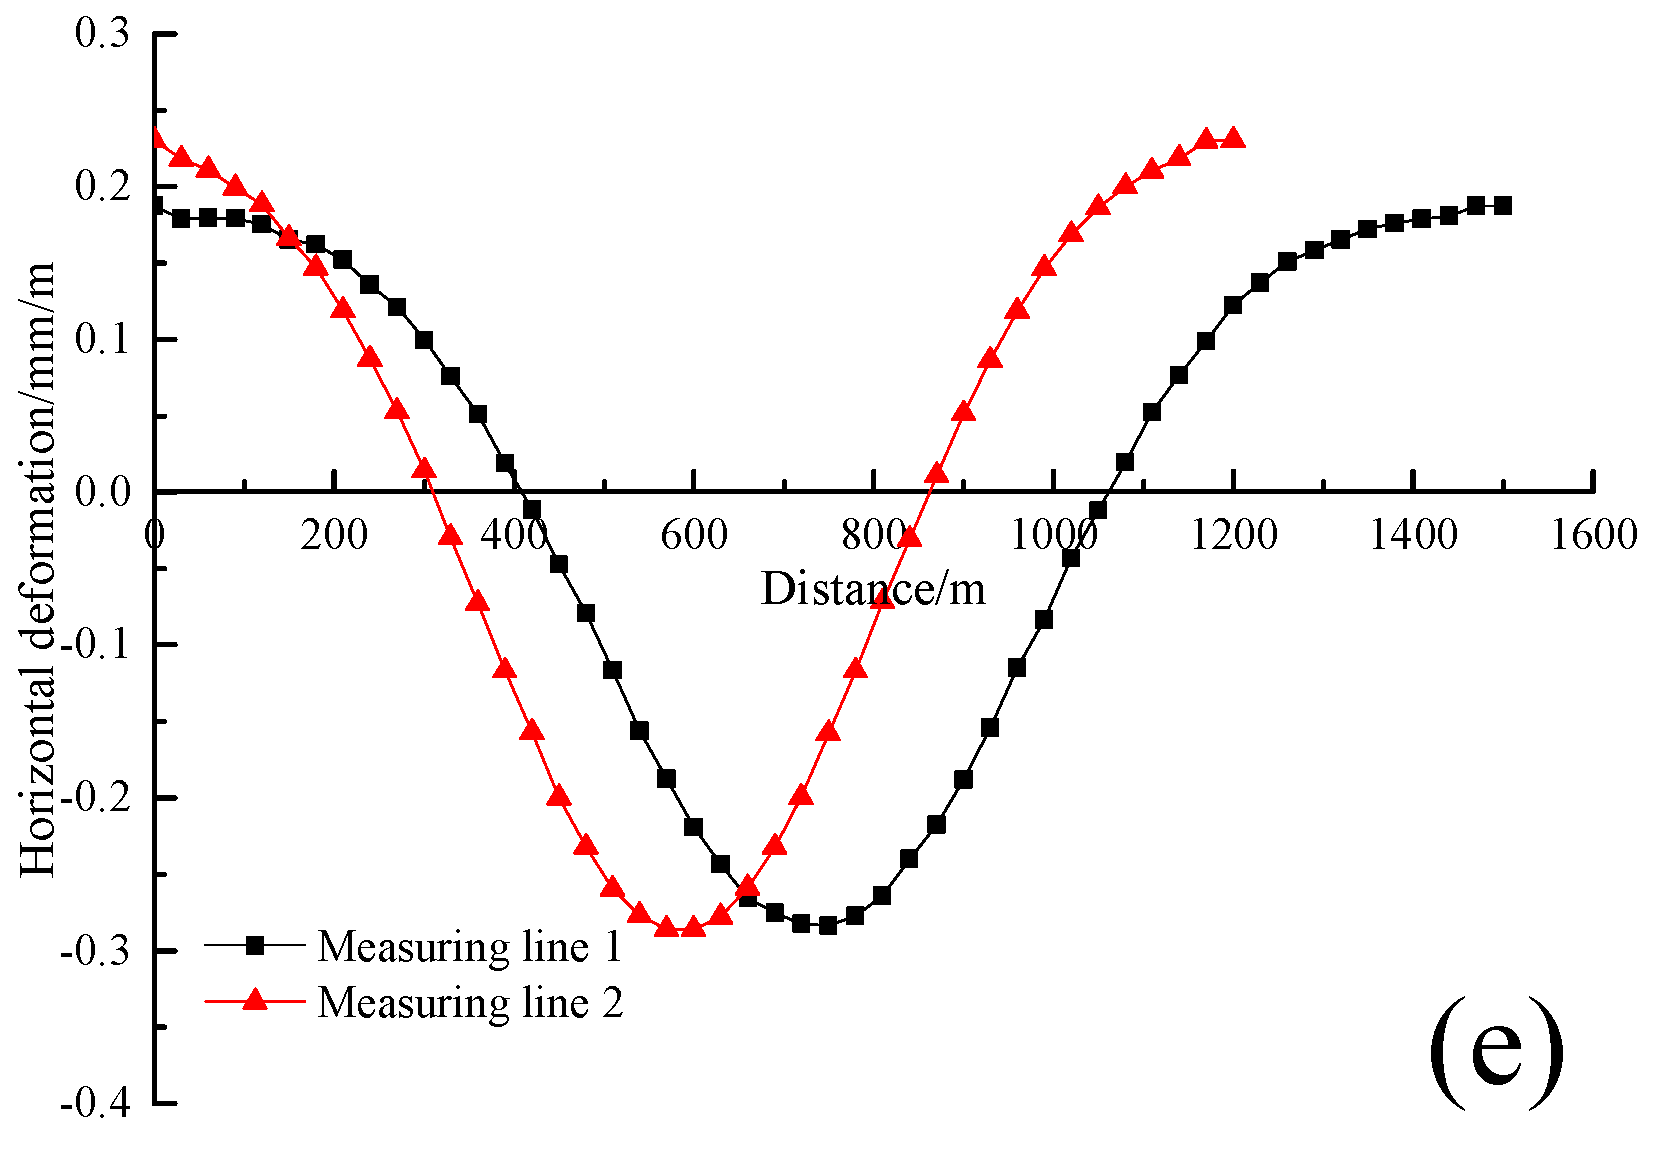
  • Through simulation, it is found the maximum values of surface subsidence, horizontal movement, inclination, curvature, and horizontal deformation above the backfill panel were separately 171.82 mm, 56.38 mm, 0.38 mm/m, 0.002 mm/m2, and 0.29 mm/m. The maximum surface subsidence and horizontal deformation both met the fortification criterion for buildings on the ground surface above a mine.
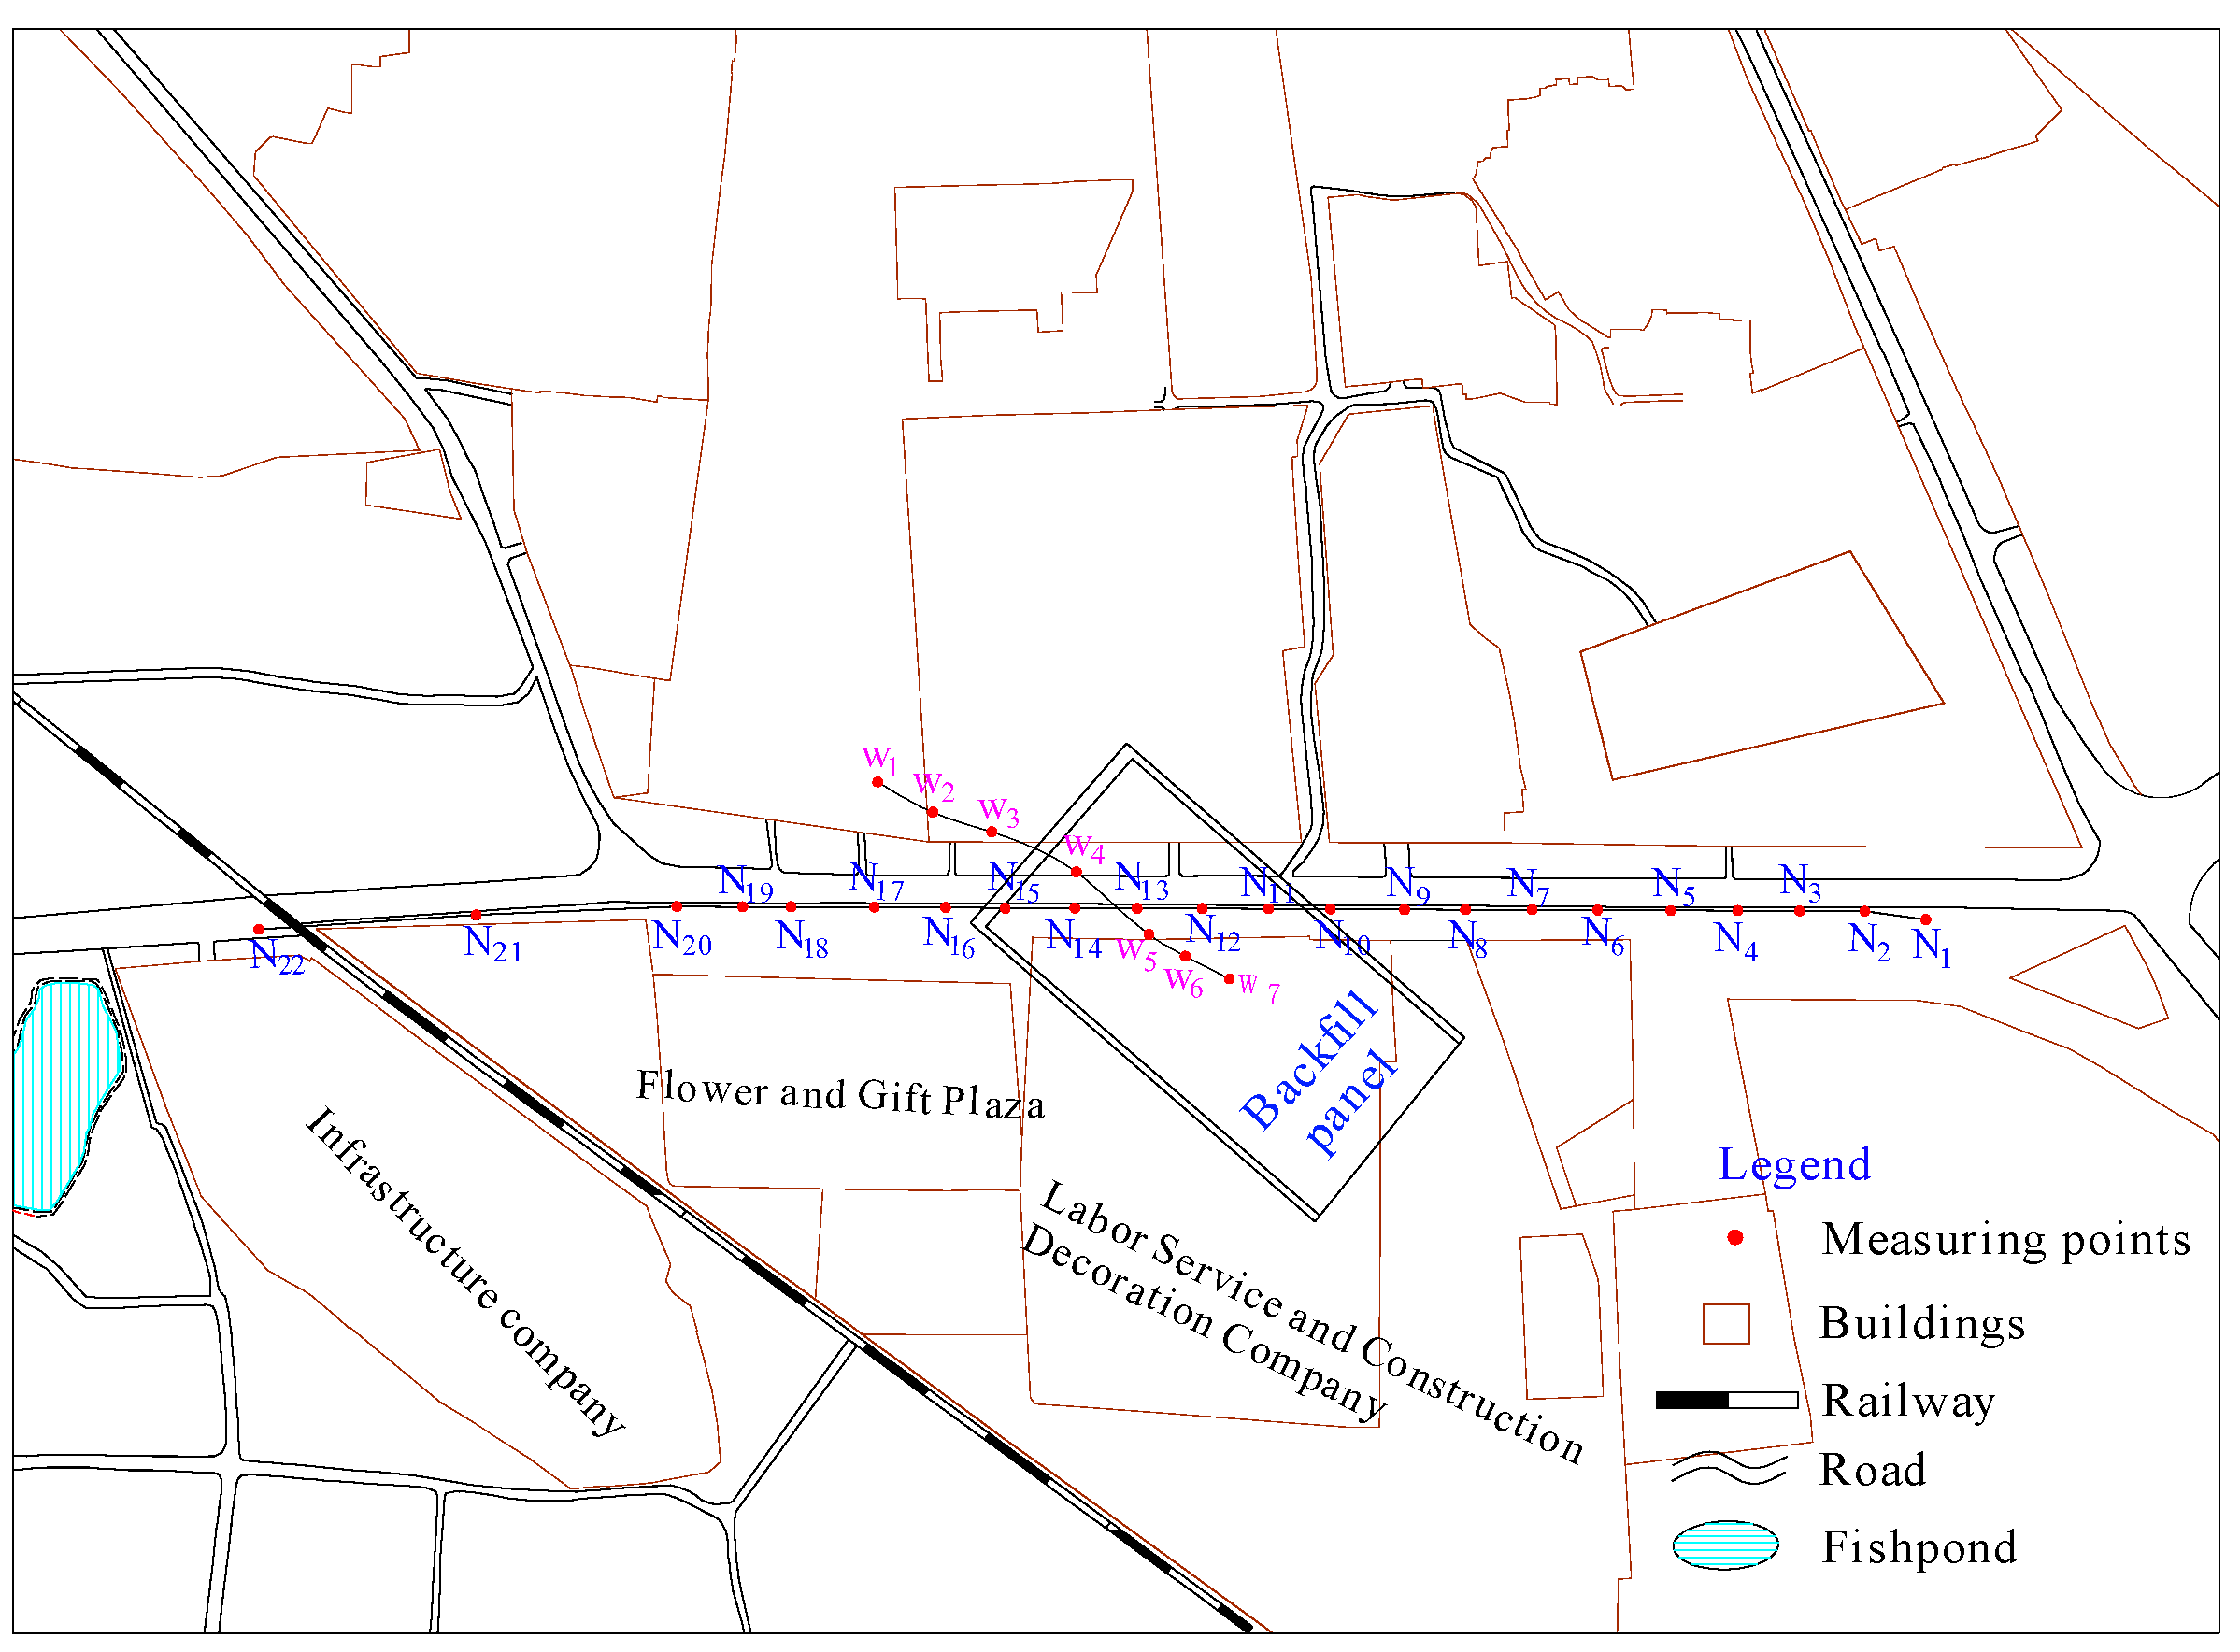
  • By arranging two measuring lines above the backfill mining area, the cumulative surface subsidence along the two measuring lines was plotted; after the surface subsidence stabilized, the maximum surface subsidence reached 163.4 mm, satisfying the fortification criterion for surface buildings above the backfill panel. This indicates backfill mining basically does not influence the buildings on the ground surface above a mine. The measured values are consistent with the results of numerical simulation.
  • From the research results, it is clear the creep compression deformation of gangue backfill materials has a determining impact on the surface deformation. The particle size distribution can be adjusted and optimized to improve the creep compression deformation of gangue backfill materials. Especially for the particle size distribution of 0–30 mm, it has relatively small compressive deformation and can be the first choice for mine backfill. The reason is the existence of the small particles increases the coordination numbers of the large particles and decreases the amounts of the broken large particles, which effectively improves the deformability of gangue backfill materials.
  • Backfill mining of gangue is an effective method to control the surface subsidence and reduce the gangue waste accumulation. Because the mined-out space can be backfilled by gangue backfill materials, after that, the deformation induced by the creep compression of gangue backfill materials is gradually transferred to the surface. The results can provide reference to the surface deformation analysis under the support of gangue backfill materials in practical engineering for protecting the stability of buildings and structures.

Author Contributions

Conceptualization, M.L. and J.Z.; methodology, M.L.; validation, L.D. and Y.P.; investigation, D.M.; resources, Y.P.; data curation, L.D.; writing—original draft preparation, M.L.; writing—review and editing, M.L., D.M., and P.H.; supervision, J.Z. and P.H. All authors have read and agreed to the published version of the manuscript.

Funding

This research was funded by the National Natural Science Foundation of China [grant number 52004271]; the China Postdoctoral Science Foundation [grant number 2021M693417]; the Jiangsu Postdoctoral Research Funding Program [grant number 2021K039A].

Institutional Review Board Statement

Not applicable.

Informed Consent Statement

Not applicable.

Data Availability Statement

The original contributions presented in the study are included in the article. Further inquiries can be directed to the corresponding author.

Acknowledgments

The authors would like to thank the editor and the reviewers for their contributions.

Conflicts of Interest

The authors declare no conflict of interest.

References

  1. Chen, S.J.; Yin, D.W.; Cao, F.W.; Liu, Y.; Ren, K.Q. An overview of integrated surface subsidence-reducing technology in mining areas of China. Nat. Hazards 2016, 81, 1129–1145. [Google Scholar] [CrossRef]
  2. Ma, D.; Duan, H.Y.; Zhang, J.X.; Bai, H.B. A state-of-the-art review on rock seepage mechanism of water inrush disaster in coal mines. Int. J. Coal Sci. Technol. 2022, 9, 50. [Google Scholar] [CrossRef]
  3. Ma, D.; Duan, H.Y.; Zhang, J.X. Solid grain migration on hydraulic properties of fault rocks in underground mining tunnel: Radial seepage experiments and verification of permeability prediction. Tunn. Undergr. Sp. Technol. 2022, 126, 104525. [Google Scholar] [CrossRef]
  4. Deck, O.; Baroudi, H.; Hosni, A.; Gueniffey, Y. A time dependency prediction of the number of mining subsidence events over a large mining field with uncertainties considerations. Int. J. Rock Mech. Min. Sci. 2018, 105, 62–72. [Google Scholar] [CrossRef]
  5. Salmia, E.F.; Nazemb, M.; Karakusc, M. Numerical analysis of a large landslide induced by coal mining subsidence. Eng. Geol. 2017, 217, 141–152. [Google Scholar] [CrossRef]
  6. Li, M.; Zhang, J.X.; Li, A.L.; Zhou, N. Reutilisation of coal gangue and fly ash as underground backfill materials for surface subsidence control. J. Clean Prod. 2020, 254, 120113. [Google Scholar] [CrossRef]
  7. Skierszkan, E.K.; Mayer, K.U.; Weis, D.; Beckie, R.D. Molybdenum and zinc stable isotope variation in mining waste rock drainage and waste rock at the Antamina mine. Peru. Sci. Total Environ. 2016, 550, 103–113. [Google Scholar] [CrossRef]
  8. Xiao, M.; Ju, F.; He, Z.Q. Research on shotcrete in mine using non-activated waste coal gangue aggregate. J. Clean Prod. 2020, 259, 120810. [Google Scholar] [CrossRef]
  9. Li, J.M.; Huang, Y.L.; Gao, H.D.; Ouyang, S.Y.; Guo, Y.C. Transparent characterization of spatial-temporal evolution of gangue solid wastes’ void structures during compression based on CT scanning. Powder Technol. 2020, 376, 477–485. [Google Scholar] [CrossRef]
  10. Welch, C.; Barbour, S.L.; Hendry, M.J. The geochemistry and hydrology of coal waste rock dumps: A systematic global review. Sci. Total Environ. 2021, 795, 148798. [Google Scholar] [CrossRef]
  11. Hou, J.F.; Guo, Z.P.; Li, J.B.; Zhao, L.J. Study on triaxial creep test and theoretical model of cemented gangue-fly ash backfill under seepage-stress coupling. J. Clean Prod. 2020, 273, 121722. [Google Scholar] [CrossRef]
  12. Wu, J.Y.; Jing, H.W.; Meng, Q.B.; Yin, Q.; Yu, L.Y. Assessment of cemented waste rock backfill for recycling gangue and controlling strata: Creep experiments and models. Environ. Sci. Pollut. R. 2021, 28, 5924–35940. [Google Scholar] [CrossRef] [PubMed]
  13. Zhang, J.X.; Zhang, Q.; Spearing, A.J.S.; Miao, X.X.; Guo, S.; Sun, Q. Green coal mining technique integrating mining-dressing-gas draining-backfilling-mining. Int. J. Min. Sci. Technol. 2017, 27, 17–27. [Google Scholar] [CrossRef]
  14. Feng, G.R.; Ran, H.Y.; Guo, J.; Guo, Y.X.; Li, C.Q. Experimental investigation on the deformation and strength properties of cemented gangue backfill column under long-term axial compression. Structures 2022, 43, 1558–1572. [Google Scholar] [CrossRef]
  15. Li, M.; Peng, Y.F.; Zhang, J.X.; Zhu, C.L.; Ma, D.; Huang, P. Effects of compressive deformation of backfill materials on strata movement and stress evolution in deep gangue backfill mining. B. Eng. Geol. Environ. 2022, 81, 361. [Google Scholar] [CrossRef]
  16. Tapsiev, A.P.; Freidin, A.M.; Filippov, P.A.; Neverov, A.A.; Neverov, S.A.; Artemenko, Y.u.V.; Uskov, V.A.; Ufatova, Z.G. Extraction of gold-bearing ore from under the open pit bottom at the Makmal deposit by room-and-pillar mining with backfill made of production waste. J. Min. Sci. 2011, 47, 324. [Google Scholar] [CrossRef]
  17. Rybak, J.; Adigamov, A.; Kongar-Syuryun, C.; Khayrutdinov, M.; Tyulyaeva, Y. Renewable-Resource Technologies in Mining and Metallurgical Enterprises Providing Environmental Safety. Minerals 2021, 11, 1145. [Google Scholar] [CrossRef]
  18. Hefni, M.; Ahmed, H.A.M.; Omar, E.S.; Ali, M.A. The potential re-use of Saudi mine tailings in mine backfill: A path towards sustainable mining in Saudi Arabia. Sustainability 2021, 13, 6204. [Google Scholar] [CrossRef]
  19. Fang, K.; Fall, M. Shear Behaviour of Rock–Tailings Backfill Interface: Effect of Cementation, Rock Type, and Rock Surface Roughness. Geotech. Geol. Eng. 2021, 39, 1753–1770. [Google Scholar] [CrossRef]
  20. Fang, K.; Fall, M. Chemically Induced Changes in the Shear Behaviour of Interface Between Rock and Tailings Backfill Undergoing Cementation. Rock Mech. Rock Eng. 2019, 52, 3047–3062. [Google Scholar] [CrossRef]
  21. Behera, S.K.; Ghosh, C.N.; Mishra, K.; Mishra, D.P.; Singh, P.; Mandal, P.K.; Buragohain, J.; Sethi, M.K. Utilisation of lead–zinc mill tailings and slag as paste backfill materials. Environ. Earth Sci. 2020, 79, 389. [Google Scholar] [CrossRef]
  22. Guo, G.L.; Zhu, X.J.; Zha, J.F.; Wang, Q. Subsidence prediction method based on equivalent mining height theory for solid backfilling mining. T. Nonferr. Metal. Soc. 2014, 24, 3302–3308. [Google Scholar] [CrossRef]
  23. Kostecki, T.; Spearing, A.J.S. Influence of backfill on coal pillar strength and floor bearing capacity in weak floor conditions in the Illinois Basin. Int. J. Rock Mech. Min. 2015, 76, 55–67. [Google Scholar] [CrossRef]
  24. Ma, D.; Zhang, J.X.; Duan, H.Y.; Huang, Y.L.; Li, M.; Sun, Q.; Zhou, N. Reutilization of gangue wastes in underground backfilling mining: Overburden aquifer protection. Chemosphere 2021, 264, 128400. [Google Scholar] [CrossRef]
  25. Zhu, X.J.; Guo, G.L.; Liu, H.; Yang, X.Y. Surface subsidence prediction method of backfill-strip mining in coal mining. B. Eng. Geol. Environ. 2019, 78, 6235–6248. [Google Scholar] [CrossRef]
  26. Zhang, J.X.; Zhang, Q.; Sun, Q.; Gao, R.; Germain, D.; Abro, S. Surface subsidence control theory and application to backfill coal mining technology. Environ. Earth Sci. 2015, 74, 1439–1448. [Google Scholar] [CrossRef]
  27. Yadav, A.; Behera, B.; Sahoo, S.K.; Singh, G.S.P.; Sharma, S.K. Numerical analysis of the gob stress distribution using a modified elastic model as the gob constitutive model. J. Inst. Eng. India Ser. D. 2020, 101, 127–139. [Google Scholar] [CrossRef]
  28. Qi, C.C.; Fourie, A. Numerical investigation of the stress distribution in backfilled stopes considering creep behaviour of rock mass. Rock Mech. Rock Eng. 2019, 52, 3353–3371. [Google Scholar] [CrossRef]
  29. Mohammadali, S.; Derek, B.A.; Robert, A.H. Prediction of mining-induced surface subsidence and ground movements at a Canadian diamond mine using an elastoplastic finite element model. Int. J. Rock Mech. Min. Sci. 2017, 100, 73–82. [Google Scholar] [CrossRef]
  30. Li, M.; Zhang, J.X.; Huang, Y.L.; Zhou, N. Effects of particle size of crushed gangue backfill materials on surface subsidence and its application under buildings. Environ. Earth Sci. 2017, 76, 603. [Google Scholar] [CrossRef]
  31. Xu, Y.; Chang, Q.L.; Zhou, H.Q.; Cao, Z.; Li, X.S.; Chen, J.H. Movement and deformation laws of the overlying strata in paste filling stope. Min. Sci. Technol. 2011, 21, 863–868. [Google Scholar] [CrossRef]
  32. Mo, S.; Canbulat, I.; Zhang, C.; Oh, J.; Shen, B.; Hagan, P. Numerical investigation into the effect of backfilling on coal pillar strength in highwall mining. Int. J. Min. Sci. Technol. 2018, 28, 281–286. [Google Scholar] [CrossRef]
  33. Xuan, D.Y.; Xu, J.L.; Wang, B.L.; Teng, H. Borehole investigation of the effectiveness of grout injection technology on coal mine subsidence control. Rock Mech. Rock Eng. 2015, 48, 2435–2445. [Google Scholar] [CrossRef]
  34. Li, M.; Zhang, J.X.; Sun, K.; Zhang, S. Influence of lateral loading on compaction characteristics of crushed waste rock used for backfilling. Minerals 2018, 8, 552. [Google Scholar] [CrossRef] [Green Version]
  35. Li, M.; Zhang, J.X.; Song, W.J.; Germain, D.M. Recycling of crushed waste rock as backfilling material in coal mine: Effects of particle size on compaction behaviours. Environ. Sci. Pollut. R. 2019, 26, 8789–8797. [Google Scholar] [CrossRef] [PubMed]
  36. Feng, W.Q.; Yin, J.H.; Chen, W.B.; Tan, D.Y.; Wu, P.C. A new simplified method for calculating consolidation settlement of multi-layer soft soils with creep under multi-stage ramp loading. Eng. Geol. 2020, 264, 105322. [Google Scholar] [CrossRef]
  37. Ma, L.J.; Wang, Y.X.; Wang, M.Y.; Xue, B.; Duan, L.Q. Mechanical properties of rock salt under combined creep and fatigue. Int. J. Rock Mech. Min. Sci. 2021, 141, 104654. [Google Scholar] [CrossRef]
  38. Li, M.; Zhang, J.X.; Meng, G.H.; Gao, Y.; Li, A.L. Testing and modelling creep compression of waste rocks for backfill with different lithologies. Int. J. Rock Mech. Min. 2020, 125, 104170. [Google Scholar] [CrossRef]
  39. Sene, N. Mittag-Leffler input stability of fractional differential equations and its applications. Discrete. Contin. Dyn. Syst. Ser. A. 2020, 13, 867–880. [Google Scholar] [CrossRef] [Green Version]
  40. Corkum, A.G.; Board, M.P. Numerical analysis of longwall mining layout for a Wyoming Trona mine. Int. J. Rock Mech. Min. 2016, 89, 94–108. [Google Scholar] [CrossRef]
  41. Sears, M.M.; Slaker, B.; Rashed, G.; Miller, J. Analysis of the impacts of mining sequence and overburden depth on stability at a dipping limestone mine. Min. Metall. Explor. 2021, 38, 959–965. [Google Scholar] [CrossRef]
Figure 1. Layout of the underground backfill panel.
Applsci 13 00160 g001
Figure 2. Distribution of surface buildings and structures in Tangshan Coal Mine.
Applsci 13 00160 g002
Figure 3. The loading test devices for granular backfill materials.
Applsci 13 00160 g003
Figure 4. Deformation curves of gangue backfill materials in creep compression tests: (a) multi-stage loading curves, (b) creep compression curve clusters.
Applsci 13 00160 g004
Figure 5. Fractional Burgers’ model of gangue backfill materials.
Applsci 13 00160 g005
Figure 6. Fitting curves of creep data of gangue backfill materials: (a) 5 MPa, (b) 10 MPa, (c)15 MPa, (d) 20 MPa.
Applsci 13 00160 g006
Figure 7. Secondary development flowchart of the fractional Burgers’ model.
Applsci 13 00160 g007
Figure 8. Numerical model for creep compression of gangue backfill materials.
Applsci 13 00160 g008
Figure 9. Comparison of simulated and measured results.
Applsci 13 00160 g009
Figure 10. Numerical model for surface deformation induced by backfill mining.
Applsci 13 00160 g010
Figure 11. 3-d surfaces for surface subsidence after different creep durations: (a) 30 d, (b) 60 d, (c) 90 d, (d) 180 d, (e) 270 d, (f) 360 d.
Applsci 13 00160 g011
Figure 12. Change in maximum surface subsidence.
Applsci 13 00160 g012
Figure 13. Changes in surface deformation indices: (a) surface subsidence, (b) horizontal movement, (c) inclination, (d) curvature, (e) horizontal deformation.
Applsci 13 00160 g013aApplsci 13 00160 g013b
Figure 14. Layout of measuring lines for surface subsidence.
Applsci 13 00160 g014
Figure 15. Measuring lines for surface subsidence: (a) south-north measuring line, (b) measuring line along the direction of advance of the backfill panel.
Applsci 13 00160 g015
Figure 16. Buildings above the backfill mining area: (a) brickwork-concrete-structured shop fronts, (b) brickwork masonry houses.
Applsci 13 00160 g016
Table 1. Parameter identification results of the fractional Burgers’ model.
Applied Stress/MPaModel Parameter
Ke/MPaGe/MPa η v α /MPa·minαGev/MPa η e v β /MPa·minβ
551.7111.0840,565.170.36208.634745.790.77
1074.6115.9971,385.550.38267.213454.550.66
1594.7920.31100,886.910.38286.922580.140.56
20115.2624.6991,656.830.38320.484405.270.65
Table 2. Parameter values of the constitutive model of gangue backfill materials.
Applied Stress/MPaModel Parameter
Ke/MPaGe/MPa η v α /MPa·minαGev/MPa η ev β /MPa·minβ
18108.8323.3297,853.490.38315.013651.440.61
Disclaimer/Publisher’s Note: The statements, opinions and data contained in all publications are solely those of the individual author(s) and contributor(s) and not of MDPI and/or the editor(s). MDPI and/or the editor(s) disclaim responsibility for any injury to people or property resulting from any ideas, methods, instructions or products referred to in the content.

