Article

Study on Mechanical Properties and Constitutive Equation of Earth Materials under Uniaxial Compression

1
College of Water Conservancy & Architectural Engineering, Shihezi University, Shihezi 832003, China
2
Xinjiang Production & Construction Groups Engineering Laboratory for Seismic and Energy-Saving Building in High Earthquake Intensity and Cold Zone, Shihezi 832003, China
*
Author to whom correspondence should be addressed.
Appl. Sci. 2023, 13(1), 19; https://doi.org/10.3390/app13010019
Submission received: 9 October 2022 / Revised: 7 December 2022 / Accepted: 12 December 2022 / Published: 20 December 2022
(This article belongs to the Section Civil Engineering)

Abstract

:
In this study, the uniaxial compressive mechanical properties of earth materials are tested, and the effects of four influencing factors, such as shape, size, curing age, and loading rate, on the strength, damage pattern, and stress-strain curve of the specimens are analyzed. The standard uniaxially compressed specimen size and the recommended loading rate are proposed for the earth specimens. The uniaxial compressive constitutive equations of earth materials are modified on the basis of the Illampas constitutive equation. By fitting the results of this study and typical literature tests, the applicability of the modified constitutive equation form to the uniaxial compressive test curves of soils in different regions of China based on standard sizes is verified. Finally, the formulae for calculating the parameters related to the constitutive equation of earth materials are established. In its application, only the compressive strength of 100-mm-cubic standard specimens with a curing age of 28 d needs to be measured to calculate and determine the specific values of the relevant parameters of the constitutive equation. This is a good reference value for promoting the development of computational analysis methods for earth structures and promoting the engineering design applications of earth structures.

1. Introduction

With the improvement of environmental concerns all over the world, sustainable development has attracted much attention in the construction industry. People urgently need a low-cost, reusable, energy-saving, and environment-friendly building material to replace the industrial building materials with high pollution and high energy consumption [1]. Earth as a natural construction material has been widely used throughout the world since ancient times. It has many advantages, such as easy use of local materials, low cost, energy savings, environmental protection, and simple construction. Therefore, under the background of international sustainable development, it will burst out with new vitality with the development of science and technology [2,3]. According to statistics, approximately 30% of the world’s population still lives in houses built of earth materials. The strength of earth materials is low (compressive strength of 0.5–7 MPa), nevertheless, they are perfectly suitable for low-rise buildings of 1–3 stories and even more [4]. Therefore, in some developing countries (especially low-income countries), this occupancy ratio is more than 50% [5,6]. In China, it is also conservatively estimated that more than 60 million people live in earth buildings [7]. However, there are some common problems in earth structures, such as large material discreteness, weak structural measures, imperfect seismic calculation and analysis methods, and so on. Earth structures were seriously damaged in previous destructive earthquakes, such as the 2008 Wenchuan M8.0 earthquake [8], the 2010 Yushu M7.1 earthquake [9], and the Haiti M7.0 earthquake [10]. This poses a great threat to the safety of people’s lives and property, seriously restricting the development of earth structures [11,12]. Among them, the constitutive equation of earth under uniaxial compression, as an expression to describe the full stress-strain response of earth specimens under uniaxial compression, is an indispensable physical equation in nonlinear analysis and numerical simulation of earth structure. Its establishment played an important role in the development of calculation, analysis, and design methods for earth structures, and it has been widely studied by scholars.
At present, research on earth materials focuses on material modification. The mechanical properties and durability of earth materials are enhanced by adding different components to them [13,14,15]. It is important to note that there is a distinct lack of official international guidelines for laboratory testing of earth materials. Therefore, both the determination of the mechanical properties of materials, such as compressive, flexural and bending resistance, and the durability testing of earth materials (spray test, drip test, etc.) are borrowed from the test methods used for industrial construction materials [16,17]. Their applicability to earth materials is open to debate. The conclusions obtained from related studies are often difficult to compare because of the different shapes and sizes of the specimens. Therefore, it is necessary to study the mechanical properties of earth materials from the perspective of experimental test methods. A new contribution to the establishment of relevant experimental test standards is needed.
The determination of uniaxial compressive strength test methods for earth materials is still an open problem. The establishment of uniaxial compressive constitutive equations for earth materials has also been studied by some researchers. Adorni. et al. and Aguilar. et al. [18,19], respectively, carried out uniaxial compression tests on adobe bricks in archeological relics of Turkmenistan and Peru, and established the uniaxial compression test equations suitable for adobe bricks based on the test results. Illampas et al. [20] carried out uniaxial compression tests on adobe blocks with different shapes and sizes. The influence of the inherent inhomogeneity of earth material on the mechanical properties of adobe is emphasized, and finally the constitutive equation describing the strength and deformation characteristics of adobe under uniaxial compression is established. Lan Guanqi et al. [1] carried out uniaxial compression tests on earth blocks under different working conditions, put forward the recommended loading rate and standard specimen size for uniaxial compression tests of earth materials, and established the constitutive equation of earth materials. Rodríguez-Mariscal et al. [21] carried out uniaxial compression tests on brick, cubic, prismatic, and cylindrical specimens. They believed that the uniaxial compressive strength of earth specimens should not be obtained from the existing shape and size correction coefficients of other materials. At the same time, the constitutive equations of specimens with different sizes under uniaxial compression were established according to their own test results. From the above literature, it can be seen that the shape, size, curing age, and loading rate of the specimen are the factors affecting the uniaxial compression performance of earth materials that have been widely studied by scholars because there is no complete consensus on the uniaxial compression test method. Most of the uniaxial compression constitutive equations of earth materials proposed by scholars are based on fitting the test data obtained by themselves [1,18,19,20,21]. Whether it has wide applicability and statistical significance-based methods for calculating parameters related to constitutive equations has not received attention by scholars.
In this research work, uniaxial compression tests are carried out on earth specimens with different shapes (cylinders and cubes), different sizes (100 mm, 70.7 mm, and 150 mm cubes), different curing ages (14 d, 21 d, and 28 d), and different loading rates (0.2 mm, 1.0 mm, and 3.0 mm). The effects of the above factors on the failure shape, strength, and coefficient of variation of earth specimens are investigated. The proposed method for uniaxial compression testing of earth materials is put forward. On the basis of the existing typical constitutive equation of earth, the Illampas constitutive equation, which can better reflect the mechanical characteristics of earth, is selected and modified. The applicability of the modified constitutive equation is verified by fitting the stress-strain curve of the uniaxial compression test in this study and the related representative literature. The shape parameters of the constitutive equation curve and peak compressive strain calculation equations based on standard specimens characterized by compressive strength are established. The established constitutive equation is widely applicable, and the relevant parameters can be determined only by obtaining the measured compressive strength of an earth specimen. This is a good reference value to promote the development of computational analysis methods for earth structures and to facilitate the engineering design applications of earth structures.

2. Uniaxial Compression Test on Earth Materials

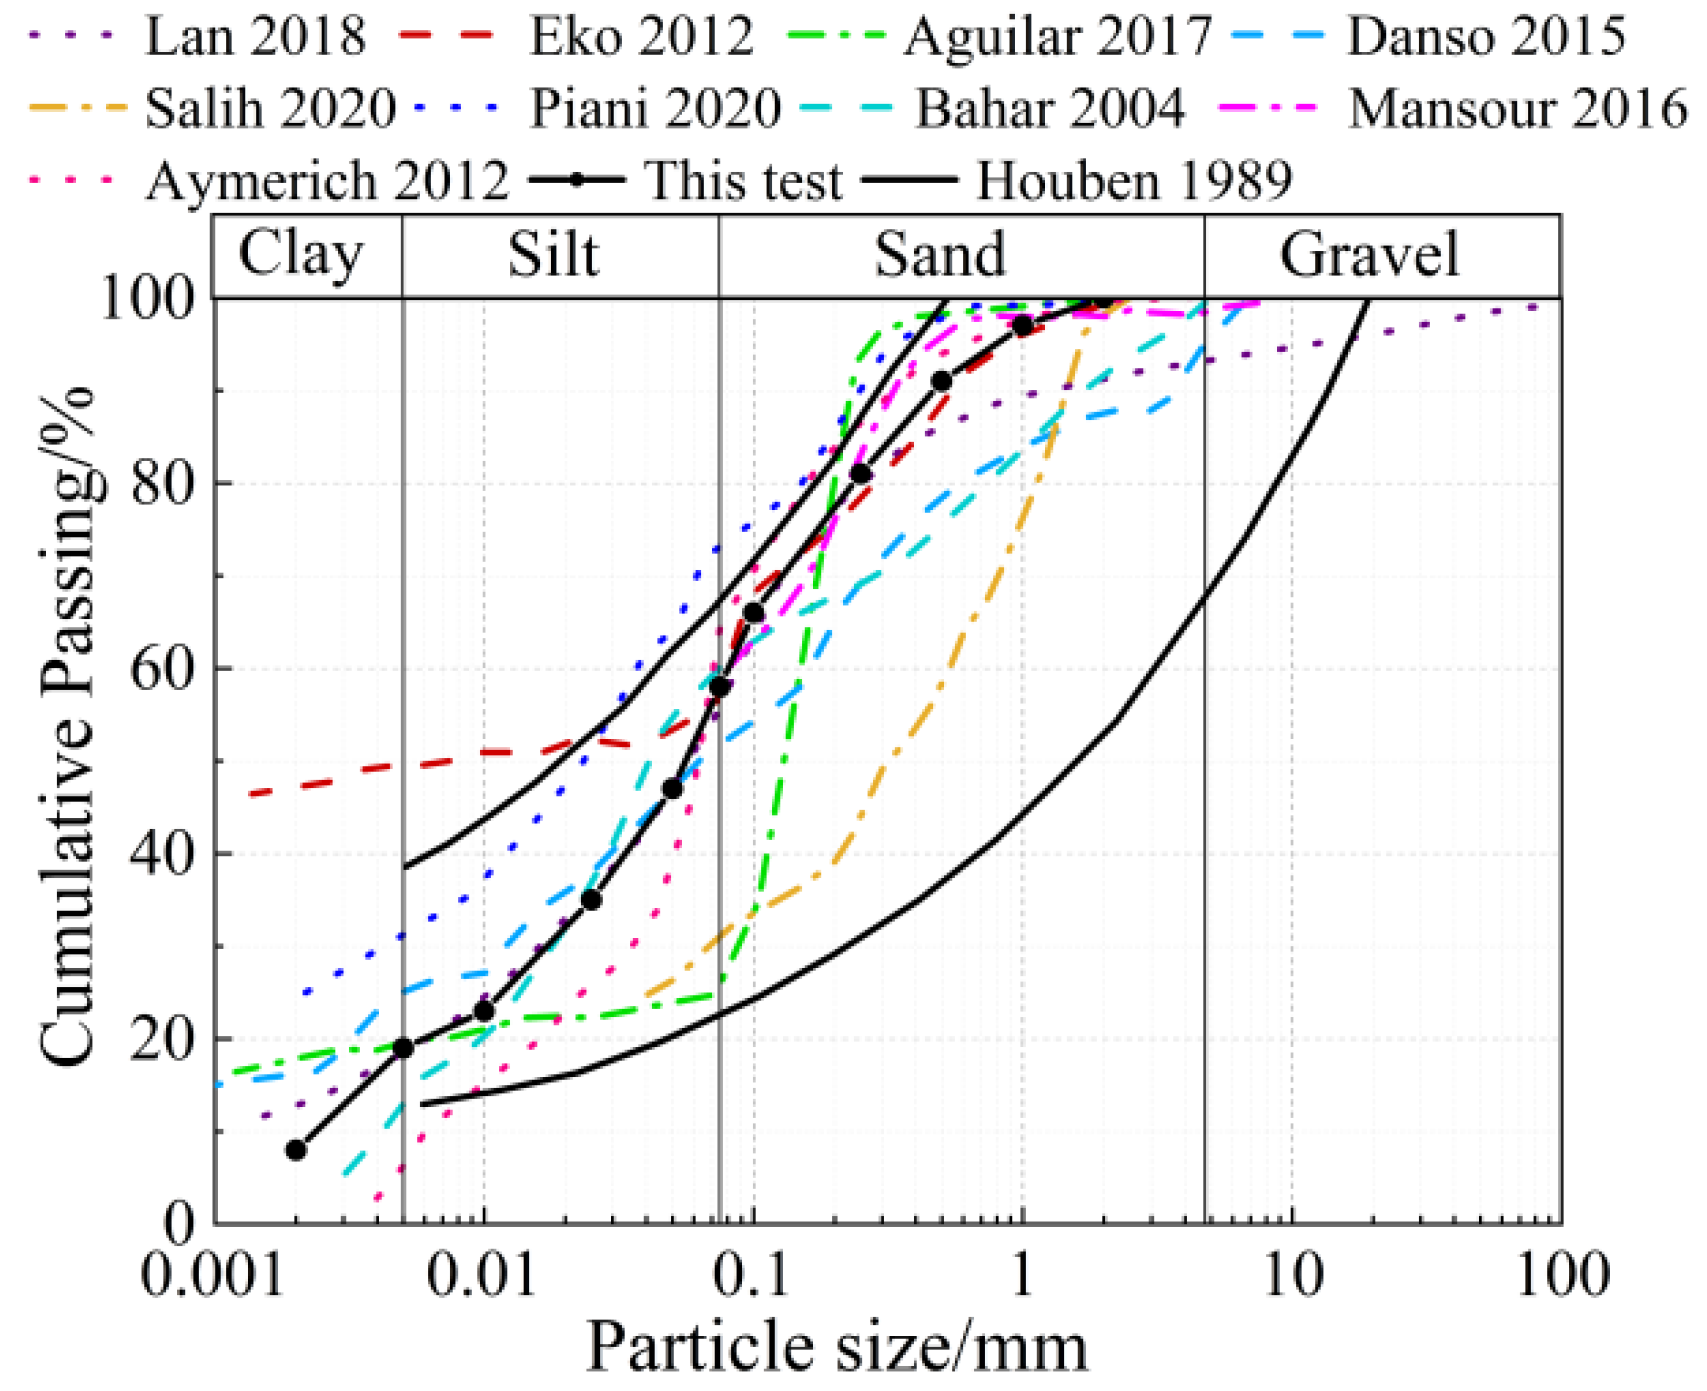
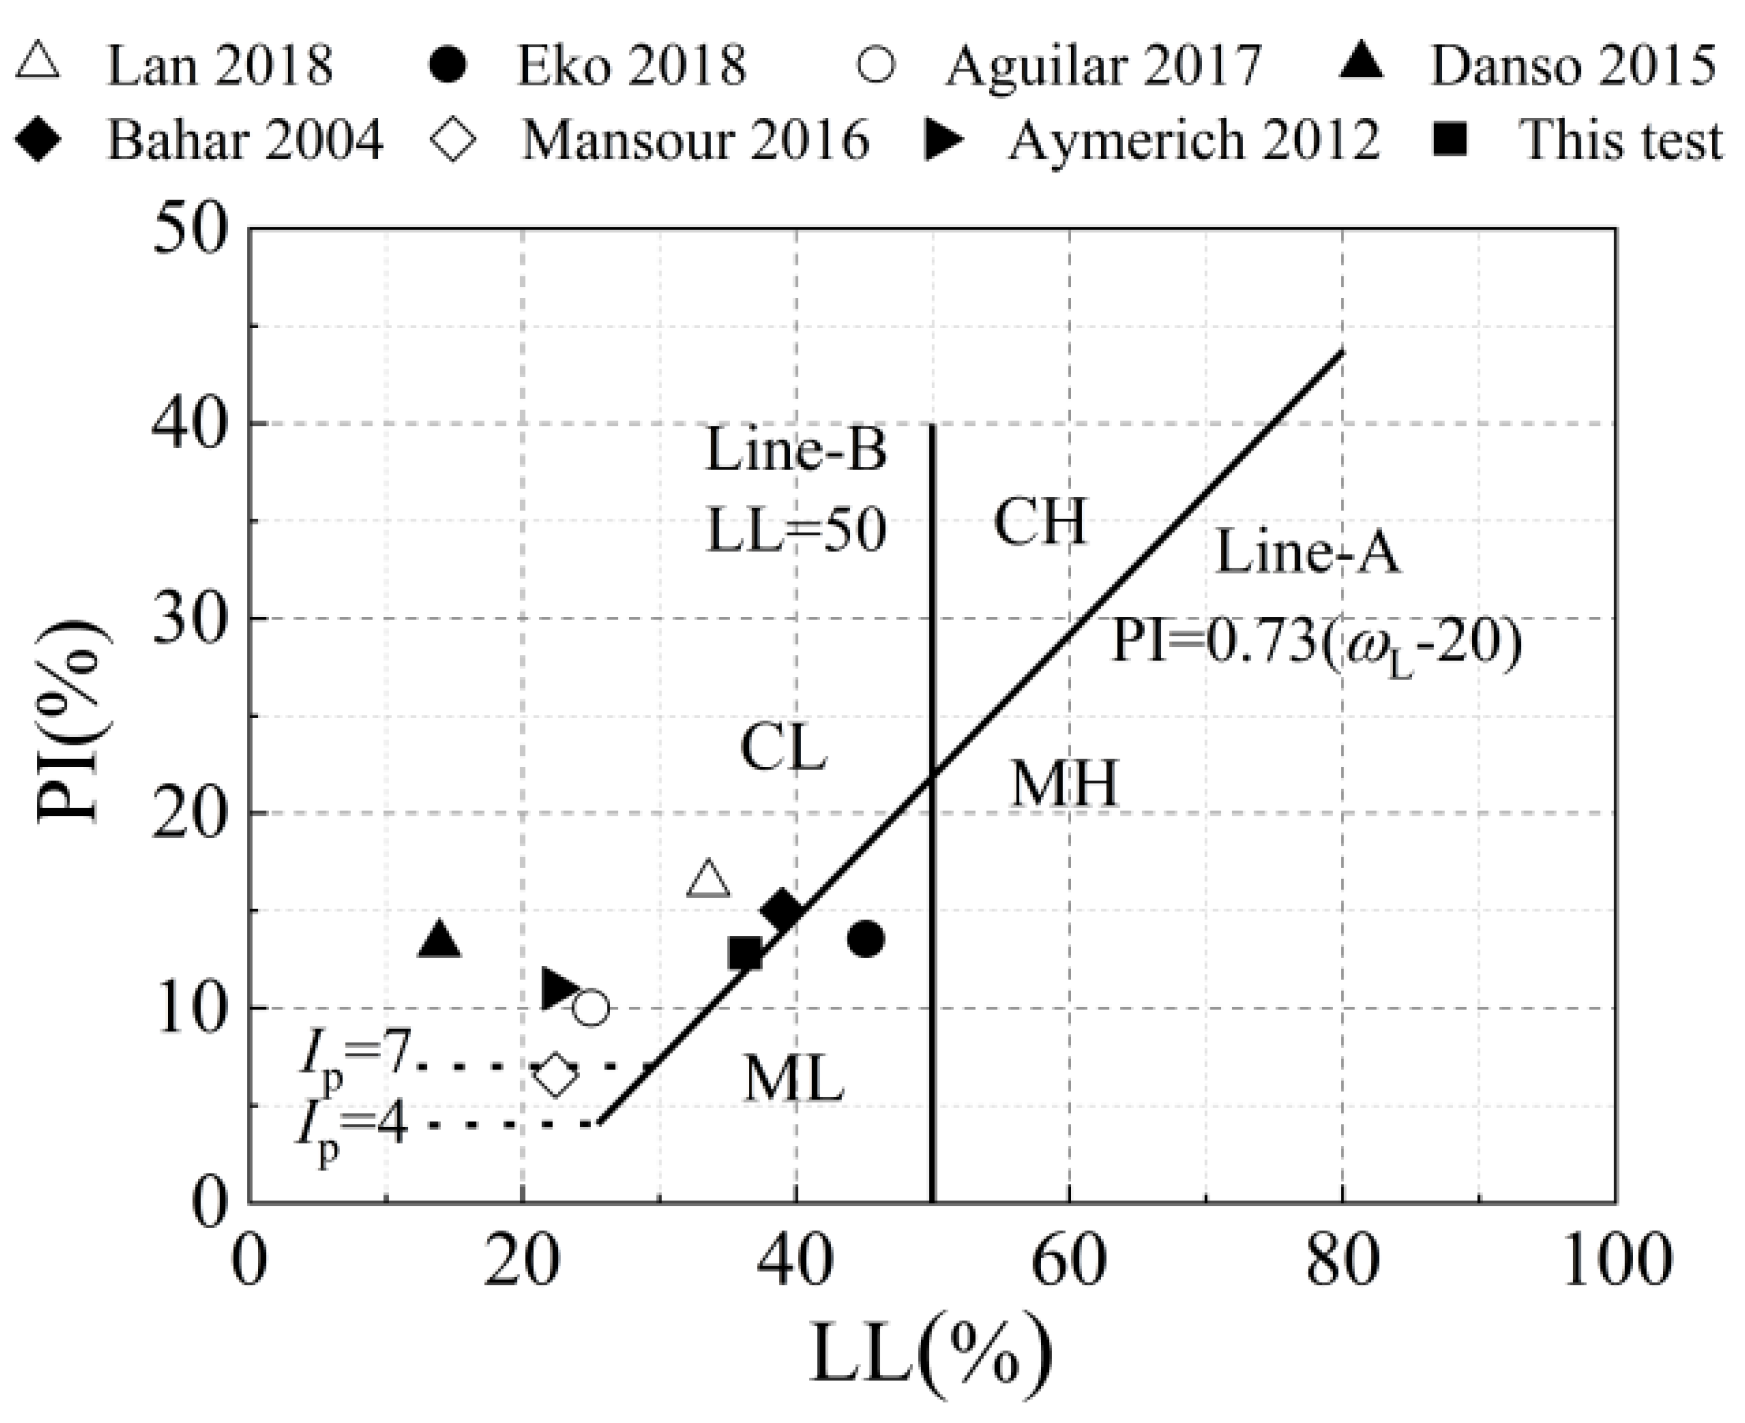
2.1. Selection and Preparation of Specimens

A reasonable selection of earth materials is a prerequisite for ensuring the good mechanical properties of the earth structure. The soil used in this experiment was obtained from the region of Shihezi in China, which was traditionally used to make clay bricks in the past. The soil was passed through a 2-mm standard sieve to remove the debris and impurities incorporated in it. The main components of the test soil samples were detected using an X-ray fluorescence analyzer of the S8 TIGER series (Figure 1a). The main components of the soil sample are shown in Table 1. To analyze the mineral composition in the earth materials, a Smartlab 9 kw X-ray diffractometer from RIGAKU was used to test the soil samples. The test apparatus is shown in Figure 1b. The test conditions were Cu Kα radiation, operated at 40 kV-150 mA, step size = 0.02° and a scan range 2θ from 3° to 80°. Before testing, the test soil sample was crushed and passed through a 200-mesh sieve, then poured into the sample tray, and the sample surface was treated with frosted glass to ensure a smooth surface. The X-ray diffraction pattern of the tested soil is shown in Figure 2.
The soil sample Atterberg limit used was tested with reference to the Chinese standard “Standard for Geotechnical Test Methods” [22] (GB/T 50123-2019). The basic physical properties, such as maximum dry density and optimum water content, were measured using the light compaction test [22], and the results are shown in Table 2.
Figure 3 shows the particle size distribution curves of the earth materials used in this experiment and in the related literature [1,14,19,23,24,25,26,27,28]. The obtained curves were also compared with the particle size range recommended by CRATerre (Centre de Recherche en Architecture en Terre) [29] for making compacted soil specimens. It can be seen that the particle size distribution curves of the earth materials used in this experiment and in the related literature are basically between the upper and lower limits of the particle sizes given by them, and no correction of the soil particle sizes is required. According to ASTM D2487 [30], the composition of the soil was 19% clay particles (<5 μm), 39% powder particles (5–75 μm), and 42% sand (75–4500 μm). The total amount of clay particles and powder particles is 58% > 50%, which is a fine-grained soil.
Figure 4 shows a plastic diagram of the soil used in this test and related literature [1,14,19,23,26,27,28]. In Figure 4, it can be seen that the soil used in this test has a liquid limit LL = 36.3% < 50% and a plasticity index PI = 12.8 ≥ 11.899, which is a low liquid limit clay [24]. It is characterized by high cohesiveness and low compressibility. This is consistent with the type of soil used in related studies. It suggests that the selection of the soil in this study basically meets the requirements for the construction of earth structures and is somewhat representative.
Since there is no unified test standard for the forming and manufacturing method and size of the specimens in the uniaxial compression test of earth materials in various countries. Therefore, we refer to the European standard “Design of Concrete Structures-Part 1-1: General rules and rules for buildings” (EN1992-1-1) [31], the Chinese standard “Standard for basic performance test methods of construction mortar” (JGJ/T70-2009) [32], the New Zealand standard “Engineering Design of Earth Buildings” (NZS4297:2020) [33], and the Chinese standard “Standard for Geotechnical Test Methods” (GB/T 50123-2019) [22] to determine the shape dimensions of the studied test specimens as 150-mm, 70.7-mm, 100-mm-cubic test specimens and 102 mm diameter and 116 mm height cylindrical test specimens, respectively. A total of eight groups of specimens were designed and fabricated for the test (Table 3).
The earth specimens were fabricated by the light compaction method [22] with reference to the Chinese standard “Standard for Geotechnical Test Methods” (GB/T 50123-2019), and the fabrication details are as follows:
  • The sieved soil material is dried in an oven, and the optimum water content is used as the control index to add water to mix the earth material. Then, it is sealed with a cling film and left to stand for one hour so that the moisture is evenly distributed in the earth material.
  • Filling the mold with wet soil, using manual compaction in multiple layers, the compaction height of each layer is approximately 38 mm, and the compaction work W is 592.2 kJ∙m−3. The number of times of compaction per layer and the number of layers of compaction are calculated according to Equation (1), and the results are shown in Table 4 to ensure that the specimen is formed under a more uniform standard and achieves the maximum dry density. After each layer of compaction, the surface of the compacted soil is roughened to ensure close contact between the surfaces.
    W = m h g n s / V
    where W is the compaction work, kJ·m−3; m is the weight of the hammer, taken as 2.5 Kg; h is the drop height of the hammer, taken as 305 mm; g is the acceleration of gravity, taken as 9.8 m∙s−2; n is the number of layers of compaction; s is the number of compactions per layer; and V is the volume of the test block, cm3.
  • After the specimen is created, in order to slow down the initial water loss and hardening rate of the specimen and prevent cracking, it is covered with a cling film. To ensure that the specimens could be hardened at 28 d, the conservation method was referred to in [34]. The conservation was carried out in a laboratory at a temperature of 30 °C (±5 °C) and a humidity of 55–60%. To ensure the quality of demolding, it was carried out after 3 days of curing (after the specimens had obtained some of their strength). The average water content of the specimens at 14 d, 21 d, and 28 d was 8.8%, 4.3%, and 3.5%, respectively. The densities of 70.7 mm, 100 mm, and 150 mm cubic specimens and Φ102 × 116 cylindrical specimens at 28 d were 1.69 g∙cm−3, 1.70 g∙cm−3, 1.71 g∙cm−3, and 1.70 g∙cm−3.This indicates that the specimens are basically hardened.

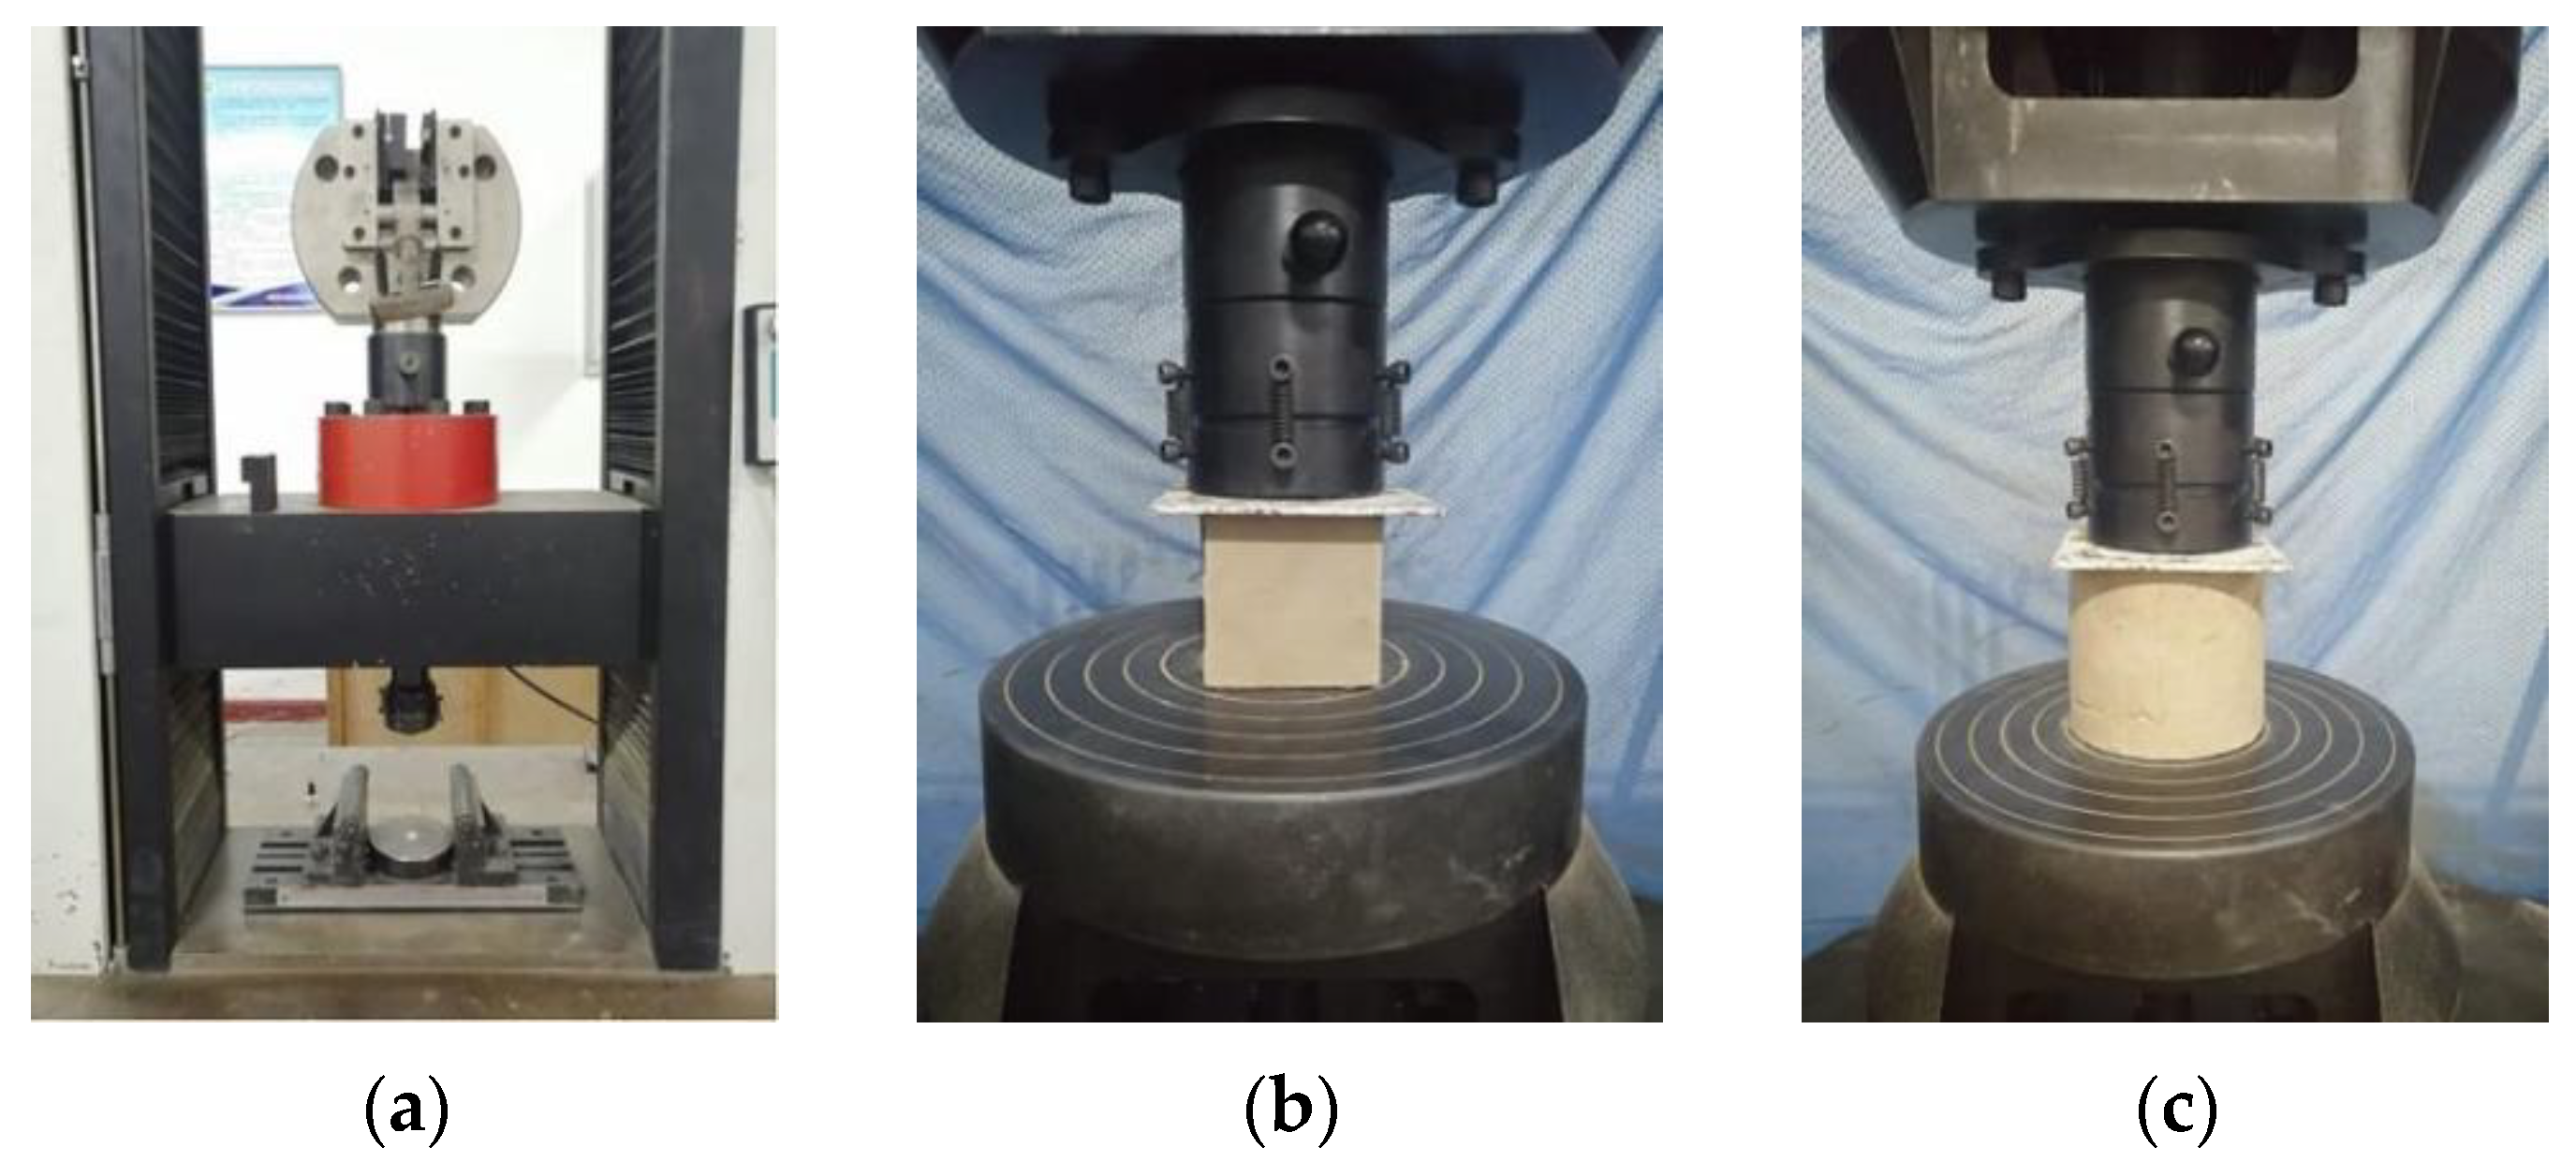
2.2. Test Device and Procedure

The uniaxial compression test of the earth material was performed by an electronic universal pressure tester of type Changchun CSS-44300. The test device is shown in Figure 5. Before starting the test, the specimen was first checked for completeness, and the severely damaged specimen was discarded. Then, plaster was evenly applied to the upper and lower surfaces of the specimen to reduce the influence of the platen restraint effect. Before the formal loading, the test was prepressed three times with a 1 kN load to ensure the normal operation of the press and close contact with the specimen. The displacement loading method is used, and the loading rates are shown in Table 3. The load-displacement curve was output from the computer system.

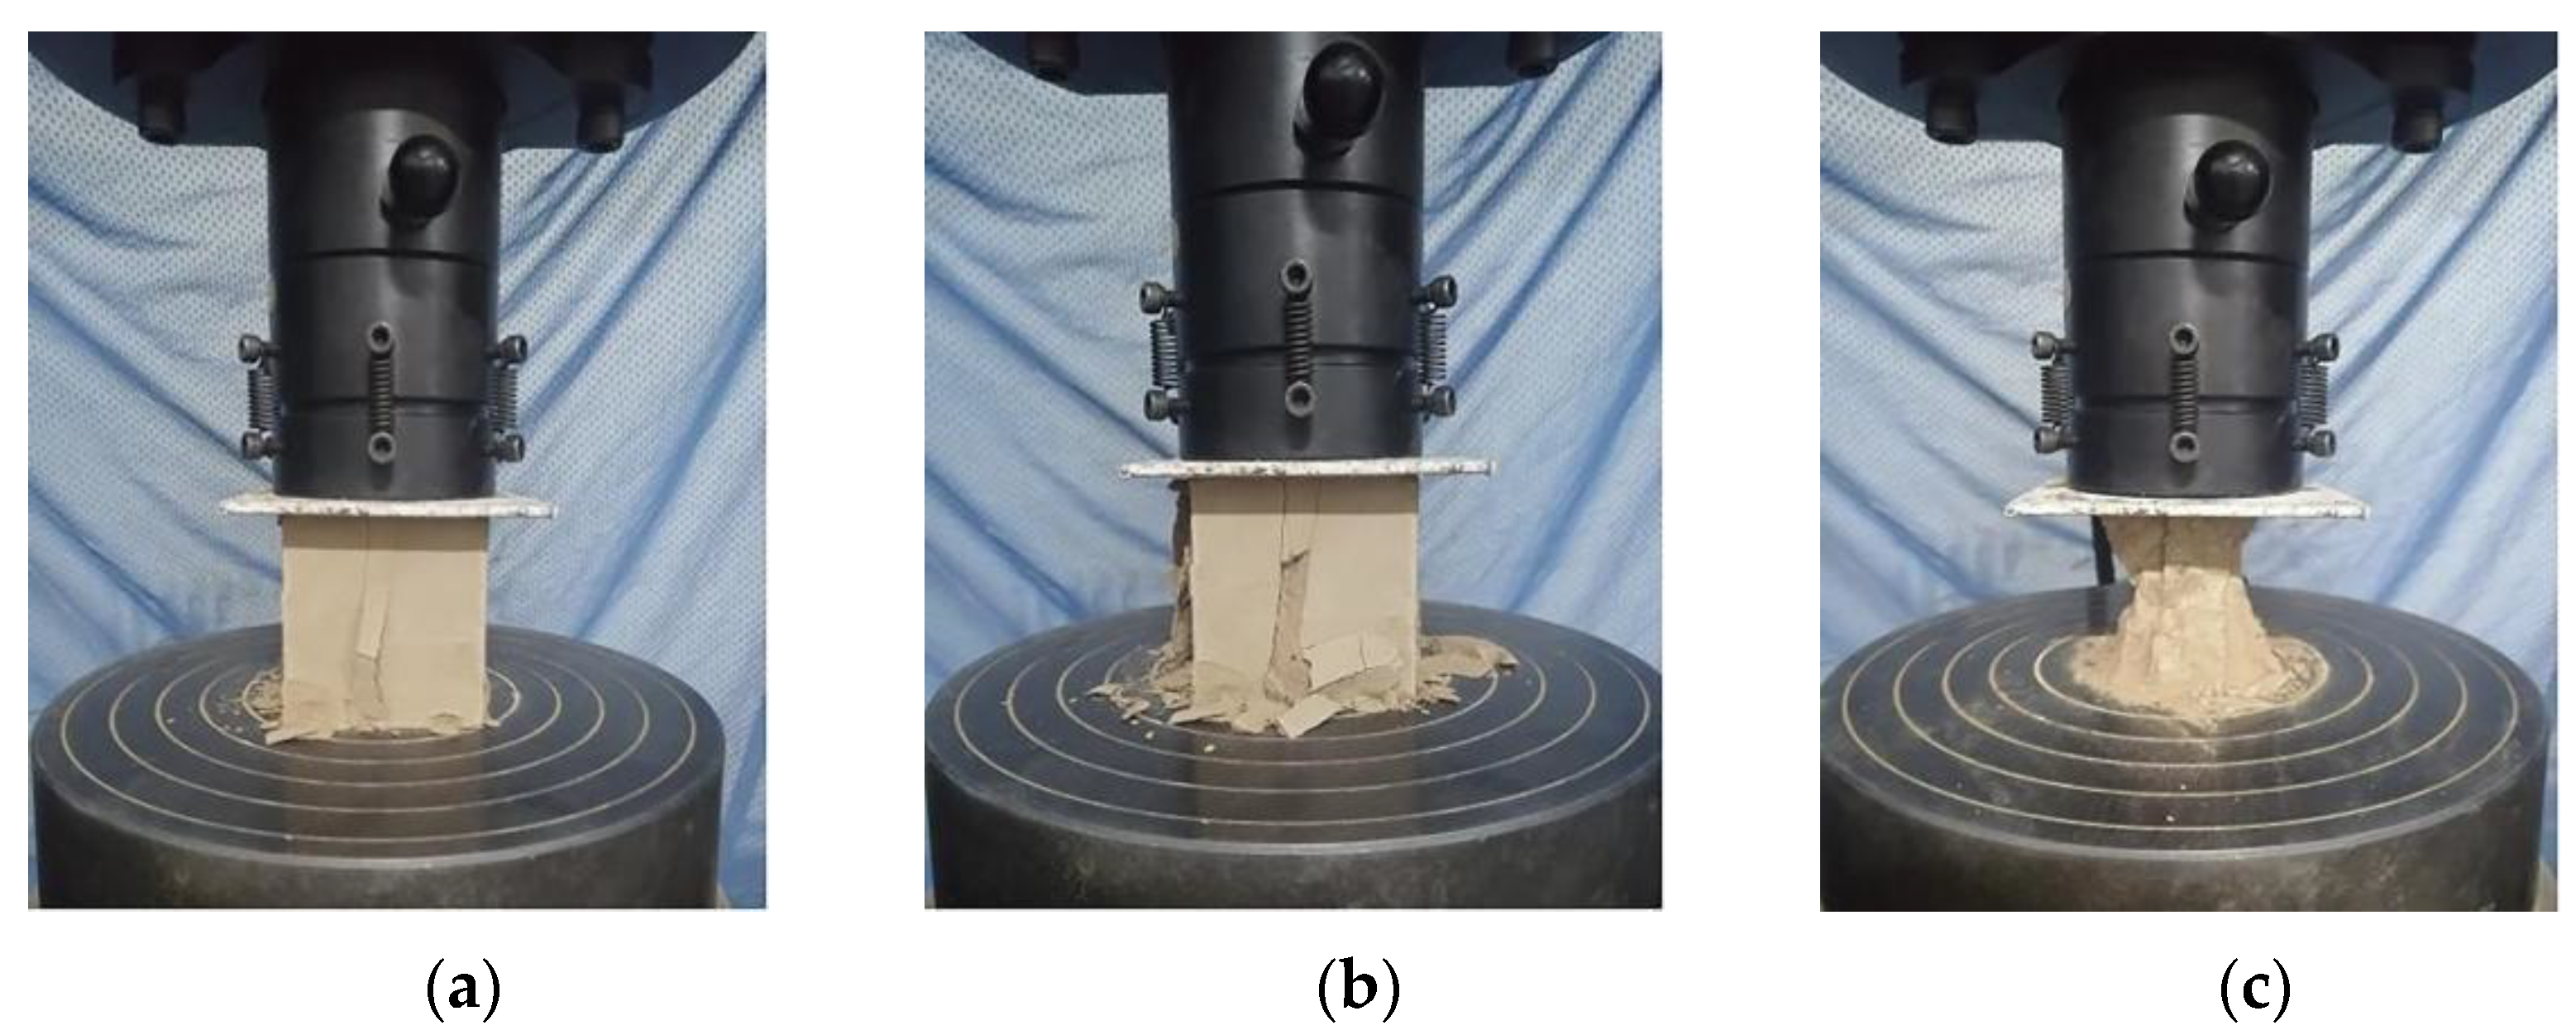
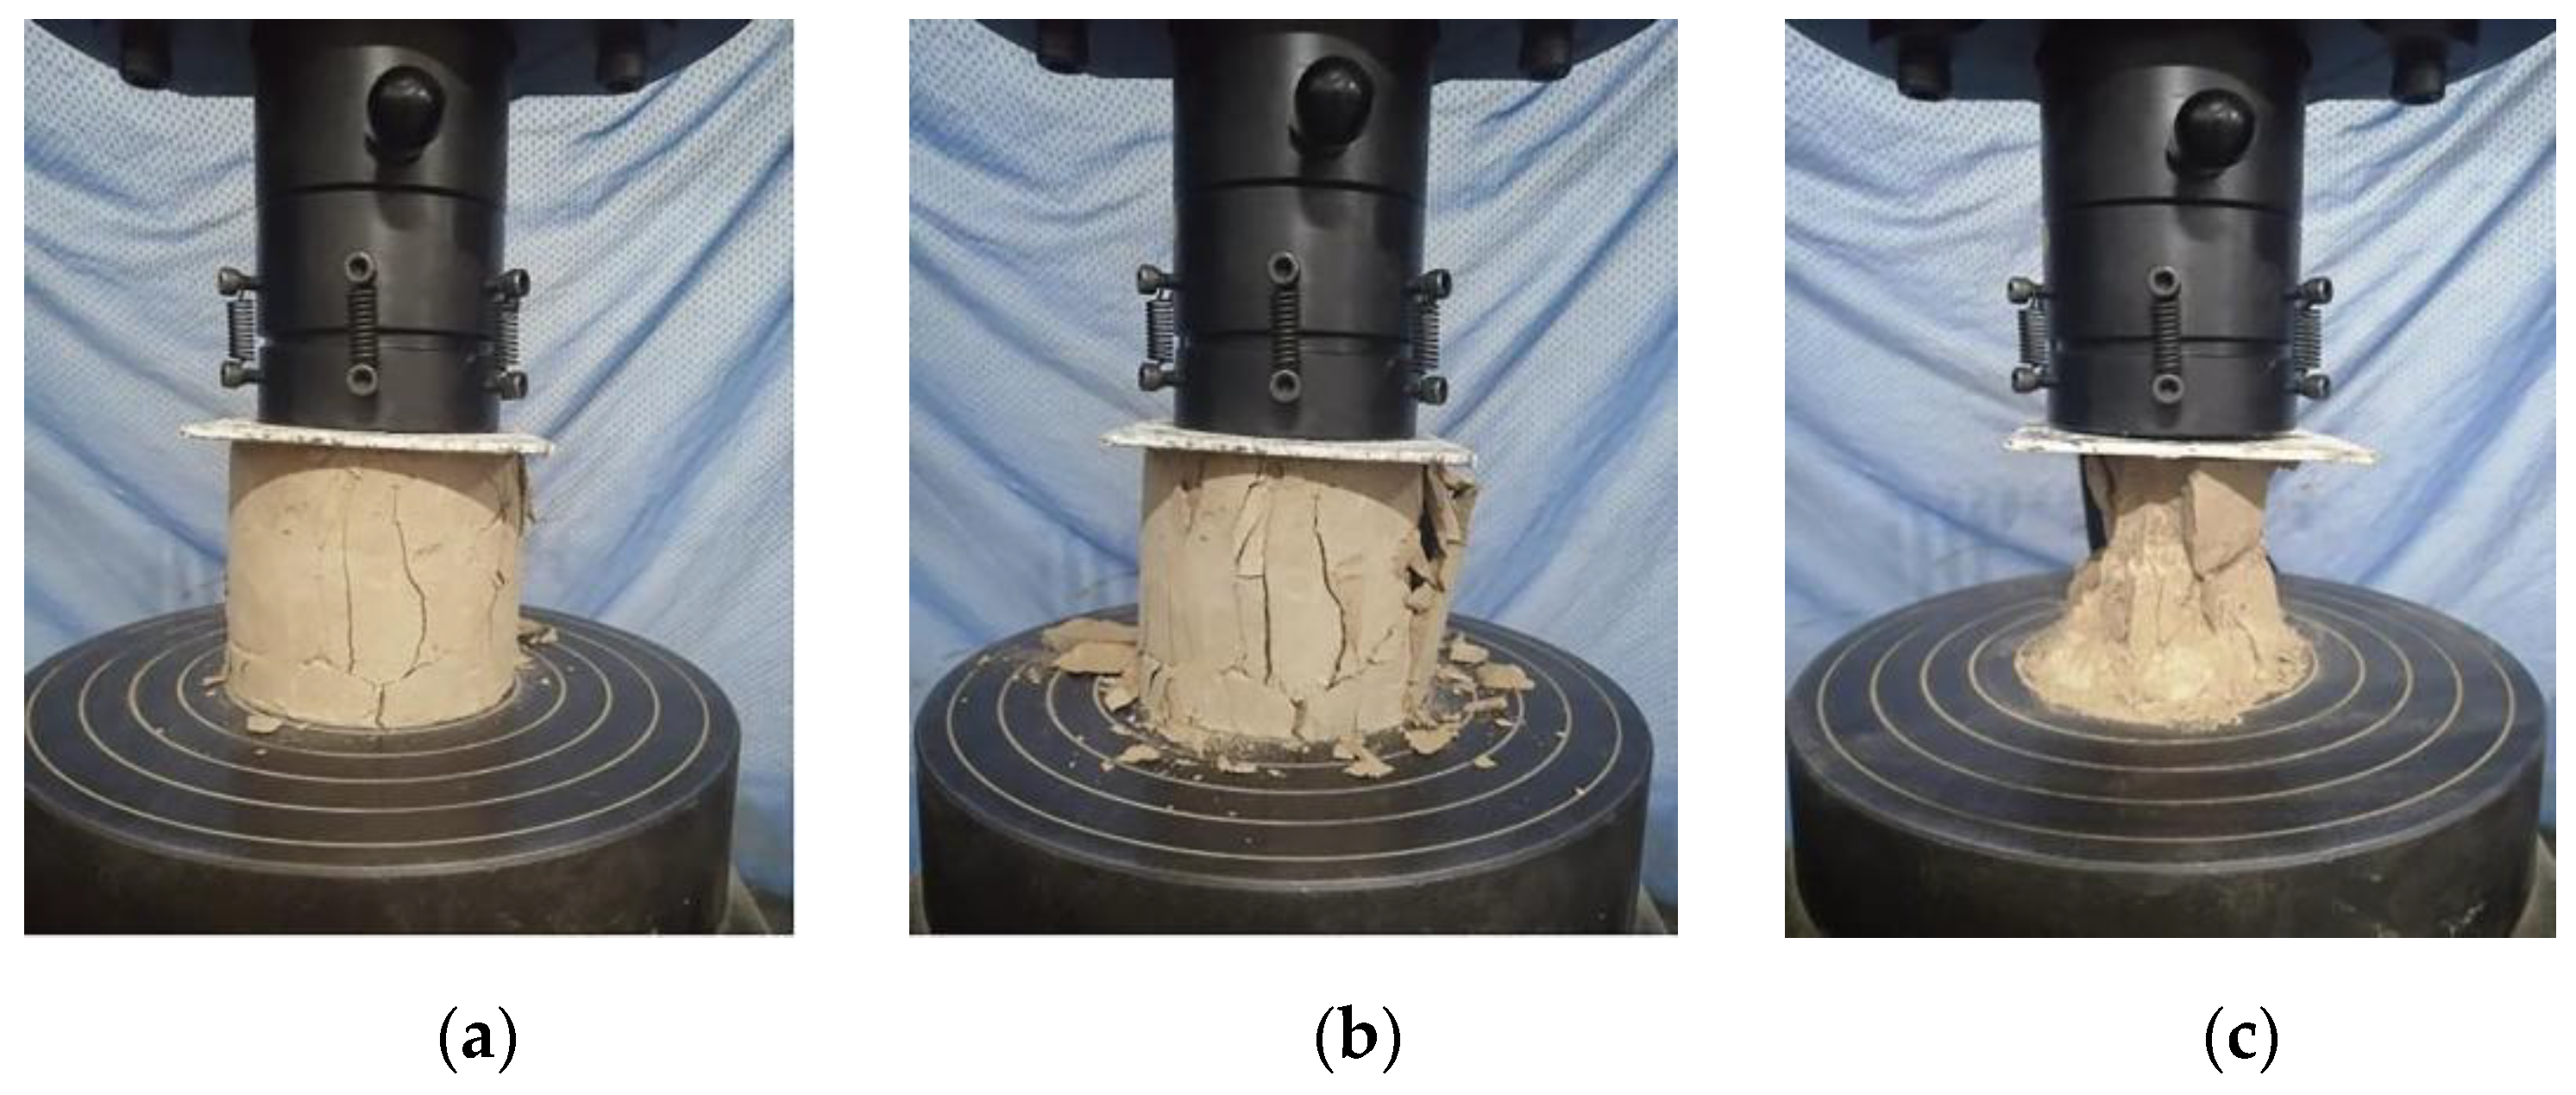
2.3. Experimental Results and Discussion

The failure phenomena of the specimens are shown in Figure 6 and Figure 7. It can be seen that the failure process and test phenomena of the cubic and cylindrical specimens are similar. At the early stage of the test, the specimen block did not change significantly with the increase in the load. When the load reached 55% of the peak load, fine cracks appeared in the corners of the cubic specimen and expanded rapidly. The cylindrical specimens showed small vertical cracks at the loaded end that extended to the lower part. When the load increased to its peak, there were several wide cracks through the surface of each specimen, and the skin swelled off. As the displacement continued to increase, the load continued to decrease. The cracks on the surface of the specimen fully developed, and the soil at the edge was flaked off, and the specimen was damaged due to the loss of its bearing capacity. The final failure pattern of all specimens is basically an hourglass-shaped.
The mean compressive strength, peak compressive strain, and coefficient of variation of the specimens obtained under different working conditions, such as different curing ages, shapes, sizes, and loading rates, are shown in Table 5. The comparison of the compressive strength and the coefficient of variation of the strength of the specimens under different working conditions are shown in Figure 8 and Figure 9, respectively. From Table 5 and Figure 8 and Figure 9, the following rules can be drawn:
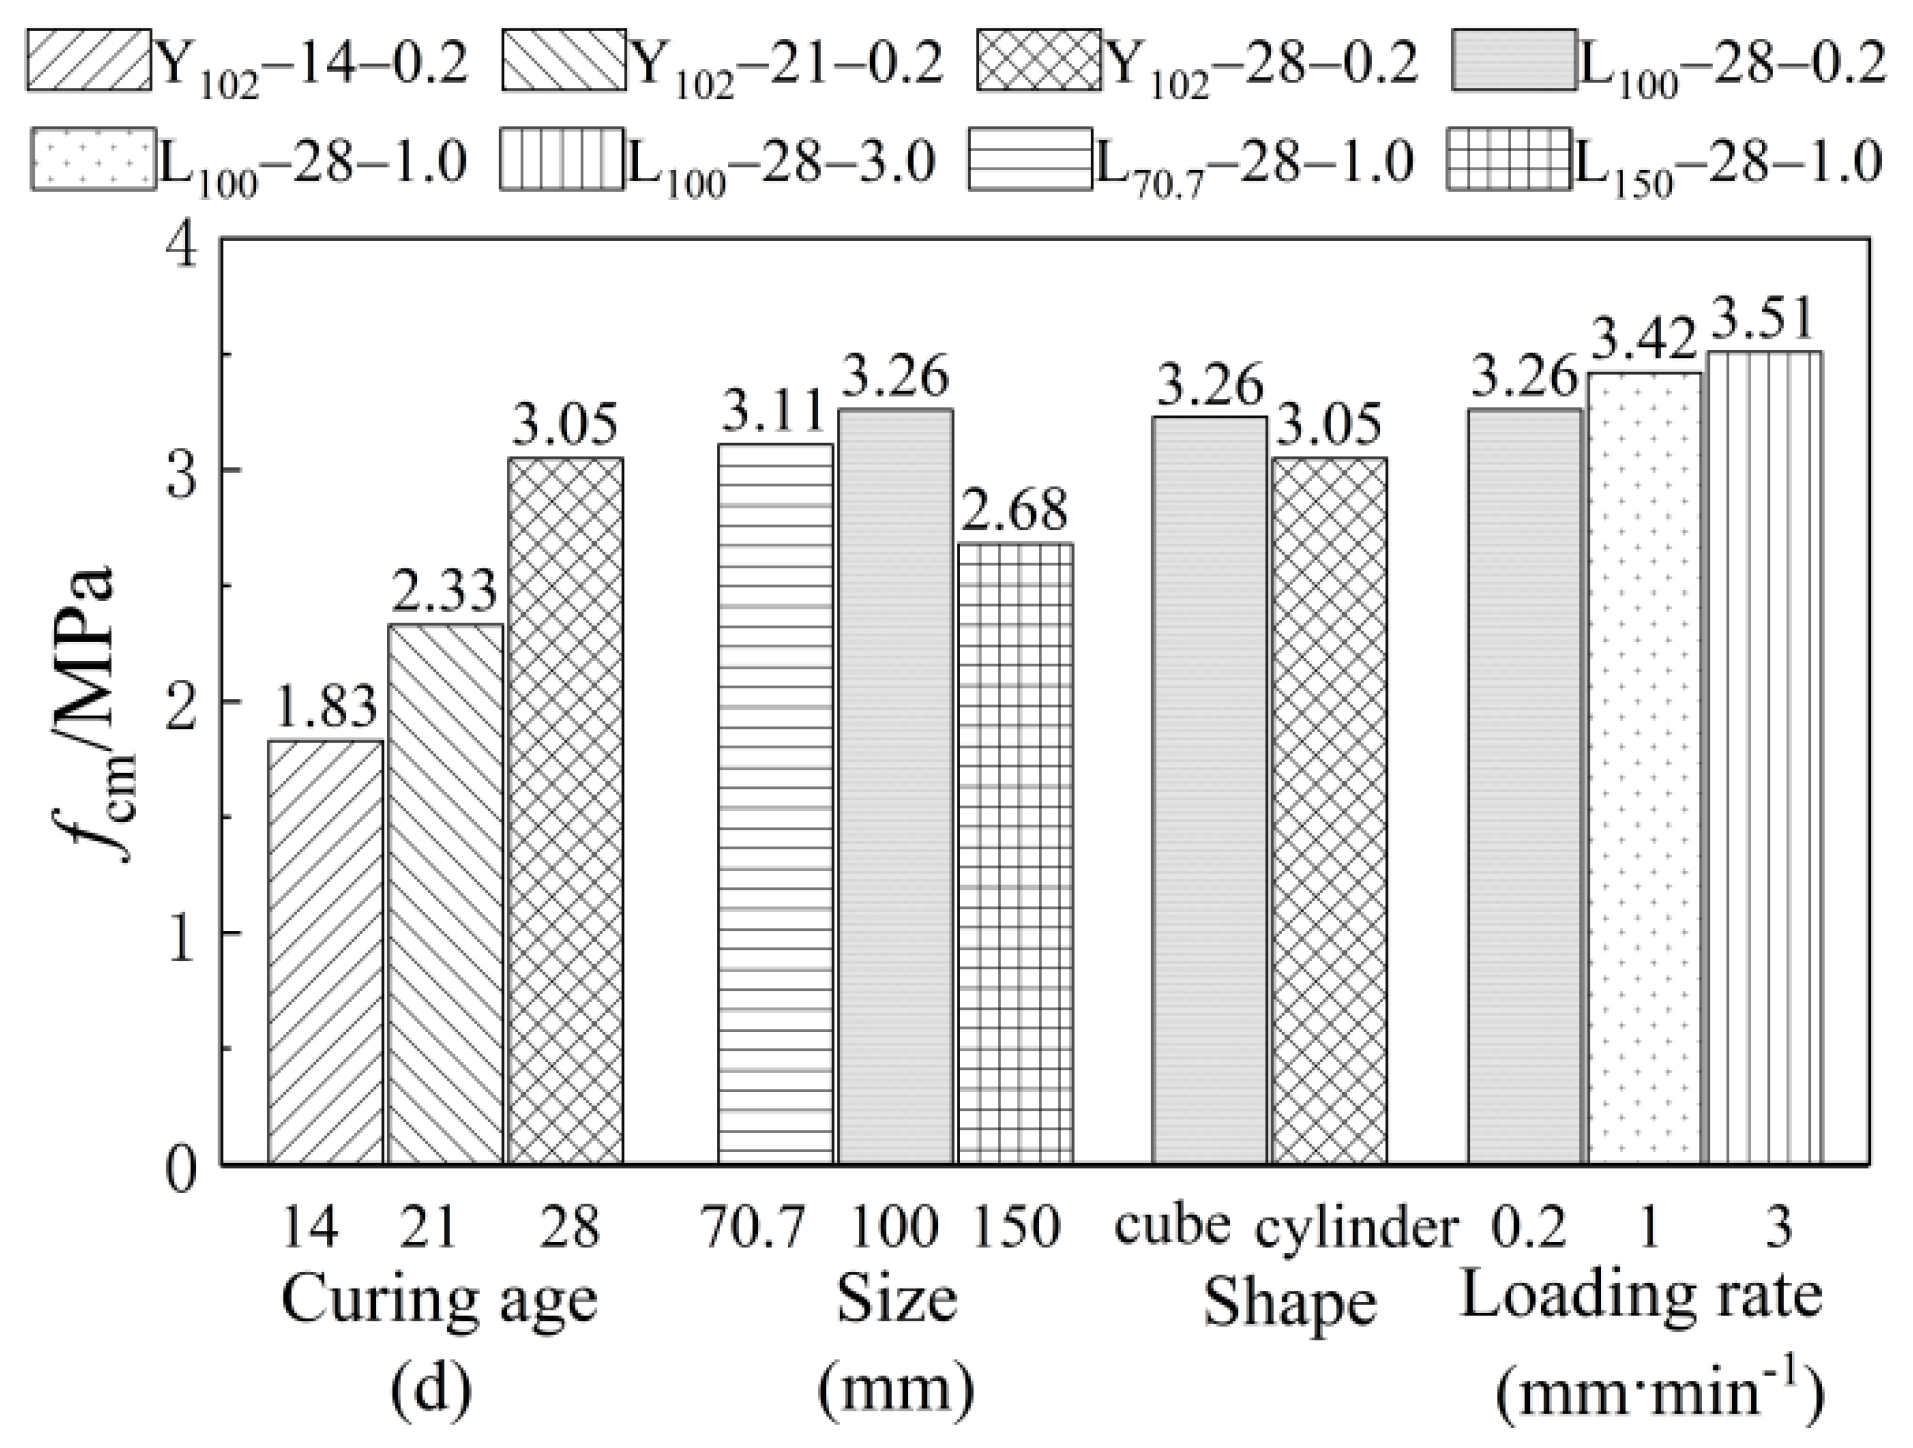
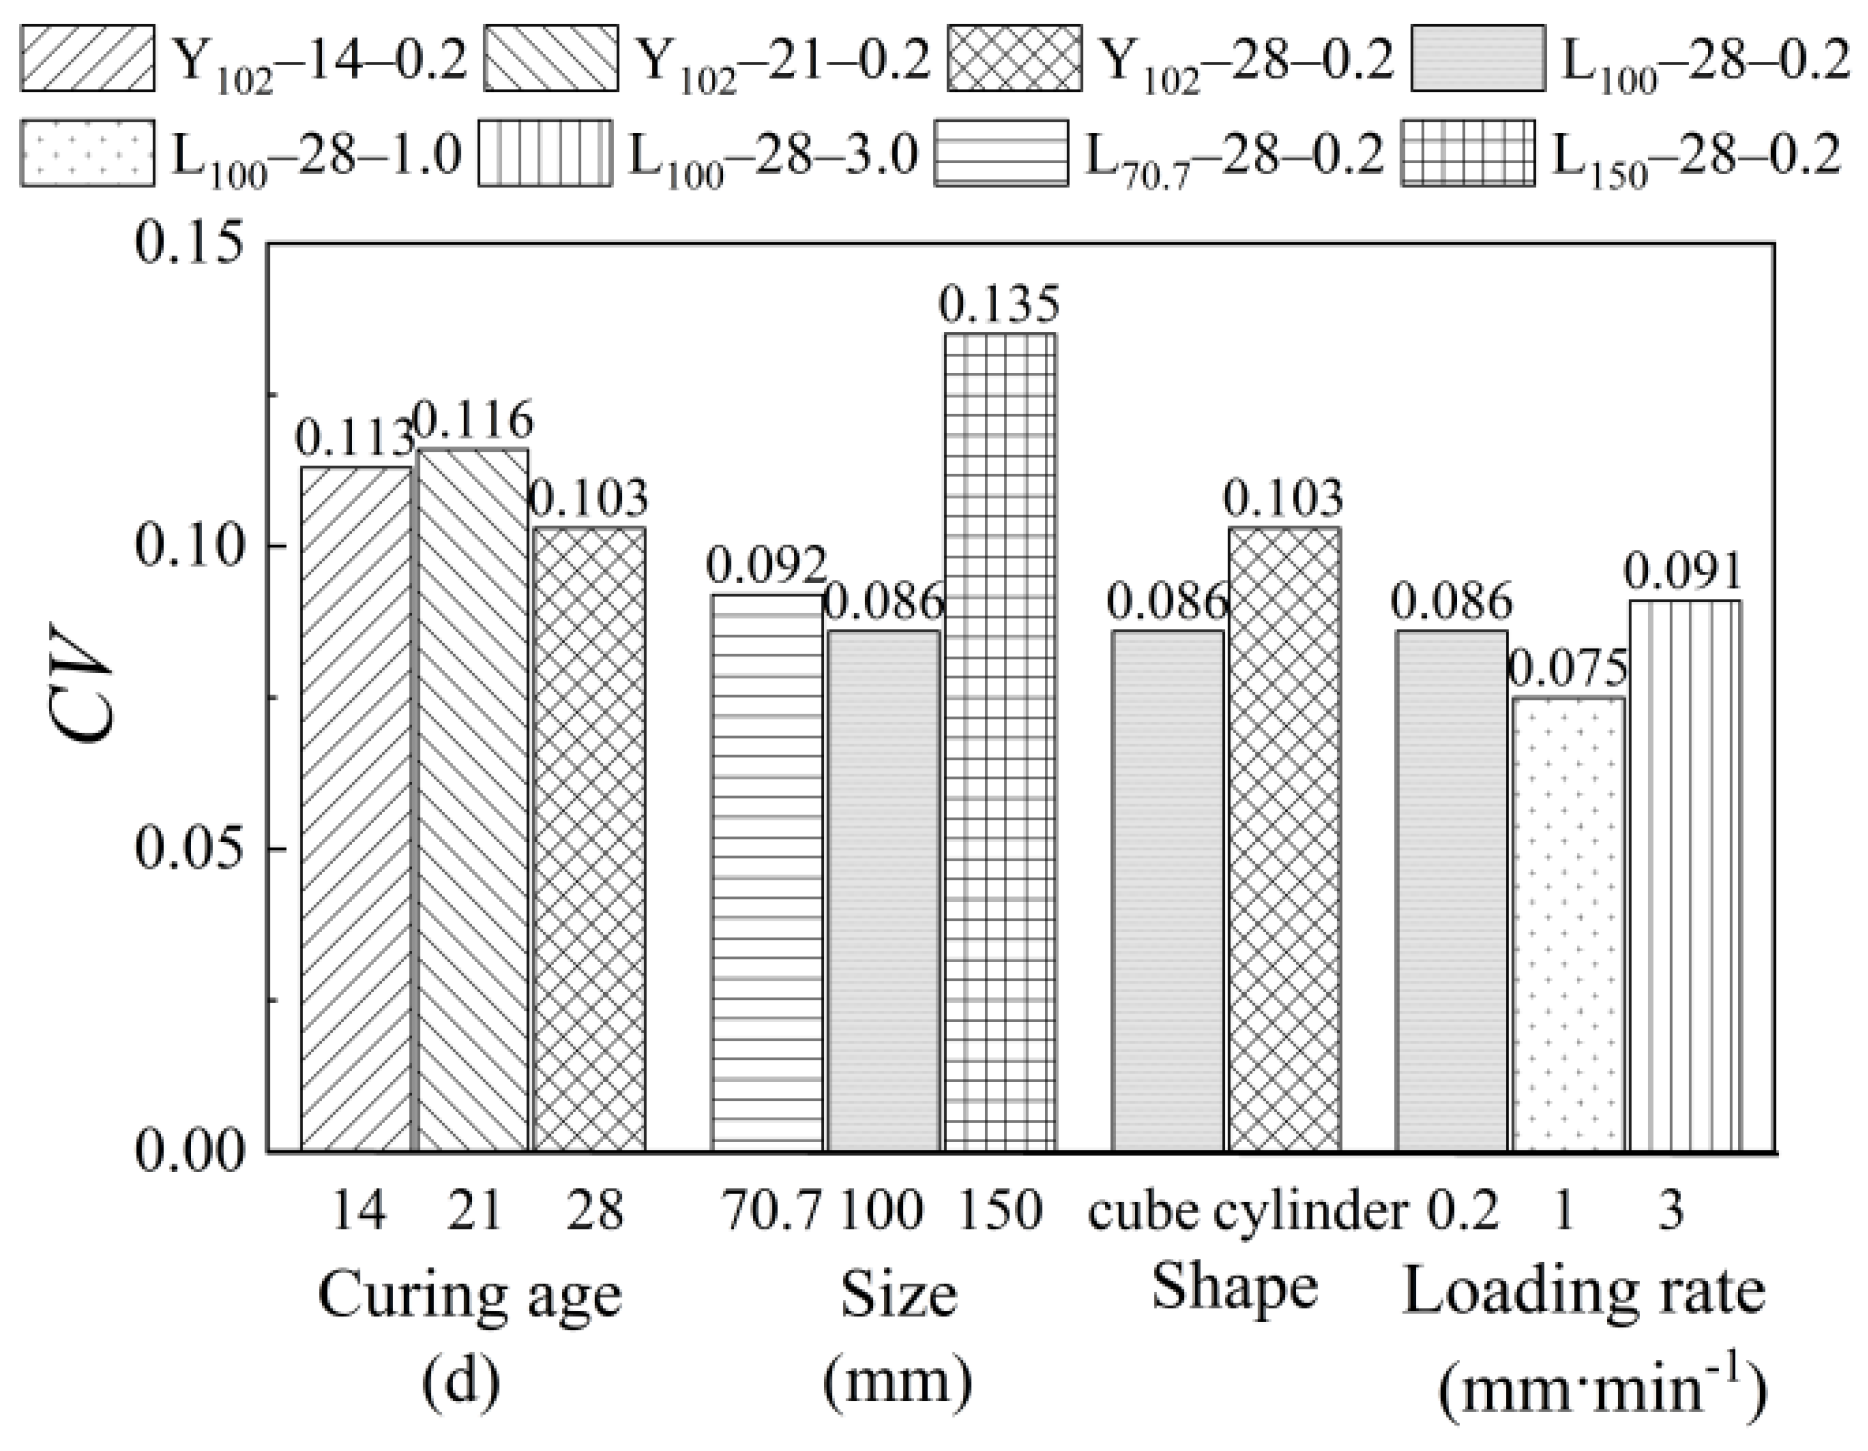
  • The compressive strength of the specimens increased with the increase in curing age. The compressive strengths of specimens Y102-14-0.2, Y102-21-0.2, and Y102-28-0.2 were 59% and 76% of 28 d at 14 d and 21 d, respectively. The reason is that the longer the age, the more sufficient the water loss hardening reaction inside the specimen. The internal soil particles have higher cohesion, stronger compactness, and higher compressive strength.
  • With the increase in size, the strength of the specimen first increased and then decreased. A 100-mm-cube specimen had the highest strength, and the effect of the size factor on the compressive strength was more significant. A 70.7-mm-cube had 96% of the compressive strength of a 100-mm-cube. A 150-mm-cube had only 83% of the compressive strength of a 100-mm-cube.
  • The specimen shape and loading rate have a slight effect on the compressive strength. The compressive strength of cylindrical specimens was 5.6% lower than that of cubic specimens. The compressive strengths of specimens with loading rates of 0.2 mm∙min−1 and 3.0 mm∙min−1 were 95.3% and 102.6% of the compressive strengths of specimens with 1 mm∙min−1, respectively. The strength differences of the specimens were all within the range of 6%.
  • It is recommended to use a 100 mm × 100 mm × 100 mm cube with a curing age of 28 d as the standard specimen. Then, 1.0 mm∙min−1 was adopted as the recommended loading rate for uniaxial compression testing of earth materials. As can be seen from Figure 9, the strength coefficient of variation of the specimens under the above test conditions is minimal, and the test results are relatively stable.

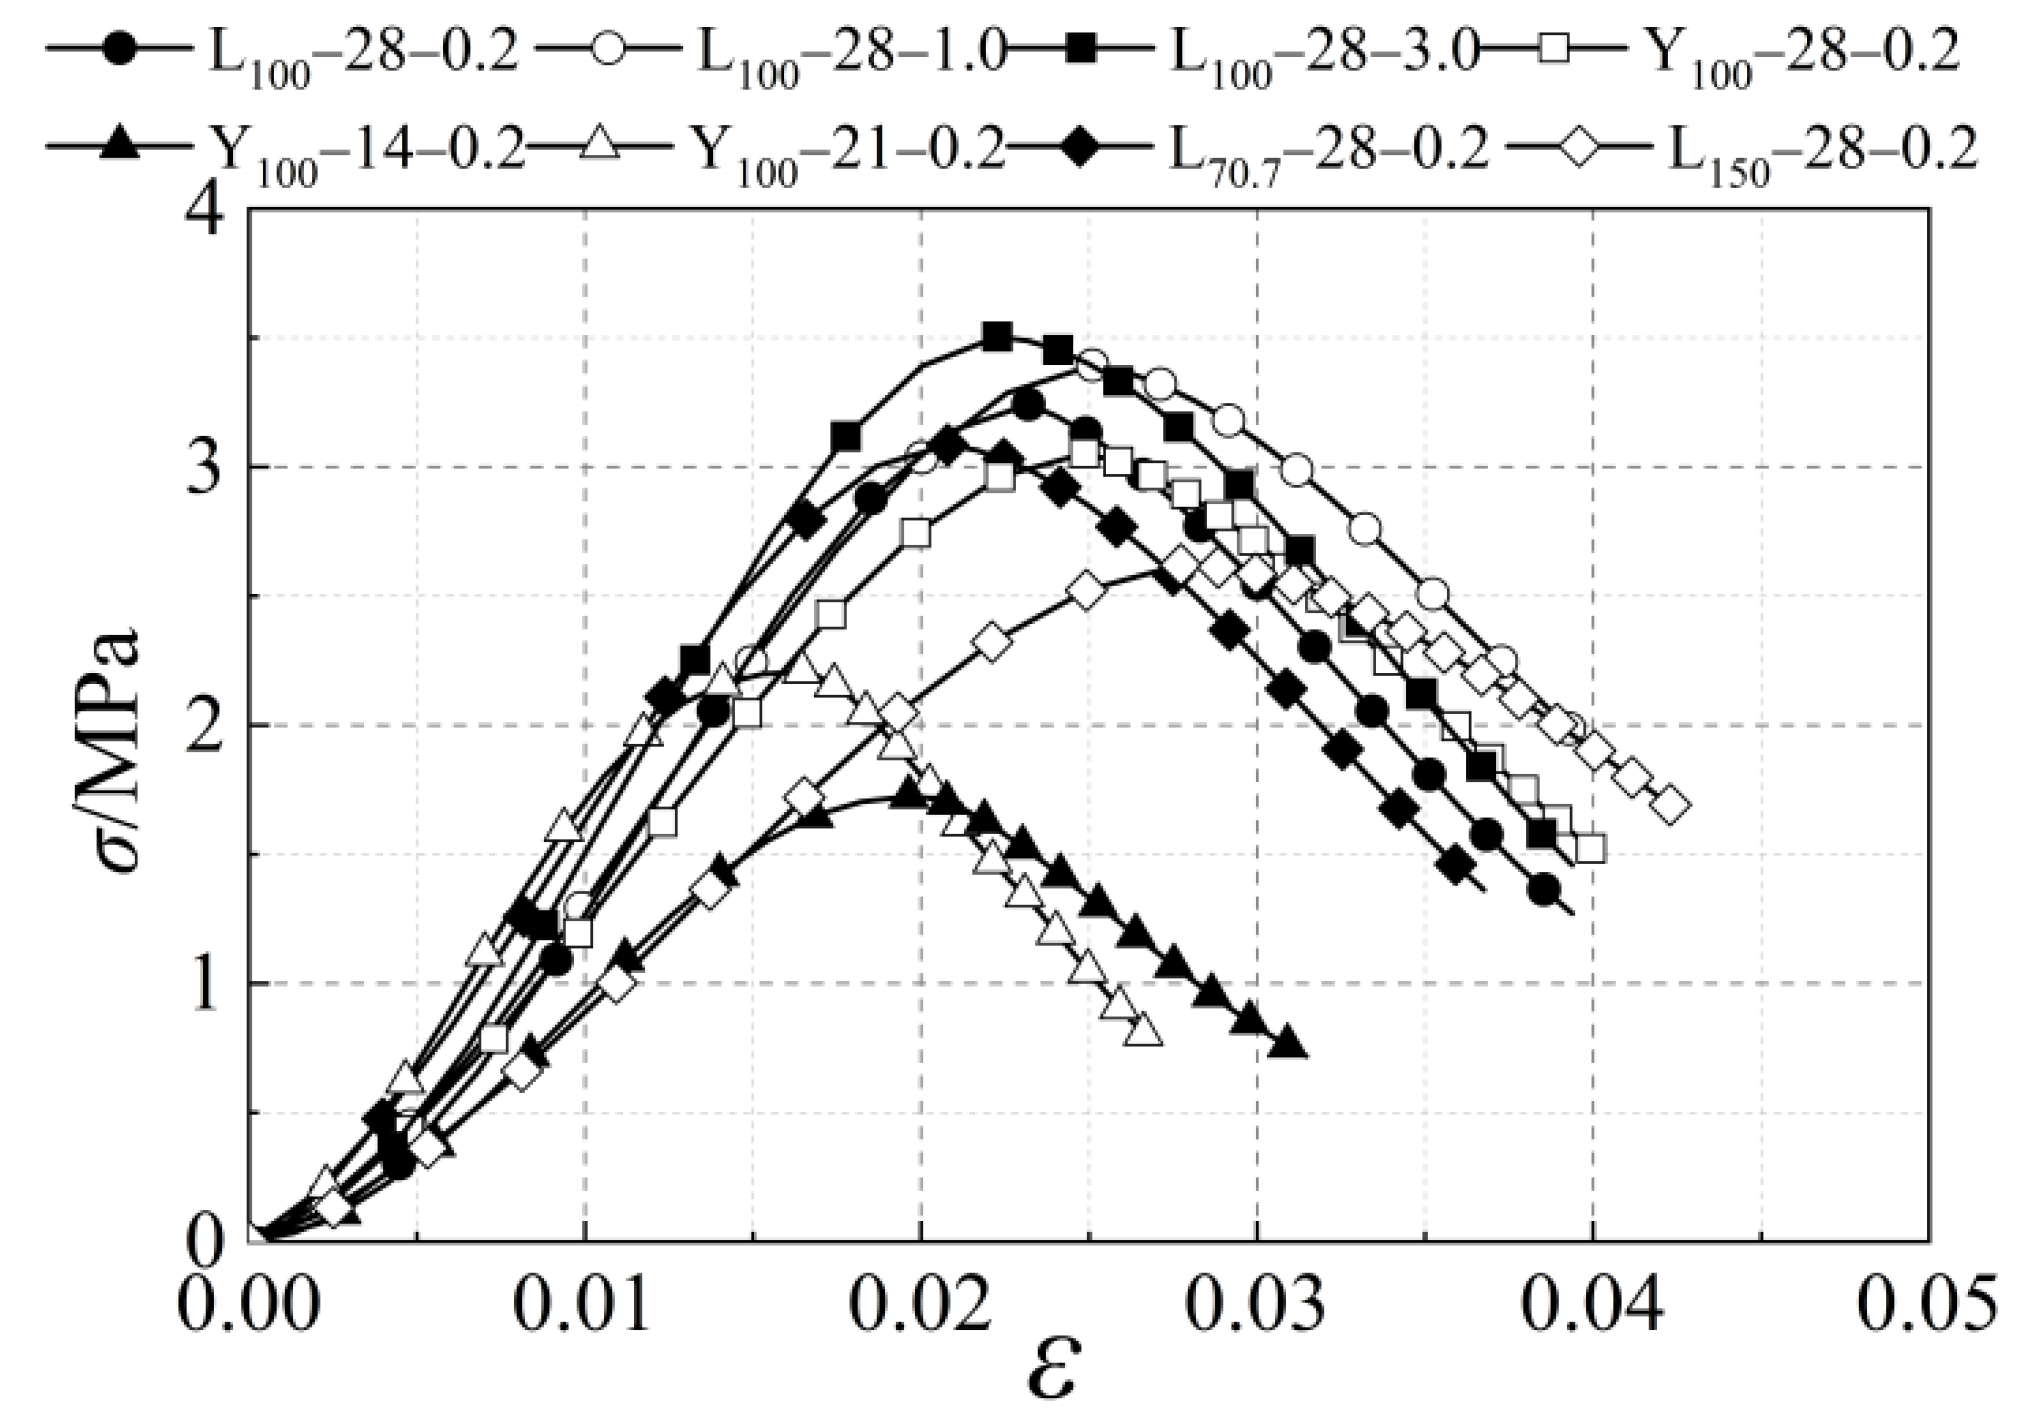
2.4. Experimental Stress-Strain Curve

The uniaxial compressive stress-strain curves of the earth material for different working conditions are given in Figure 10. The stress and strain results for the whole process of loading are obtained according to the load and displacement data collected during the test and processed using the following equations:
σ = F A
ε = Δ l l
where σ is the axial stress corresponding to each level of loading during the uniaxial compression test of the earth material, Mpa; F is the axial force applied at each level of loading, kN; A is the initial cross-sectional area of the specimen, mm2; ε is the axial strain corresponding to each level of loading during the uniaxial compression test of the earth material; Δl is the displacement deformation under compression at each level of loading, mm; l is the initial height of the specimen, mm.
In Figure 10, it can be seen that the stress-strain curves of the eight groups of specimens basically follow the same trend. It consists of two parts: the rising section and the descending section. In the ascending section, there is an initial concave section, i.e., the slope of the curve in the ascending section first increases and then decreases. Due to the gentle curve transition, it can be excluded that the formation of the initial under-concave section was caused by the poor contact between the specimen and the loaded end. This feature is also shown in [35]. It can be seen that the initial depression of the stress-strain curve is typical for earth materials. The formation is due to the production process and natural maintenance method of the earth specimen, which will make more initial pores and fine cracks exist inside the specimen. Under the action of a small vertical load, the fine cracks and pores will be first closed and filled by squeezing. That is, the test block is rapidly compressed and deformed under a smaller load. This is characterized in the stress-strain curve as an initial underconcave section.
In conclusion, we take the ratio of the axial stress σ to the peak stress σpr (y = σ/σpr) in uniaxial compression of the earth material as the vertical coordinate, and the ratio of the axial compressive strain ε to the peak compressive strain εpr (x = ε/εpr) as the horizontal coordinate. The typical uniaxially compressed dimensionless stress-strain curve of the earth material is finally obtained, as shown in Figure 11. The curve can be divided into four distinct phases, which are: the initial under-concave section (0 ≤ x ≤ xa), the elastic growth section (xa ≤ x ≤ xb), the yielding stage (xb ≤ x ≤ xc), and the damage stage (xc ≤ x ≤ xd). The four characteristic points a, b, c, and d on the curve are defined as: point a is the specimen micro-crack and pore pressure density point; point b is the specimen yield point; point c is the specimen peak strength point; and point d is the specimen failure point.

3. Uniaxial Compressive Constitutive Equation Establishment

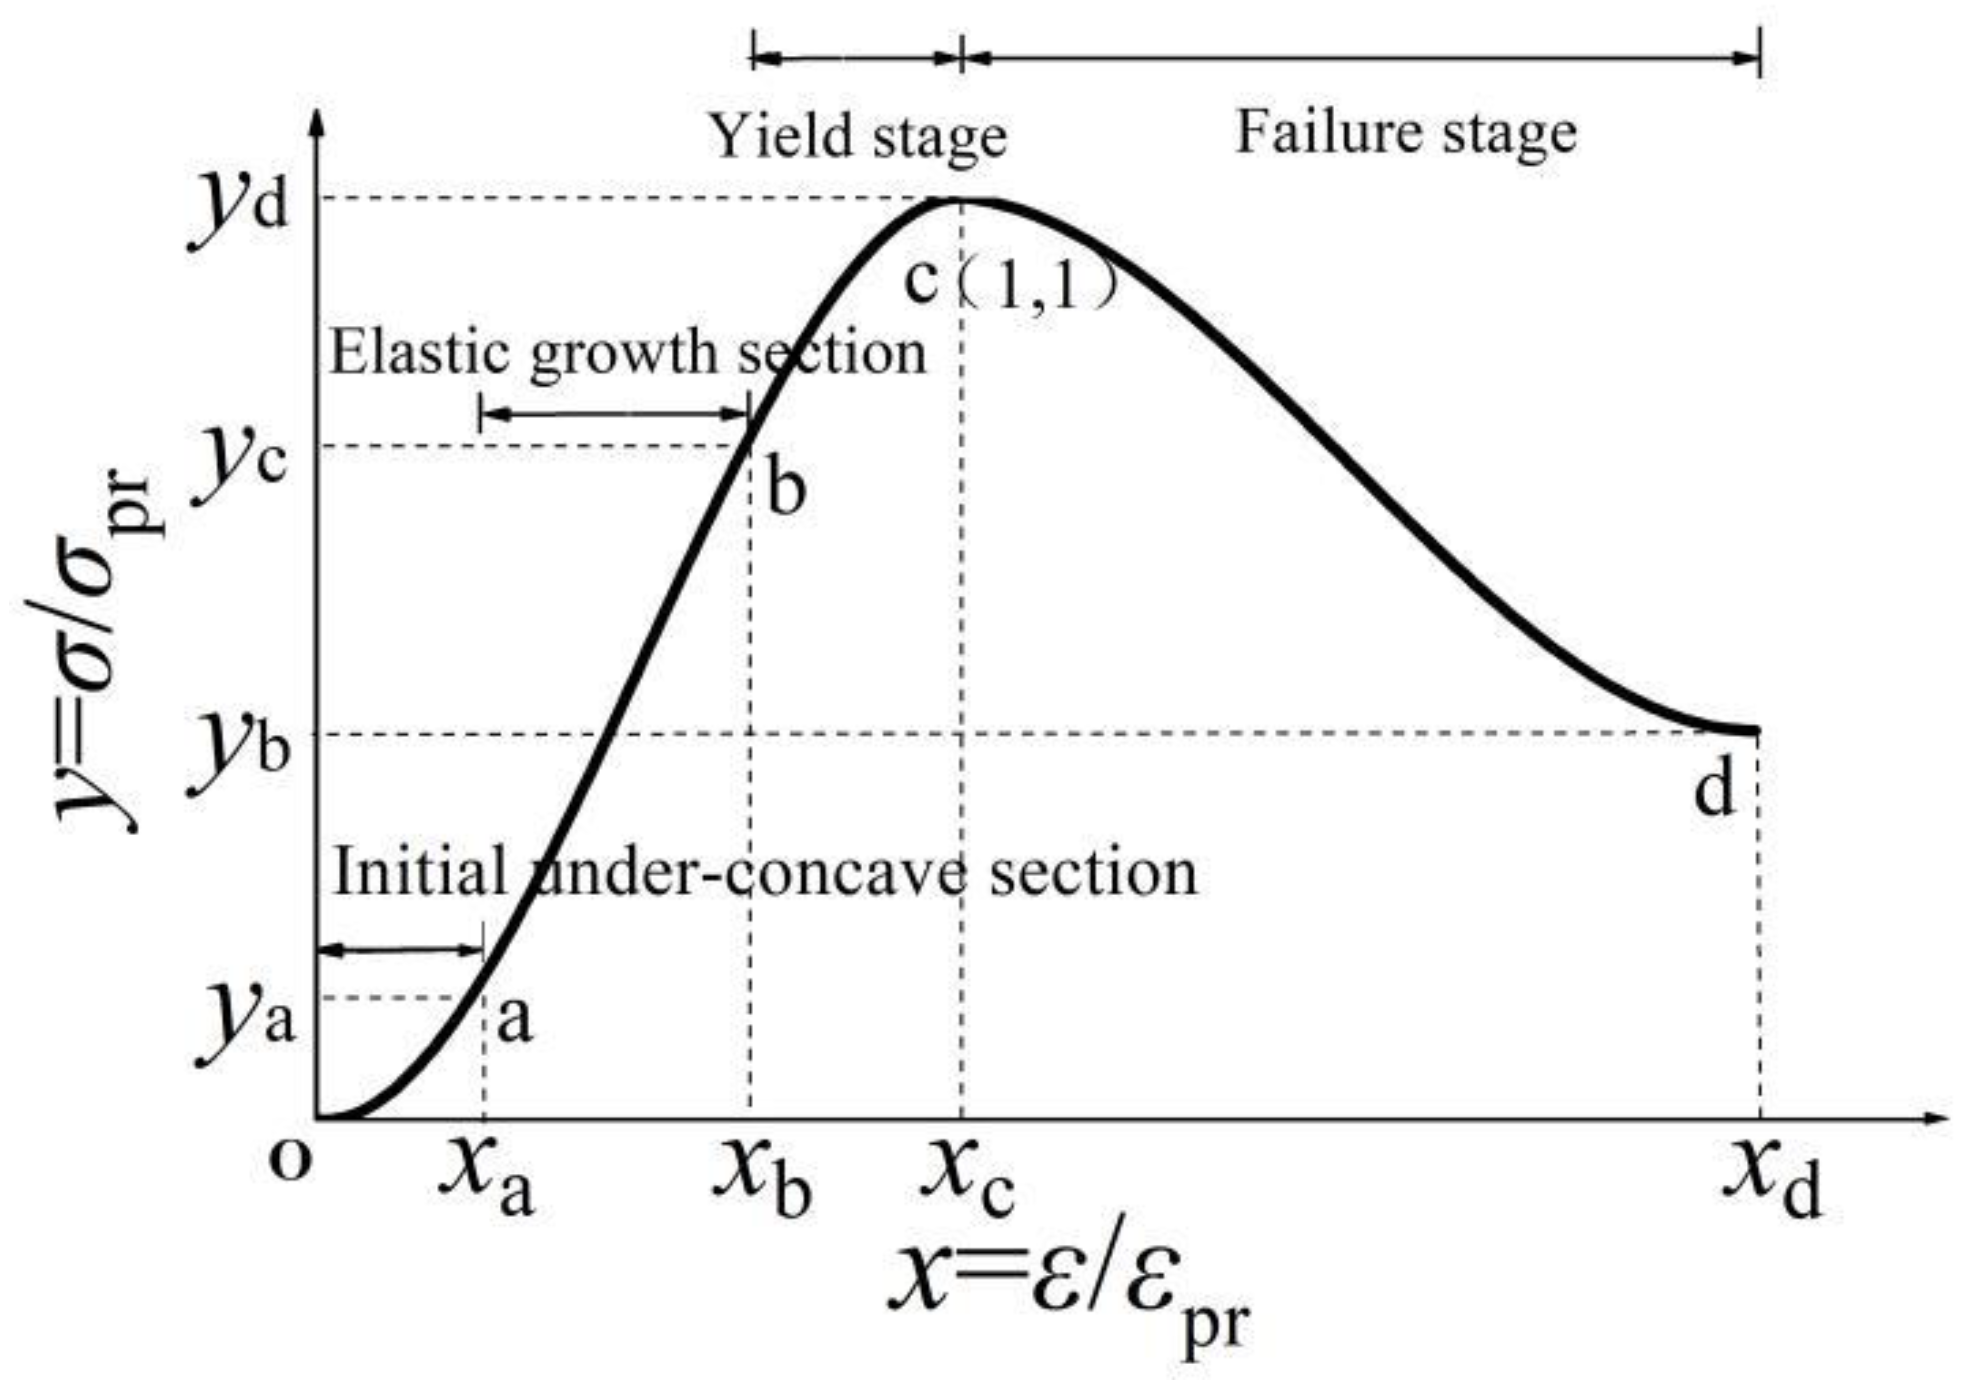
3.1. Proposition of Modified Constitutive Equation

Based on their own experiments, many scholars put forward the corresponding constitutive equation of earth materials under uniaxial compression. There were mainly rational fractions proposed by Adorni [18] and piecewise functions proposed by Zhang Youchao [35], Illampas [20], and Zhong Jiqing [36].
By comparison, we found that the stress-strain curve obtained by fitting the constitutive equation (Equation (4)) of Illampas [20] can better characterize the initial depression of the rising section of the stress-strain curve of the earth materials. However, Equation (4) depicts a curve at y = 1 with x = 1.07, which is not consistent with the characteristics of the stress-strain curve in dimensionless form, so it was corrected. That is, both the rising and descending section functions satisfied the condition at x = 1 and y = 1. Then, we substituted y = σ/σpr and x = ε/εpr. The final obtained uniaxial compressive constitutive equation form of the earth material is shown in Equation (5).
σ σ pr = { a 1 ( ε ε pr ) + b 1 ( ε ε pr ) 2 + c 1 ( ε ε pr ) 3 ( 0 ε ε pr 1 ) a 2 + b 2 ( ε ε pr ) + c 2 ( ε ε pr ) 2 + d 2 ( ε ε pr ) 3 ( ε ε pr 1 )
where a1, b1, and c1 are the shape parameters of the rising section curve; a2, b2, c2, and d2 are the shape parameters of the descending section curve; σ is the axial stress corresponding to each level of loading during the uniaxial compressive test of the earth materials, (Mpa); σpr is the peak compressive strength of the uniaxial compressive test of the earth materials, (Mpa); εpr is the peak compressive strain corresponding to the peak compressive strength.
σ σ pr = { a 1 ( ε ε pr ) + b 1 ( ε ε pr ) 2 + ( 1 a 1 b 1 ) ( ε ε pr ) 3 ( 0 ε ε pr 1 ) a 2 + b 2 ( ε ε pr ) + c 2 ( ε ε pr ) 2 + ( 1 a 2 b 2 c 2 ) ( ε ε pr ) 3 ( ε ε pr 1 )
It can be seen from Equation (5) that whether the modified constitutive equation can be applied to structural calculation and analysis still needs to be verified by the applicability of the constitutive equation to the existing representative test curves. It is also necessary to establish the methods for taking the parameters of the rising and descending sections and the peak compressive strain of the present constitutive equation.

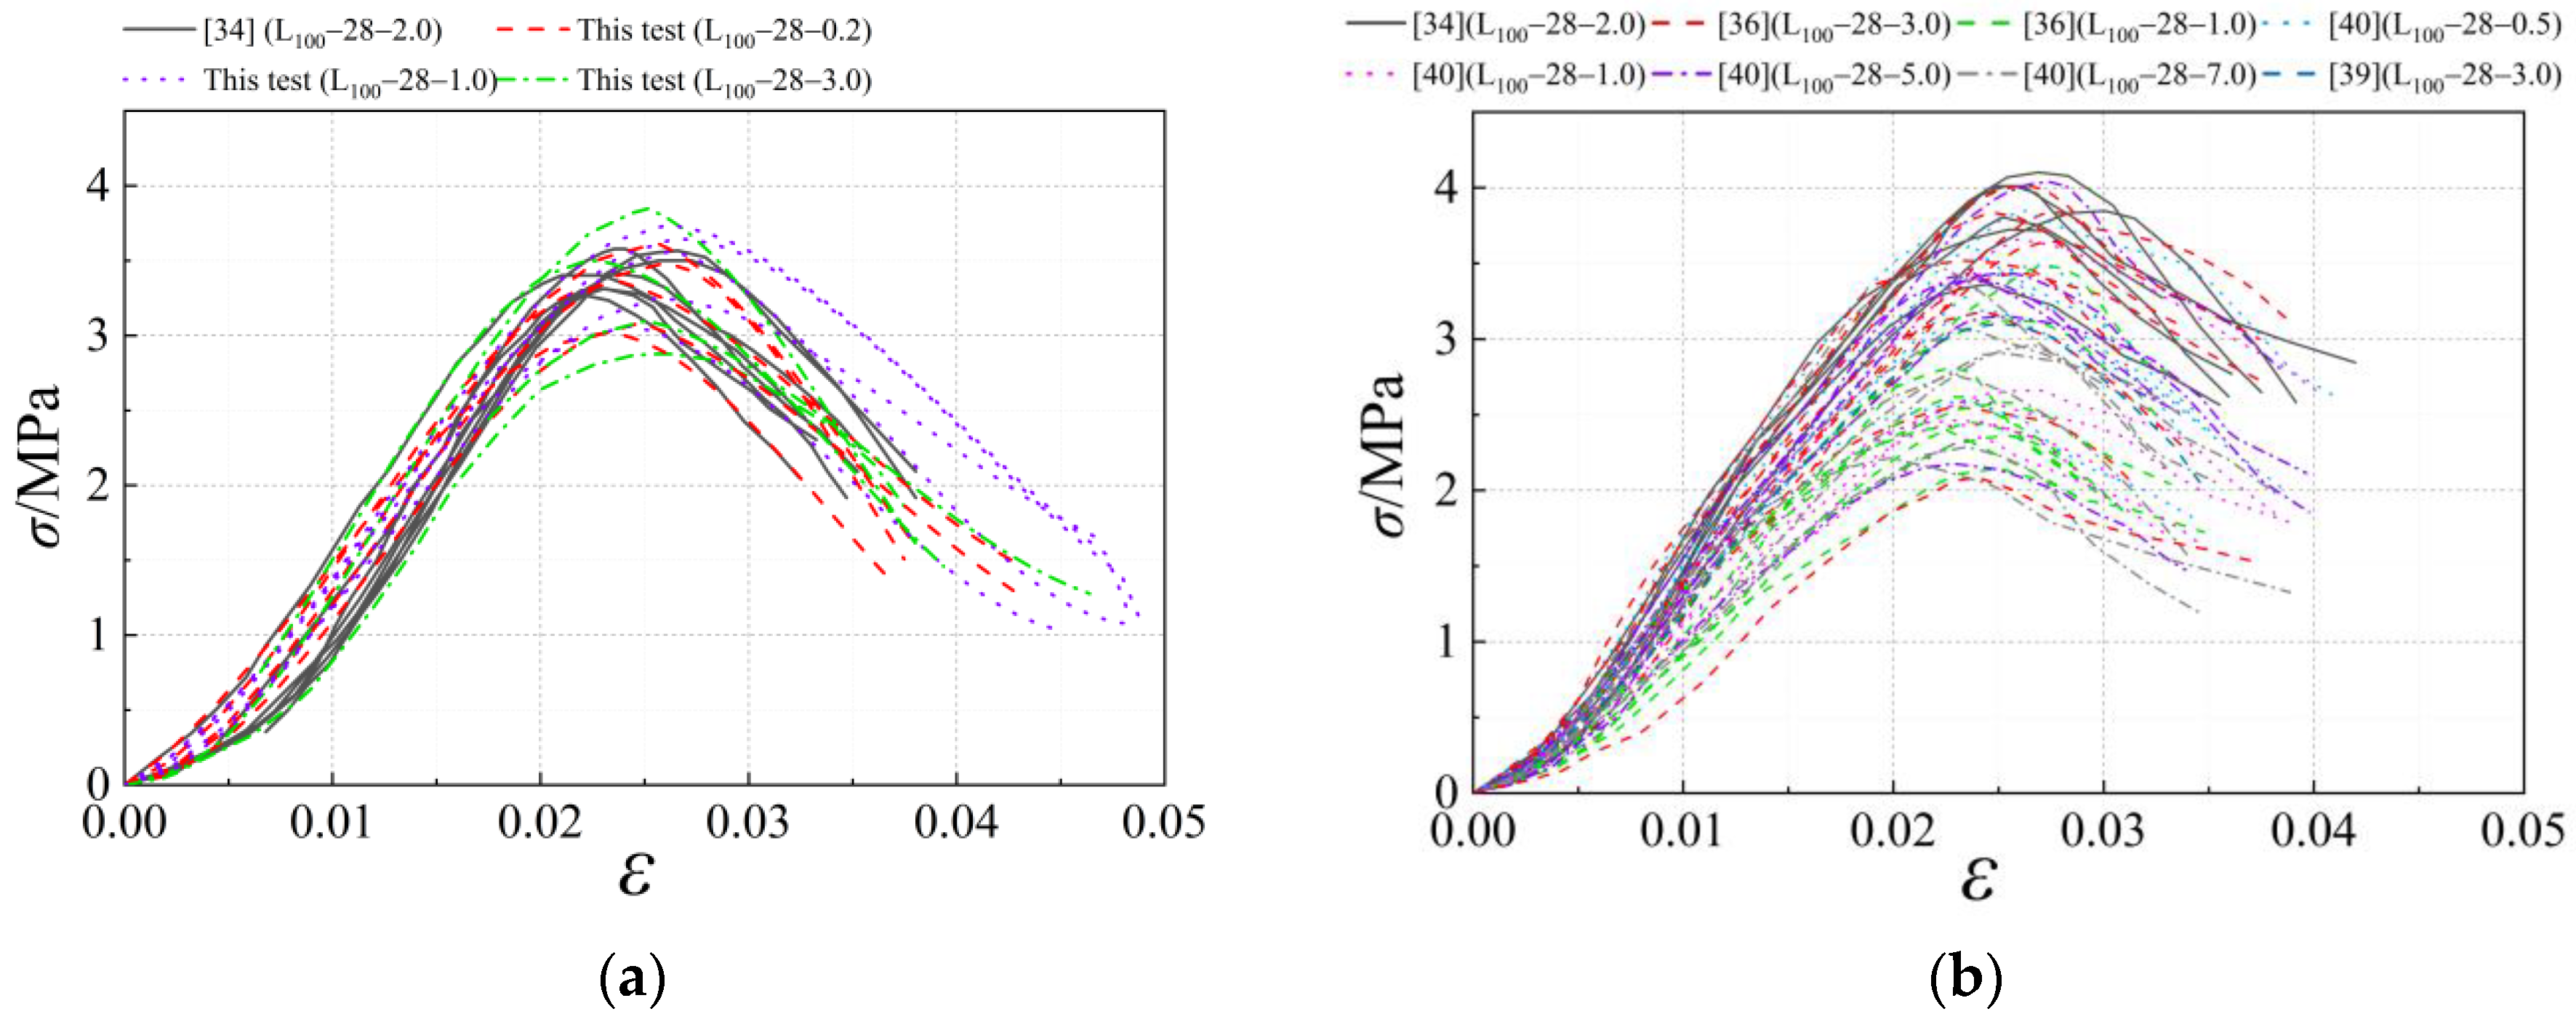
3.2. Applicability of the Modified Constitutive Equation

Since there is no standard test method for the uniaxial compression test of earth materials, the existing constitutive equations are obtained by fitting the test data obtained by the researcher himself. There are few studies on the wide applicability of the equations. Therefore, the purpose of this study is to establish a constitutive equation of earth materials under uniaxial compression that is suitable in different regions of China. The stress-strain curve of the earth materials compression test in this paper and related typical literature in China is fitted with the proposed modified constitutive equation to verify its applicability. Considering that the material modification will have a large effect on the physicochemical properties of the earth materials, which in turn will lead to a large change in the compressive stress-strain curve trend compared to the unmodified earth material [37]. Additionally, the test loading rate has a lower effect on the strength coefficient of variation. Therefore, in screening data samples from relevant literature, the effect of loading rate is not considered. The uniaxial compressive test curves of 100-mm-cubic standard specimens with a curing age of 28 d composed of unmodified earth materials (later referred to as earth materials) were selected for fitting to evaluate the applicability of the modified constitutive equations.
Based on this, 14 sets of 94 uniaxial compressive test curves of earth materials from different regions were extracted from the four articles that satisfied the above conditions [34,36,38,39]. The original curves have been plotted in Figure 12. Among them, soil samples were taken from Xinjiang, Shanxi, Fujian, and Heilongjiang, where the earth’s structure is widely prevalent [36]. The basic physical properties of earth materials from different regions used in the related literature are given in Table 6. Since the particle size range of the earth materials is missing in the relevant literature, only the Atterberg limit as well as the maximum dry density and optimum water content of the earth materials are listed in the table. It can be seen that all earth materials are low-liquid-limit clays. This is also consistent with the earth materials selected in this paper and related studies.
First, the test constitutive curve was normalized. Then, the equations were fitted according to the least squares principle using Origin 8.5 software to determine the values of the curve shape parameters for the rising and descending sections of each literature-fitted curve. Finally, the fitting effect of the present constitutive equation is judged according to the coefficient of determination R2. The results of the curve shape parameter calculation are shown in Table 7. The fitting curves with the largest and smallest R2 in this study and typical literature are shown in Figure 13.
The following patterns can be observed in Table 7 and Figure 13:
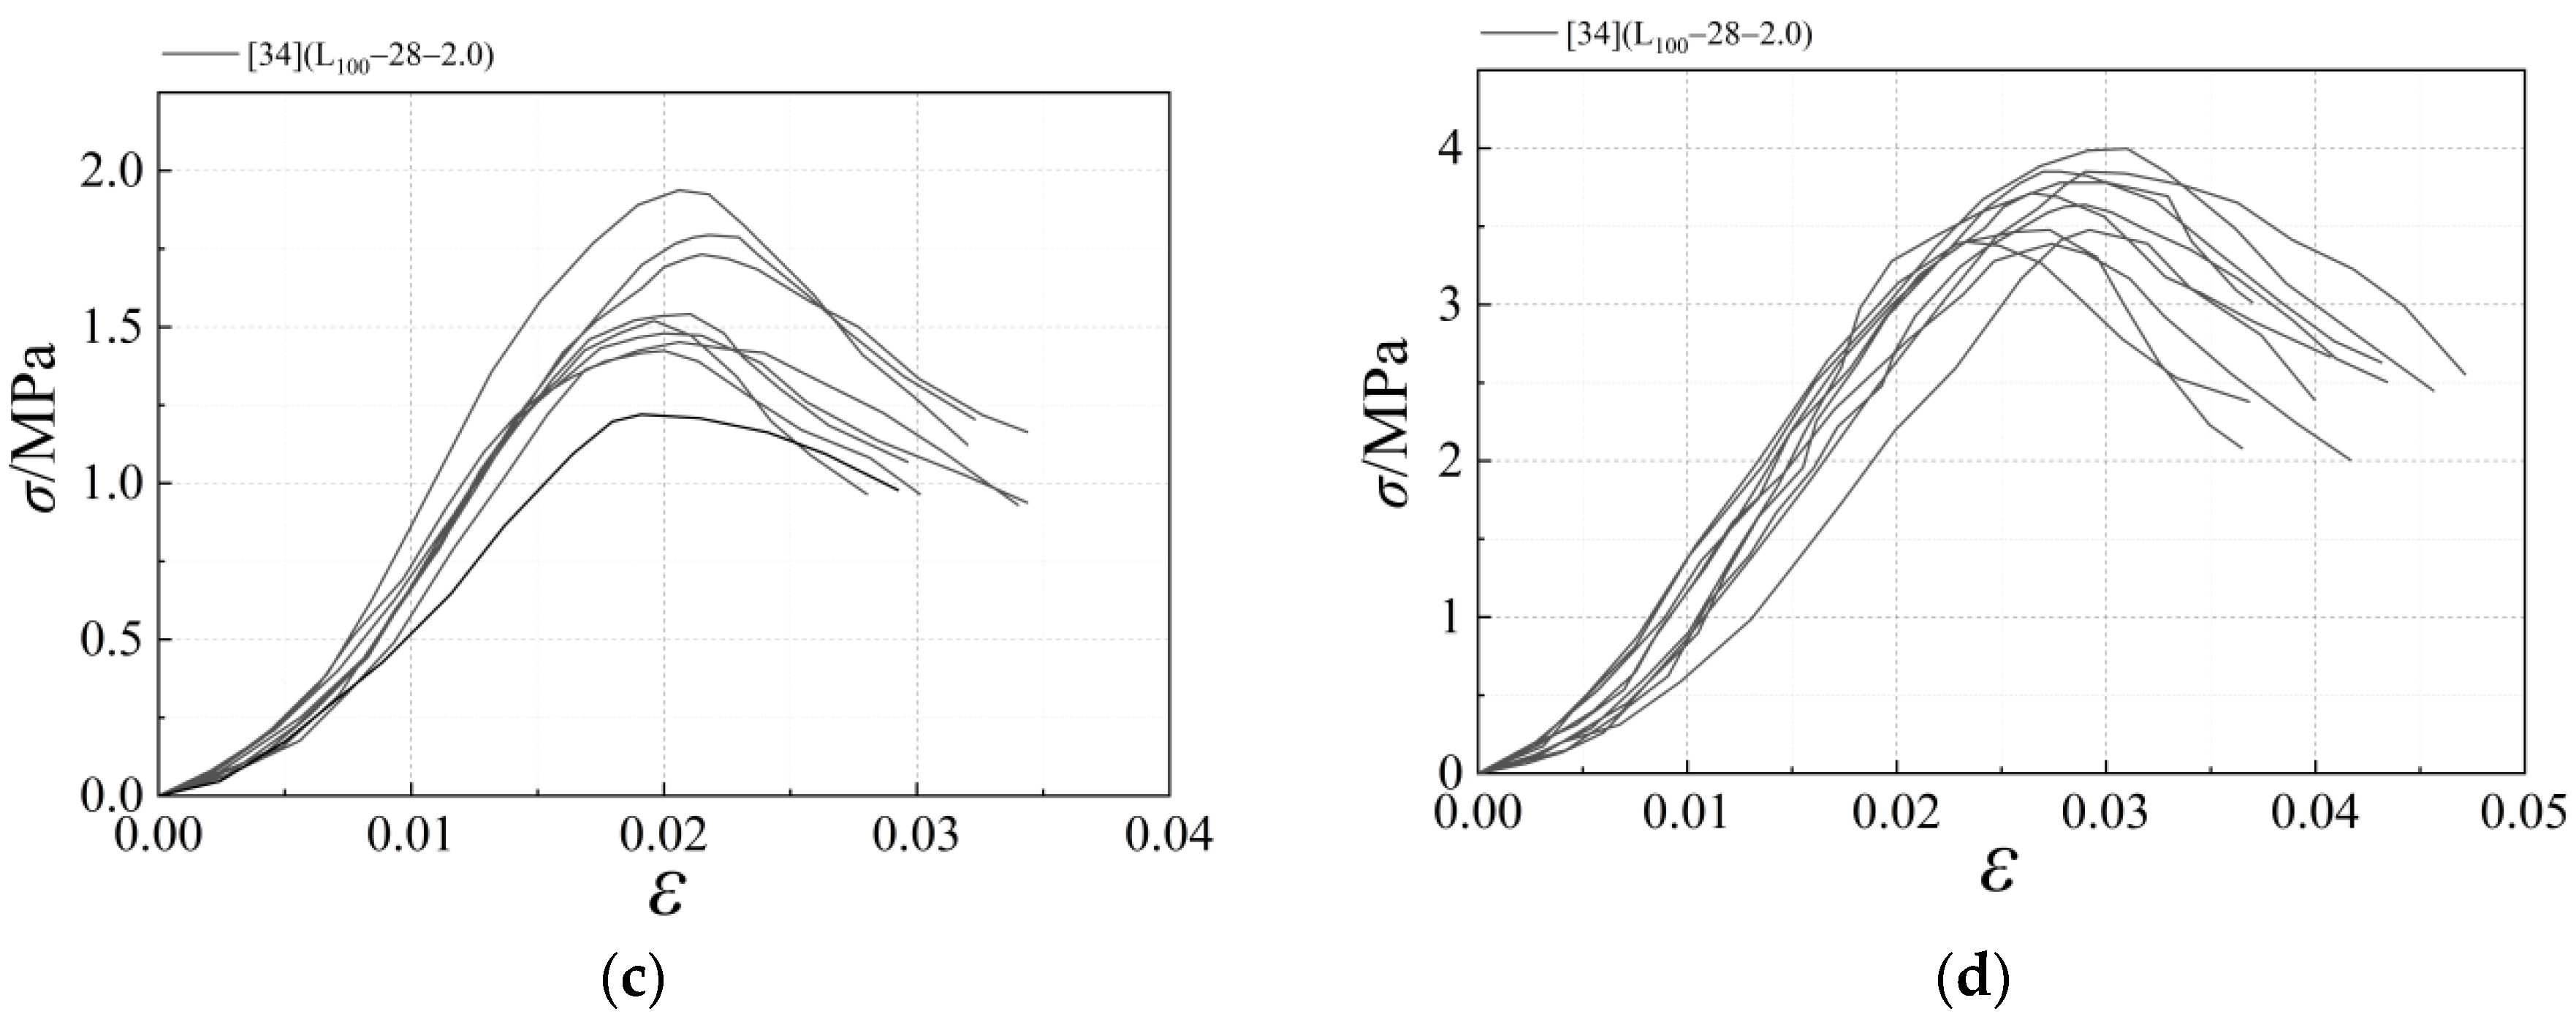
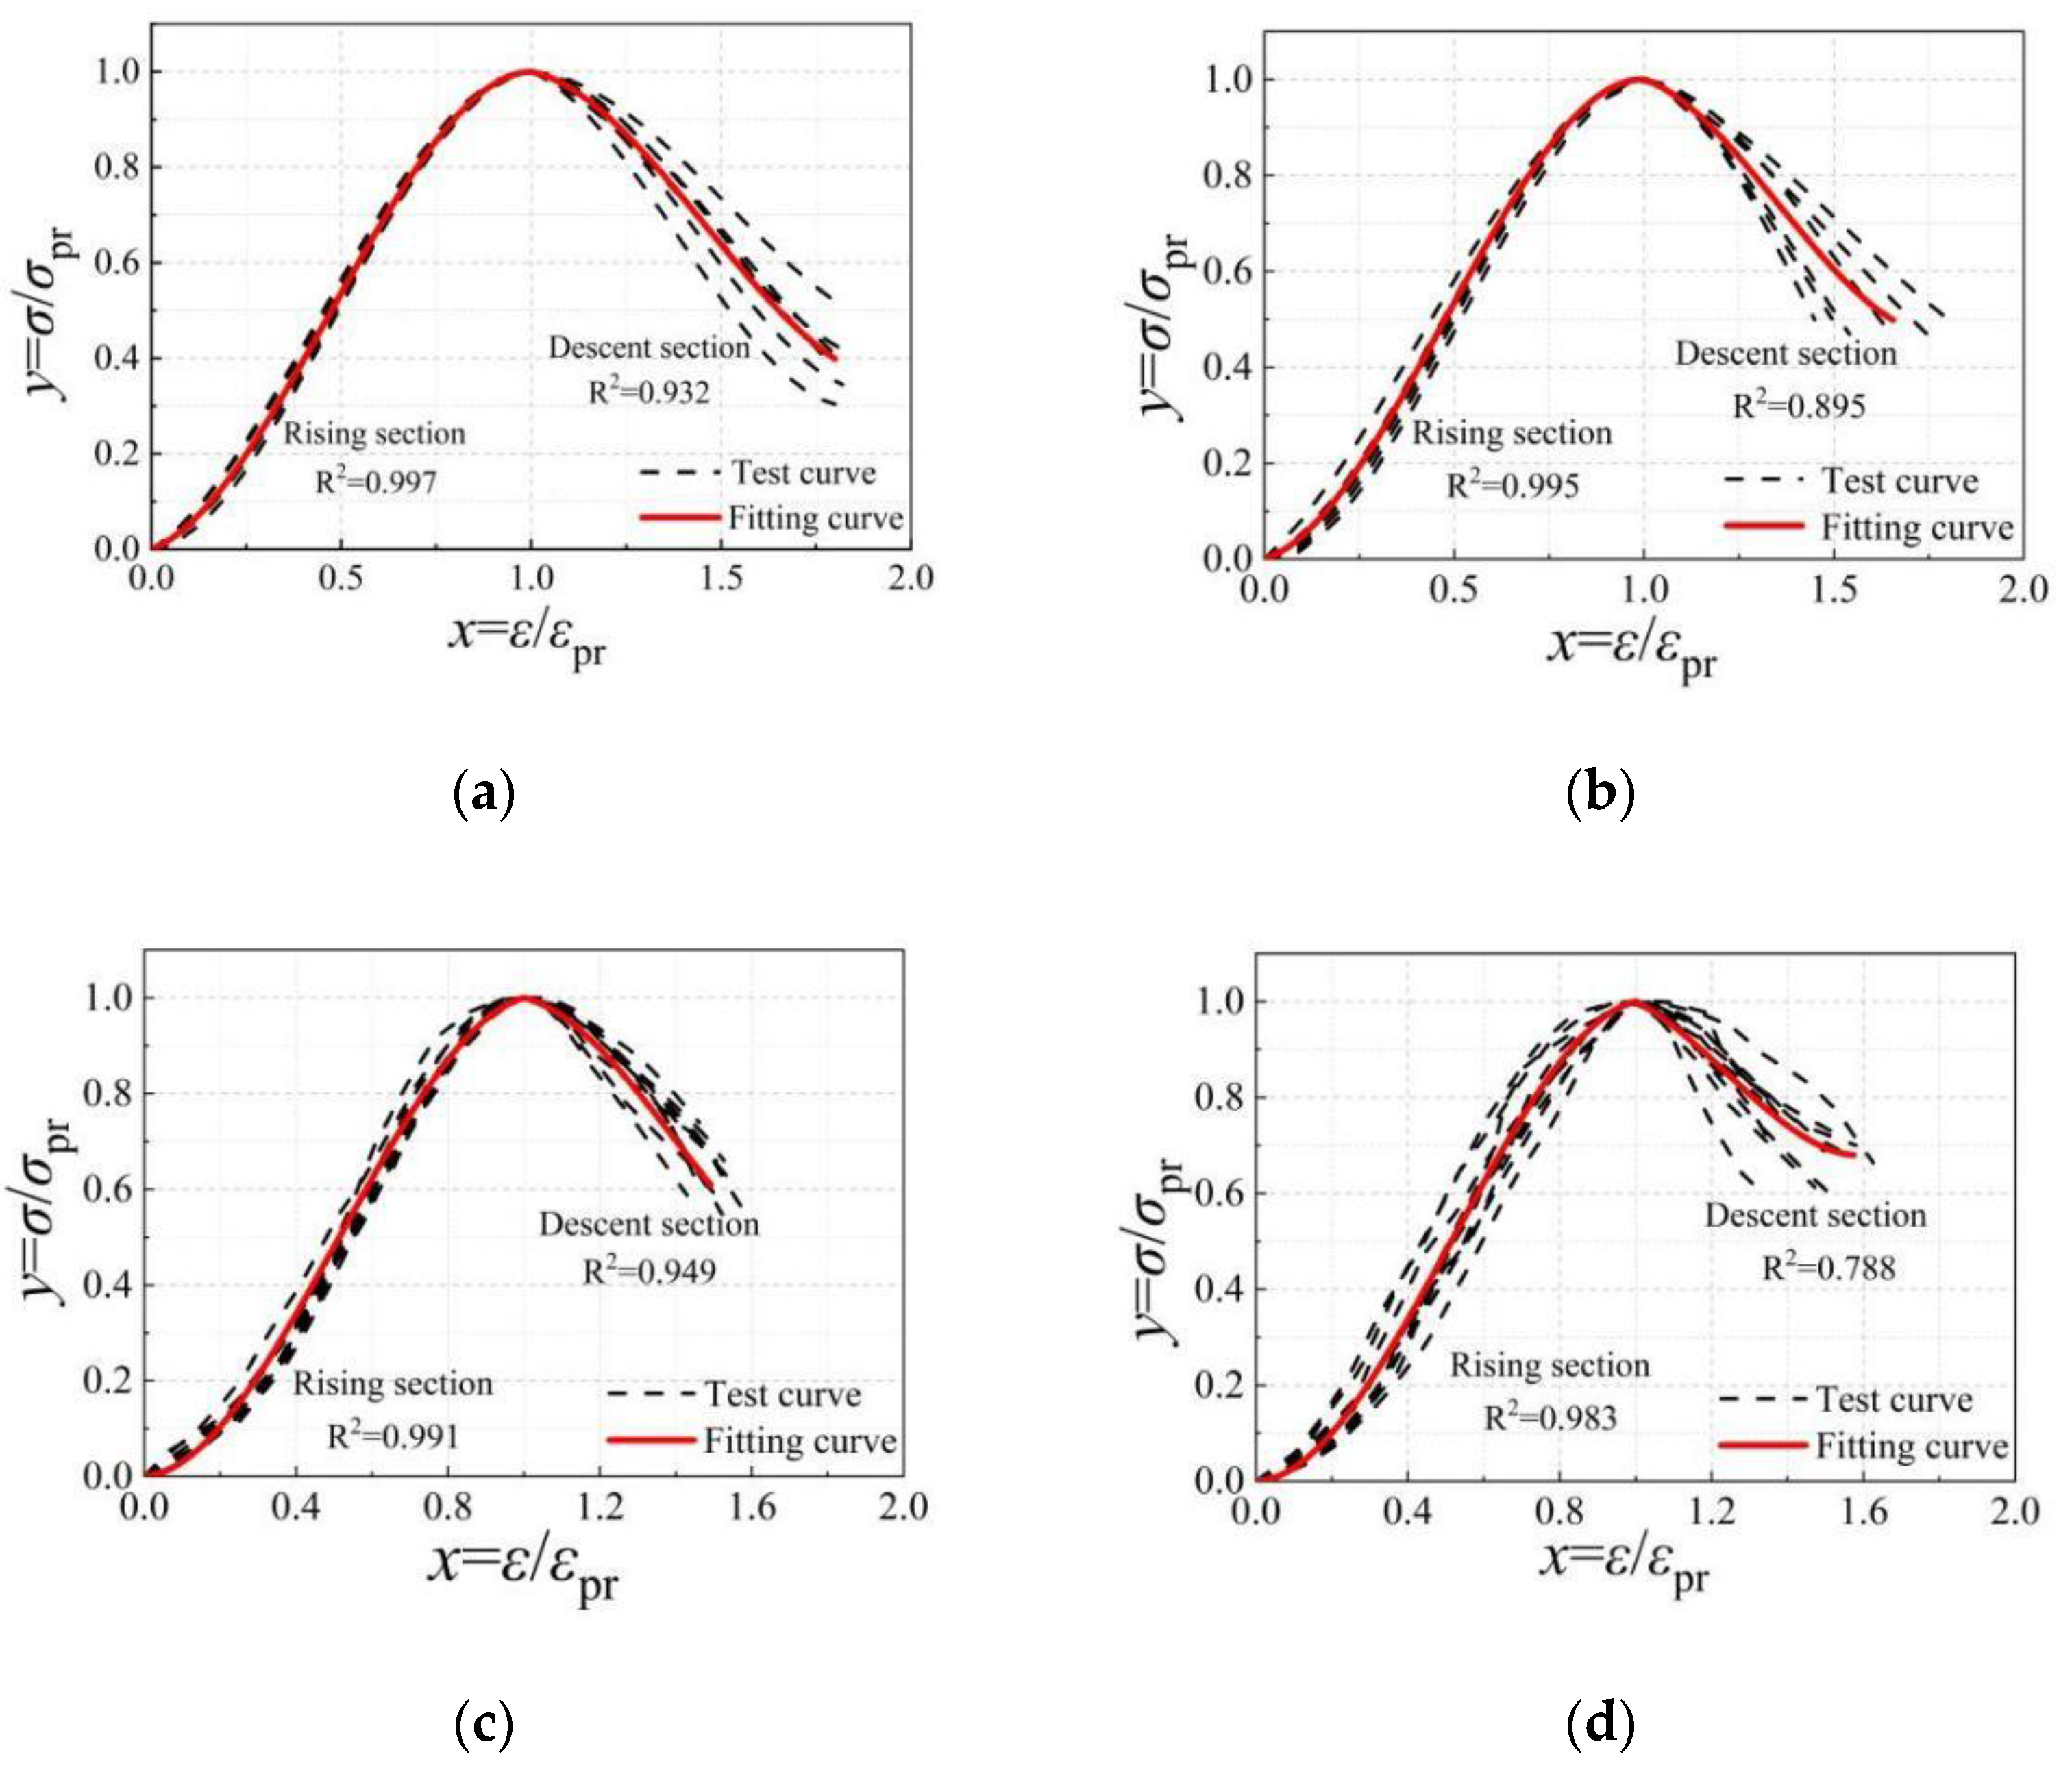
  • There are certain differences in the values of the parameters of the shape of the constitutive equation curves of the standard specimens in different regions. At the same loading rate, the best-fitting results of the constitutive equation were obtained for the soil in Xinjiang. The R2 of the ascending section is 0.991, and the R2 of the descending section is 0.949. The fitting effect of the constitutive equation for the soil in Heilongjiang is relatively lower. The reason for this is that the earth material in Heilongjiang is mainly black soil, which contains more humus [40], further aggravating the inhomogeneity of the earth material. Considering that soils containing humus are not suitable for use in building structures and that the agricultural value of black soil is greater than the value of building materials, the use of black soil as a building material is not recommended.
  • The present constitutive equation is a good fit for the rising section of the uniaxial compression test curve, and the descending section is relatively slightly lower. Take the Heilongjiang test data, where the fit is weakest, as an example. The R2 of the ascending section is 0.983, and the R2 of the descending section is 0.788. The main reason for the relatively low fit of the shape parameter of the descending section is the inhomogeneity of the composition of the earth material and the obvious brittle damage characteristics. Additionally, the damage development process is significantly affected by the manufacturing process and test method.
  • The overall fit of the modified form of the constitutive equation to the uniaxial compressive test curves of the earth material is good. The average R2 value of the ascending segment curve is 0.991, and the average R2 value of the descending segment curve is 0.886. It shows that it has good applicability to the test data under the conditions of 100-mm-cubic standard specimens with a 28-d curing age. In addition, it can be seen from Figure 13 that the fitted curve is continuous and smooth, which can better reflect the characteristics of the initial under-concave in the rising section of the curve. The basic characteristics of x = 1 and y = 1 are met at the segment point from the rising section to the descending section, and the transition is smooth. The curve of the descending section can better reflect the stress-strain trend of the material damage process.

4. The Values of the Parameters of the Constitutive Equation

4.1. Curve Shape Parameters

In the previous paper, the modified uniaxial compressive constitutive equation was fitted and analyzed using the uniaxial compressive test curves of the earth from relevant typical Chinese literature to verify its applicability. However, it can be seen from Table 7 that the shape parameters of the constitutive equation obtained by different test curves are different. To facilitate the application, further construction of the method for taking values of each parameter in the present constitutive equation is needed. It has been shown [1,36] that the trend and shape parameter values of the compressive stress-strain curve of the earth are affected to different degrees by factors, such as material composition, specimen shape, size, loading rate, and curing age. Additionally, the effects of different factors are reflected in changes in the compressive strength values of the earth materials. Therefore, based on the test sample data, a method for calculating the shape parameters of the constitutive equation curve based on compressive strength characterization is established in this study.
Firstly, the dimensionless stress-strain curves were obtained by normalizing the data of the 94 curve samples extracted in the previous paper. Then, the curve shape parameters of each sample were obtained by fitting them using the modified constitutive equation in this paper. Finally, by conducting a regression analysis between the obtained sample curve shape parameters and the compressive strength values, the expressions for calculating the curve shape parameters based on the compressive strength characterization were established. Among them, the curve obtained by fitting the compressive strength to the curve shape parameter for these 94 samples is shown in Figure 14. The equations for calculating the curve shape parameters are shown in Table 8.
As can be seen in Figure 14 and Table 8, the compressive strengths of the earth specimens are concentrated in the range of 1–4 MPa. There is a nonlinear relationship between each curve parameter and the compressive strength, which can be expressed as a quadratic polynomial function. Among them, the coefficients of determination R2 of the rising section parameters a1 and b1 are 0.834 and 0.802, respectively, and the average value is 0.818, which is a relatively good fit. The coefficients of determination R2 of the parameters a2, b2, and c2 of the descending section are 0.779, 0.777, and 0.717, respectively, with a mean value of 0.758, which is a relatively lower fit. However, it is acceptable in view of the slightly discrete earth material.

4.2. Peak Compressive Strain

The peak compressive strain is the strain value corresponding to the peak compressive strength on the uniaxial compressive stress-strain curve of the material. As seen in Equation (5), the application of the uniaxial compressive constitutive equation for earth materials should also obtain the peak compressive strain of earth. [41] shows that the peak strain of the material is related to the peak compressive strength. Therefore, the relationship equation between compressive strength and peak compressive strain can be established by fitting the peak compressive strain and compressive strength to the uniaxial compressive test curve of 94 samples. The fitted curves are shown in Figure 15, and the formula for calculating peak compressive strain based on compressive strength is shown in Equation (6).
ε pr = 0.0027 f c + 0.0167
As can be seen in Figure 15, with the growth of compressive strength fc, the law of linear growth of peak compressive strain εpr is very obvious. The coefficient of determination R2 between the modified compressive strength fc and the corresponding peak compressive strain εpr of the earth specimens is 0.666. There is a certain dispersion between the test data points and the fitted curve, and it increases with increasing strength. The main reason is that the specimens are created in different ways in the literature (geotechnical compaction method, jack compaction method, etc.). This has no significant effect on the overall trend of the compressive stress-strain curve. However, it will make the initial degree of compacting inside the specimen material different, which will have a greater influence on the length of the initial concave section of the curve and thus on the peak compressive strain. In view of the fact that there is no unified standard for the production of earth specimens, and that it is influenced by artificial factors in practical engineering. The peak compressive strain fitting formula proposed in this study still has practical value.

5. Conclusions

Based on the uniaxial compression test results of 48 earth specimens in eight groups, this study investigates the uniaxial compression test for four typical working conditions with different shapes, sizes, curing ages, and loading rates. The proposed uniaxial compression test method for earth materials is described. A modified uniaxial compressive constitutive equation for earth materials is established. Based on the verification of its applicability to soils in different regions of China, the calculation method of the relevant parameters of the constitutive equation for the earth is established. The conclusions are as follows:
  • The uniaxial compressive strength of earth specimens increases significantly with the increase in curing age and shows a trend of first increasing and then decreasing with the increase in size. It is relatively little influenced by the shape and loading rate of the specimen. The uniaxial compressive test with 100-mm-cubic specimens at 28 d of curing age and 1 mm∙min−1 loading rate can obtain stable test results with a small coefficient of variation of strength, which is recommended as the standard test method for the uniaxial compressive test of earth materials.
  • Based on Illampas’s constitutive equation, the modified constitutive equation of earth materials under uniaxial compression can better meet the compression failure mechanics and deformation characteristics of earth materials. It is a good fit for the uniaxial compressive test data of 100-mm-cubic standard specimens maintained for 28 d. It has good applicability to soils in different regions of China.
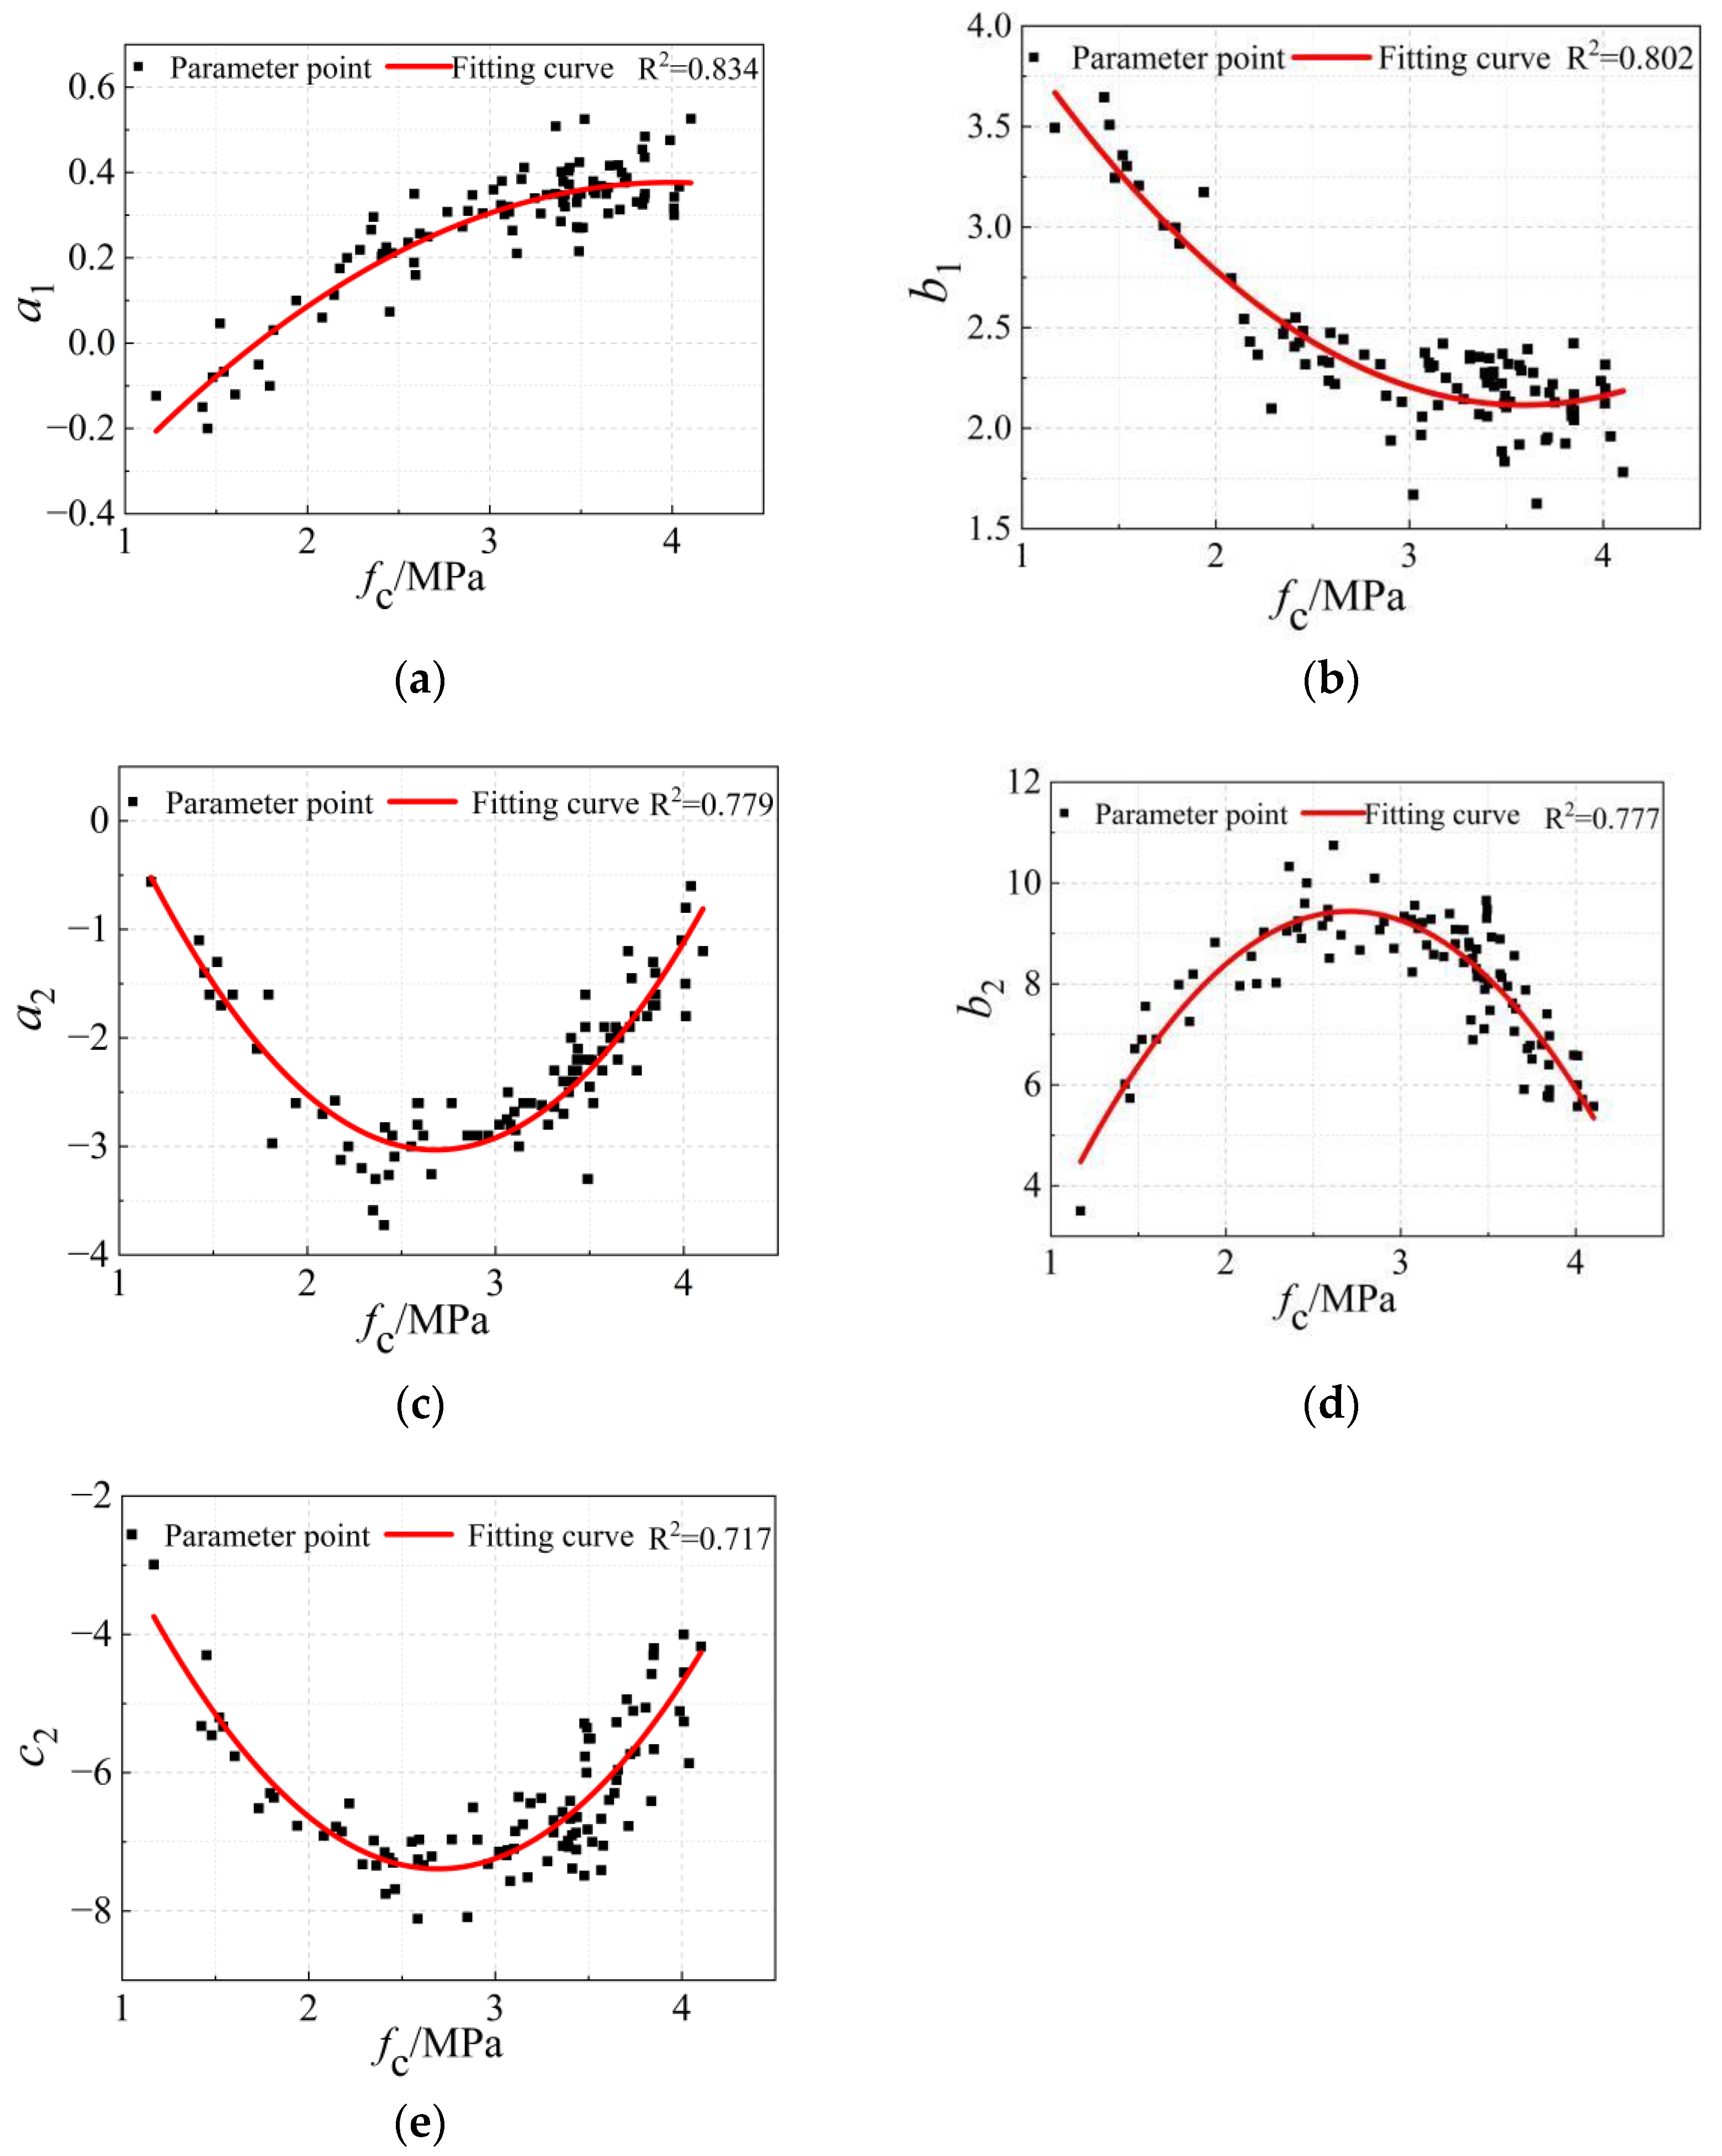
  • The calculation methods for the shape parameters of the rising and descending section curves and the peak compressive strain of the uniaxial compressive constitutive equation of the earth material under the condition of a 100-mm-cubic standard specimen at the age of 28 d of curing are established. The average values of the coefficients of determination R2 for the shape parameters of the rising and descending sections of the curve are 0.818 and 0.758, respectively, and the coefficient of determination R2 for the peak compressive strain is 0.666, which is a good overall fit.
  • The modified constitutive equation and the calculation method for curve shape parameters and peak compressive strain are put forward. In the application, only the compressive strength of 100-mm-cubic standard specimens at 28 d curing age is measured, and the specific values of the relevant parameters of the constitutive equation can be calculated and determined. This is a good reference value to promote the development of computational analysis methods for earth structures and to facilitate the engineering design applications of earth structures.

Author Contributions

Conceptualization, J.Y. and K.Y.; Data curation, F.Z.; Supervision, K.Y.; Validation, F.Z.; Visualization, L.G.; Software, L.G.; Writing—original draft, J.Y.; Writing—review and editing, K.Y.; Funding acquisition, K.Y. All authors have read and agreed to the published version of the manuscript.

Funding

This research was funded by the National Key Research and Development Program of China, grant number 2018YFD1100402-03, and the Science and Technology Leading Talent Program of Young and Middle-Aged Corps, grant number: 2020CB033.

Institutional Review Board Statement

Not applicable.

Informed Consent Statement

Not applicable.

Data Availability Statement

Not applicable.

Conflicts of Interest

The authors declare no conflict of interest.

References

  1. Lan, G.Q.; Wang, Y.H.; Chao, S.S. Influences of specimen geometry and loading rate on compressive strength of unstabilized compacted earth block. Adv. Mater. Sci. Eng. 2018, 2018, 5034256. [Google Scholar] [CrossRef] [Green Version]
  2. Dormohamadi, M.; Rahimnia, R. Combined effect of compaction and clay content on the mechanical properties of adobe brick. Case. Stud. Constr. Mat. 2020, 13, e00402. [Google Scholar] [CrossRef]
  3. Tan, J.Y.; Liang, J.H.; Wan, L.; Jiang, B. Influence of non-constant hygrothermal parameters on heat and moisture transfer in rammed earth walls. Buildings 2022, 12, 1077. [Google Scholar] [CrossRef]
  4. Van Damme, H.; Houben, H. Earth concrete. Stabilization revisited. Cement. Concrete. Res. 2018, 114, 90–102. [Google Scholar] [CrossRef]
  5. Abdulla, K.F.; Cunningham, L.S.; Gillie, M. Out-of-plane strengthening of adobe masonry using hemp fibre ropes: An experimental investigation. Eng. Struct. 2021, 245, 112931. [Google Scholar] [CrossRef]
  6. Millogo, Y.; Morel, J.C.; Aubert, J.E.; Ghavami, K. Experimental analysis of pressed adobe blocks reinforced with hibiscus cannabinus fibers. Constr. Build. Mater. 2014, 52, 71–78. [Google Scholar] [CrossRef]
  7. Mu, J.; Zhou, T.G. China Rural Housing Sample Survey Research Project Report; Ministry of Housing and Urban-Rural Development: Beijing, China, 2012. [Google Scholar]
  8. Li, Q.; Wang, W.; Wang, J.F.; Zhang, J.F.; Geng, D. Exploring the relationship between InSAR coseismic deformation and earthquake-damaged buildings. Remote. Sens. Environ. 2021, 262, 112508. [Google Scholar] [CrossRef]
  9. Gong, M.S.; Lin, S.B.; Sun, J.J.; Li, S.Y.; Dai, J.W.; Xie, L.L. Seismic intensity map and typical structural damage of 2010 Ms 7.1 Yushu earthquake in China. Nat. Hazards. 2015, 77, 847–866. [Google Scholar] [CrossRef] [Green Version]
  10. Des Roches, R.; Comerio, M.; Eberhard, M.; Mooney, W.; Rix, G.J. Overview of the 2010 Haiti Earthquake. Earthq. Spectra. 2011, 27, 1–21. [Google Scholar] [CrossRef] [Green Version]
  11. Dominguez-Santos, D.; Bravo, J.A.M. Structural and mechanical performance of adobe with the addition of high-density polyethylene fibres for the construction of low-rise buildings. Eng. Fail. Anal. 2022, 139, 106461. [Google Scholar] [CrossRef]
  12. Momin, S.; Lovon, H.; Silva, V.; Ferreira, T.M.; Vicente, R. Seismic vulnerability assessment of portuguese adobe buildings. Buildings 2021, 11, 200. [Google Scholar] [CrossRef]
  13. Kumar, N.; Barbato, M. Effects of sugarcane bagasse fibers on the properties of compressed and stabilized earth blocks. Constr. Build. Mater. 2022, 315, 125552. [Google Scholar] [CrossRef]
  14. Eko, R.M.; Offa, E.D.; Ngatcha, T.Y.; Minsilib, L.S. Potential of salvaged steel fibers for reinforcement of unfired earth blocks. Constr. Build. Mater. 2012, 35, 340–346. [Google Scholar]
  15. Landrou, G.; Brumaud, C.; Habert, G. Development of a self-compacted clay based concrete-rheological, mechanical and environmental investigations. Acad. J. Civ. Eng. 2015, 33, 80–84. [Google Scholar]
  16. Heathcote, K.A. Durability of earthwall buildings. Constr. Build. Mater. 1995, 9, 185–189. [Google Scholar] [CrossRef]
  17. Fiore, A.; Marano, G.C.; Marti, C.; Molfetta, M. On the fresh/hardened properties of cement composites incorporating rubber particles from recycled tires. Adv. Civ. Eng. 2014, 2014, 876158. [Google Scholar] [CrossRef]
  18. Adorni, E.; Coiesson, E.; Ferretti, D. In Situ characterization of archaeological adobe bricks. Constr. Build. Mater. 2013, 40, 1–9. [Google Scholar] [CrossRef]
  19. Aguilar, R.; Montesinos, M.; Uceda, S. Mechanical characterization of the structural components of Pre-Columbian earthen monuments: Analysis of bricks and mortar from Huaca de la Luna in Perú. Case. Stud. Constr. Mat. 2017, 6, 16–28. [Google Scholar] [CrossRef] [Green Version]
  20. Illampas, R.; Ioannou, I.; Charmpis, D.C. Adobe bricks under compression: Experimental investigation and derivation of stress-strain equation. Constr. Build. Mater. 2014, 53, 83–90. [Google Scholar] [CrossRef]
  21. Rodríguez-Mariscal, J.D.; Solís, M.; Cifuentes, H. Methodological issues for the mechanical characterization of unfired earth bricks. Constr. Build. Mater. 2018, 175, 804–814. [Google Scholar] [CrossRef]
  22. GB/T 50123-2019; Standard for Geotechnical Testing Method. China Planning Press: Beijing, China, 2019.
  23. Danso, H.; Martinson, D.B.; Ali, M.; Williams, J. Effect of fibre aspect ratio on mechanical properties of soil building blocks. Constr. Build. Mater. 2015, 83, 314–319. [Google Scholar] [CrossRef] [Green Version]
  24. Salih, M.M.; Osofero, A.I.; Imbabi, M.S. Constitutive models for fibre reinforced soil bricks. Constr. Build. Mater. 2020, 240, 1–21. [Google Scholar] [CrossRef]
  25. Piani, T.L.; Weerheijm, J.; Peroni, M.; Koene, L.; Krabbenborg, D.; Solomos, G.; Sluys, L.J. Dynamic behaviour of adobe bricks in compression: The role of fibres and water content at various loading rates. Constr. Build. Mater. 2020, 230, 117038. [Google Scholar] [CrossRef]
  26. Bahar, R.; Benazzoug, M.; Kenai, S. Performance of compacted cement-stabilised soil. Cement. Concrete. Comp. 2004, 26, 811–820. [Google Scholar] [CrossRef]
  27. Mansour, M.B.; Jelidi, A.; Cherif, A.S.; Jabrallah, S.B. Optimizing thermal and mechanical performance of compressed earth blocks (CEB). Constr. Build. Mater. 2016, 104, 44–51. [Google Scholar] [CrossRef]
  28. Aymerich, F.; Fenu, L.; Meloni, P. Effect of reinforcing wool fibres on fracture and energy absorption properties of an earthen material. Constr. Build. Mater. 2012, 27, 66–72. [Google Scholar] [CrossRef]
  29. Houben, H.; Guillaud, H. Traité de Construction en Terre; CRATerre: Villefontaine, France; Editions Parenthèses: Marseille, France, 1989. [Google Scholar]
  30. ASTM D2487; Standard Practice for Classification of Soils for Engineering Purposes (Unified Soil Classification System). de ASTM International: West Conshohocken, PA, USA, 2011.
  31. EN1992-1-1; Eurocode2: Design of Concrete Structures-Part 1-1: Gerneral Rules and Rules for Buildings. British Standards Institution: London, UK, 2004.
  32. JGJ/T 70-2009; Standard for Test Method of Performance on Building Mortar. China Architecture and Building Press: Beijing, China, 2009.
  33. NZS4297: 2020; Engineering Design of Earth Buildings. Building Industry Authority of New Zealand: Wellington, New Zealand, 2020.
  34. Zhang, K. Study on the Standard test Method of Material Strength on Raw-Soil. Ph.D. Thesis, Chang’an University, Xi’an, China, 2017. [Google Scholar]
  35. Zhang, Y.C.; Wang, Y.H.; Zhao, N.N.; Wang, T.Y. Experimental and stress-strain equation investigation on compressive strength of raw and modified soil in Loess Plateau. Adv. Mater. Sci. Eng. 2016, 2016, 2681038. [Google Scholar] [CrossRef] [Green Version]
  36. Zhong, J.Q. Study and Application on Constitutive Relationship for Earth Material and Mechanical Compressed Earth Brick Masonry. Ph.D. Thesis, Chang’an University, Xi’an, China, 2018. [Google Scholar]
  37. Wang, S.N.; Chen, F.Y.; Xue, Q.P.; Zhang, P. Splitting tensile strength of cement soil reinforced with basalt fibers. Materials. 2020, 13, 3110. [Google Scholar] [CrossRef]
  38. Liu, F. Experimental Study on Compressive Strength of Raw Soil Material Modified by Stones, Sand and Cement. Master’s Thesis, Chang’an University, Xi’an, China, 2017. [Google Scholar]
  39. Ding, S.Y. Experimental researches on size effect of raw-soil based materials compressive strength. Master’s Thesis, Chang’an University, Xi’an, China, 2017. [Google Scholar]
  40. Zhong, X.L.; Gan, Y.Q.; Deng, Y.M. Distribution, origin and speciation of soil selenium in the black soil region of Northeast China. Environ. Geochem. Hlth. 2021, 43, 1257–1271. [Google Scholar] [CrossRef]
  41. Gong, X.; Yu, H.F.; Wu, C.Y. Research on the constitutive relationship of concrete under uniaxial compression in freeze-thaw environment. Constr. Build. Mater. 2022, 336, 127543. [Google Scholar] [CrossRef]
Figure 1. Testing instruments: (a) X-ray fluorescence analyzer; (b) X-ray diffractometer.
Applsci 13 00019 g001
Figure 2. X-ray diffraction pattern of the earth materials.
Applsci 13 00019 g002
Figure 3. Grain size distribution curve of soil [1,14,19,23,24,25,26,27,28,29].
Applsci 13 00019 g003
Figure 4. Soil plasticity diagram. (CL = low liquid limit clay; CH = high liquid limit clay; ML = low liquid limit powder soil; and MH = high liquid limit powder soil.) [1,14,19,23,26,27,28].
Applsci 13 00019 g004
Figure 5. Specimen loading diagram: (a) loading instrument; (b) cube specimen; and (c) cylindrical specimen.
Applsci 13 00019 g005
Figure 6. Test typical mode of failure in uniaxial compression for a cubic specimen: (a) middle stage of loading; (b) load to peak load; and (c) failure stage.
Applsci 13 00019 g006
Figure 7. Test typical mode of failure in an uniaxial compression for cylindrical specimen: (a) middle stage of loading; (b) load to peak load; and (c) failure stage.
Applsci 13 00019 g007
Figure 8. Comparative diagram of compressive strength of specimens under different working conditions.
Applsci 13 00019 g008
Figure 9. Coefficient of variation of compressive strength of specimens under different working conditions.
Applsci 13 00019 g009
Figure 10. Average stress-strain curves of eight groups of specimens.
Applsci 13 00019 g010
Figure 11. Typical curve of dimensionless stress-strain of earth materials under uniaxial compression.
Applsci 13 00019 g011
Figure 12. Summary of the original uniaxial compressive stress-strain curves in the related literature: (a) Earth from Xinjiang; (b) Earth from Shanxi; (c) Earth from Fujian; and (d) Earth from Heilongjiang.
Applsci 13 00019 g012aApplsci 13 00019 g012b
Figure 13. Fitting of the constitutive equation to the literature test curve: (a) This test L100-28-1.0 (Xinjiang); (b) This test L100-28-0.2 (Xinjiang); (c) [34] L100-28-2.0 (Xinjiang); and (d) [34] L100-28-2.0 (Heilongjiang).
Applsci 13 00019 g013
Figure 14. Compressive strength and curve shape parameter fitting curves: (a) a1; (b) b1; (c) a2; (d) b2; and (e) c2.
Applsci 13 00019 g014
Figure 15. Fitting curve of compressive strength and peak compressive strain.
Applsci 13 00019 g015
Table 1. Main components of soil.
Chemical CompositionsSiO2Al2O3CaOFe2O3MgOK2ONa2OTiO2P2O5SO3
Content (%)59.4917.47.585.3933.92.891.790.6780.3460.191
Table 2. Basic physical properties of earth materials.
Granulometry Atterberg LimitsMaximum Dry Density (g·cm−3)Dry Density (g·cm−3)Optimal Water Content (%)
Clay (%)
d < 5 μm
Silt (%)
5 μm ≤ d ≤ 75 μm
Sand (%)
75 μm ≤ d ≤ 4500 μm
LL (%)PL (%)PI (%)
19394236.323.512.82.041.6623
LL = liquid limit; PL = plastic limit; PI = plasticity index; dry density: the density measured when the formed maximum dry density specimen is placed in the oven at a temperature of 65–70 °C and baked to a constant weight.
Table 3. Uniaxial compression test under different working conditions.
Specimen labelSpecimen Type
(mm)
Loading Rate
(mm·min−1)
Curing Age
(d)
Quantity
Y102-14-0.2Φ102 × 1160.2146
Y102-21-0.2Φ102 × 1160.2216
Y102-28-0.2Φ102 × 1160.2286
L100-28-0.2100 × 100 × 1000.2286
L100-28-1.0100 × 100 × 1001.0286
L100-28-3.0100 × 100 × 1003.0286
L70.7-28-0.270.7 × 70.7 × 70.70.2286
L150-28-0.2150 × 150 × 1500.2286
Y102-14(21 and 28)-0.2 represents the cylindrical specimens with a diameter of 102 mm and a height of 116 mm, the curing age is 14(21 and 28) d and the loading rate is 0.2 mm·min−1; L100-28-0.2(1.0) represents the cube specimens with side lengths of 100 mm. The curing age is 28 days, and the loading rate is 0.2(1.0, 3.0) mm·min−1; L70.7-28-0.2 represents the cube specimens with side lengths of 70.7 mm. The curing age is 28 days, and the loading rate is 0.2 mm·min−1; L150-28-0.2 represents the cube specimens with side lengths of 150 mm. The curing age is 28 days, and the loading rate is 0.2 mm·min−1; Φ: the diameter of a circle.
Table 4. Light compaction method operating parameters.
Specimen Type (mm)V (cm3)ns
Φ102 × 116947.4325
100 × 100 × 1001000326
70.7 × 70.7 × 70.7353.4214
150 × 150 × 1503375.0467
Table 5. Average compressive strength and peak compressive strain of earth specimen.
Specimen Labelfcm (MPa)σfCVεpr
Y102-14-0.21.830.2060.1130.0199
Y102-21-0.22.330.2700.1160.0205
Y102-28-0.23.050.3140.1030.0248
L100-28-0.23.260.2800.0860.0232
L100-28-1.03.420.2560.0750.0251
L100-28-3.03.510.3190.0910.0225
L70.7-28-0.23.110.2860.0920.0208
L150-28-0.22.680.3610.1350.0275
fcm is the average compressive strength; σf is the standard deviation of strength; CV is the coefficient of intensity variation; and εpr is the peak compressive strain.
Table 6. Related literature and basic physical properties of earth materials.
SourceRegionAtterberg LimitsType of SoilForming MethodMaximum Dry Density (g·cm−3)Optimal Moisture Content (%)
LL (%)PL (%)PI (%)
This testXinjiang36.323.512.8Low liquid limit clayLight compaction method2.0423.0
[38]Shanxi33.617.216.4Jack compaction1.9018.2
[34]Shanxi26.015.011.0Jack compaction2.0418.2
[34]Xinjiang25.513.611.9Jack compaction2.1414.5
[34]Fujian45.026.019.0Jack compaction1.7429.0
[34]Heilongjiang28.514.014.5Jack compaction2.0016.3
[36]Shanxi26.015.011.0Jack compaction2.0418.2
[39]Shanxi26.015.011.0Jack compaction2.0418.2
Table 7. Fitting parameters of constitutive equation of different earth specimens.
Specimen SourceRegionSpecimen Working ConditionRising SectionDescending Section
a1b1R2a2b2c2R2
This testXinjiangL100-28-0.20.2742.3630.995−2.5058.808−7.0130.895
This testXinjiangL100-28-1.00.2192.3320.997−2.0107.056−5.1900.927
This testXinjiangL100-28-3.00.2712.3190.983−2.2047.476−5.0560.911
[38]ShanxiL100-28-3.00.3082.3020.998−2.8509.199−6.8450.919
[34]ShanxiL100-28-2.00.3742.2080.993−2.80110.463−9.1250.863
[34]XinjiangL100-28-2.00.3022.1810.991−2.7019.341−7.4030.949
[34]FujianL100-28-2.0−0.1103.1930.995−1.720−7.506−6.4950.902
[34]HeilongjiangL100-28-2.00.2502.6600.984−2.0108.402−7.3780.788
[36]ShanxiL100-28-3.00.4022.0210.994−2.3038.768−7.4060.873
[36]ShanxiL100-28-1.00.2012.2710.986−2.34010.493−10.2280.841
[39]ShanxiL100-28-0.50.3302.0360.987−2.5209.436−7.6930.834
[39]ShanxiL100-28-1.00.4201.6910.983−2.9019.938−7.6930.929
[39]ShanxiL100-28-5.00.3022.2780.993−2.7469.523−7.8110.925
[39]ShanxiL100-28-7.00.3462.1500.996−2.78410.096−8.5490.846
Note: L100-28-0.2 (0.5, 1.0, 2.0, 3.0, 5.0, 7.0) represents the cube specimens with side length of 100 mm. The curing age is 28 days, and the loading rate is 0.2 (0.5, 1.0, 2.0, 3.0, 5.0, 7.0) mm·min−1.
Table 8. Calculation formula for the shape parameters of the constitutive equation curve.
Shape ParameterFitting Equation
a1 a 1 = 0.0768 f c 2 + 0.6076 f c 0.8198
b1 b 1 = 0.2729 f c 2 1.9406 f c + 5.572
a2 a 2 = 1.0544 f c 2 5.6251 f c + 4.4891
b2 b 2 = 2.1019 f c 2 + 11.376 f c 5.9548
c2 c 2 = 1.615 f c 2 8.7239 f c + 4.3801
Disclaimer/Publisher’s Note: The statements, opinions and data contained in all publications are solely those of the individual author(s) and contributor(s) and not of MDPI and/or the editor(s). MDPI and/or the editor(s) disclaim responsibility for any injury to people or property resulting from any ideas, methods, instructions or products referred to in the content.

