Article

Industrial Performance Measurement Systems Coherence: A Comparative Analysis of Current Methodologies, Validation and Introduction to Key Activity Indicators

by
Italo Cesidio Fantozzi
*,
Sebastiano Di Luozzo
and
Massimiliano Maria Schiraldi
Department of Enterprise Engineering, University of Rome “Tor Vergata”, Via del Politecnico 1, 00133 Rome, Italy
*
Author to whom correspondence should be addressed.
Appl. Sci. 2023, 13(1), 235; https://doi.org/10.3390/app13010235
Submission received: 18 November 2022 / Revised: 10 December 2022 / Accepted: 20 December 2022 / Published: 24 December 2022
(This article belongs to the Special Issue Advances in Smart Production & Logistics)

Abstract

:
This paper discusses and integrates the concept of complexity in the industrial performance measurement and management systems (PMM) theory, providing a comprehensive overview of the different methodologies used within the decision systems research area. It also discusses the importance of introducing Key Activity Indicators (KAI) within PMM, specifically related to the Operations and Supply Chain management research and industrial areas. Moreover, it provides validation of the methodology through a case study concerning the production environment of a multinational pharmaceutical company. The main research objective is to design appropriate industrial PMM systems with the aim of increasing the industrial efficiency and effectiveness of manufacturing and service organizations. An analysis of the central industrial performance measurement systems design methods is conducted, classifying them into macro-categories and conducting a comparative study. Based on the analysis of the different proposed methods, organisations will be able to choose the best one based on their needs to design effective decision systems. The research work allows organisations to evaluate, assess, and design effective industrial performance measurement systems. Moreover, the proposed methodology can be easily integrated within an Industry 4.0 context, and benefit from the digitalization environment to obtain continuous feedback on the effectiveness of the industrial PMM.

1. Introduction

Since the rise of modern corporations, industrial performance measurement and management systems (PMM) have been used to help organizations achieve their goals and deliver their mission [1] Indeed, industrial PMMs are essential because they represent the core system responsible for motivating behaviour consistent with and supportive of corporate objectives [2] Moreover, according to various authors, the main functions of a performance measurement system (PMM) are to create organizational alignment and to translate strategy into action [3]. Several contributors have emphasized the importance of these systems. The work of Rodrìguez-Rodrìguez et al. [4] defines the PMM as that which defines strategic objectives, associated production plans, and key performance indicators (KPIs), emphasizing that this structure is straightforward and traceable. A traditional industrial PMM’s objectives are to create a consistent approach to extracting, analyzing, and reporting information on the company’s performance; they are used to determine whether systems are functioning as expected by comparing the predicted model with the observed data. Pérez-Álvarez et al. [5] report that: “The relation between the operations and how they can affect the measures and indicators is not always clear, since it depends on the background of the particular decision-maker and the complexity of the relations”. It means that the relationship between operations and how they may affect measures and indicators is not always clear, as these depend on the context of the particular decision-maker and the complexity of the relationships.
Several methods and tools have been introduced in order to effectively apply strategies within operational metrics and objectives. It is also clear that all PMM systems must be customized and implemented according to the values and strategic decisions of each company [6,7]. These considerations are even more relevant in the modern context of fierce competitive dynamics, managing and measuring business performance becomes highly complex. The industrial PMMs must grasp the measured context’s variability and give rapid feedback on the chosen changes. To be effective, performance measures must therefore reflect changes in competitiveness. However, traditional performance measurement systems that rely mainly on financial performance and reports are criticized for being outdated, irrelevant to managerial decision-making and strategic objectives, too late, too aggregated, and detrimental to organizational improvements [8].
Within this context and the growing interest in this area of research, this paper aims to evaluate and extend the approaches currently available to address the complexity of business contexts, helping organizations continuously define, implement and align operational performance and strategic vision. The main objective is therefore to identify the most efficient tool, among the various ones in the literature, to optimise the performance of organisations in order to keep them in line with the increasing competitiveness of the market. Indeed, the definition of an adequate industrial performance measurement and management system requires adopting a specific design method, which should be tailored to the particular organizational context. For this reason, this work aims at providing a deep analysis of the current design methodologies for industrial PMM and to identify and validate the most relevant framework with an organizational case study. Moreover, it is proposed to expand the methodology by considering the integration of Key Activity Indicators. Furthermore, to validate the defined choice, it is proposed to validate it through an application in the company and evaluate the results.

2. Theoretical Background

Due to the strategic role industrial PMMs play in achieving goals within companies, they have been widely discussed in the literature, and various methodologies have been proposed in this regard [6,7,9,10]. In this section, we will analyze the two main strands, i.e., qualitative and quantitative methods, and provide a brief outline.

2.1. Qualitative Methods

In the analysis of different qualitative methods, several contributions are considered.
Melnyk et al. [11] present a framework in which a Delphi panel was conducted to assess the future environment and business trends with consequences for industrial PMM. The Delphi panel helps build a framework to understand the implications of how industrial PMM systems are designed and used. Firstly, it is necessary to understand better the strategy design and implementation process, particularly the link with PMM and how they should be combined to best suit such environments. The process is structured as follows: a questionnaire is submitted to the Delphi panel; the answers are sorted into a table where the number of solutions for each questionnaire item is listed; then, aware of the step mentioned above, a framework is developed that must explain the relationships between the strategy and the industrial PMM system (e.g., by implementing the so-called ‘Performance Alignment Matrix’ that reflects the complexity encountered by organizations). This paper points out that a qualitative methodology can, at the same time, be easy to apply, inclusive of internal and external perspectives, and ultimately successful in assessing the consistency of a tree of indicators. Unfortunately, it suffers from the fact that it has a static recalculation frequency and lacks an accurate comparison of the company’s KPIs.
In the contribution by Kaganski et al. [12], an algorithm for analyzing questionnaire responses, the so-called Enterprise Analysis Model (EAM), is proposed. It is a tool that makes it possible to perform the analysis of the enterprise within a reasonable timeframe. The model helps to identify business weaknesses and provides information on the data that should be collected to change the situation shortly [13]. The model was used to gather company information by applying mapping and questionnaires, which can be merged into a single survey. Expert decision-making and outlier methods can reduce the number of KPIs to several meaningful metrics. Subsequently, data analysis is performed based on the response analysis algorithm. This methodology, therefore, considers parameters such as dynamicity in recalculation frequency, evaluation of KPIs, comparison of performance indicators, and inclusion of internal/external perspectives. However, this approach consists of an algorithm whose complexity must be considered when implementing it.
In the contribution proposed by Alexander et al. [14], a performance alignment matrix and the Cynefin framework is proposed. The research approach adopted here was to consider theory alongside empirical data collection; this research uses theoretical sampling rather than statistical or random sampling. For the method implementation, interviews are conducted on how performance is measured in the company and what decisions are based on. Since Cynefin is a framework that tries to make sense of what it analyzes, it addresses both predictable and unpredictable external contexts characterized by complexity and volatility and also offers insights into the complexity of an industrial PMM. The acquisition of performance data is intended to enable managers to make decisions. The qualitative method provided by Alexander et al. [14] provides a very dynamic structure based on considerations made between experts in a Cynefin session, which makes the approach emotional and well inclined to look at the external perspectives of companies. However, it should be noted that although it is a method of low application complexity, it consists of an empirical study, which may lead to distortions as it is not practical and only theorized.
Ittner et al. [15] evaluated the effects of the performance measurement system using two sets of variables:
  • Managers’ responses regarding their satisfaction with the industrial PMM;
  • Publicly available information on company accounting and stock market performance.
The proposed model is based on questionnaires submitted to managers. The main components of the analysis are innovation, flexibility, maintenance of current relationships, and product offering. Performance measurement alignment techniques is assessed using three questions implementing the balanced scorecard (BSC). The method aims to assess the extent to which the various performance categories are crucial factors for the long-term success of companies. A six-point scale is used to measure the implementation of the Balanced Scorecard or measures of economic value.
The approach, similar to some of its predecessors, lacks indicator comparison and frequency of review of adherence to critical success factors (CSF); there is also a non-negligible implementation complexity. Nevertheless, the method considers internal and external perspectives and features an indicator tree evaluation system.
Wibisono [8] proposes a framework for analyzing, evaluating and implementing industrial PMM within a company. The authors point out that performance measurement without any follow-up action or improvement is not beneficial in increasing production competitiveness. Therefore, reports are provided for any performance lagging behind standards. The reporting is based on the company’s expert input and experience in managing its production. The industrial PMM is dynamic, and the authors in their work consider the regular revisiting of it based on the latest information and any environmental changes. It is emphasized that evaluations at the shop floor level could be more frequent than at the strategic level so that the company’s response is timely.
This study presents a special consideration regarding the recalculation frequency of the proposed method, which is presented as a dynamic frequency (i.e., one that allows revisiting as soon as the environment changes). However, the approach is not easy to implement, given its structure, and needs to go into detail to analyze the relationships between the indicators themselves.
In the study proposed by Villalba-Diez [16], an inter-process communication system is presented that can drive continuous improvement by communicating process performance to those involved. An interpretation of the PDCA cycle is proposed as a direct communication standard between processes and process owners that enables integrated process-oriented communication. The steps of this communication standard are:
  • Check or Commitment—In this phase, it is decided how the success of the value stream is measured. It consists of three sub-phases:
    • Examine the process at the Gemba (the place where the value is created);
    • Point out a direction for improvement. Continuous improvement is a common need. This is carried out by establishing process KPIs in the Hoshin Kanri process;
    • The current status of this KPI is measured.
  • Plan or process priority analysis—This step consists of three sub-steps:
    • Understand the current state of the process using a process mapping tool;
    • Analyzing the cost of the root cause source of variability;
    • Ask why.
  • Do or Act—One works with the process. The PO authorizes an action with the receiver to reduce internal process variability;
  • Repeat numbers 1 and 3 n times;
  • Act or standardize—This stage is where the anchoring and transformation from active teaching to organizational teaching takes place. After reaching a tree of indicators, the experience developed in the management process becomes a standard. At this stage, one aims to describe the value stream so that replicability can be enabled.
Thanks to this system, one can arrive at a very special industrial PMM, namely the Hoshin Kanri Tree (HKT), which consists of a tree of indicators implemented through a series of steps starting with the mapping of the value stream and ending with the actual KPI model, passing through intermediate paths such as the KPI Heatmap and the creation of a non-hierarchical network. Subsequently, these indicators will be evaluated using red or green colored magnets to assess their status. The presented method can immediately be seen as easy to implement and, above all, dynamic. These characteristics are taken from the Lean philosophy in business management; however, it is a qualitative approach. This approach remains a valid methodology that considers the continuous comparison and evaluation of indicators leading to the subsequent analysis of industrial PMM consistency. However, it needs a fundamental peculiarity, i.e., the inclusion of the enterprise perspective is not described by the author.
Cherni et al. [17] introduced a Business Process Management (BPM) system. The authors define a BPM as a system adapting to the complex modern competitive environment. However, they specify how these tend to be of complex implementability. A process improvement approach, known as KPI4BPI, is therefore proposed. It uses the BPM cycle, adding for each phase the activities and techniques used to improve business processes based on the target values of KPIs and redesign models. It adopts the BPM life cycle as the basis for proposing activities to be performed at each stage to achieve a process improvement target. This implies using tools that support the definition of KPI target values and redesigning processes according to the suggested guidelines and models. Additionally, the use of systems in which KPIs and their formulas can be configured, measured, and archived is required.
The study, as outlined, has an application complexity to consider, which is inherent in BPM. Furthermore, no factors regarding the external environment are integrated. These shortcomings are partly mitigated by a periodic re-evaluation of the method and a comparison of the indicators assisted by the final evaluation of the indicator tree.
Torres-Salgado [18] specified how an indicator should reflect the peculiarities and connections of the processes that originate in activities. The author notes the need to establish daily results indicators and associate strategic levels with being more preventive in prevention and improvement. One must consider their relationship with the strategic planning model to define indicators. Then, the strategic alignment in its corresponding organizational or hierarchical levels must be kept in agreement with the implementation. In this case, it is shown how the corresponding lines of action or initiatives must be re-implanted to allow strategic moves to be redirected and claimed towards the desired results. The author points out that indicators should be documented and formalized so that they can be followed up in their monitoring and continuity from one administration to the following using tables so that in the future, they can be classified by the perspectives of the organization’s most significant advantage.
The only criticism we can make of this approach is that it does not provide for an evaluation of the tree of indicators resulting from the analysis of the underlying indicators and a recalculation system when internal and external conditions change. However, these are provided for in the method. Even though this is a medical field paper, it finds its applicability in many areas as the scope does not limit it; still, instead, the process manages to remain generic, relevant, and straightforward in application.
Joppen et al. [19] presented a concept of key performance indicators in production in their paper. Specifically, the authors analyzed typical KPIs and showed their mathematical interconnection; optimization potentials can then be identified. A development target is also determined for each key concept; it describes an increase or decrease in the value dimension due to one or more changes in production. This can be used to verify the success and profitability of a change over time. By comparing the changes and potentials of the concept presented in the study, appropriate KPIs can be assigned to the identified prospects. This is based on the relationships between the key figures and the changes and possibilities presented. A subsequent evaluation can occur if the selected KPIs are implemented in the control instruments.
The method proposed by the authors has an inbuilt comparison of KPIs but, on the other hand, needs the introduction of a recalculation frequency and consideration of the reference business environments.
Azzouz et al. [20] proposed a generic approach for designing, implementing and exploiting a performance indicator system based on the concept of alignment. The authors use the definition of the Performance Indicators System as an essential element used in business management to fulfill this process. It is a way of assessing the health of a company enabling users, managers, and business executives to accurately and effectively measure and manage agreed objectives. The approach is based on a model that aligns the strategic level defined by strategic objectives and the functional level that includes performance indicators. This process consists of five steps:
  • Analysis of the business context and understanding of the data;
  • Definition of the new strategy and identification of the strategic objectives;
  • Design of Performance Indicators System model based on strategic alignment;
  • Multidimensional modelling;
  • Implementation and operation of the PIS for measurement, evaluation and decision-making.
The Performance Indicators System cycle is an iterative and incremental process consisting of five main phases, which begins with analyzing the business context and understanding the data and lead to performance evaluation with the possibility of returning to the second phase, i.e., ‘strategic goal setting’, if the goal set is not achieved or new requirements for performance evaluation are detected.
This method has the significant shortcoming of being complex in its practical application. However, this shortcoming is well mitigated by a periodic review of the indicator tree, and a subsequent evaluation of the performance measurement system detected.

2.2. Quantitative Methods

This section examines some of the most significant quantitative methods in the literature concerning performance measurement systems.
In a recent paper, Pérez-Álvarez et al. [5] presented a model to improve decision support in organizations. The proposed methodology consists of an iterative model that combines companies’ objectives and supports their achievement through the execution of their organizational process. This study allows the Board and Executive Management Team (BET) to understand how actions can positively or negatively affect the KPIs that define the company’s state. This paper is an approach to enhancing tactical decision-making by combining expert knowledge with data-driven analysis, providing a broad view of the entire company. This paper’s main objective is achieved by using so-called Fuzzy Governance Maps (FGM) to help the BET make the best and strategically aligned decisions. The alignment between an organization’s processes and objectives to be achieved are described in strategic plans, and its achievement involves the execution of three steps:
  • Carrying out measurements;
  • Carrying out an analysis of them;
  • Carrying out possible actions that will influence the organization’s objectives.
In order to obtain measurements from the state of the company, Business Activity Monitoring (BAM) or Process Performance Measurement (PPM) tools are used. These tools enable the evaluation of defined KPIs that help to monitor the state of the company on an ongoing basis. Visualizing and tracking the company’s status through observation of indicators can easily be created using so-called dashboards to fulfil the tasks described above.
Suwignjo et al. [21] presented a Quantitative Models for Performance Measurement Systems (QMPMM) model that uses AHP to quantify the effects of factors on performance. These are the three main steps of the model:
  • Identification of factors affecting performance and their relationships;
  • Structuring the factors hierarchically;
  • Quantifying the effect of performance factors.
To visualize and understand the factors influencing performance and their relationships, the QMPMM uses so-called cognitive maps. Performance measurement usually involves a wide range of factors and many people from different departments. Finally, the relative effects of hierarchically structured performance factors can be quantified using standard AHP procedures. The quantification process is performed based on the pairwise comparison of the characteristics. For each pair of elements of a particular level, their effect on the aspect of the next higher level (direct impact) or the facet within the same cluster (indirect effect) is compared. Each comparison is assigned a score between 1 (equally important) and 9 (absolutely most important). The result is a pairwise comparison matrix. The authors thus developed an approach to quantify the relationships between the various factors influencing performance. The advantages of the QMPMM approach can be summarized as follows:
  • The factors that determine performance can be identified and then quantified;
  • It helps managers quantifying the level of impact of each factor on performance and thus leads to focus on improvement activities;
  • Relationships between factors can be identified and expressed in quantitative terms;
When combined in the framework, all of the above-described points help to understand the dynamic behaviour of factors affecting performance. Such an approach presents a powerful tool for comparing and monitoring the company indicators fulfilled by the overall evaluation downstream. One shortcoming can be found in the complexity of the AHP, which may arise from the increasing identification of factors to be evaluated.
More recently, Di Luozzo et al. [22] have proposed a model for assessing the coherence and strategic alignment of an LDC system. The proposed methodology relies on the following steps:
  • Assessment of factors coming from the internal/external environment—With the aim of evaluating the strategic alignment of industrial PMM with the business environment, organizations must be completely aware of internal and external settings;
  • PMM system design—Involves the actual structure of the hierarchy of indicators;
  • Assessment of consistency and alignment to the industrial PMM hierarchy—It represents the crucial step of the entire methodology, which introduces three quantitative criteria for evaluation of the indicators’ alignment. When an alignment is less than satisfactory, a feedback loop is triggered, and the industrial PMM system design is continuously executed until the PMM system consistency is deemed acceptable.
This method makes it possible to update the system in the company according to changes occurring in the internal but also in the external environment. Indeed, it is important to emphasise how external changes can generate modifications for the company’s CSF; precisely because of the potential impact on strategic alignment and coherence, it is important to recalculate these factors. The structure of the proposed method has several desirable features: ease of application and understanding of internal and external perspectives, comparison of the various indicators, and evaluation of the overlying industrial PMM system.
Lee et al. [23] provided an optimization model based on algorithms to determine core organizational objectives based on the balanced scorecard. In their work, the authors analyze the current state of control processes to maximize governance objectives hierarchically related to corporate goals.
The model implementation hence consists of:
  • Data collection and clustering—Questionnaires submitted to employees; participants were divided into two categories based on years worked and on job position classification;
  • Optimization of the control processes with the proposed algorithms—A Genetic Algorithm (GA) was implemented to optimize the current state of the control processes provided by the respondents. This algorithm is chosen to optimize the controls, as the optimal measurement of organizational objectives was sought through its implementation.
The framework proposed by the authors presents a complex set of algorithms to assess the consistency of measurement systems within the company. However, no solutions are implemented to consider a perspective outside the company.
Micheli and Mura [7] presented a study that considers both research on the links between strategies and industrial PMM with reflections on its effectiveness and consideration. Furthermore, the proposed method also evaluates the relationships between prospective strategy, global industrial PMM and company performance. Specifically, the authors describe how a complete PMM encompasses the relationship between strategy and company performance, as it helps them comprehensively understand their performance, how to communicate priorities, create alignment and motivate employees. The methodology is composed as presented below:
  • Sample—Interviews were conducted with industry experts and also with staff from one of the organizations involved to refine key variables and measures;
  • Full industrial PMM—To measure a company’s adoption of a very balanced set of indicators, KPI measures were combined into one factor;
  • Corporate performance—Three perceived measures of corporate performance were used as dependent variables for the study.
This work examines the connections between different strategic orientations, the complete PMM and three aspects of corporate performance: organizational, innovative and operational. To implement this approach, an equation model was developed. First, three models were developed to examine the effects of differentiation strategy and cost leadership strategy on corporate performance. The authors then developed a fourth model, which looks at the impact of strategy variables on adopting a full PMM.
Despite its complexity due to the various models designed and being algorithmic, this approach considers both the evaluation of the overarching PMM and the concept of comparing performance indicators.
Wannes and Ghannouc [24] presented a KPI-based approach for improving the company processes; performance requirements on company processes are specified as KPIs with target values that must be achieved within specific periods. To improve business processes, their evaluation is a necessary and fundamental step, as the latter provides various measurements that indicate whether or not business objectives have been achieved. Furthermore, BPM (Business Process Modeling) enables companies to understand their internal business processes better using a graphical notation and communicate them in a standardized way. BPM allows business processes to be designed, monitored, configured, and evaluated [25]. An essential aspect of the life cycle of such methods is performance evaluation [26] (Del-Río-Ortega and Resinas, 2009). The proposed methodology is a BPM cycle in which the life cycle of KPIs is highlighted. The KPI measurements allow the process and recommendations of the proposal to be evaluated, which would help users improve their projects’ performance and make the right decisions.
In the work of Schmidt et al. [27], a method for implementing KPIs to improve energy efficiency in the manufacturing sector was presented. This methodology aims to verify the accuracy of KPIs in the first instance and then proceed to the subsequent implementation. This procedure is necessary to avoid misinterpretations, forced redundancies, dark sides and failures. The work consists of a subsequent series of checks to validate the KPI calculation: the first check inspects the resulting unit of the KPI (a complete analysis helps to reveal inconsistencies); the second check is based on a comparison between the current and desired value. The validation process analyzes the indicator’s ability to easily deduce potential improvement measures and the corresponding fields of action to improve the company’s performance at various levels. Aligning the KPI with specific or overall targets is of interest to verify whether the achievement of the target is realistic.
Aracioglu et al. [28] presented a method to measure and evaluate performance within the strategic management perspective. The study aims to assess performance metrics in detail and discover strategic decisions’ effects on implementation. A performance measurement questionnaire was conducted in the company; the results were then evaluated to create a model for process improvement. It was defined how strategic decisions made due to five different situations would affect the efficiency of the company and the critical importance of strategic management. Such a framework consists of a method of considerable complexity that nevertheless assumes a periodic (thus significant) recalculation, considering both KPI comparison and industrial PMM evaluation. Such a method may be a candidate for analysis.
On the other hand, the work of Kang et al. [29] presented a hierarchical structure of KPIs for production management and continuous improvement of such systems. Their paper proposes a hierarchical structure for categorizing KPIs and identifying and analyzing their inherent relationships. Indicators and their measurement elements are classified at various levels, thus exploring the intrinsic pairwise relationships between KPIs. This structure provides a valuable tool for measuring, analyzing and utilizing KPIs.
This methodology brings a straightforward system to implement, a periodic review and presents a method for comparing indicator values. However, it should be noted that it lacks the consideration of internal and external perspectives and the evaluation of the measurement system above.

2.3. Comparative Analysis of Methods

This section analyzes the methodologies set out above, drawing attention to which are applicable, and which are less so, depending on the various criteria chosen for their evaluation. Indeed, we aim to define the most suitable methodology for assessing coherence and designing a tree of indicators aligned with the company’s strategic goals, which will then be validated through a case study. For this purpose, eight criteria were identified for evaluating the methods analyzed in the literature, deemed suitable for the task described above. The requirements were designed to identify the approach best suited to this work’s scientific and industrial needs. The criteria chosen are:
  • Qualitative methodology: include contributions that do not use formulas, mathematical models and/or statistics;
  • Quantitative methodology: include contributions that use formulas, mathematical models and/or statistics;
  • Ease of implementation: represent a criterion that aims to identify how easy the method is to apply and implement in an organizational reality, therefore, an evaluation scale has been established to indicate this ease. The scale is numerically composed of integers ranging from 1 (complex implementation) to 3 (simple implementation);
  • Frequency of recalculation: represent a criterion set to understand the frequency with which the proposed approach requires the tree to be assessed, as it may vary and be modified by the company due to certain conditions. The rating scale chosen consists of the items: Static (indicates that the method does not envisage a subsequent recalculation), Dynamic (indicates that the approach envisages a recalculation not at constant intervals, but as certain underlying conditions change), Periodic (suggests that the method makes recalculations following the passing of regular time breaks);
  • Inclusion of internal and external perspectives: represent a criterion that aimed at determining whether the methodology includes or not these perspectives;
  • Validation of industrial PMM consistency: represent a criterion for assessing the consistency of the PMM indicates whether the listed procedures provide for such an assessment or whether it is absent, indicating this with a confirmation sign if yes. This criterion is necessary to identify whether the proposed method provides for an evaluation of the consistency of performance measurement systems;
  • Comparison of KPIs: represent a criterion that aimed to check whether the approach provides for a comparison of KPIs and, consequently, the underlying indicators;
  • Integrability of KAIs: represents a criterion that seeks to assess whether the method integrates KAI into its structure;
  • Proposed methodology: represent the criterion concerning the proposed calculation methodology, indicating the quantitative or qualitative method used. The following division of the methods mainly found in the literature is adopted: decision support, algorithmic procedure, indicator validation procedure, Delphi panel or questionnaire, industrial PMM and strategic alignment.
It is helpful to emphasize that the criterion concerning the possibility of integrating the method by taking Key Activity Indicators into account was also introduced into the analysis. However, none of the proposed methods takes them into account; some of them, due to their structure, present the possibility of being integrated into this sense. The importance of extending a method in this direction would make it possible to link KPI-KRIs with a set of KPIs by evaluating the strategic alignment of the PMM even more precisely.
The analysis of the different criteria defined is now shown in Table 1, highlighting why this was chosen and its purpose.
The ideal situation for the methods in the literature is represented by a technique that can fulfil the criteria of quantitative methodology, inclusion of internal and external perspective, industrial PMM consistency assessment, KPI comparison, and has a high ease of implementation and frequent recalculation rule. Therefore, identifying a method that combines all the required conditions will be a plus for the study, thus presenting a comprehensive and wide-ranging model that can easily take into account and evaluate all the facets possessed by a tree of indicators.
It can be seen that the proposed approaches are more or less equally divided between qualitative and quantitative methodologies, allowing for a broad spectrum of implementable methods. Indeed, the critical analysis of the scientific literature allowed to determine this categorization, since no relevant “hybrid/mixed” model was found out in the current state-of-the-art. Moreover, having the possibility of giving practical grounding to a quantitative methodology or being able to develop a system theorized in the scientific literature concretely are possibilities equally to be taken into account for the assessment of the coherence of a tree of indicators. However, as emphasized above, a quantitative methodology is preferable so that a relevant practical application can be made to an already existing and proven effective evaluation method.
Analyzing the criterion of ease of implementation, it can be seen that there are works that possess one as the result of the analysis; this value indicates that the approach presents a high complexity in terms of practical application of the method. This result suggests that the proposed procedure either presents a complex algorithm, an elaborate structure for Analyzing the results of the questionnaires or presents graphs with links between values that require a very long and complex analysis, which in practice would be too difficult to implement and would not be accepted by those who have to implement it. The methods that respond with two to the same item show an application technique of neutral difficulty, having characteristics that, by construction, present a minimal residual problem that does not make them immediately applicable, and the timing of their application must nevertheless be taken into account. Consequently, the items in the table with a 3 to the criterion in question are those that best combine short application times and simplicity of calculation or method establishment; for these reasons, methodologies with this value are considered among the best implementable within organizations.
Continuing, it can be seen that in the entry showing the recalculation frequency of the method, the “static” entries are multiple: this is a result we wish to avoid since it is well known that boundary conditions, especially in competitive environments, can change continuously over time, leading to the need to revise the strategy frequently. Therefore, to have a structure that does not provide for a subsequent recalculation derived from changing conditions, such as those exemplified above, is to be considered a significant shortcoming, as such considerations are considered fundamental and necessary for successful and reliable evaluation work. Some approaches possess a periodic recalculation frequency, which means that after a specific fixed interval of time, there will be a reassessment, but this too is not entirely satisfactory as a periodic revision. However, it gives dynamism to the model and provides for reassessments that may prove to be unnecessary, given that the conditions or environments have not changed significantly. Moreover, if something were to change, a re-evaluation of the indicator tree would not be required, but one would have to wait until the recalculation period for an update. This leads to inefficiencies in the company as it will measure its performance inappropriately with metrics that have become useless as long as there is no update. Possessing the peculiarity of ‘dynamic’ makes a methodology very efficient and responsive, as it prevents the company from wasting resources in measuring performance that is no longer needed and obsolete. Indeed, this peculiarity will undoubtedly be more demanding to implement than the periodic one, as it requires constant monitoring of the environment and a consequent re-evaluation when specific changes occur. Still, it avoids problems from measuring metrics that are no longer necessary or incorrect. By doing so, one focuses more on performance while still being able to be competitive and responsive.
It can be seen that, concerning the criteria of including the internal and external perspective, assessing the consistency of the industrial PMM and comparing KPIs, it is tough to find a method that succeeds in satisfying all three. Still, often only a couple of them can be happy, or there are even approaches that stop at just one. These shortcomings, unfortunately, render the evaluation techniques incomplete in assessing the strategic alignment of a tree of indicators. In particular, we note that the criterion least fulfilled by these presented methods is that of the inclusion of the internal and external perspectives. This is considered a peculiarity that must be fundamentally present in the proposed plan; in fact, this lack makes methods that do not consider these criteria unreliable in the organizational context. Going on, it can be seen that the assessment of industrial PMM consistency is a concept shared by almost all methods, contrary to what was found for the KPI comparison criterion. Many ways are deficient in this section, showing how many approaches lacking this condition only assess the general consistency of performance measurement systems without carrying out a more in-depth analysis of what is happening at the critical and underlying indicator level. Unfortunately, this leads to the necessity that many methods remain on the surface by not proceeding with a deeper and more detailed analysis. Thus, for such practices, having only an overall view of how the measurement system performs does not make the investigation capable of discriminating whether the indicators adhere to the critical success factors and achieve strategic coherence. The combination of these considerations leads to the need to exclude all methods that do not have the criteria discussed above from the final choice.
Having to focus on the methods that manage to satisfy all three required categories, the circle is reduced to just two methods: the method presented by Di Luozzo et al. [22] and Kaganski et al. [13]. Despite the fact that these two approaches succeed in combining the three fundamental characteristics stipulated above, there are some notable differences between them: the latter presents a low ease of implementation (coefficient of 1), compared to a coefficient of 3 obtained by the former; furthermore, in the category relating to the comparison of the inherent structures of the methodologies, the latter consists of a qualitative methodology, whereas the former is quantitative. Firstly, with regard to the coefficient of ease of application, the difference between the two methods is clear: there is in fact a very high discrepancy in application, which naturally leads one to choose, all things being equal, the method with an easier application. Secondly, the characteristic of having presented a qualitative methodology makes the approach of Kaganski et al. [12] of less practical use than that inherent in the approach presented by Di Luozzo et al. [22]. In conclusion, the aforementioned differences make the choice of the method that best meets the required criteria fall on the approach of Di Luozzo et al. [22], which will be adopted for the case study analysis.

3. Method Description and Integration with KAI

This section will present a more detailed description of how the chosen method works. Subsequently, the proposed methodological integration will be shown as the method is also among the few candidates to be integrated with the inclusion of KAI. Finally, in the next section, its empirical validation will be described.

3.1. Framework and Alignment Evaluation Criteria

The methodology proposed by Di Luozzo et al. [22] aims to provide a comprehensive framework to design and assess the consistency of the overall alignment of a hierarchy of indicators in an unstable and changing environment.
To do this, an evaluation structure is introduced: the trends and priorities of the internal and external environment are assessed to estimate how the company should position itself in the market and, if there is a change in these factors, a re-evaluation of the feedback of these parameters is triggered. The performance measurement and management system will then be designed according to the procedure described above; at this stage, the tree of indicators, their hierarchy, CSFs, KPIs and KRIs will be formalized. As a final step, the consistency of the tree alignment will be assessed. It should be noted that after analysing the internal and external environment, the organization must identify its CSFs and review them whenever there is a change in perspective due to internal or external changes. This identification is necessary to design the hierarchy of indicators, which will then be evaluated through the proposed criteria. From the critical success factors must derive, following the 10/80/10 rule, about 10 KPIs and 10 KRIs, followed by about 80 PIs and RIs below them, which departments or teams will use to make more specific measurements. The calculations of the three criteria will start from each combination of the latter indicators. There will be an assessment of the consistency between KPIs and KRIs (same for KRIs and RIs), an assessment of the calculability of PIs and RIs and, finally, the identification of guidelines to improve the calculability of PIs/RIs together with the general consistency between PIs and KRIs. The same is performed for the KPIs and KRIs; only the latter will be compared with the corporate CSFs to check the consistency.
There are three criteria introduced in the method to assess consistency and alignment:
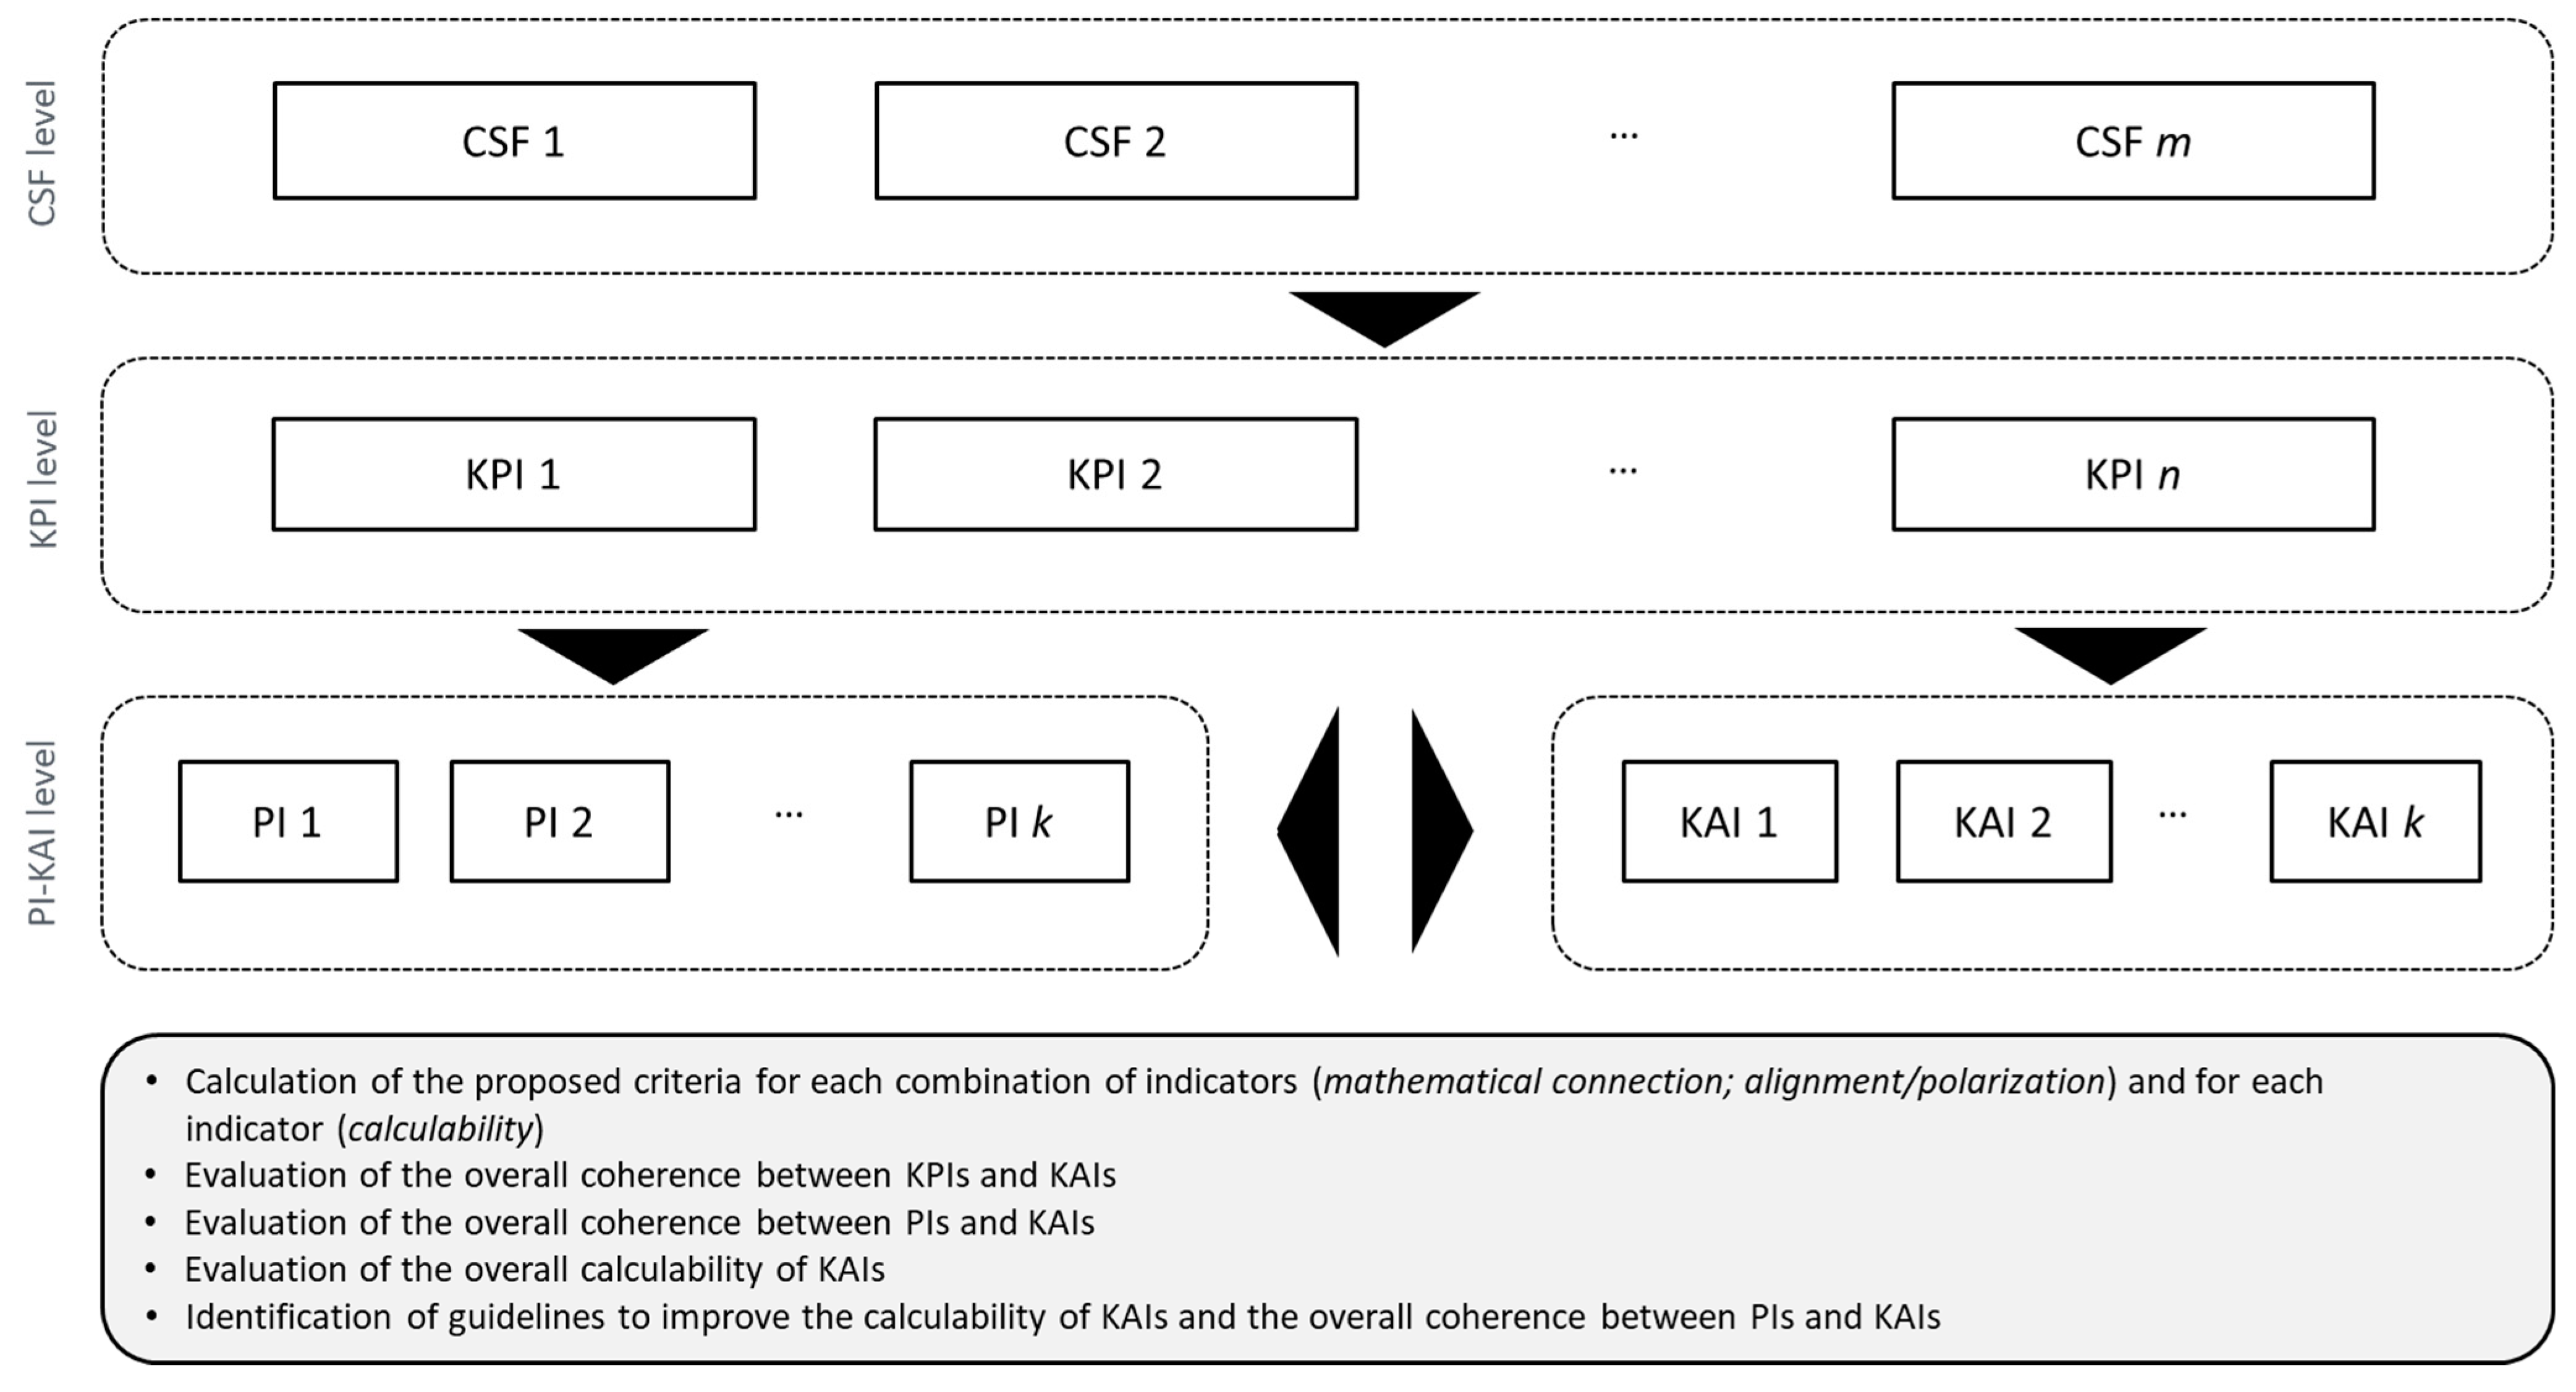
  • The ‘Mathematical Connection’ (MC)—This criterion measures the degree to which two items are mathematically connected or related within the industrial PMM; it is common in the literature to assess the relationship between sets of indicators. The measurement scale ranges from 0, no mathematical connection, to 4, maximum mathematical connection.
  • The ‘Alignment/Polarization’ (AP)—This measures the positive/negative influence between two elements, i.e., whether there is an alignment or misalignment between indicators. The score assigned in this criterion can be equal to -1 if the indicators are strategically misaligned, 0 if there is no alignment/misalignment, and +1 if they are strategically aligned.
  • The criterion of “Generic Computability” (C)—This measures the availability of data needed to calculate a specific element or indicator. This can take values between 0, no data availability, to 4, easily available data and simple calculation.
Let us now see how the method is mathematically encoded:
O C A s t r a t e g i c   l e v e l = j = 1 n i = 1 m M C i j A P i j 4 m A P i j = 1 n A P i j = 1   [ % ] O C A o p e r a t i o n a l   l e v e l = h = 1 k j = 1 n M C j h A P j h 4 n A P j h = 1 k A P j h = 1   [ % ]
G C K P I = j = 1 n C j 4 n   [ % ] G C P I = h = 1 k C h 4 k   [ % ]
where:
  • MCij is the connection from a mathematical standpoint between CSFi and KPIj, whereas MCjh represents the mathematical connection between KPIj and PIh;
  • APij defines the alignment/polarization between CSFi and KPIj, whereas APjh represents the alignment/polarization between KPIj and PIh;
  • Cj represents the calculability of KPIj, whereas Ch represents the calculability of PIh.
The OCA (Overall Consistency Alignment) indicator shows how closely the indicators are aligned with both the strategic level (CSF and KPIs) and the operational level (KPIs and Pis) by weighing the values of the mathematical connection of the indicators. The OCA has a range of values between 0% and 100%; 0% indicates complete strategic misalignment of the industrial PMM system, whereas 100% indicates full strategic alignment and direct mathematical connection to the system. The GC (General Calculability) indicator shows whether the different indicators composing the Performance Measurement and Management system are currently available to the decision makers. The GC value ranges from 0% to 100%; 0% means complete unavailability of the data required for calculation, whereas 100% means full data availability and ease of use.

3.2. KAI Introduction

Key Activity Indicators (KAIs) are among the most popular and specific measurers used among some of the most well-known models for achieving operational excellence such as Lean Manufacturing or the Toyota Production System (TPS). Di Luozzo et al. (2022) [30], based on a review of the literature, proposed critical criteria for their implementation in companies, which the present work also aims to do by integrating them within PMMs. KAIs were created with the aim of measuring activities carried out on a day-to-day basis with the organisation’s long-term strategy, so that individual activities could be measured and aligned with longer-term goals [10].
By extending the proposed mathematical representation set out in the previous section, we can therefore go on to define an Overall Expected Indicator (OEI) that represents the impact that KAIs have on KPIs (see Figure 1). The introduction of this factor within an already very robust method allows the industrial PMM to be dramatically effective in measuring the impact of day-to-day activities against the company’s key elements, thus being able to drive and/or respond to rapid changes both internally and externally.
O E I s t r a t e g i c   l e v e l = j = 1 n i = 1 m M C i j A P i j 4 m A P i j = 1 n A P i j = 1   [ % ] O E I o p e r a t i o n a l   l e v e l = h = 1 k j = 1 n M C j h A P j h 4 n A P j h = 1 k A P j h = 1   [ % ]
G C K A I = j = 1 n C j 4 n   [ % ]
  • M C i j defines the connection from a mathematical standpoint between K P I i   and K A I j , whereas M C j h represents the mathematical connection between K A I j and P I h ;
  • A P i j is the alignment/polarization between K P I i and K A I j , whereas A P j h represents the alignment/polarization between K A I j and P I h ;
  • C j symbolizes the calculability of the K A I j .
Based on the contribution of Di Luozzo et al. [22] and the work of Battista and Schiraldi [31] the mathematical connection parameter has been adapted as a score that ranges between 0 and 4 (where 0 means “no mathematical connection”, and 4 defines “maximum mathematical connection”).

4. Case Study

This section deals with applying the described method to the case of a pharmaceutical company, whose objective was to define a new coherent industrial PMM system with the strategic vision of the organization. Therefore, a brief description of the reference company context will be provided. Subsequently, the implementation of the chosen methodology will be carried out.
The company under study, which will hereafter be referred to as Pharma Ltd. (based in Italy) for confidentiality reasons, is a pharmaceutical subcontractor at the end of the pharmaceutical supply chain; the core of its activities is the labelling and delivery of finished products. In order to identify the most suitable operational CSFs for its needs, Pharma S.p.A. followed the steps identified in the method, i.e., identifying requirements, priorities and trends both internal and external to the organisation. The result of this investigation is summarised in Table 2.
The thresholds for a satisfactory assessment are set at 70% for the strategic level and 60% for the operational level. The operational level was considered with a lower target than the strategic level since, having many more factors at stake, it requires a more demanding calculation. For the evaluation of CSFs, the most significant KPIs/KRIs, shown in Table 3, were introduced from different functional areas.
The main PI/RIs used in the application are instead shown in Table 4, together with their respective department.

5. Discussion

Based on the evaluation of what was reported in the previous section, the method returns the following results, for the AS-IS state:
O C A s t r a t e g i c = 62 % O C A o p e r a t i o n a l = 44 % G C K P I / K R I = 72 % G C P I / R I = 70 %
After implementing the chosen methodology by including the KAI dimension, the results obtained were:
O C A s t r a t e g i c = 77 % O C A o p e r a t i o n a l = 62 % O E I s t r a t e g i c = 71 % O E I o p e r a t i o n a l = 69 %
G C K P I / K R I = 84 % G C P I / R I = 80 % G C K A I = 78 %
These results can be considered satisfactory by far, as, compared to the calculation of the situation before the takeover by Pharma Ltd., an improvement of 24% was achieved at the strategic level and a gain of 40% at the operational level; these results show how the target values set in the previous paragraph were committed. It was shown how, with a few targeted adjustments, a consistent tree of indicators was performed at both the CSF and the lower levels. This result shows how the methodology applied for evaluating the hierarchy of indicators is valid in fulfilling its task and achieving the desired results. The improvement was especially significant in the operational case, where, despite a hoped-for level of around 70%, it benefited from an increase of 40%. At the strategic level, on the other hand, the hoped-for result—the target was set at around 70%—was achieved, reaching 77%, indicating almost complete alignment with the CSF.
On the general calculability side, on the other hand, an increase of 17% can be noted for the key indicators and 14% for the underlying indicators, also indicating a good improvement in the ease of obtaining data or being able to make better use of those already available. It can be seen that there has been an improvement in the calculation of “% Lots started on time” and “% Lots dispatched on time”, as the extraction of the data from which these two indicators are calculated has been improved, making them easy to calculate.

6. Conclusions and Further Developments

The presented work, starting from an analysis of the different methods in the literature, aimed to investigate PMM systems in the industrial environment considering their overall consistency in supporting companies to remain competitive in a continuously changing environment. In addition, a critical analysis of the main methodologies present in the literature is also provided it is important to emphasise that the choice of criteria for evaluating methods is affected by the subjectivity of the authors and thus by its very nature can be improved. Finally, the best method according to the chosen criteria was defined and validated in a real pharmaceutical company case.
Ultimately, the work also extended what the method had previously defined at the start by introducing the dimension of Key Activity Indicators.
Once the best method had been defined according to the defined criteria and applied to an application case, the method of Di Luozzo et al. (2021) was validated, the PMM system identified and quantified changes in the external environment and also assessed their impact on the strategic and operational organisation. This approach, therefore, allows the identification of possible problems in the different organisational levels and also guides the design of the industrial PMM system. This work presents further insights that would be interesting to explore. Indeed, the choices of evaluated methods and criteria inevitably result from the subjectivity of those who conducted the analysis. Therefore, further work could investigate and consider different ways according to standards broadened from those used here. Secondly, it would be interesting to introduce new dimensions to be considered for the methods examined. For example, being able to introduce aspects concerning the human dimension within the indicator tree could lead to interesting results. The methodology identified in this paper could be expanded and fortified in its elements through different applications in different industrial sectors. Being able to be dropped and tested in different organisations operating in different markets would fortify the method and also lead to identifying the main elements that can guide companies in defining their strategic and operational objectives.

Author Contributions

Conceptualization, I.C.F. and S.D.L.; data curation, I.C.F.; formal analysis, I.C.F. and S.D.L.; investigation, I.C.F.; methodology, I.C.F. and S.D.L.; project administration, S.D.L.; supervision, M.M.S.; validation, I.C.F.; writing—original draft, I.C.F. and S.D.L.; writing—review & editing, I.C.F. and S.D.L. and M.M.S. All authors have read and agreed to the published version of the manuscript.

Funding

This research received no external funding.

Institutional Review Board Statement

Not applicable.

Informed Consent Statement

Not applicable.

Data Availability Statement

Data is contained within the article.

Conflicts of Interest

The authors declare no conflict of interest.

References

  1. Bourne, M.; Franco-Santos, M.; Micheli, P.; Pavlov, A. Performance measurement and management: A system of systems perspective. Int. J. Prod. Res. 2017, 56, 2788–2799. [Google Scholar] [CrossRef]
  2. Hanson, J.; Melnyk, S.A.; Calantone, R.A. Defining and measuring alignment in performance management. Int. J. Oper. Prod. Manag. 2011, 31, 1089–1114. [Google Scholar] [CrossRef]
  3. Micheli, P.; Manzoni, J.-F. Strategic Performance Measurement: Benefits, Limitations and Paradoxes. Long Range Plan. 2010, 43, 465–476. [Google Scholar] [CrossRef]
  4. Rodríguez-Rodríguez, R.; Alfaro-Saiz, J.-J.; Carot, J.M. A dynamic supply chain BSC-based methodology to improve operations efficiency. Comput. Ind. 2020, 122, 103294. [Google Scholar] [CrossRef]
  5. Pérez-Álvarez, J.M.; Maté, A.; Gómez-López, M.T.; Trujillo, J. Tactical Business-Process-Decision Support based on KPIs Monitoring and Validation. Comput. Ind. 2018, 102, 23–39. [Google Scholar] [CrossRef]
  6. Dekker, H.C.; Groot, T.; Schoute, M. A Balancing Act? The Implications of Mixed Strategies for Performance Measurement System Design. J. Manag. Account. Res. 2012, 25, 71–98. [Google Scholar] [CrossRef]
  7. Micheli, P.; Mura, M. Executing strategy through comprehensive performance measurement systems. Int. J. Oper. Prod. Manag. 2017, 37, 423–443. [Google Scholar] [CrossRef]
  8. Wibisono, D. A Framework of Performance Measurement System for Manufacturing Company. South East Asian J. Manag. 2011, 5, 1. [Google Scholar] [CrossRef]
  9. Melnyk, S.A.; Bititci, U.; Platts, K.; Tobias, J.; Andersen, B. Is performance measurement and management fit for the future? Manag. Account. Res. 2014, 25, 173–186. [Google Scholar] [CrossRef]
  10. Murata, K.; Katayama, H. AN EVALUATION OF FACTORY PERFORMANCE UTILIZED KPI/KAI WITH DATA ENVELOPMENT ANALYSIS(<Special Issue>Operations Research for Performance Evaluation). J. Oper. Res. Soc. Jpn. 2009, 52, 204–220. [Google Scholar] [CrossRef]
  11. A Melnyk, S.; Stewart, D.M.; Swink, M. Metrics and performance measurement in operations management: Dealing with the metrics maze. J. Oper. Manag. 2004, 22, 209–218. [Google Scholar] [CrossRef]
  12. Kaganski, S.; Paavel, M.; Lavin, J. Selecting Key Performance Indicators with Support of Enterprise Analyze Model. In Proceedings of the 9th International DAAAM Baltic Conference Industrial Engineering, Tallinn, Estonia, 24–26 April 2014. [Google Scholar]
  13. Kaganski, S.; Majak, J.; Karjust, K.; Toompalu, S. Implementation of Key Performance Indicators Selection Model as Part of the Enterprise Analysis Model. Procedia CIRP 2017, 63, 283–288. [Google Scholar] [CrossRef]
  14. Alexander, A.; Kumar, M.; Walker, H. A decision theory perspective on complexity in performance measurement and management. Int. J. Oper. Prod. Manag. 2018, 38, 2214–2244. [Google Scholar] [CrossRef] [Green Version]
  15. Ittner, C.D.; Larcker, D.F.; Randall, T. Performance implications of strategic performance measurement in financial services firms. Account. Organ. Soc. 2003, 28, 715–741. [Google Scholar] [CrossRef] [Green Version]
  16. Villalba-Diez, J. The Hoshin Kanri Forest; Lean Strategic Organizational Design; Productivity Press: New York, NY, USA, 2017. [Google Scholar]
  17. Cherni, J.; Martinho, R.; Ghannouchi, S.A. Towards Improving Business Processes based on preconfigured KPI target values, Process Mining and Redesign Patterns. Procedia Comput. Sci. 2019, 164, 279–284. [Google Scholar] [CrossRef]
  18. Torres-Salgado, M.K. Indicadores de desempeño de procesos médicos con alineamiento estratégico en la atención al paciente. Cir. Cir. 2021, 89, 403–410. [Google Scholar] [CrossRef]
  19. Joppen, R.; von Enzberg, S.; Gundlach, J.; Kühn, A.; Dumitrescu, R. Key performance indicators in the production of the future. Procedia CIRP 2019, 81, 759–764. [Google Scholar] [CrossRef]
  20. Azzouz, M.; Boukhedouma, S.; Alimazghi, Z. Impact of Strategic Alignment on Company Performance: An approach based on performance indicators system design. In Proceedings of the 2020 International Conference on Advanced Computer Science and Information Systems, ICACSIS 2020, Depok, Indonesia, 17–18 October 2020; pp. 233–240. [Google Scholar] [CrossRef]
  21. Suwignjo, P.; Bititci, U.; Carrie, A. Quantitative models for performance measurement system. Int. J. Prod. Econ. 2000, 64, 231–241. [Google Scholar] [CrossRef]
  22. Di Luozzo, S.; Del Beato, F.; Schiraldi, M.M.M. Measuring coherence of performance measurement indicators in complex and changing environments. Int. J. Prod. Perform. Manag. 2021. [Google Scholar] [CrossRef]
  23. Lee, S.; Costello, F.J.; Lee, K.C. Hierarchical balanced scorecard-based organizational goals and the efficiency of controls processes. J. Bus. Res. 2021, 132, 270–288. [Google Scholar] [CrossRef]
  24. Wannes, A.; Ghannouchi, S.A. KPI-Based Approach for Business Process Improvement. Procedia Comput. Sci. 2019, 164, 265–270. [Google Scholar] [CrossRef]
  25. Del-Río-Ortega, A.; Resinas, M.; Ruiz-Cortés, A. Challenges to Support A PPI Management Lifecycle. Actas Talleres Jorn. Ing. Softw. Bases Datos 2010, 4, 8–13. [Google Scholar]
  26. Del-Río-Ortega, A.; Resinas, M. Towards Modelling and Tracing Key Performance Indicators in Business Processes. Actas Talleres Jorn. Ing. Softw. Bases Datos 2009, 3, 57–67. [Google Scholar]
  27. Schmidt, C.; Li, W.; Thiede, S.; Kornfeld, B.; Kara, S.; Herrmann, C. Implementing Key Performance Indicators for Energy Efficiency in Manufacturing. Procedia CIRP 2016, 57, 758–763. [Google Scholar] [CrossRef]
  28. Aracıoğlu, B.; Zalluhoğlu, A.E.; Candemir, C. Measuring and Evaluating Performance within the Strategic Management Perspective: A Study on Performance Measurement of a Seafood Company. Procedia Soc. Behav. Sci. 2013, 99, 1026–1034. [Google Scholar] [CrossRef] [Green Version]
  29. Kang, N.; Zhao, C.; Li, J.; Horst, J.A. A Hierarchical structure of key performance indicators for operation management and continuous improvement in production systems. Int. J. Prod. Res. 2016, 54, 6333–6350. [Google Scholar] [CrossRef]
  30. Di Luozzo, S.; Keegan, R.; Liolli, R.; Schiraldi, M. Key Activity Indicators: Critical review and proposal of implementation criteria. Int. J. Product. Perform. Manag. 2022. [Google Scholar] [CrossRef]
  31. Battista, C.; Schiraldi, M.M. The Logistic Maturity Model: Application to a Fashion Company. Int. J. Eng. Bus. Manag. 2013, 5, 29. [Google Scholar] [CrossRef]
Figure 1. Representation of the integration of CSF-KPI and PI-KAI levels.
Applsci 13 00235 g001
Table 1. Comparative analysis of methods.
Reference Qualitative Method Quantitative Method Ease of Implementation Inclusion of Internal and External Perspective Assessment of Industrial PMM Consistency KPIs Comparison KAIs Integrability Frequency of Recalculation Proposed Calculation Method
(Aracioglu, Zalluhoglu, and Candemir, 2013) [28] 1 PeriodicValidation procedure
(Alexander, Kumar, and Walker, 2018) [15] 2 DynamicDelphi panel or questionnaire
(Azzouz, Boukhedouma, and Alimazghi, 2020) [20] 1 DynamicStrategic Alignment
(Cherni, Martinho, and Ghannouchi, 2019) [17] 2 PeriodicStrategic alignment
(Di Luozzo, Del Beato, and Schiraldi, 2021) [22] 3DynamicAlgorithmic procedure
(Hanson, Calantone, and Melnyk, 2011) [2] 3 StaticStrategic alignment
(Ittner, Larcker, and Randall, 2003) [14] 2 StaticDelphi panel or questionnaire
(Joppen, von Enzberg, Gundlach, Kuhn, and Dumitrescu, 2019) [19] 2 StaticStrategic Alignment
(Kaganski, Majak, Karjust, and Toompalu, 2017) [13] 1 DynamicDelphi panel or questionnaire
(Kang, Zhao, Li, and Horst, 2016) [29] 3 PeriodicValidation procedure
(Lee, Costello, and Lee, 2021) [23] 2 StaticAlgorithmic procedure
(Melnyk, Bititici, Platts, Tobias, and Andersen, 2014) [9] 3 StaticDelphi panel or questionnaire
(Mura and Micheli, 2017) [7] 2 StaticAlgorithmic procedure
(Pérez-Álvarez, Maté, Gómez-López, and Trujillo, 2018) [5] 1 DynamicDecision support
(Schmidt et al., 2016) [27] 2 StaticAlgorithmic procedure
(Suwignjo, Bititci, and Carrie, 2000) [21] 1 StaticDecision support
(Torres-Salgado, 2021) [18] 3 StaticStrategic alignment
(Villaba-Diez, 2017) [16] 3 DynamicPMM
(Wannes and Ghannouchi, 2019) [24] 2 StaticValidation procedure
(Wibisono, 2011) [8] 1 DynamicPMM
Table 2. Main CSFs identified.
Organizational CSFs Adopted for the Analysis
(1)Care for the patient its mission is to generate products that heal people and give pride to those who work for society
(2)Immediate feedback to the customer to make the business system that manages and takes care of the customer as fast and responsive as possible
(3)To make the workplace as safe an environment as possible where one can perform one’s task with peace of mind and take care of one’s employees.
(4)Making the supply chain reliable, secure and on time
(5)Ensure that production is always excellent in terms of reliability and efficiency, thus producing finish products constantly evolving towards perfection
(6)The realization of products with maximum adherence to the requirements of customers
Table 3. Most significant KPIs, KRIs and KAI considered.
Area/Function/TeamKPI/KRIKAI
Production% Batches started on time Number of changes due to non-compliant MPs
Number of scheduling changes
Number of training activities delivered
Supply Chain% Batches sent on timeNumber of changes in frozen period
Number of delays due to material retrieval problems in the warehouse
Number of training activities given
Quality% Conforming ProductsPercentage of irregularities related to raw material
Coaching activities related to specific problems
Number of training activities provided
FinanceRevenuesNumber of customers retained
Number of projects initiated for cost reduction
Number of resources that have been included within the execution of optimization projects
FinanceCostsTotal value of audit activities performed on suppliers
Number of cost reduction projects undertaken
Number of training activities delivered
HRPerception of management involvementNumber of loyal customers
Number of annual customer satisfaction surveys carried out
Number of training activities provided
HRAverage working hoursNumber of overtime hours worked
Number of hours worked at weekends
Percentage of interviews carried out on employee satisfaction
SafetyProductive daysNumber of consecutive days without serious accidents
Number of consecutive days without near misses
Number of training activities provided
Table 4. PI/RI and Department area.
DepartmentPI/RI
ManufacturingOEE target
% Lots started on time target
WIP
5S
Production capacity
% Capacity utilization
Lead time
Downtime
Respect of closing dates
Respect for dates shared with the customer
OEE Business Unit
Business Unit personnel saturation
Maintenance% Progress
Machinery breakdowns (per line)
% Adherence to plan
Quality assuranceSupplier material quality
Complaints closed on time
Deviations closed on time
No. redesigns
No. corrected products
No. re-evaluations
No. redesigns
Most frequent defects
Rejected batches
Reworked batches
Recalled batches
No. of closed/open complaints
No. of corrections out of time
Monitoring of environmental excursions
External defect cost
Target deviations
Batches released
Cost of internal defects
Shipping% Lots dispatched on target time
Num deliveries to key customers
Num late deliveries to key customers
WarehouseWarehouse turnover rate
Stock replenishment
Days of inventory replenishment
PlanningAdherence of planning data to MRP
Inventories
Customer evaluation
EHSEHS improvements
Near miss
PSB target
SI target
PSB
SI
Level A,B,C,D
Time to productivity
ControlMaintenance cost
Cost of obtaining necessary authorizations
Cost of rework
Stockout cost
Ticket cost
AccountingInvoices issued
Customer loyalty rate
% Line turnover
Turnover recognition
Human resourcesPunctuality of personnel
% Process standardization
Staff saturation
Turnover rate
Disclaimer/Publisher’s Note: The statements, opinions and data contained in all publications are solely those of the individual author(s) and contributor(s) and not of MDPI and/or the editor(s). MDPI and/or the editor(s) disclaim responsibility for any injury to people or property resulting from any ideas, methods, instructions or products referred to in the content.

