Article

Analytical Study on the Frictional Behavior of Sliding Surfaces Depending on Ceramic Friction Materials

1
Department of Structural Engineering Research, Korea Institute of Civil Engineering and Building Technology, Goyang-si 10223, Republic of Korea
2
Esco RTS Co., Ltd., Esco Building, Seoul 06134, Republic of Korea
*
Author to whom correspondence should be addressed.
Appl. Sci. 2023, 13(1), 234; https://doi.org/10.3390/app13010234
Submission received: 28 November 2022 / Revised: 16 December 2022 / Accepted: 22 December 2022 / Published: 24 December 2022
(This article belongs to the Section Civil Engineering)

Abstract

:
Friction material, as the main component in a bearing support, allows frictionless behavior between the two connected structures. Previous studies on friction material considered polytetrafluoroethylene (PTFE) and attempted to analyze the resulting friction behavior balance. However, aging PTFE loses its frictionless performances, because PTFE is crushed, causing it to tear, or the lubricant is removed. The performances of the friction material should thus be maintained to preserve the performance of structures. To overcome these issues, this study applies a ceramic friction material owing to its advantages of high strength, low friction, and low deformation. The frictional behavior is investigated on a full-scale model using Finite Element Analysis (FEA) according to the edge type of the ceramic friction material. The main design variables include four edge types, namely, general, camber, round and taper types. The results confirm that the modified edge types (camber, round and taper type) reduced the stress and deformation which, in turn, improved the friction behavior.

1. Introduction

The bearing support transfers the loads from the superstructure down to the substructure stably. Early bearing supports were made up of steel or reinforced concrete. With the advancement of technology, the types of bearing supports diversified with the appearance of pendulum bearing support, disk bearing support, elastic bearing support, pot bearing support, etc. [1,2,3,4,5,6,7]. Among them, conventional bearing supports have relatively high vertical load bearing capacity and medium-high to medium horizontal load bearing capacity. The traditional bearing support basically consists of an upper bearing plate, a friction material, and a lower bearing plate as shown in Figure 1.
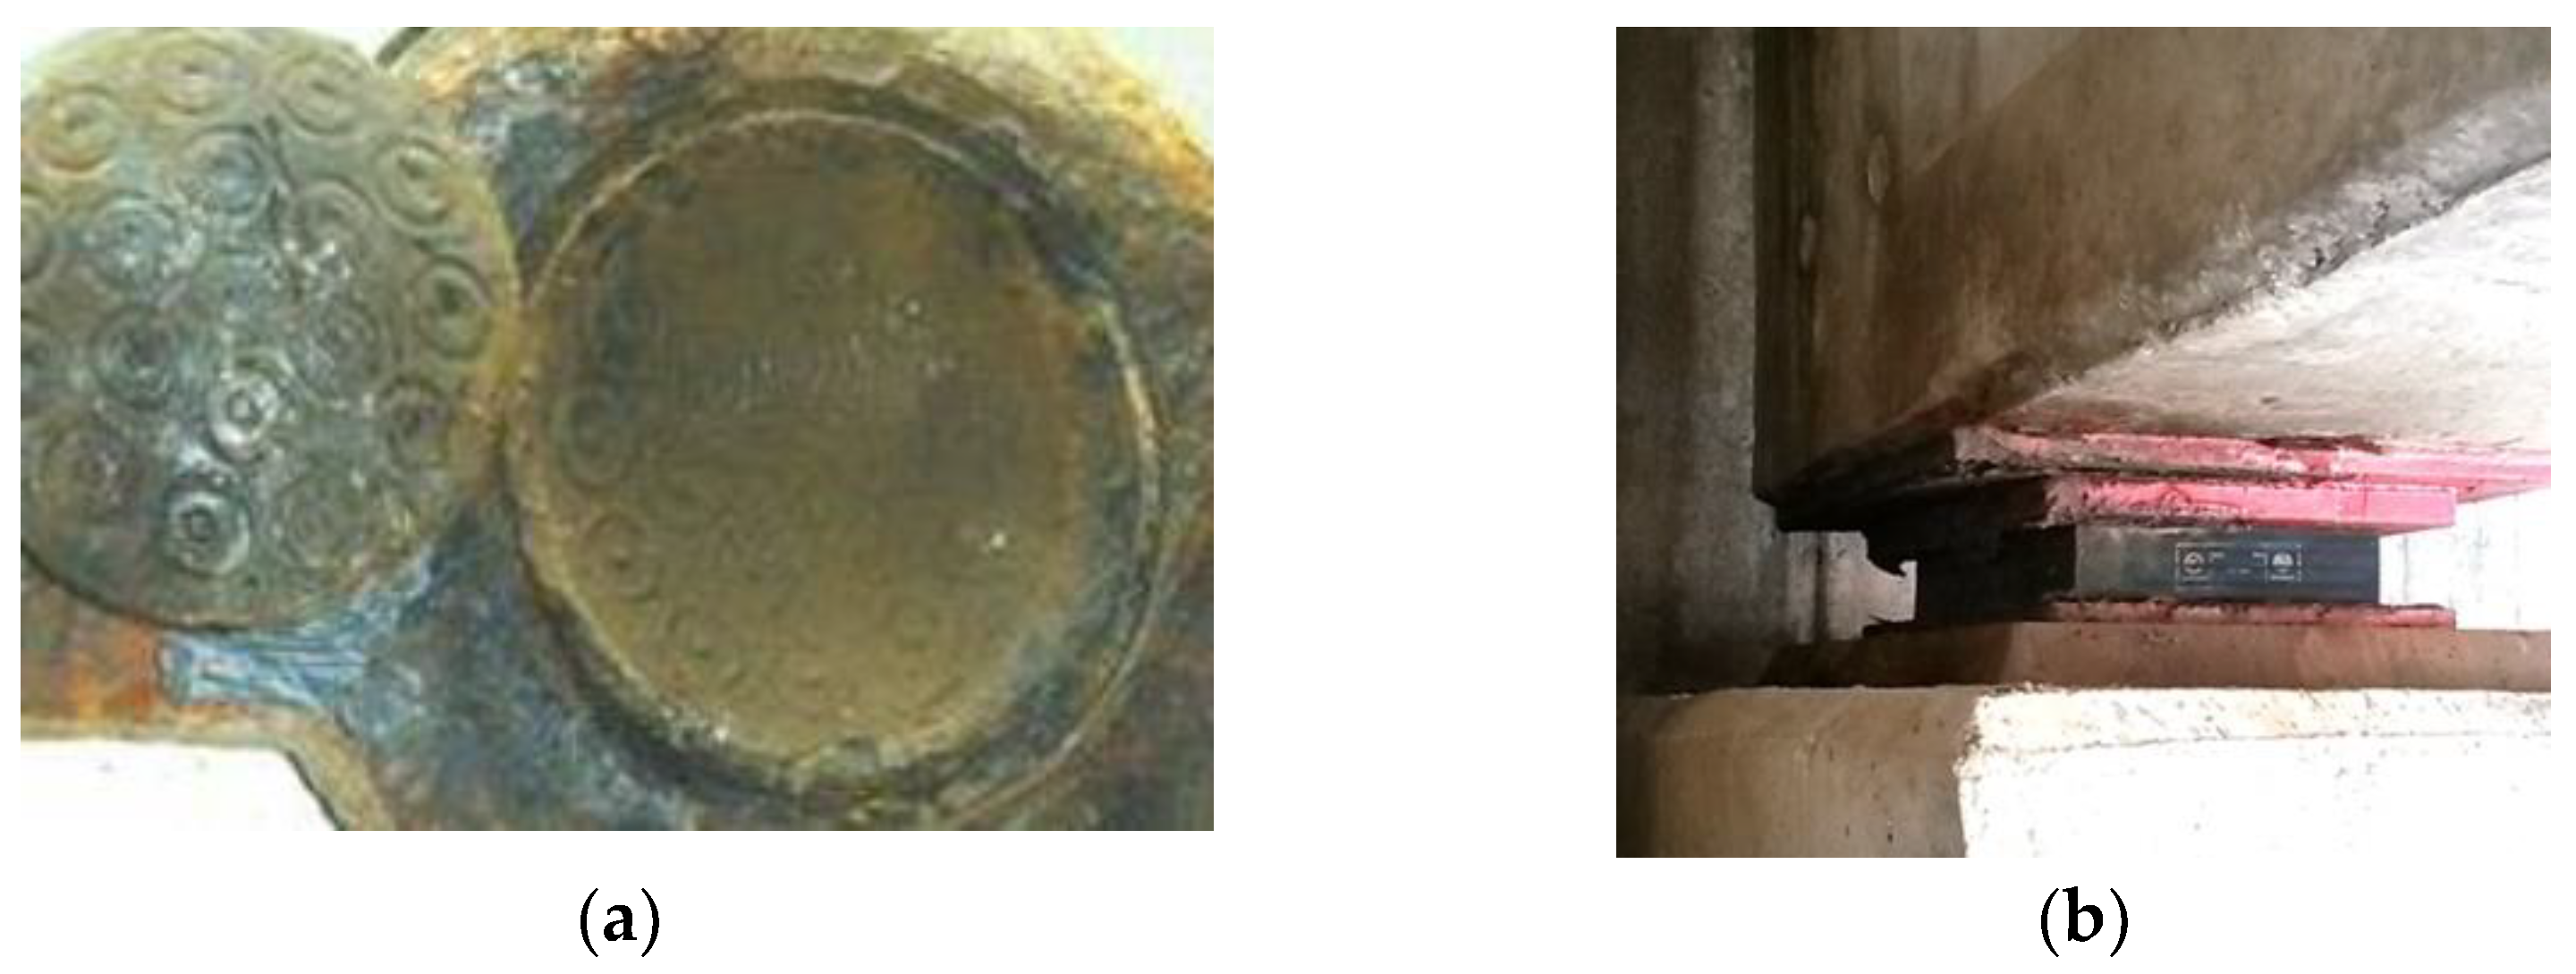
A friction material should have low friction coefficient to accommodate horizontal and rotational displacement caused by external forces such as vehicle, temperature, wind load, etc. [8]. If friction coefficient of the friction material is not maintained in a low state, it will cause serious damage to a super structure, which will lead to a decrease in the performance of structures. In general, the durability of a bridge is considered to be about 50 years, but the durability of an existing spherical bearing support is about 5 years, which is about 1/10 of the durability of the bridge. The durability period indicates the time of occurrence of defects, and the replacement period of the general bridge support is about 15 years. The biggest cause of defect occurrence is the amount of wear and deformation of a friction material accommodating displacements occurring in a bearing support. A commonly used bearing support was a high-strength brass spherical bearing supports by inserting graphite and molybdenum, which are non-fueled lubricants, into spherical high-power brass. However, changes in the price of a bearing support depending on changes in copper prices represent a problem, and the longer the period of use, the less function of a friction material. In particular, since this type of a support is composed of contact between the metal surface and the metal surface as shown in Figure 2, integration occurring due to rust generation is a problem.
To overcome these problems, the current friction materials in most bearing supports are engineering plastic (EP), ultra-high molecular weight polyethylene (UHMWPE) and polytetrafluoroethylene (PTFE). Through the analysis of the high-speed railway PSC box bridge, Oh et al. [9] selected a 40 m simple span and a two-span continuous bridge as representative types and reviewed the travel distance by live load by applying PTFE. The distance traveled by live load was considered as a major factor in EN1337-2 [10], but the accumulated distance by live load for one year was 145 m, significantly exceeding 10 m by temperature load.
Recently, PTFE has been replaced by EP due to the excellent properties of EP and UHMWPE [11,12,13,14]. Even if EP develops relatively higher friction coefficient than that of PTFE, it offers higher durability and allowable bearing resistance. Notably, a long-term friction test showed that the sliding distance of EP is 2 to 5 times longer than that of PTFE [15] with a 3 times higher friction coefficient [16,17,18,19,20]. Such types of friction materials are lubricated to make smoother behavior between upper and lower bearing plates. However, the longer the service period of structures, the lower the lubrication performance of friction materials due to the loss of lubricant or deformation of friction materials. Any damage of the friction material can degrade the structural performance of structures. In such case, the entire bearing support must be replaced since the friction material cannot be replaced separately, which translates into an increased maintenance cost and an increased life-cycle cost of the structures.
In order to revise the problems of PTFE and EP, various studies on friction materials using new materials are being conducted. Lee et al. [21] evaluated friction coefficient by vertical load and the repeated shear load with the double concave friction pendulum type seismic device to which a new friction material is applied. Kim [22] studied that tensile specimens were produced for polyamide 12 materials, which are polymer materials, and polyamide 12 materials, which are reinforced with glass beads. The characteristic results according to the direction of specimen production and tensile test temperature were compared and analyzed.
Jae [23] introduced the prediction and analysis of the anisotropic behavior of materials according to various reinforcing agents of engineering plastic. In addition, engineering plastics are manufactured through injection molds, and since the cage requires a complicated shape with high precision, the injection method for the bearing cage was analyzed as a finite element to identify factors affecting the surface, and various problems such as deformation, bending, torsion, etc. [24].
However, commonly used friction materials for bearing supports are insufficient to deal with friction material wear and damage caused by the cumulative travel distance and dynamic behavior of bearing supports depending on increased vehicle speed and traffic. Therefore, a demand of a new friction material with high compressive force, durability, and safety has increased. Ceramic can be applied as a substitute for the problems of the aforementioned materials. Ceramic has seen its application expanded to various fields. Notably, numerous studies tried to apply ceramic to bridge structures including railway bridges for its characteristics such as small deformation and semi-permanency. Accordingly, dedicated structural materials, elements, and construction methods are rapidly developing [25]. Improving the friction material is thus necessary. One promising improvement method is to use a ceramic material instead of PTFE as friction material in the bearing supports. The ceramic material develops high hardness, strength, and low friction coefficient by adjusting the surface illuminance. In addition, the ceramic hardly deforms even if it is used for a long time. However, there is no research case applying a friction material as ceramic for a bearing support yet.
As a preliminary step prior to the implementation of actual friction test, this study applies for the very first time ceramic as friction material and evaluates the frictional behavior of the bearing support using finite element analysis (FEA). Comparing the two materials, that are steel and ceramic, in contact inside the loaded bearing support, steel will experience larger deformation than ceramic because ceramic materials have stronger hardness than steel. Therefore, various shapes of the ceramic friction material are analyzed to identify the shape minimizing the deformation of the two materials while providing stable frictional behavior.

2. Preliminary Friction Test for the Ceramic Friction Material

As the very first attempt to replace PTFE with a ceramic as a friction material in bearing supports, the preliminary friction test intends to compare the experimental and analytical frictional behaviors of the ceramic friction material.

2.1. Test Setup and Material Properties

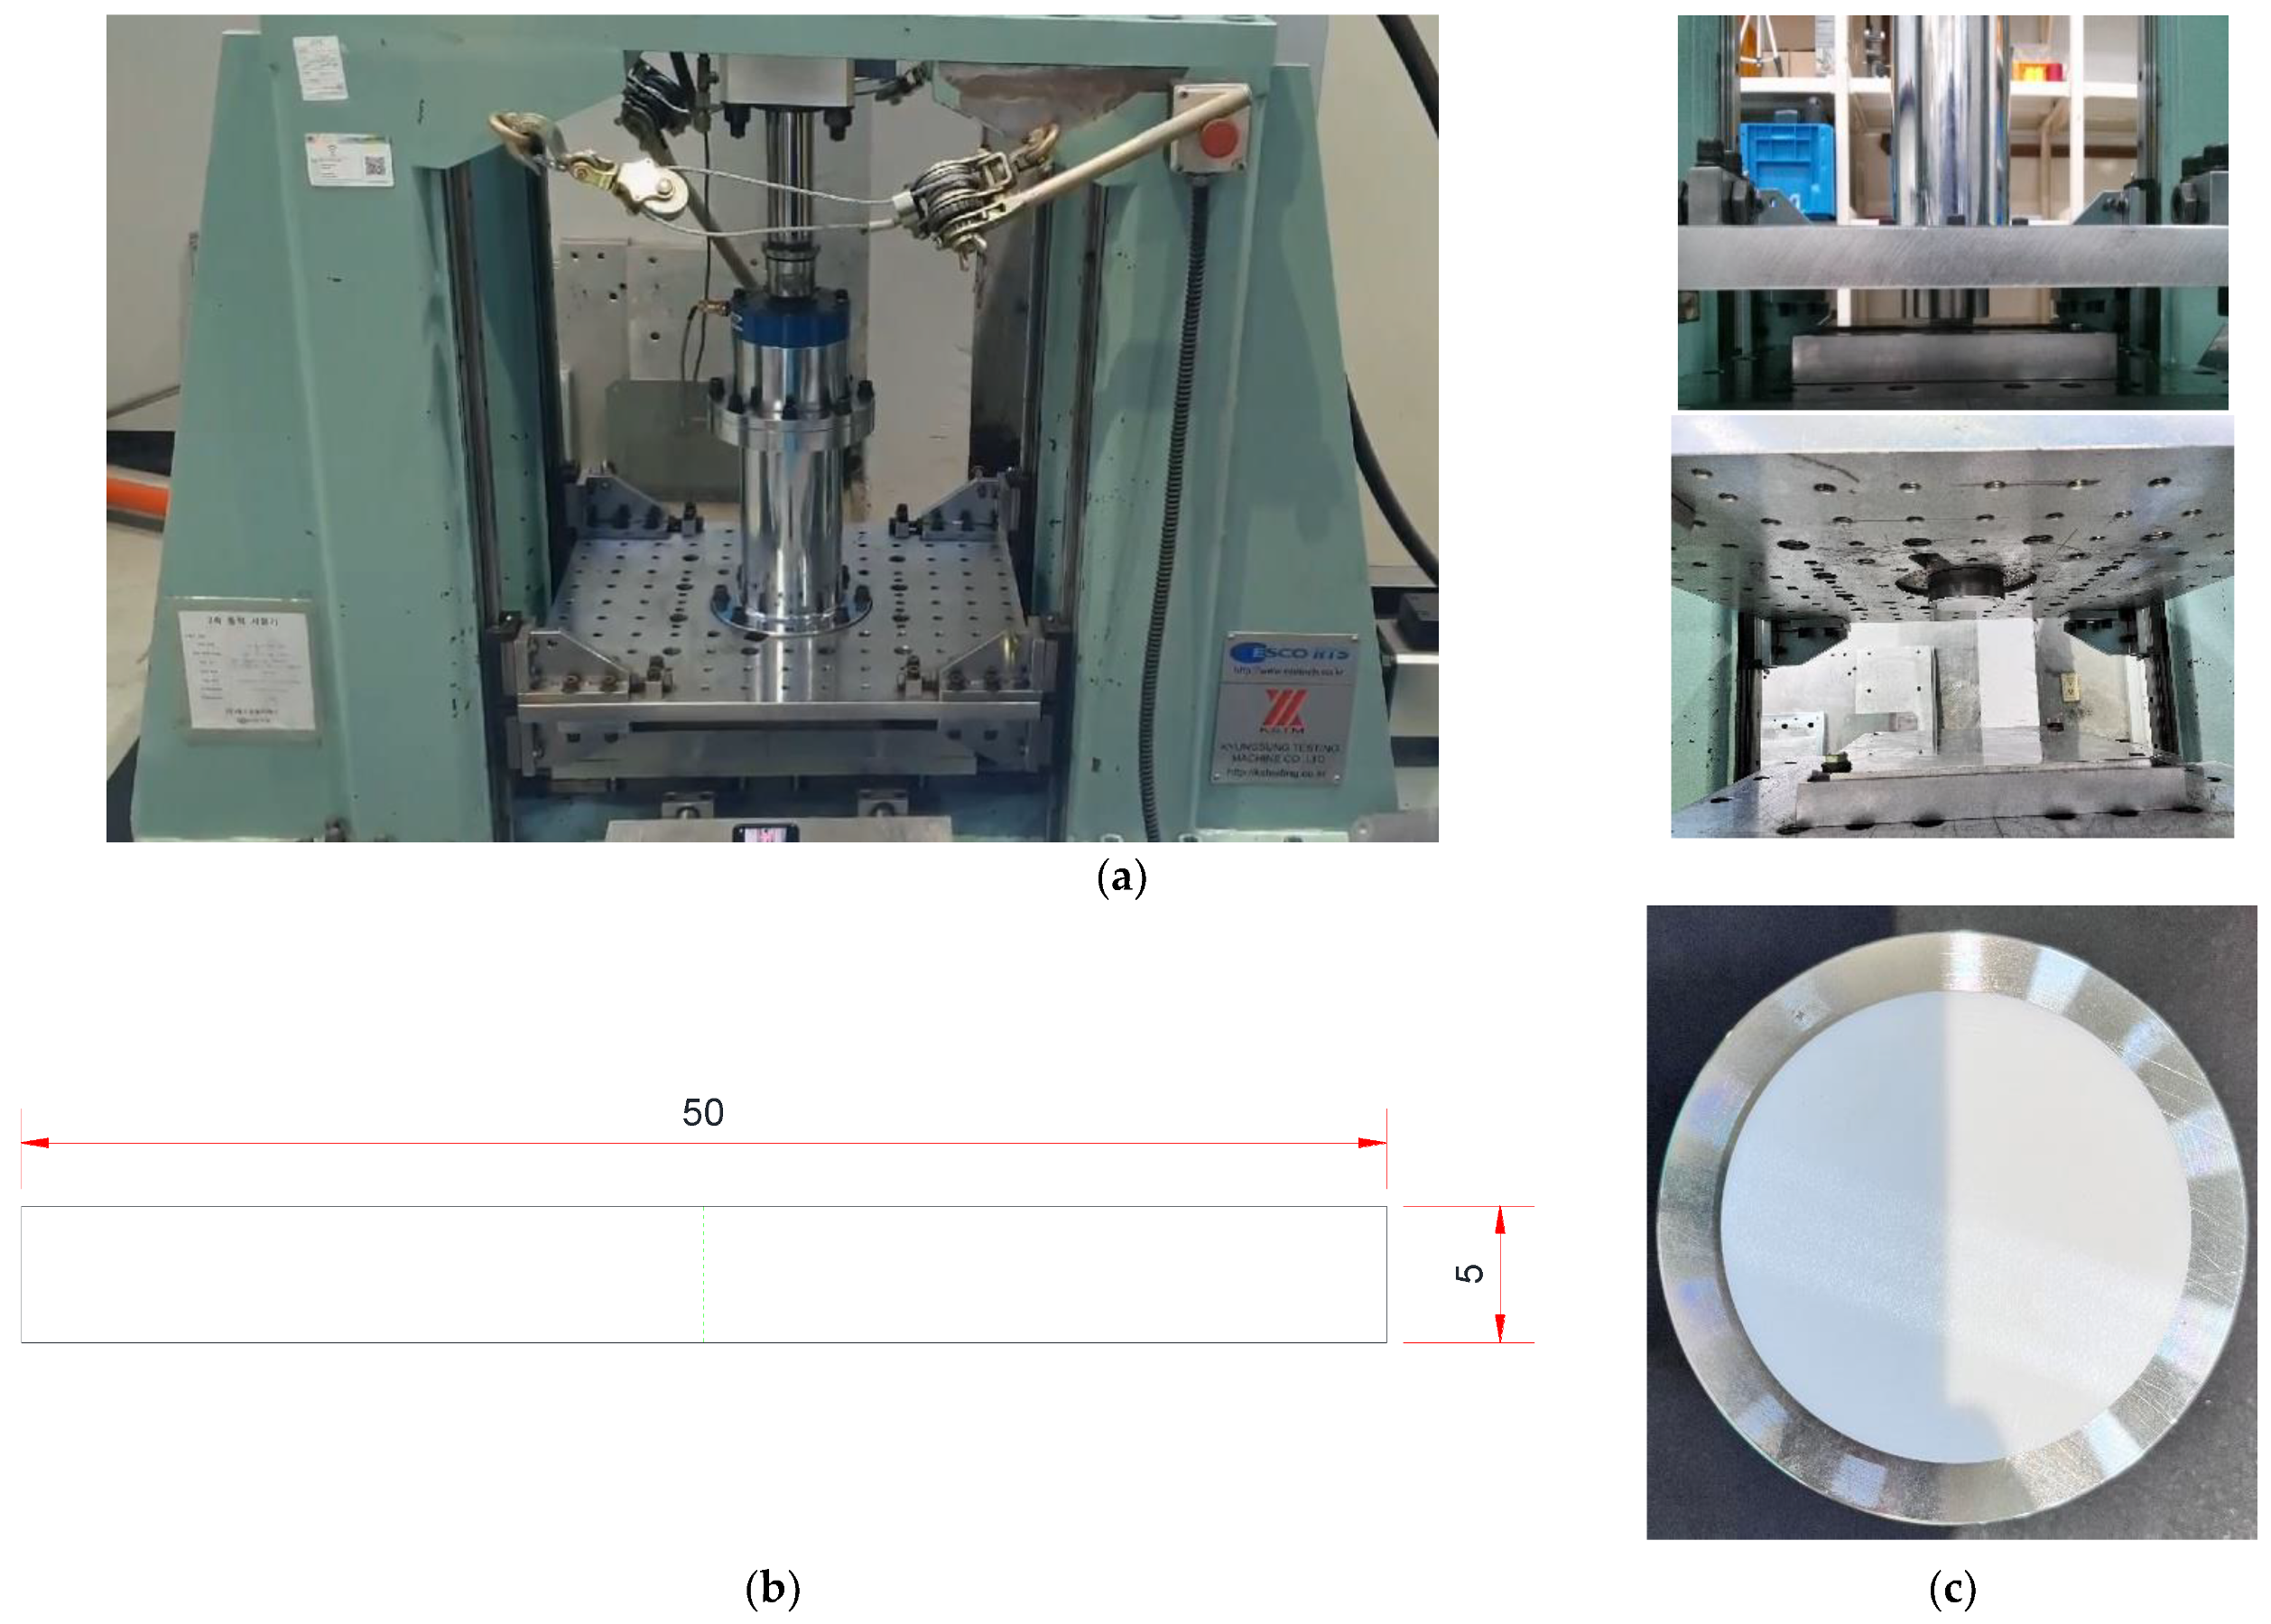
The adopted friction test machine shown in Figure 3 develops maximum vertical and horizontal loading capacities of 100 kN and 50 kN, respectively, and allows measurement of the displacement and load acting on the specimens. The specifications of the test machine are listed in Table 1. The ceramic friction material specimen was designed for evaluating the effect of frictional behavior with a thickness of 5 mm and a diameter of 50 mm. The specimen was attached to the bearing jig of the vertical actuator and surmounted by a 200 × 200 mm and 18 mm thick stainless-steel sliding plate. The friction test setup is shown in Figure 2.
The ceramic and a stainless-steel [26] used in specimens and sliding plate, respectively, were investigated using a mill test. Especially, because the friction material has to secure low friction, low deformation, and high compressive strength, the ceramic is used with Zirconia (ZnO2), which has the highest compressive strength among various ceramics, and satisfies the essential conditions. The results are listed in Table 2. The Young’s modulus for ceramic and stainless-steel were almost the same, 220 GPa and 210 GPa, respectively, while Poisson’s ratio was also the same, 0.297 and 0.3, respectively. In addition, the compressive strength of ceramic was 3997 MPa, and the tensile strength of stainless-steel was 656 MPa. The biggest difference between the two materials is hardness, which was 1100 and 500 for ceramic and stainless-steel investigated using Vickers hardness, respectively. The roughness ( R a ) for ceramic is applied to 0.8, which can control a friction coefficient on the surface [27,28].

2.2. Test Procedure

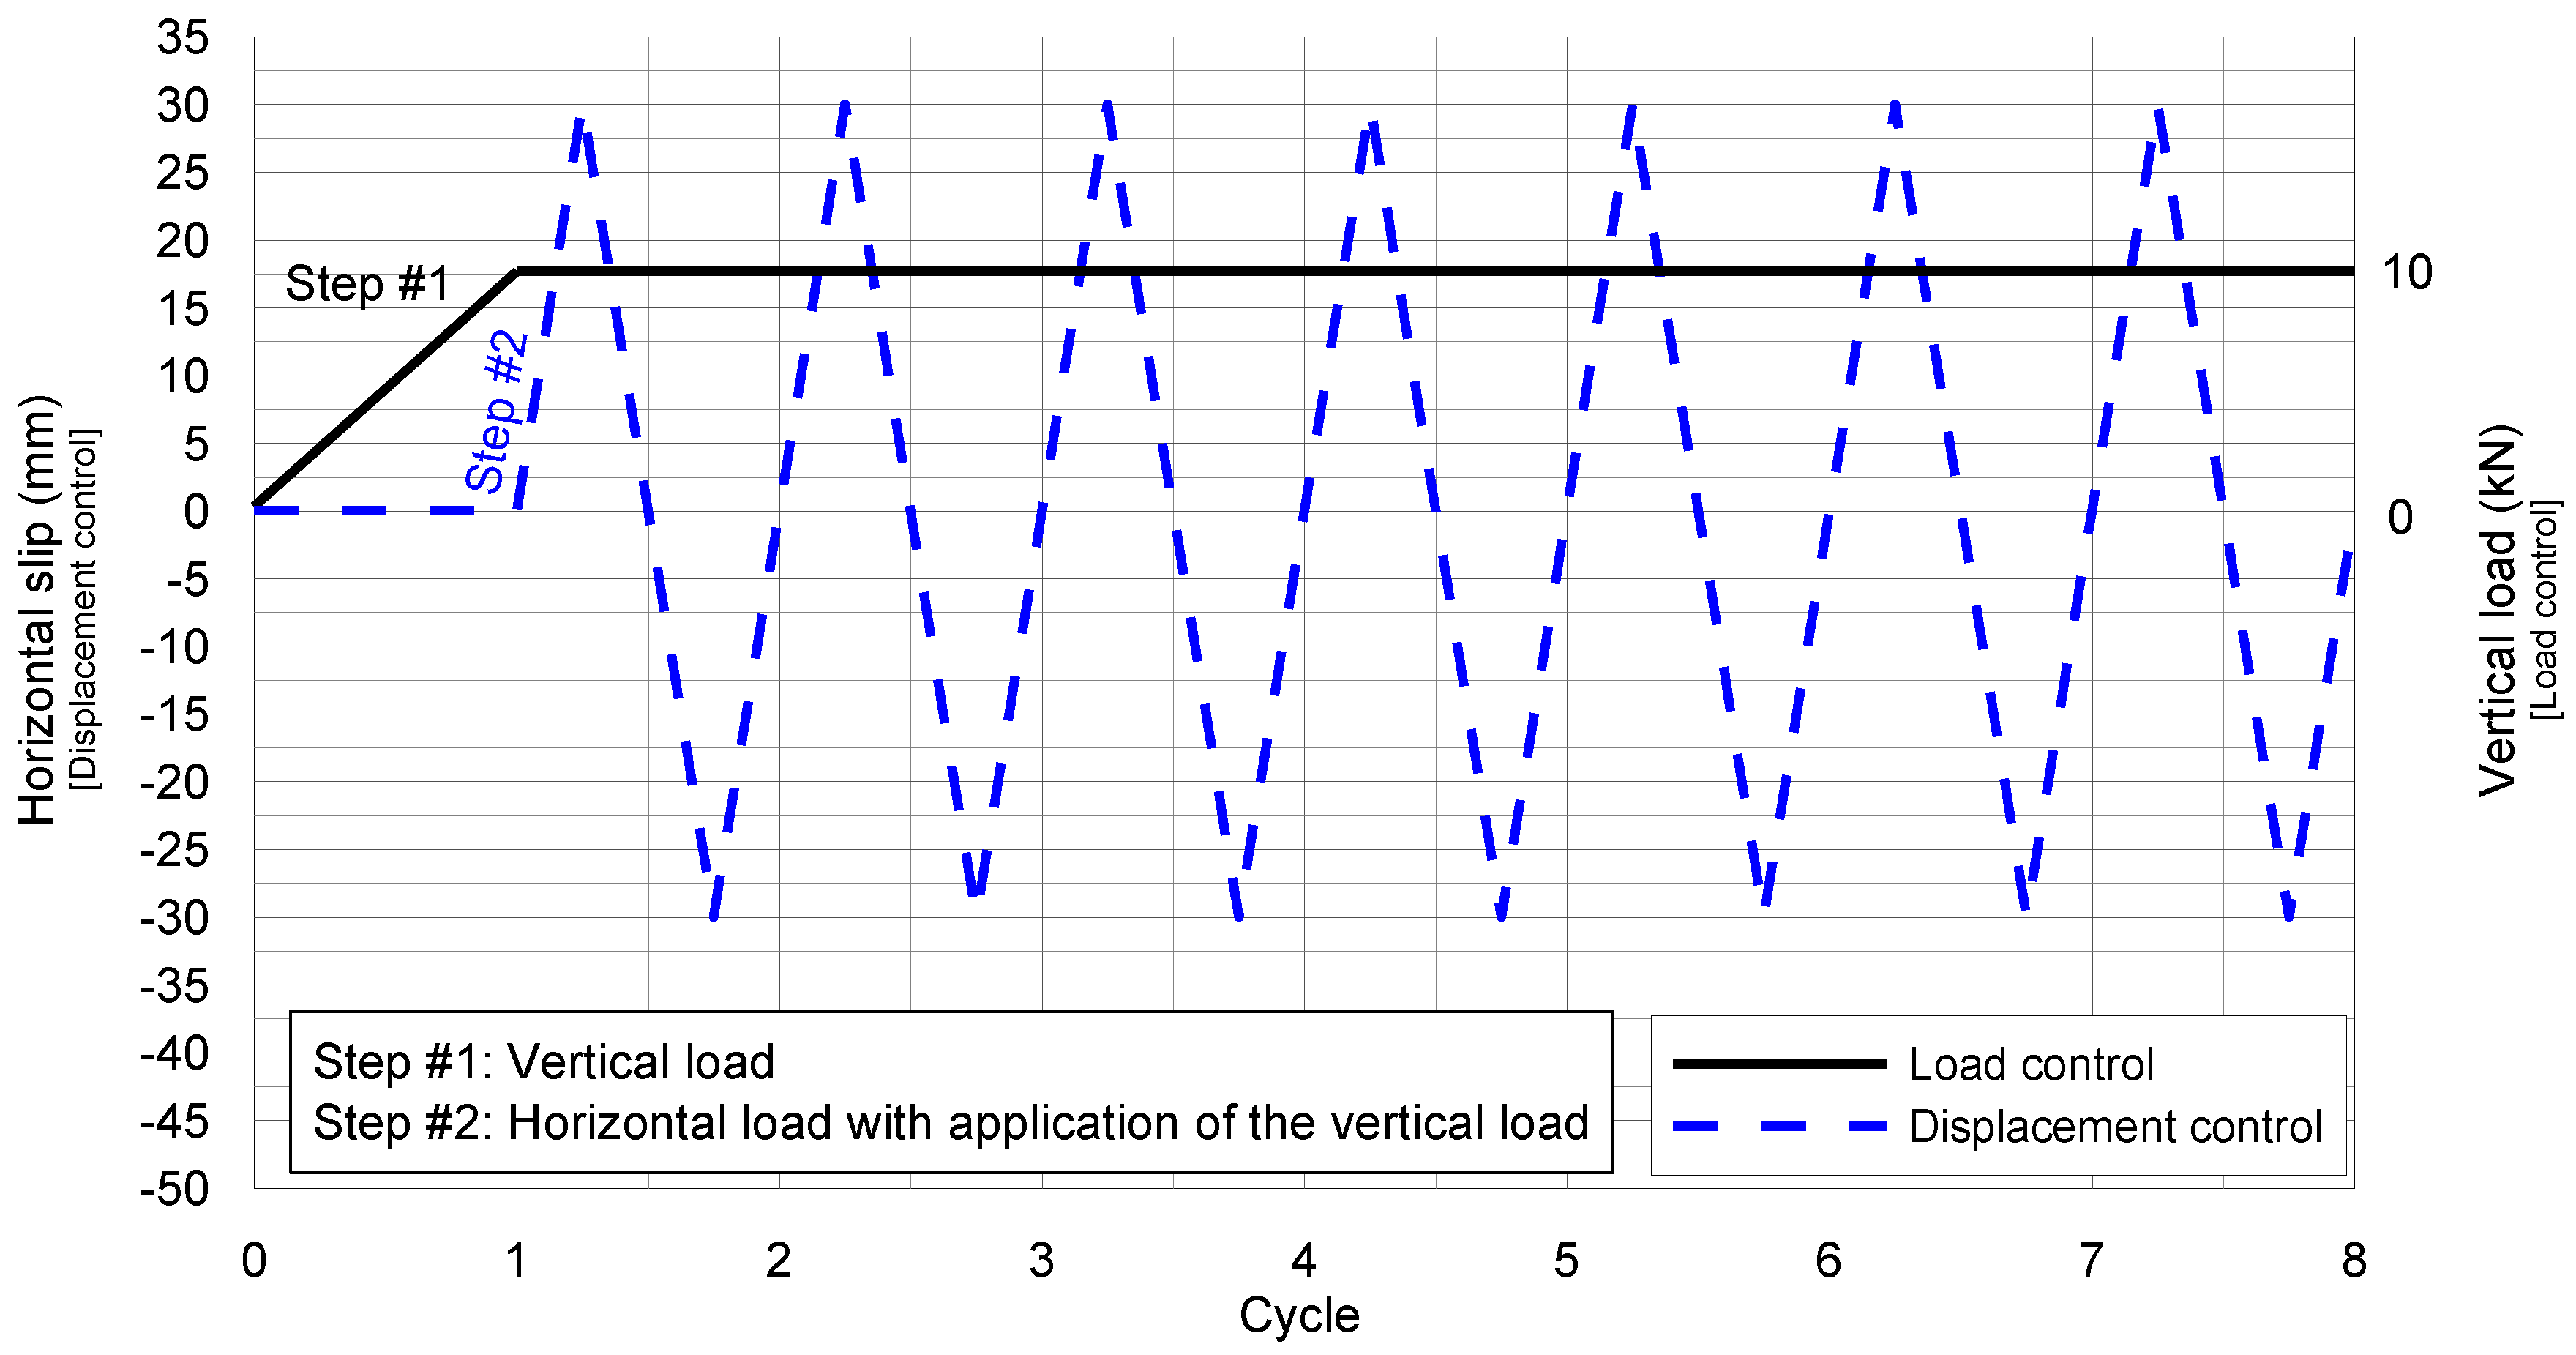
Friction test was conducted on the ceramic friction material specimen in compliance with EN 1337-2 & 7 [10,29]. Stepwise loading was executed starting with the application of the vertical load of 10 kN and the application of the horizontal load through displacement control up to 30 mm while maintaining the vertical load. In the second step, fully reversed cyclic horizontal loads at rate of 0.4 mm/s were applied by repeating the ±30 mm displacement cycle seven times. The loading protocol is illustrated in Figure 4.

2.3. Test Results

The friction strength and horizontal displacement due to the cyclic loads are investigated, and the deformation of the sliding plate is inspected visually. Figure 5 shows the load–slip curves for the friction test. The average of the maximum horizontal load (+direction) is 3.07 kN. Figure 5a indicates that the friction load increases rapidly as the ceramic moves horizontally (-direction). Slight deformation developed on the surface of the sliding plate under the application of the vertical load on the ceramic friction material. However, the ceramic friction material started to penetrate the stainless-steel sliding plate once the horizontal load was applied (Figure 5b) because the hardness of ceramic is relatively higher than that of stainless-steel. In Figure 5c, there is only a smudge on the surface of the ceramic friction material without any damage, but in Figure 5d, the penetrated spot can easily be found.
During the horizontal motion of the ceramic, its orthogonal edges create protuberances on the sliding plate and push these irregularities which accumulate the deformation. As the cyclic load is repeatedly applied in the horizontal direction, the friction load gradually decreases and converges. This is the stabilization of the deformation for the 10 kN vertical load. Based on the averaged horizontal load (+direction), a friction coefficient of 0.3 is derived and will be applied in the finite element model.

3. Finite Element Model

3.1. Test Specimens

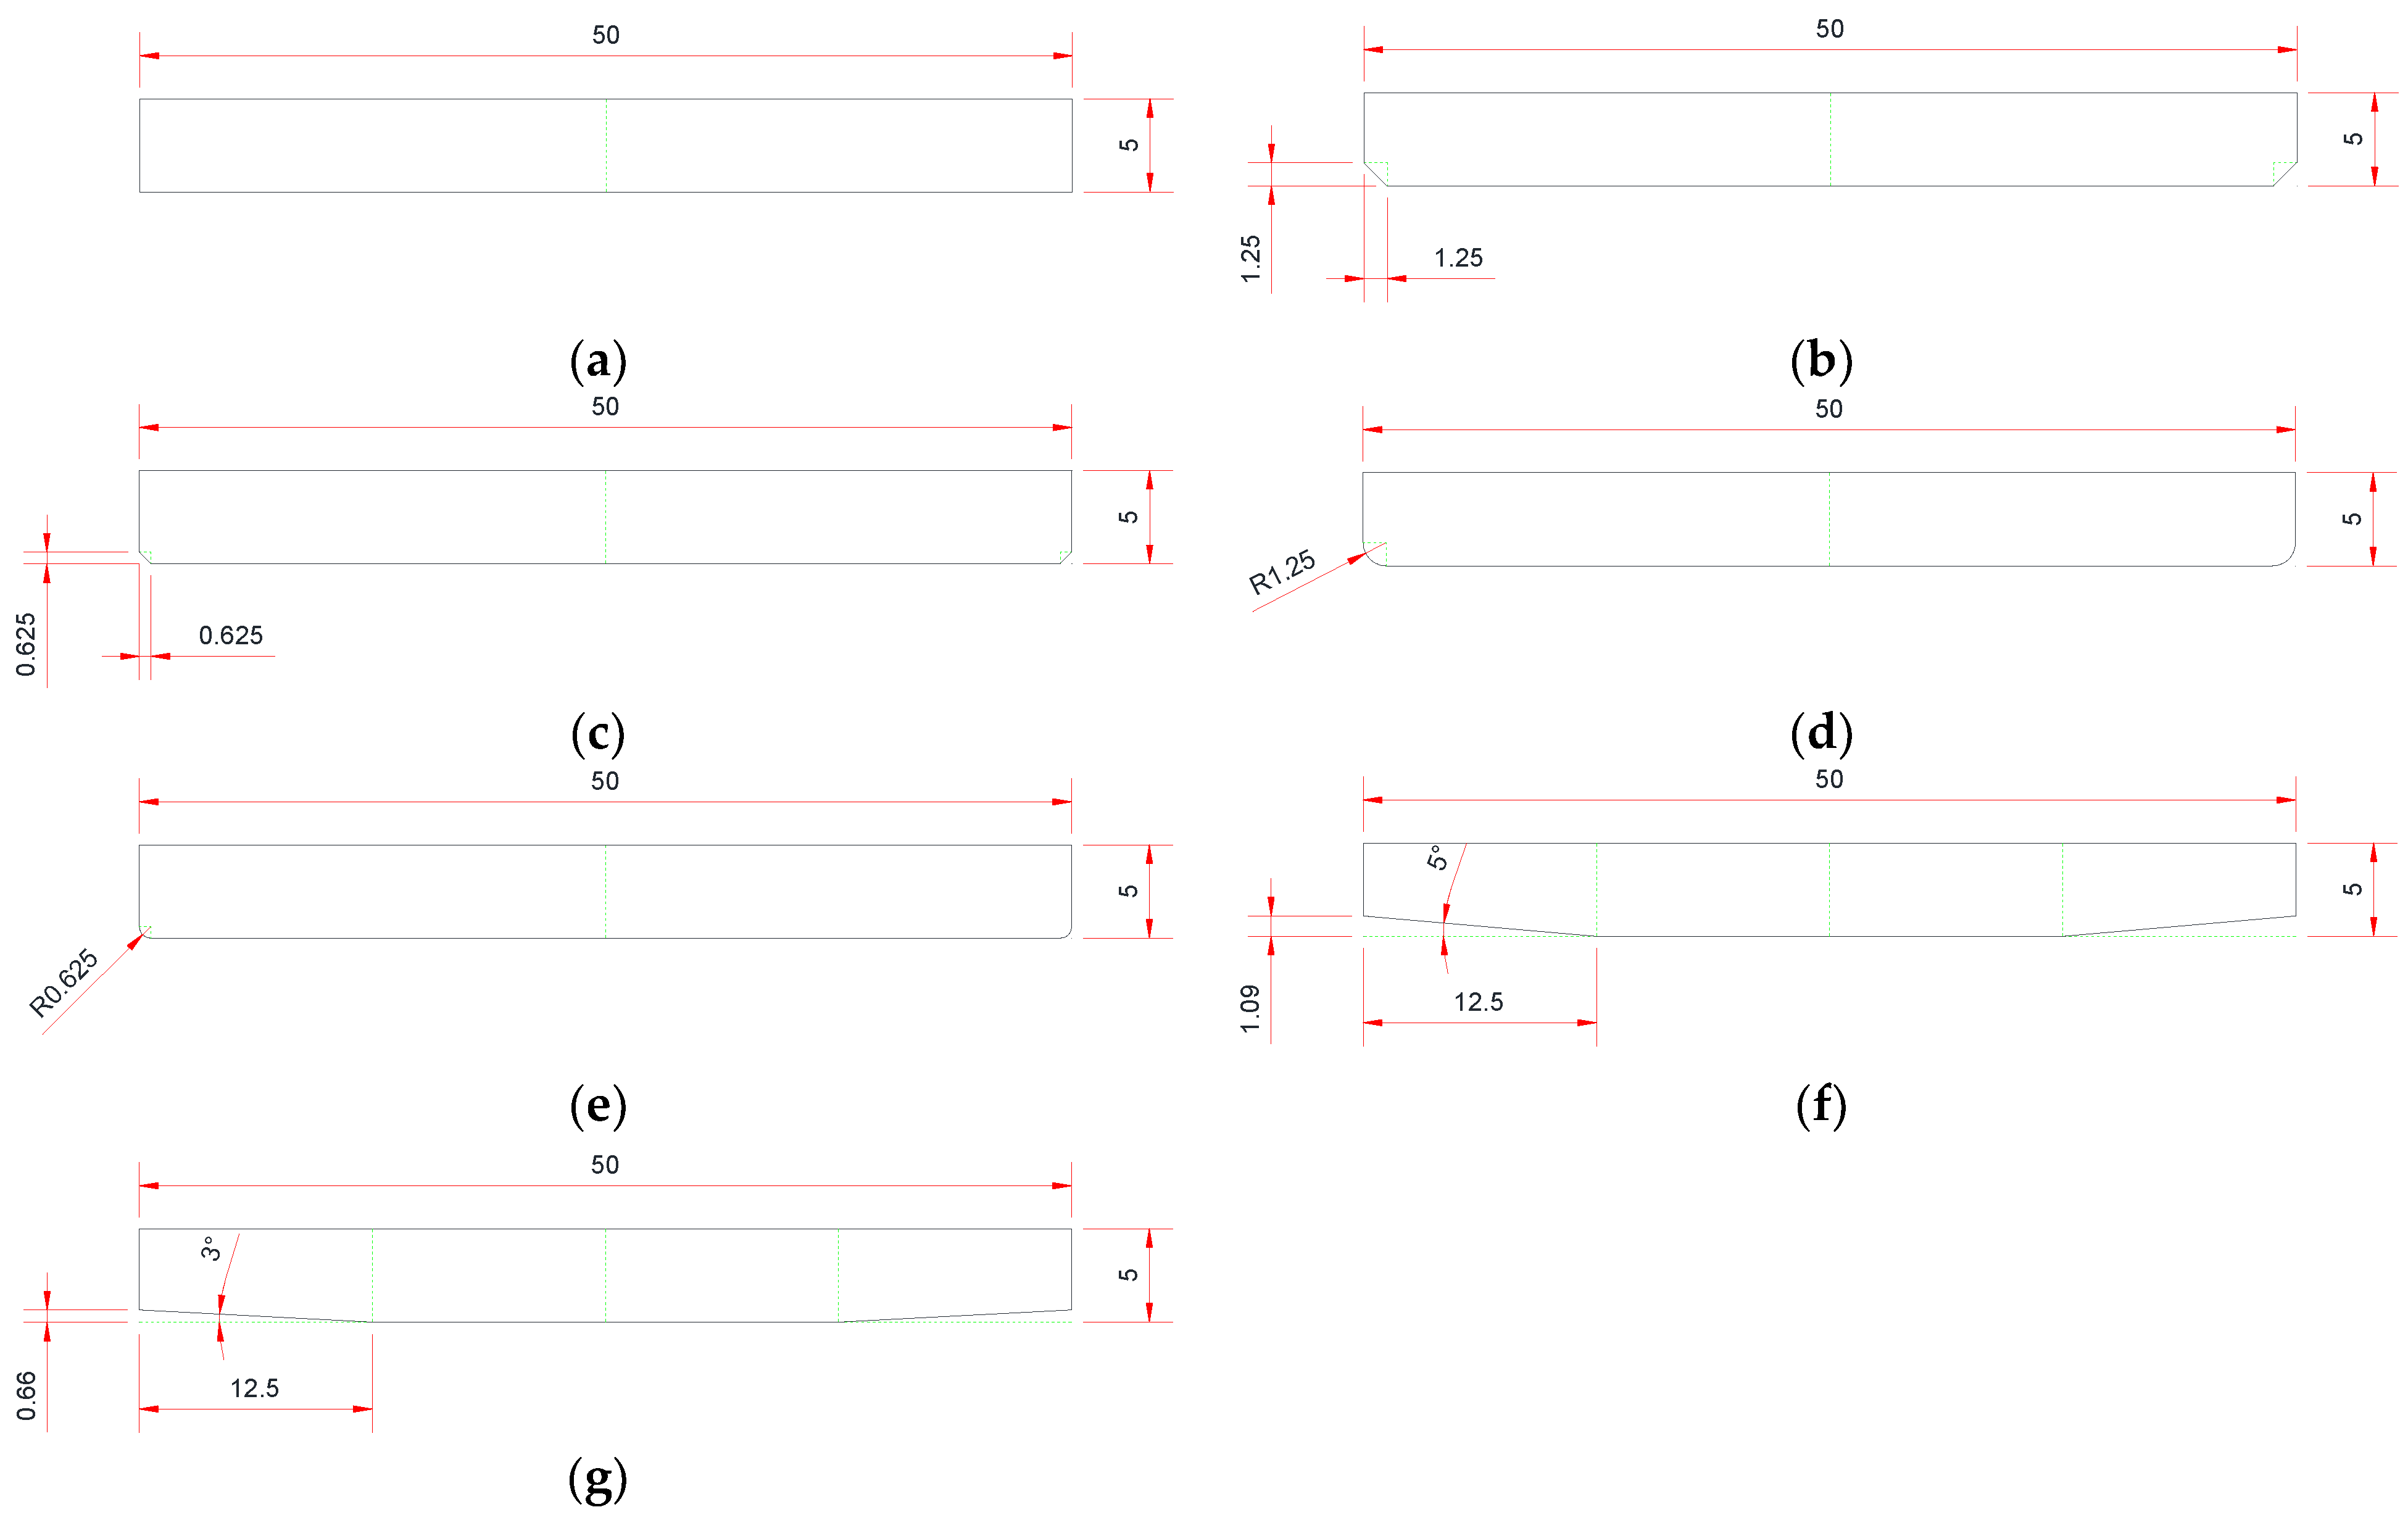
The preliminary friction test results showed that the ceramic friction material needs to be improved to prevent the occurrence of edge-induced protuberances on the sliding plate. When the ceramic friction material moves horizontally in the actual test, the protuberances on the surface of the sliding plate are flattened by contact friction. Therefore, changing the shape of the sharp edges of the ceramic into camber, round, and taper shapes modeled with ABAQUS [30] can be a simple solution to reduce such protuberances. The dimensions of each specimen are determined by adopting values of 1/4 and 1/8 for the thickness ratio in the friction material. The designation and characteristics of each specimen are listed in Table 3, and their dimensions are presented in Figure 6. The nomination of specimens was determined using the first character for each edge type, and the numbers of 1 and 2 were used according to each edge size or angle.

3.2. Analysis Method

Static or implicit method requires time-consuming computation to solve complex problems such as combining constitutive, equilibrium, and compatibility equations with nonlinear material properties, geometric shapes, and contact conditions [31]. Besides, explicit analysis has been applied for complex failure and deformation problems under different contact conditions and materials. This study evaluates the friction tests with FEA through quasi-static analysis using the dynamic explicit method [32,33,34].

3.3. Geometry and Meshing of Finite Element Model

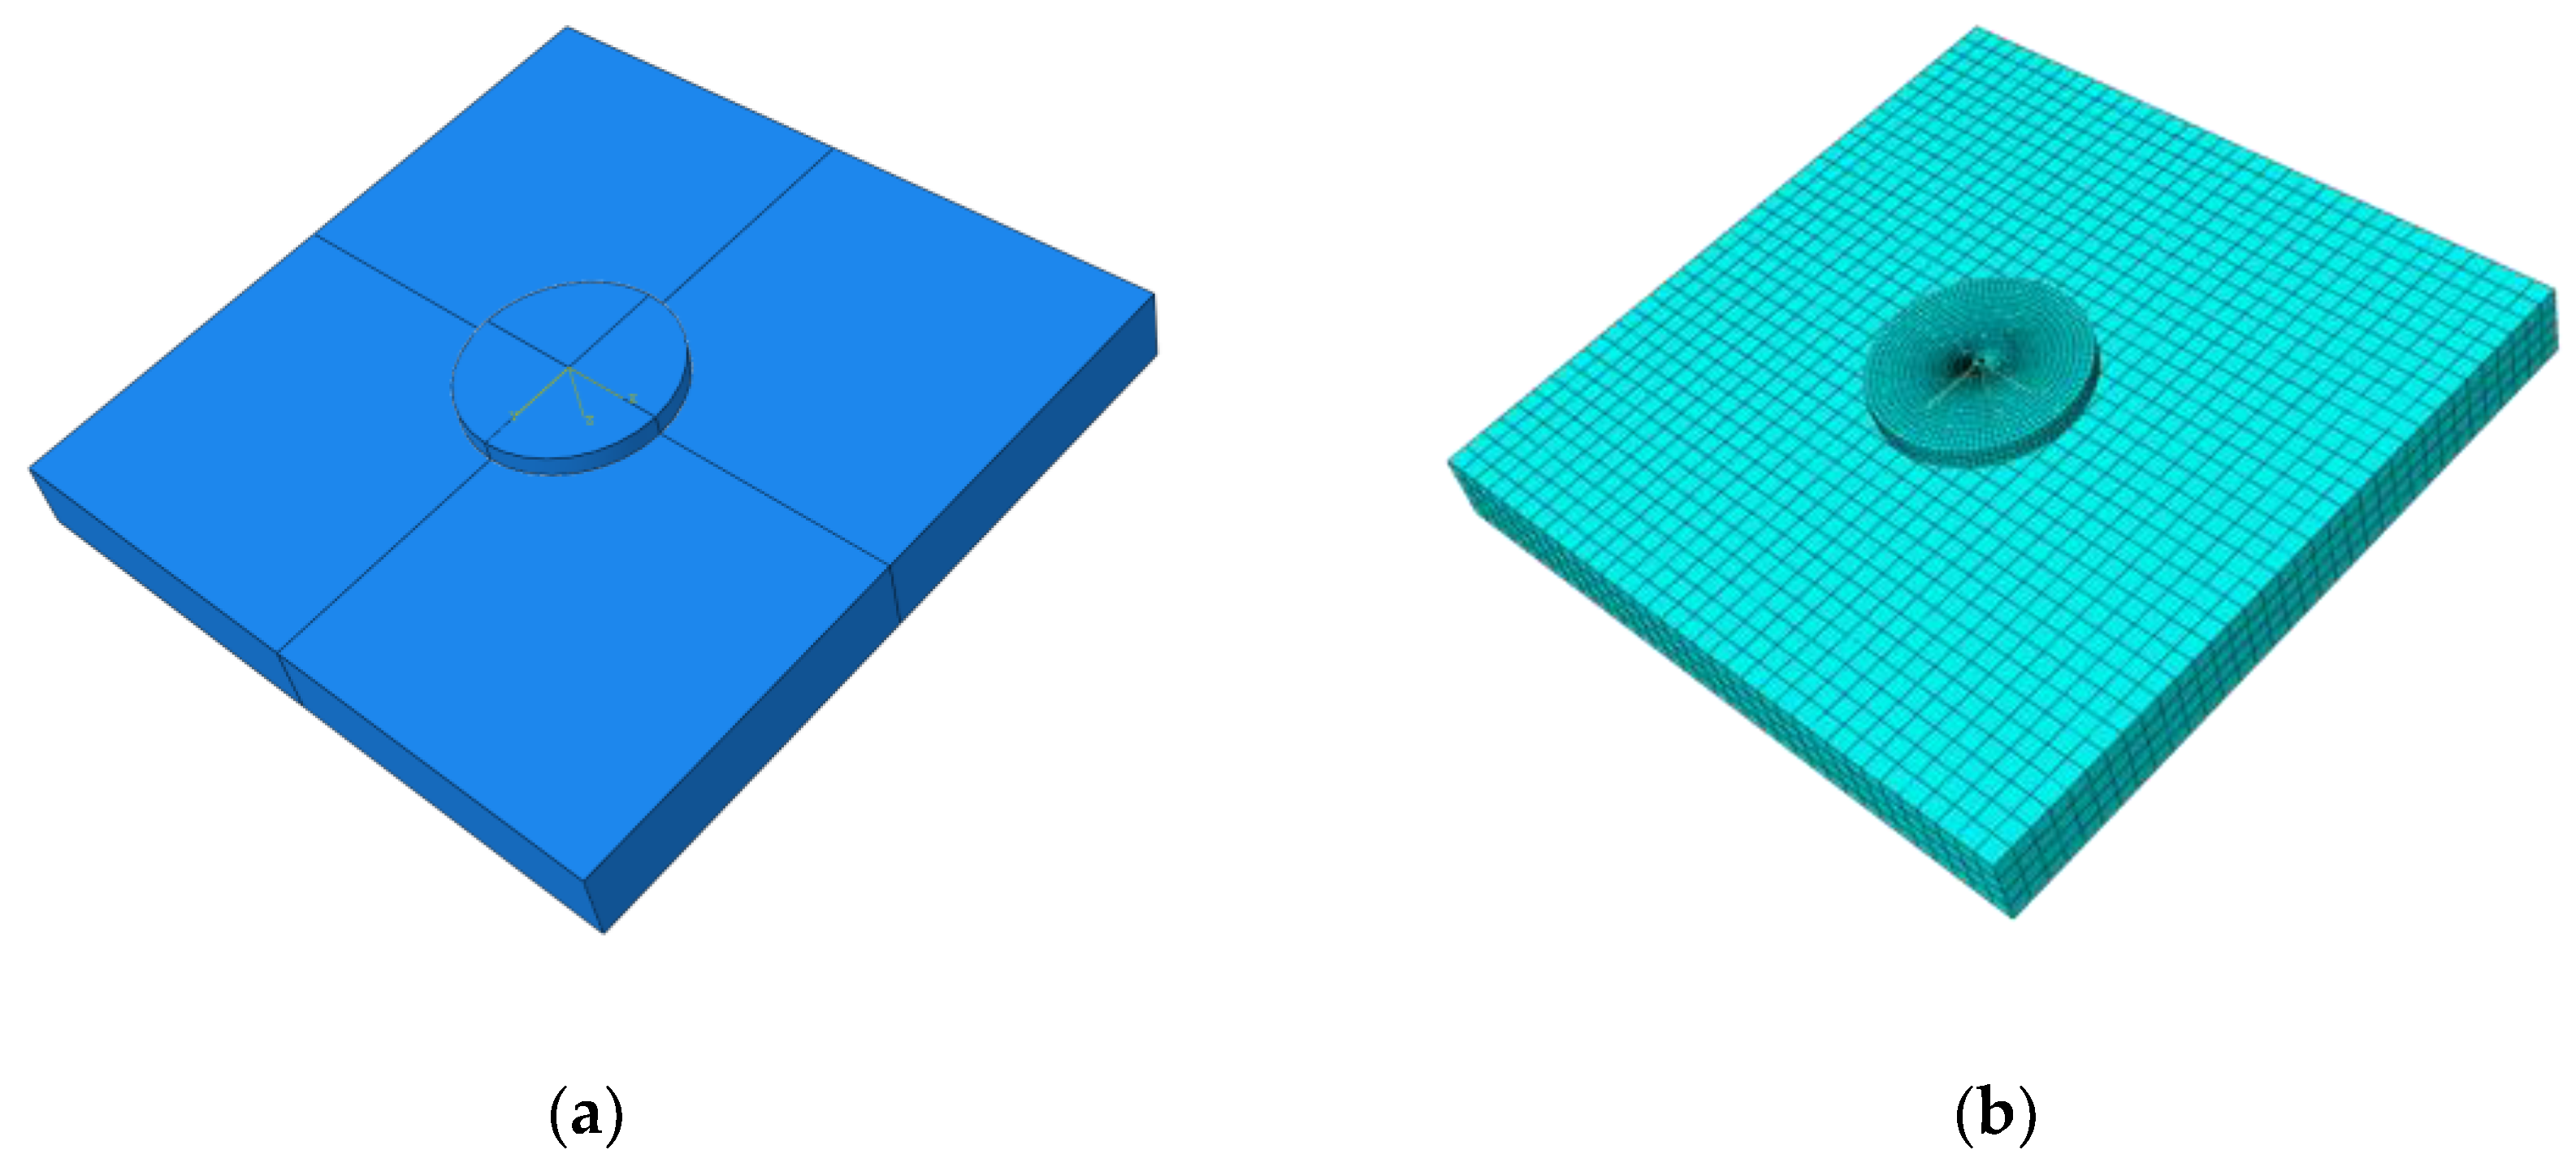
Based on the preliminary friction test, each component is built with the same dimensions. As shown in Figure 7, the components in the finite element model for the friction test are composed of a friction material and sliding plate. The whole model employs three-dimensional (3D) solid elements. In part of a ceramic friction material, a six-node wedge solid element is more effective in preventing errors due to the distortion in the element shape. The other part of a sliding plate is employed with an eight-node solid element.

3.4. Material Properties

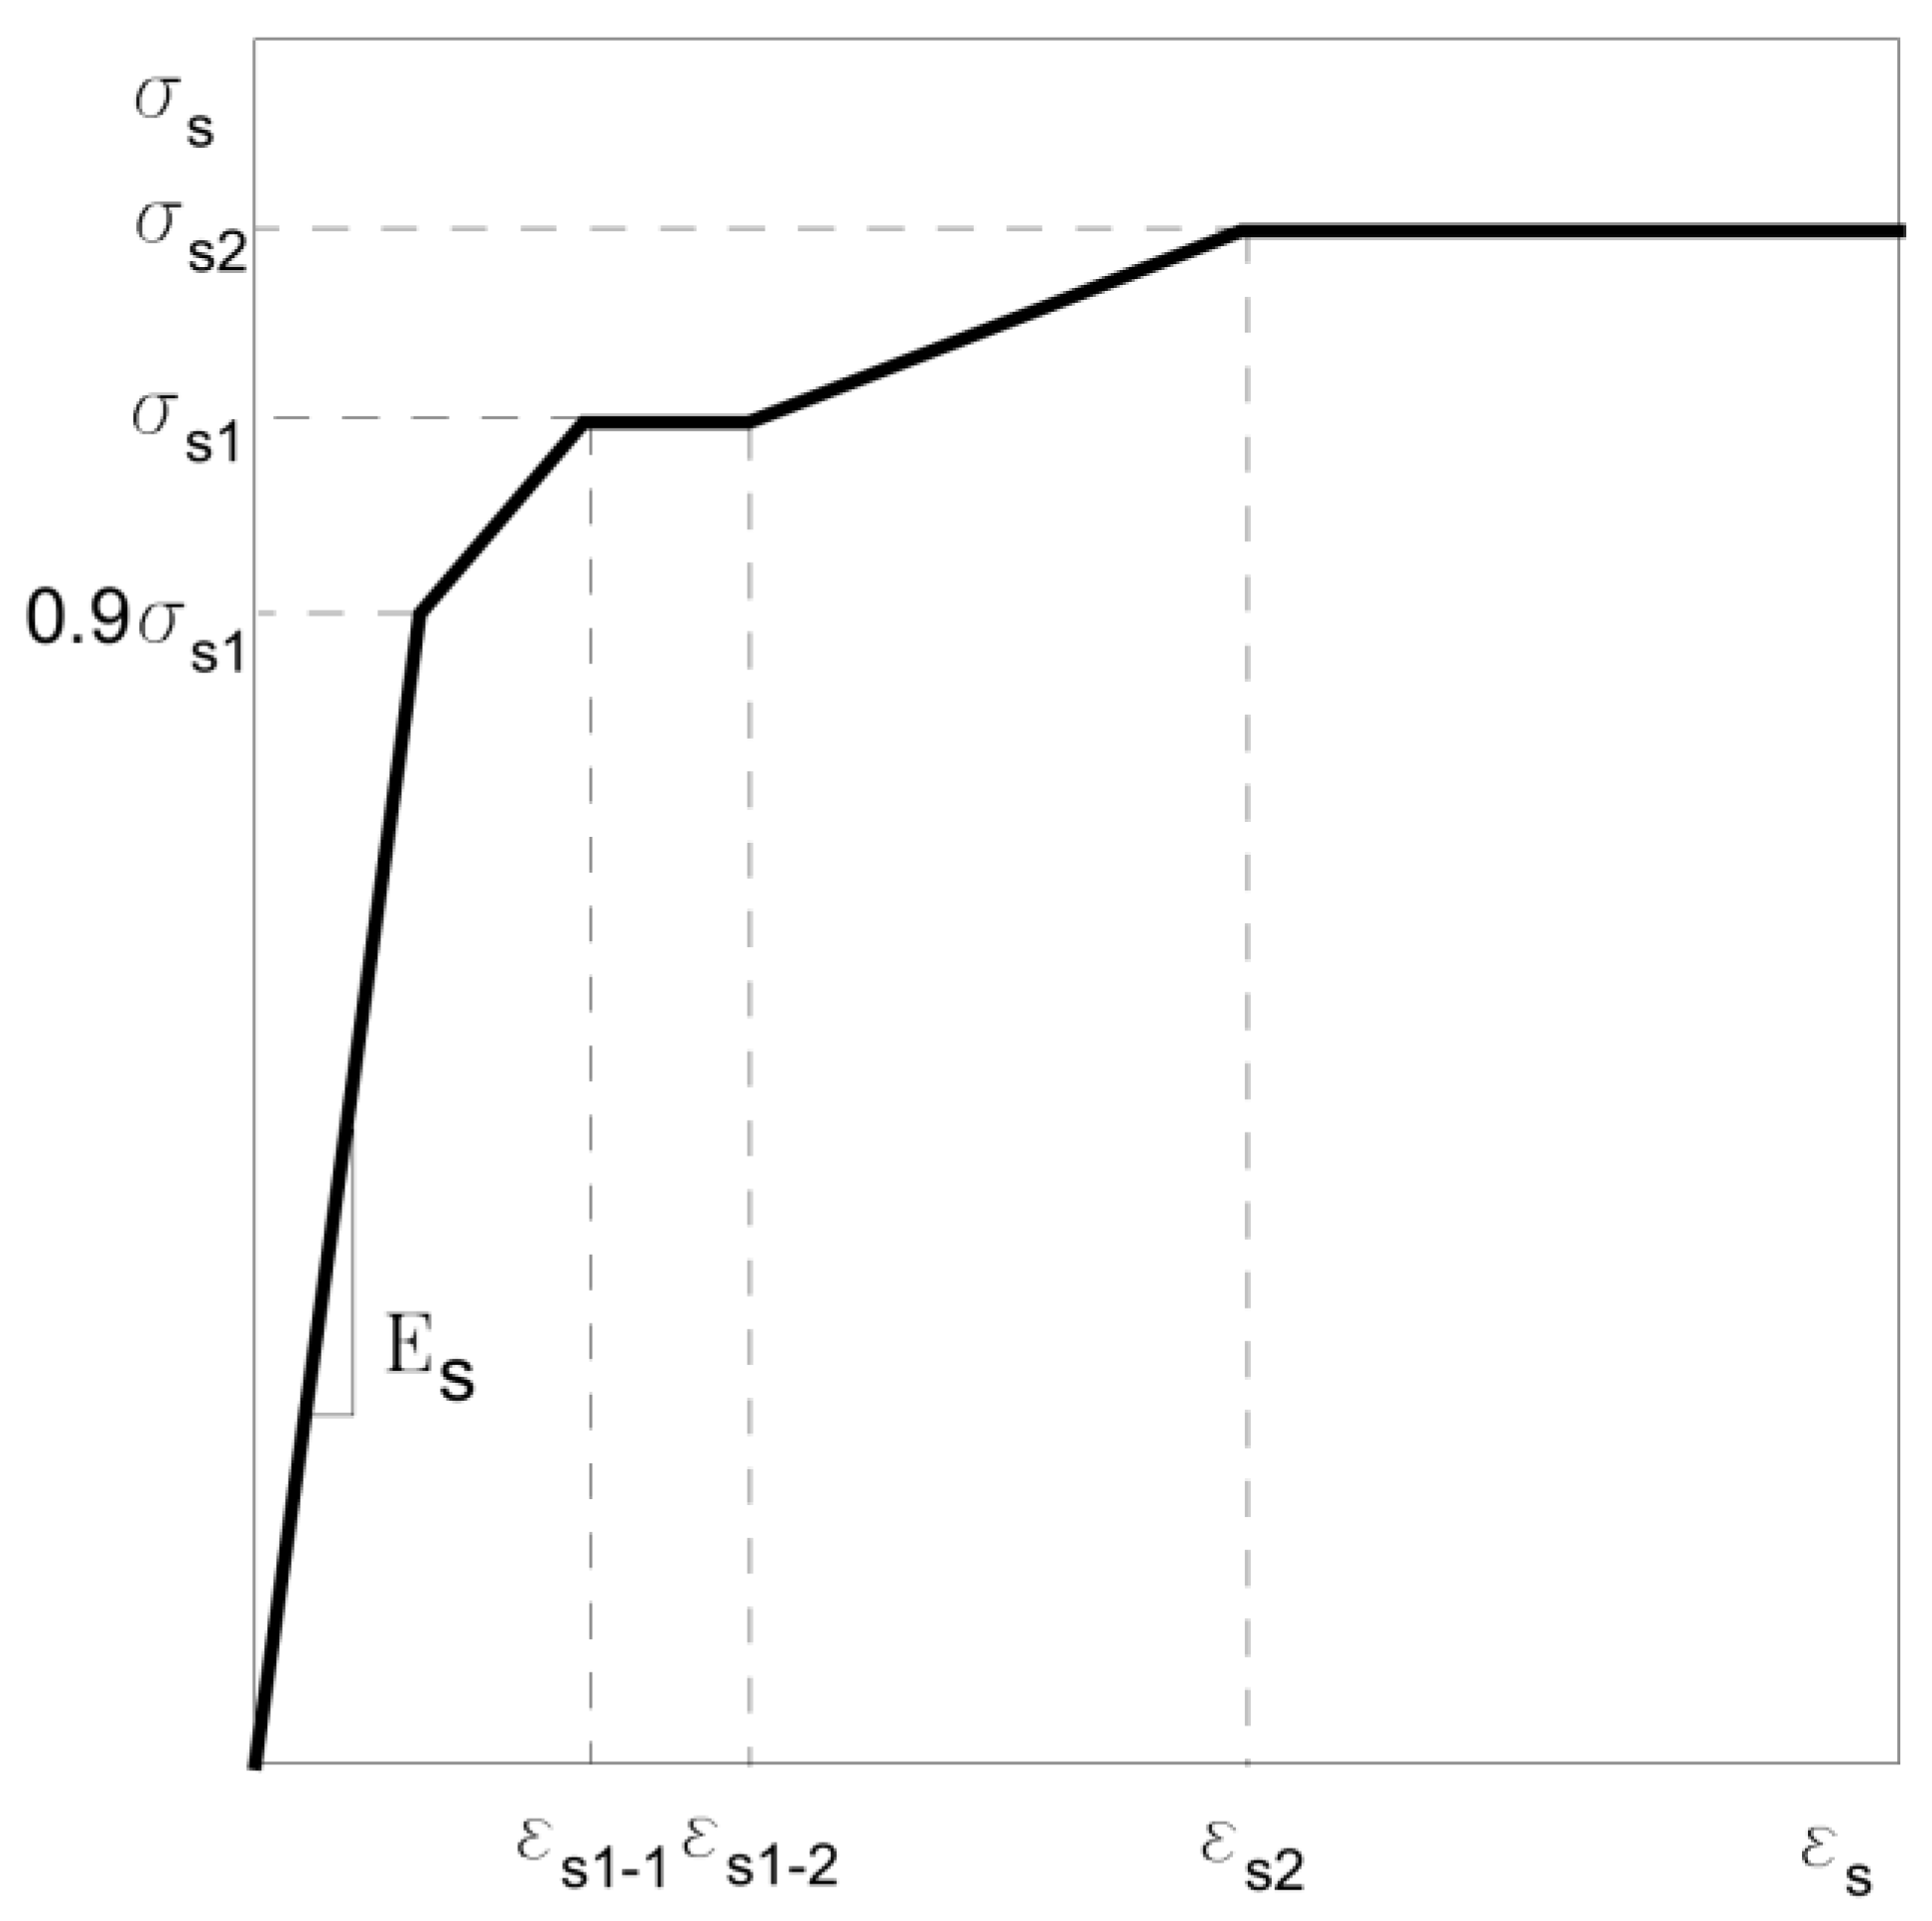
Stainless-steel is modeled as an isotropic hardening material with Poisson’s ratio of 0.3 and Young’s modulus of 190 GPa. Figure 8 shows the stress–strain relationship of the stainless-steel adopted in the FEA [35]. The parameters that define the stress–strain relationship of the materials consider the material properties of a previous study [31], i.e., σ s = 300 MPa, σ s 2 = 450 MPa, ε s 1 1 = 0.004, ε s 1 2 = 0.02, ε s 2 = 0.2, σ r 1 = 500 MPa, ε r 2 = 0.0225, and ε r 3   = 0.1.
The ceramic is modeled as an isotropic elastic material with Poisson’s ratio of 0.297 and Young’s modulus of 220 GPa based on the mill test. The ceramic material model is defined with linear conditions for conservative evaluation on the ceramic friction material, and making the model simple. The specific material properties of ceramic need to be considered, but the frictional behavior is concentrated at the sliding surfaces.

3.5. Interactions and Load Conditions

Fixed condition is applied to the sliding plate loaded by vertical and horizontal loads. The friction coefficient of 0.3 derived from the preliminary test is applied to the sliding surfaces between stainless-steel and ceramic. Because the frictional resistance between the friction material and the sliding plate affects the friction test result, an appropriate frictional condition should be considered for the bottom surface in the FEA. The loading conditions are applied stepwise. The first step applies the vertical loading on the friction material. The second step applies the horizontal load while maintaining the vertical load. Figure 9 illustrates the interactions and load conditions in the FEA model. Vertical loads of 10 kN, 30 kN, 50 kN, and 125 kN are applied. The capacity of the vertical load was 125 kN when the load was calculated based on the friction material stress value specified in EN 1337-2 & 7 [10,29]. This was set as the maximum value of the vertical load, and the other load cases were arbitrarily set to analyze the friction behavior according to the vertical loads. The horizontal load is applied through displacement control at loading rate of 0.4 mm/s.

4. Numerical Results

4.1. Verification of Finite Element Model

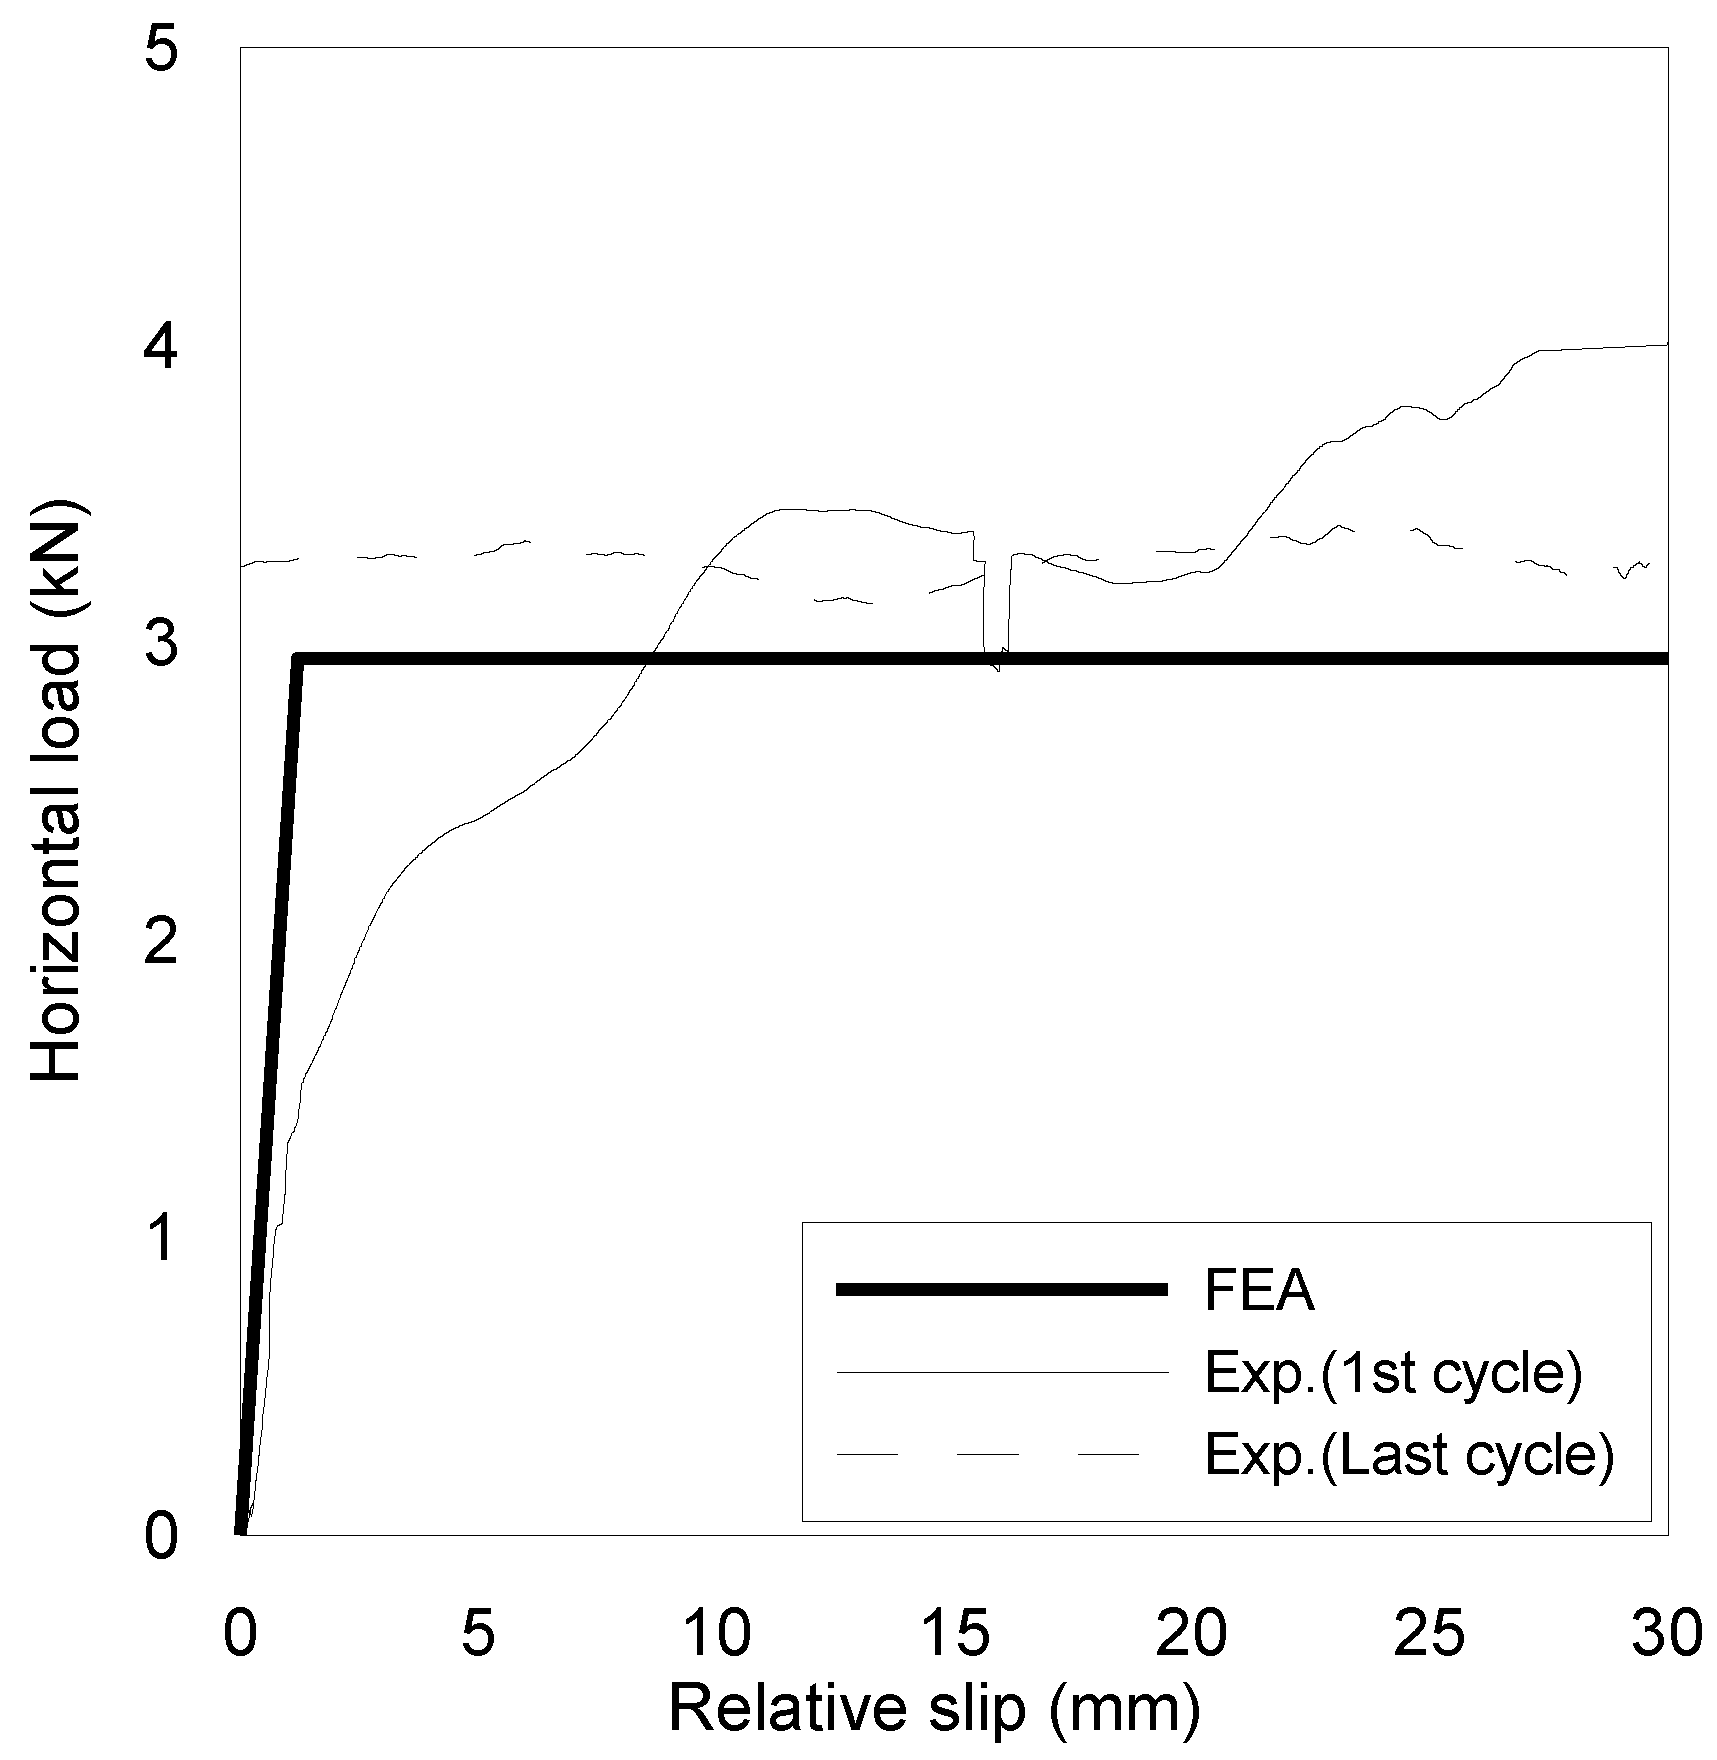
To verify the finite element model, the experimental and analytical horizontal load–slip curves are compared on Figure 10. The first and last horizontal loading cycles of the actual test are plotted together with the analytical horizontal load–slip (+direction) curve. The averaged maximum horizontal load from experimental result is 3.70 kN as mentioned above, and the maximum horizontal load from the FEA is 2.94 kN, which represents an error below 4.3%. The analytical result shows that the relative slip at the maximum load is reached earlier than in actual test. The difference in the relative slip is caused by the occurrence of large slip in the actual test when the horizontal load was applied. The error in the maximum horizontal load and relative slip seems to be caused by the manufacturing tolerance of the ceramic friction material and stainless-steel plate. The finite element model employs the idle conditions, which lead to more conservative results. In addition, the ceramic is modeled with an elastic condition. Nevertheless, the error is small enough to assume the finite element model describes accurately the actual test.
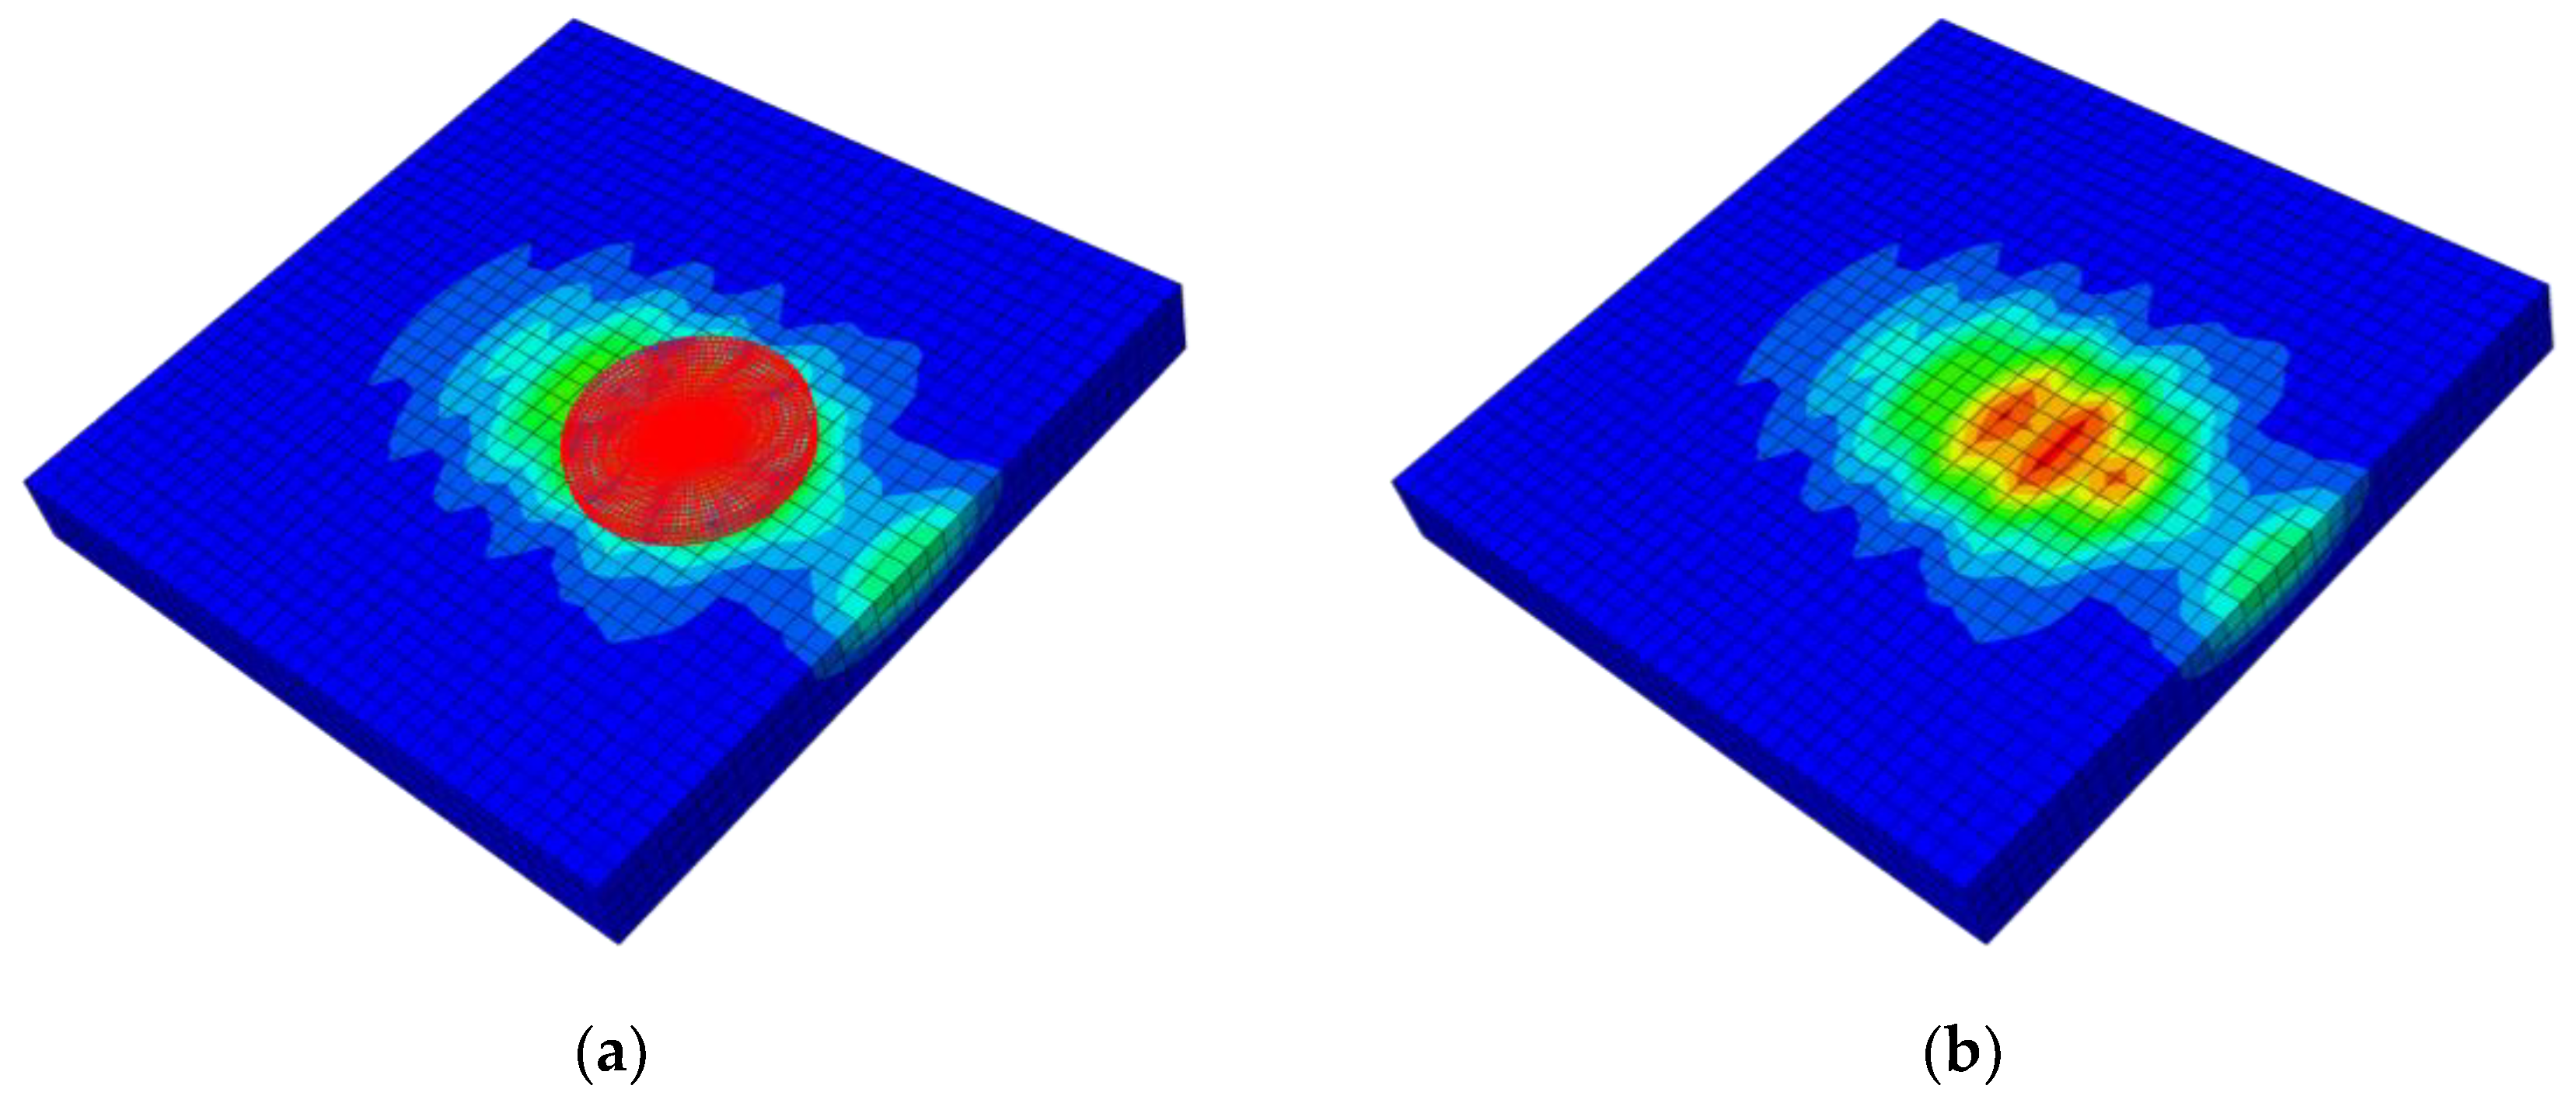
Figure 11 shows the deformation of the sliding plate. Comparing Figure 5d and Figure 11, it can be seen that the sliding plate is deformed by the ceramic friction material as the center point of the specimen moves away in the horizontal direction, which is similar in the analysis result for all of load cases. Accordingly, the finite element model is accurate enough for investigating the frictional behavior of the ceramic friction material.

4.2. Frictional Behavior of Improved Sliding Surfaces

The frictional behaviors generated at the sliding surface between the friction material and the sliding plate are analyzed for all the test variables considered in this study, including the three edge shapes chamber (C-1,2), round (R-1,2), and taper (T-1,2). The FEA is conducted by applying the same time increment and loading rate for all the types of sliding surfaces.
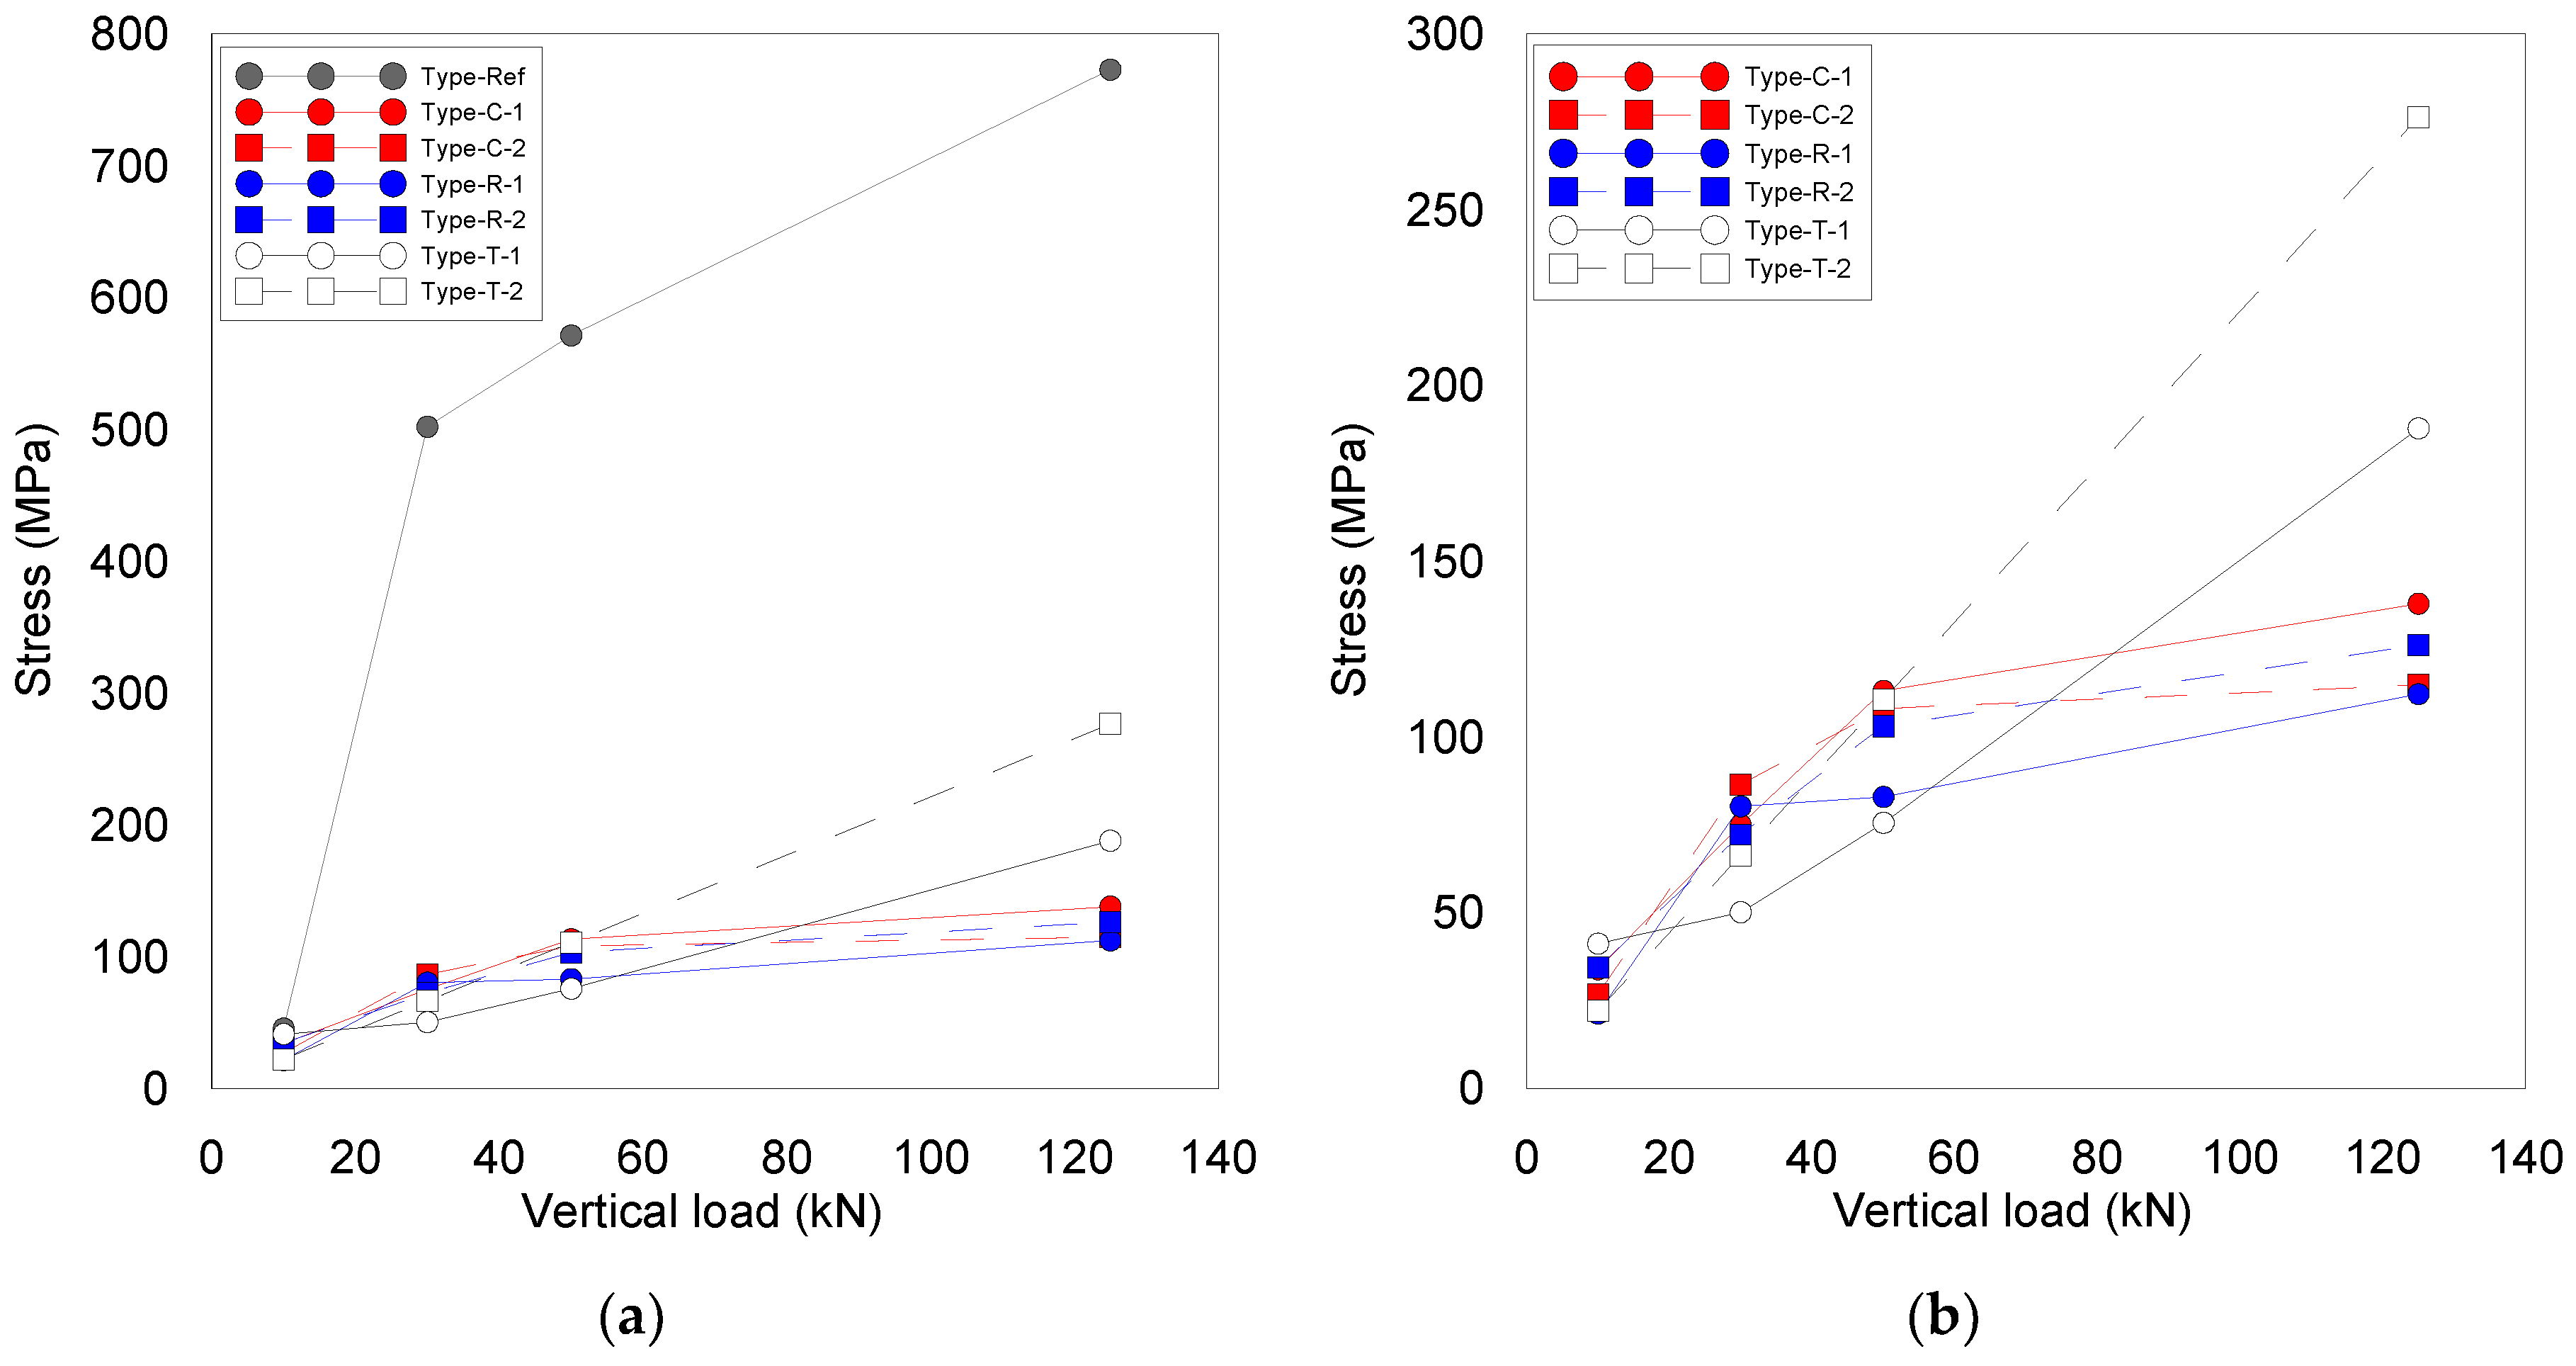
Figure 12 shows the maximum stress–load curves of all the specimens with respect to the considered vertical loads. Compared to Type-Ref, all the other cases have much lower maximum stress on the ceramic friction material.
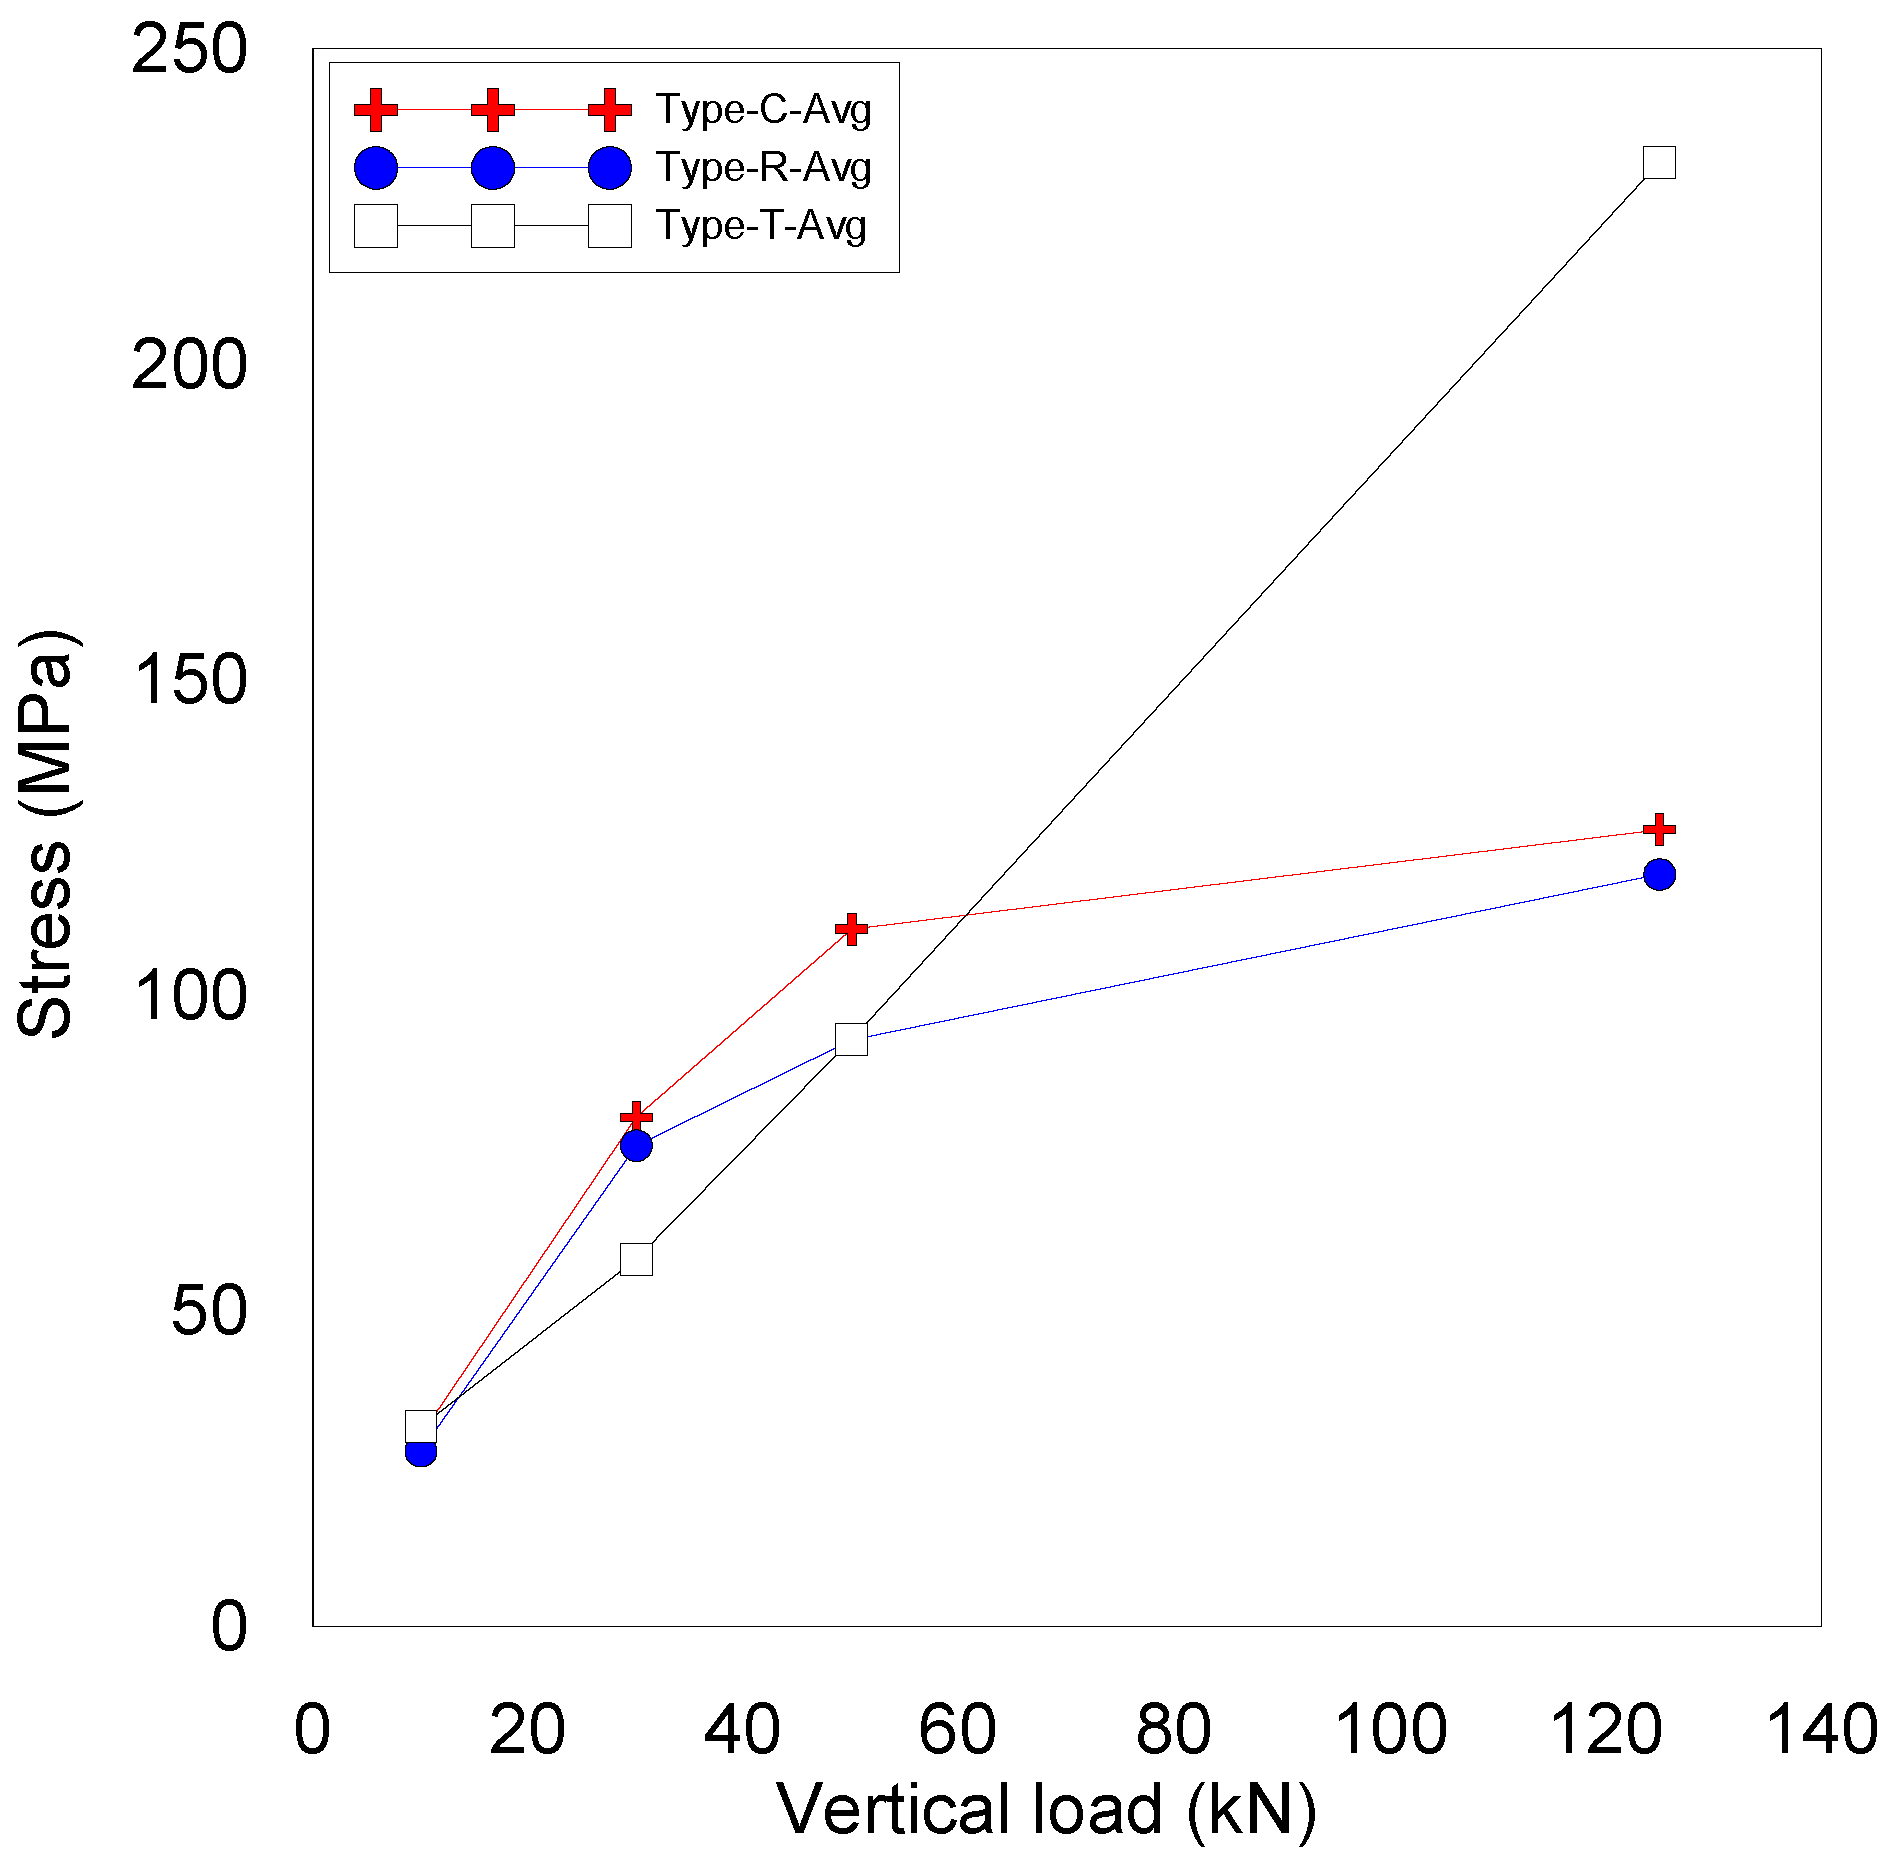
For the C and R specimens, the stress on the ceramic friction material increases as the vertical load gets higher but the increment of the stress decreases. The effect of the sizes of modifications differs by less than 10% for the same load with relatively low magnitude of the absolute stress generated in the ceramic material and no noticeable overall tendency. For the T specimens, the stress generated in the ceramic friction material was relatively higher than in the C and R specimens. As shown in Figure 13, the averaged stresses are represented with the same type for each. The averaged stresses in the type of C and R represent under 5% of difference between them in every vertical load case, but the other averaged stress in the type of T increases almost linearly as the vertical load increases. In cases of under 50 kN of the vertical load, the difference of three types represents under 10%, but in the case of 125 kN, it represents about 50% compared to the other two types. This can be seen as having a high probability of exceeding the stress range allowed by the ceramic friction material when the external load is applied at a relatively large value.
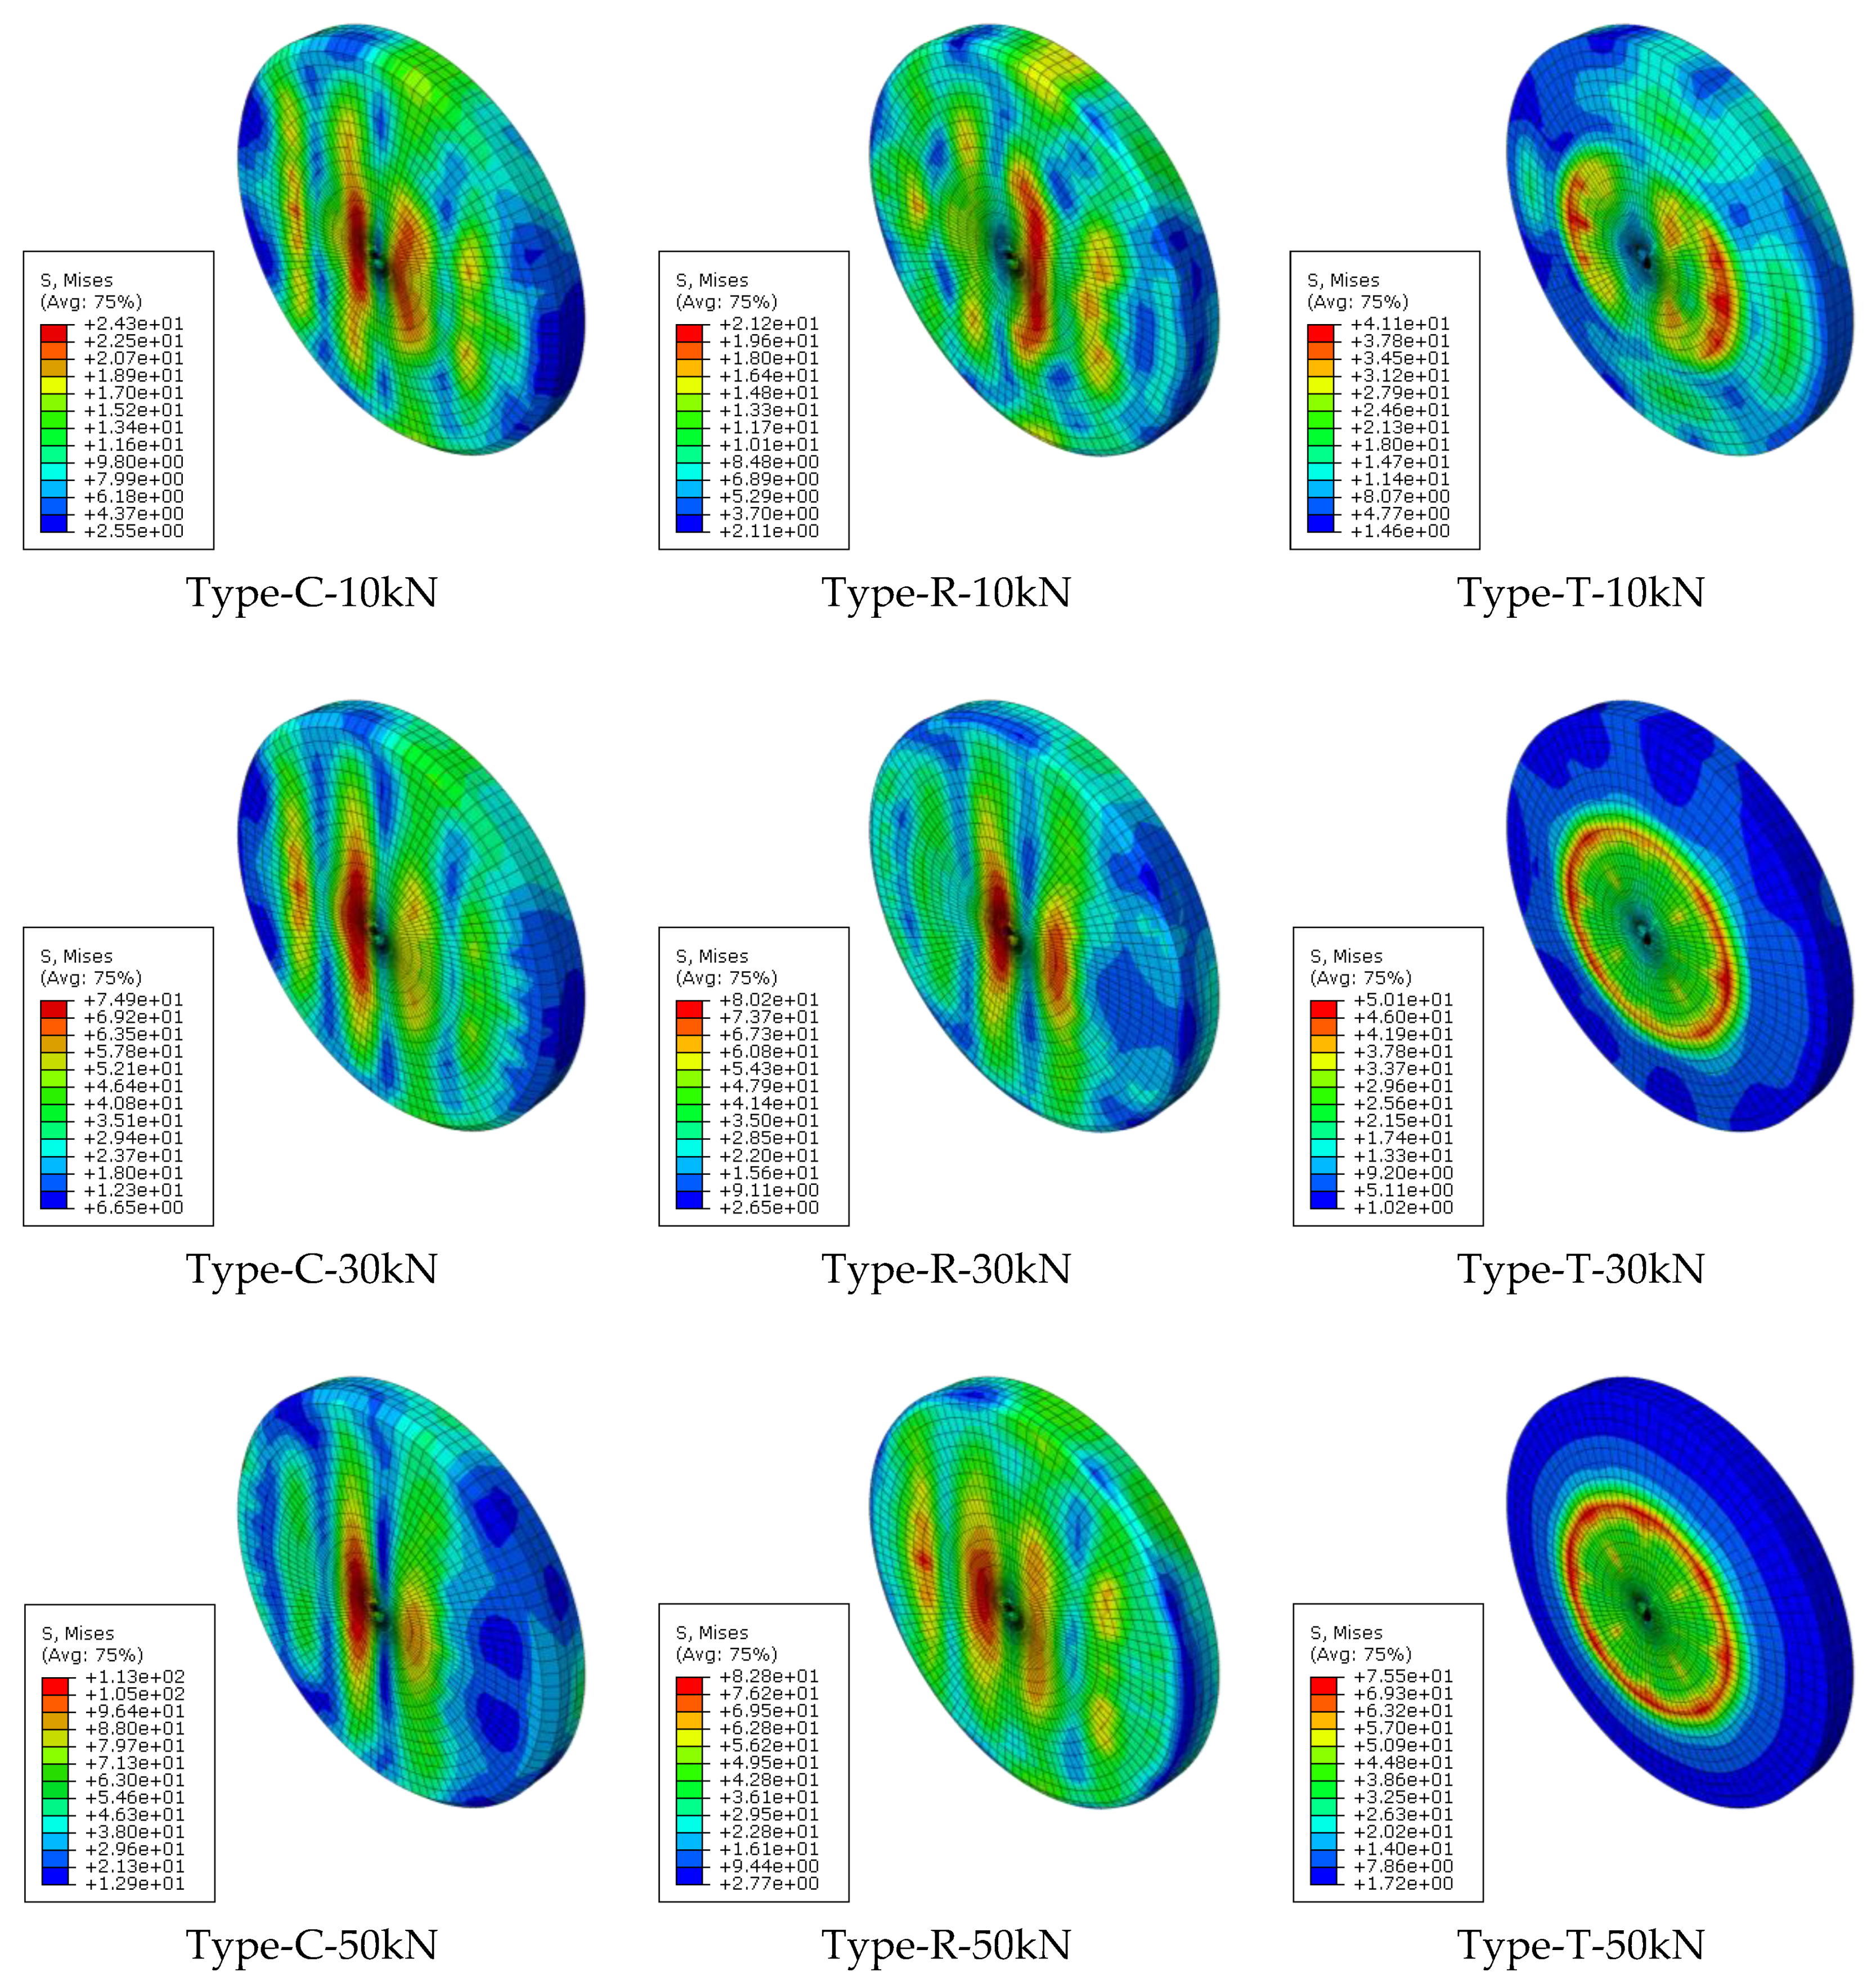
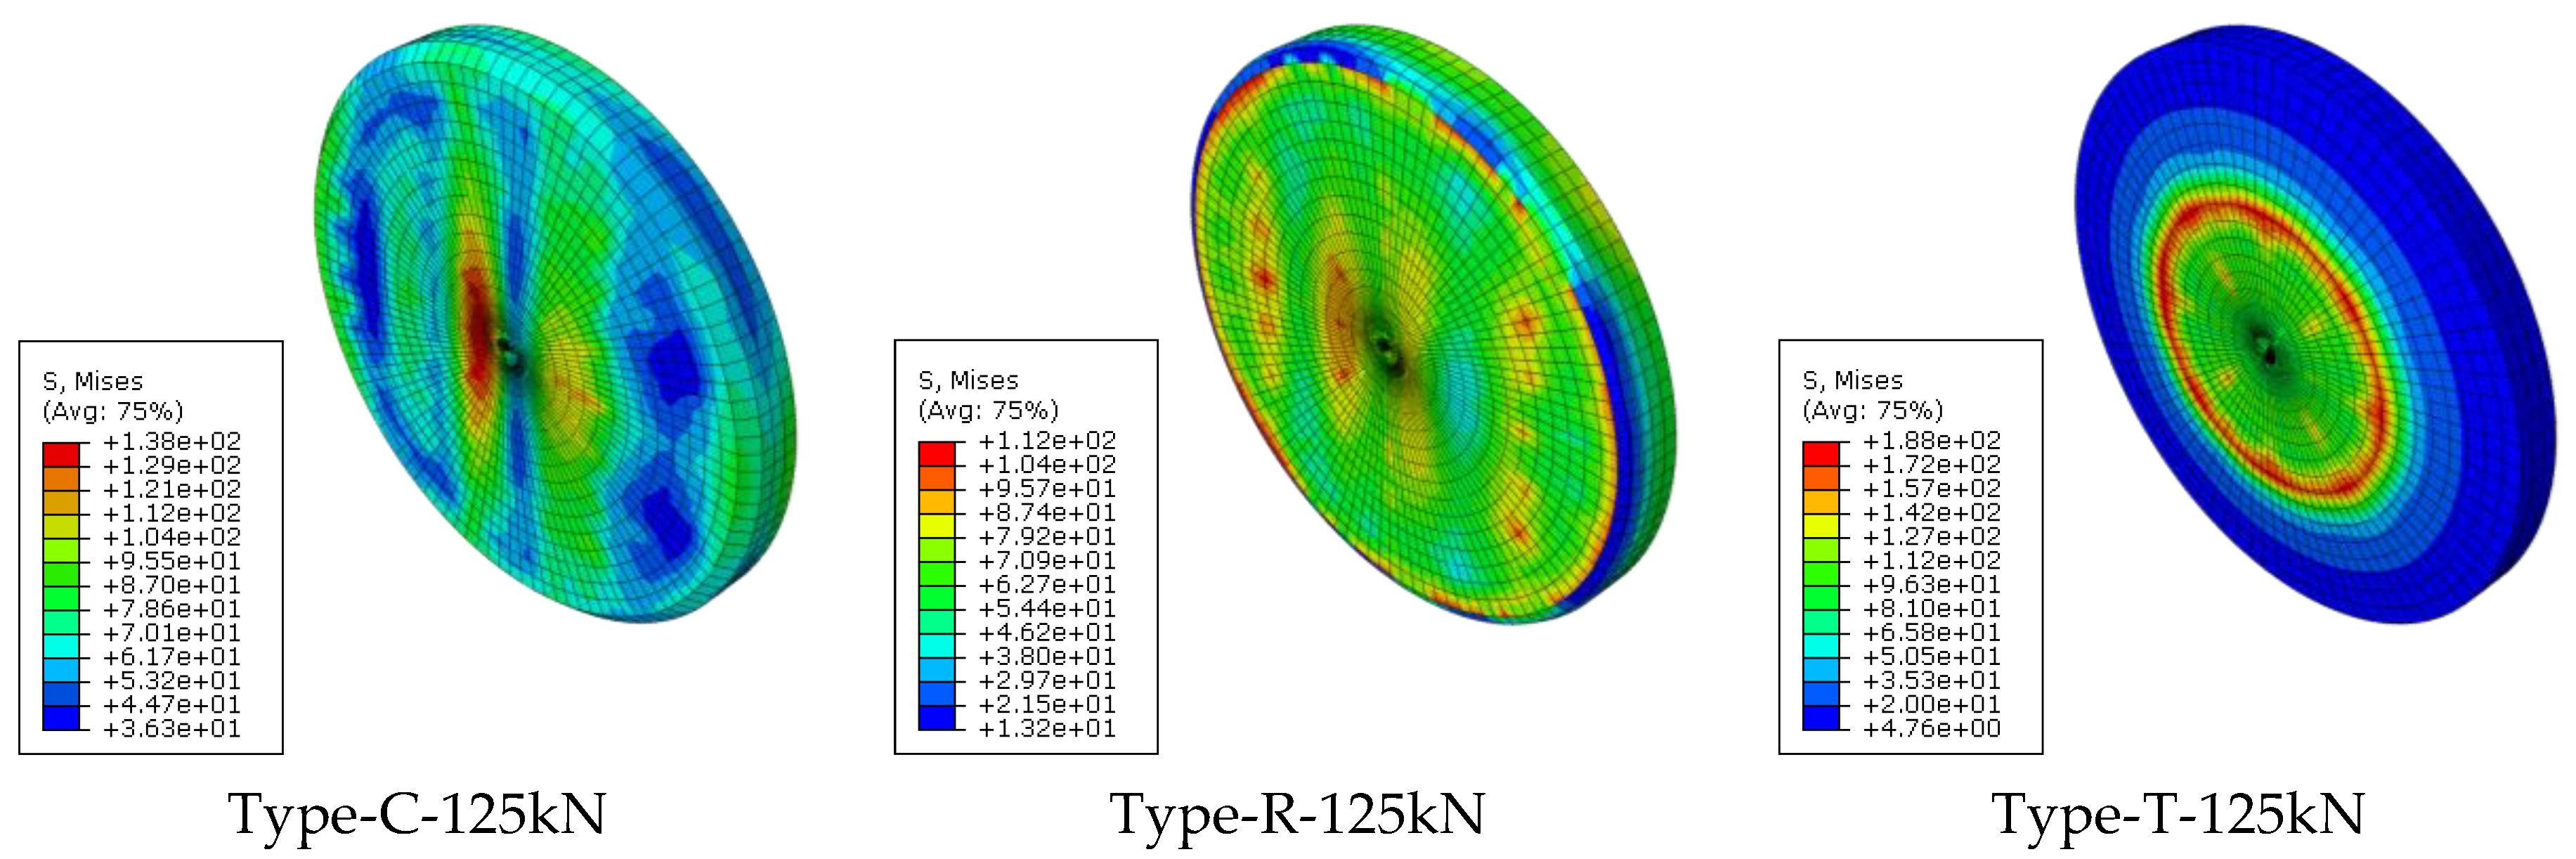
In Figure 14, as the vertical load increases, stresses are distributed on the whole of ceramic friction materials of the C and R specimens, but for the T specimen, the stresses are concentrated around the tapered edge on the ceramic friction material because of its geometric characteristics. It can be seen that the stress is concentrated on the tapered edge caused by the clearance space. It may be seen that the amount of deformation generated on sliding surfaces of the sliding plate as well as the stress generated on the ceramic friction material increases similarly to the amount of change in stress. Accordingly, it can be confirmed that as the magnitude of the vertical load increases in the C, R, and T specimens, the stress generated in the ceramic friction material increases. However, for the C and R specimens, as the magnitude of the load increases, the increment of stress decreases, and for the T specimen, the stress generated in the ceramic friction material increases almost linearly with the vertical load.
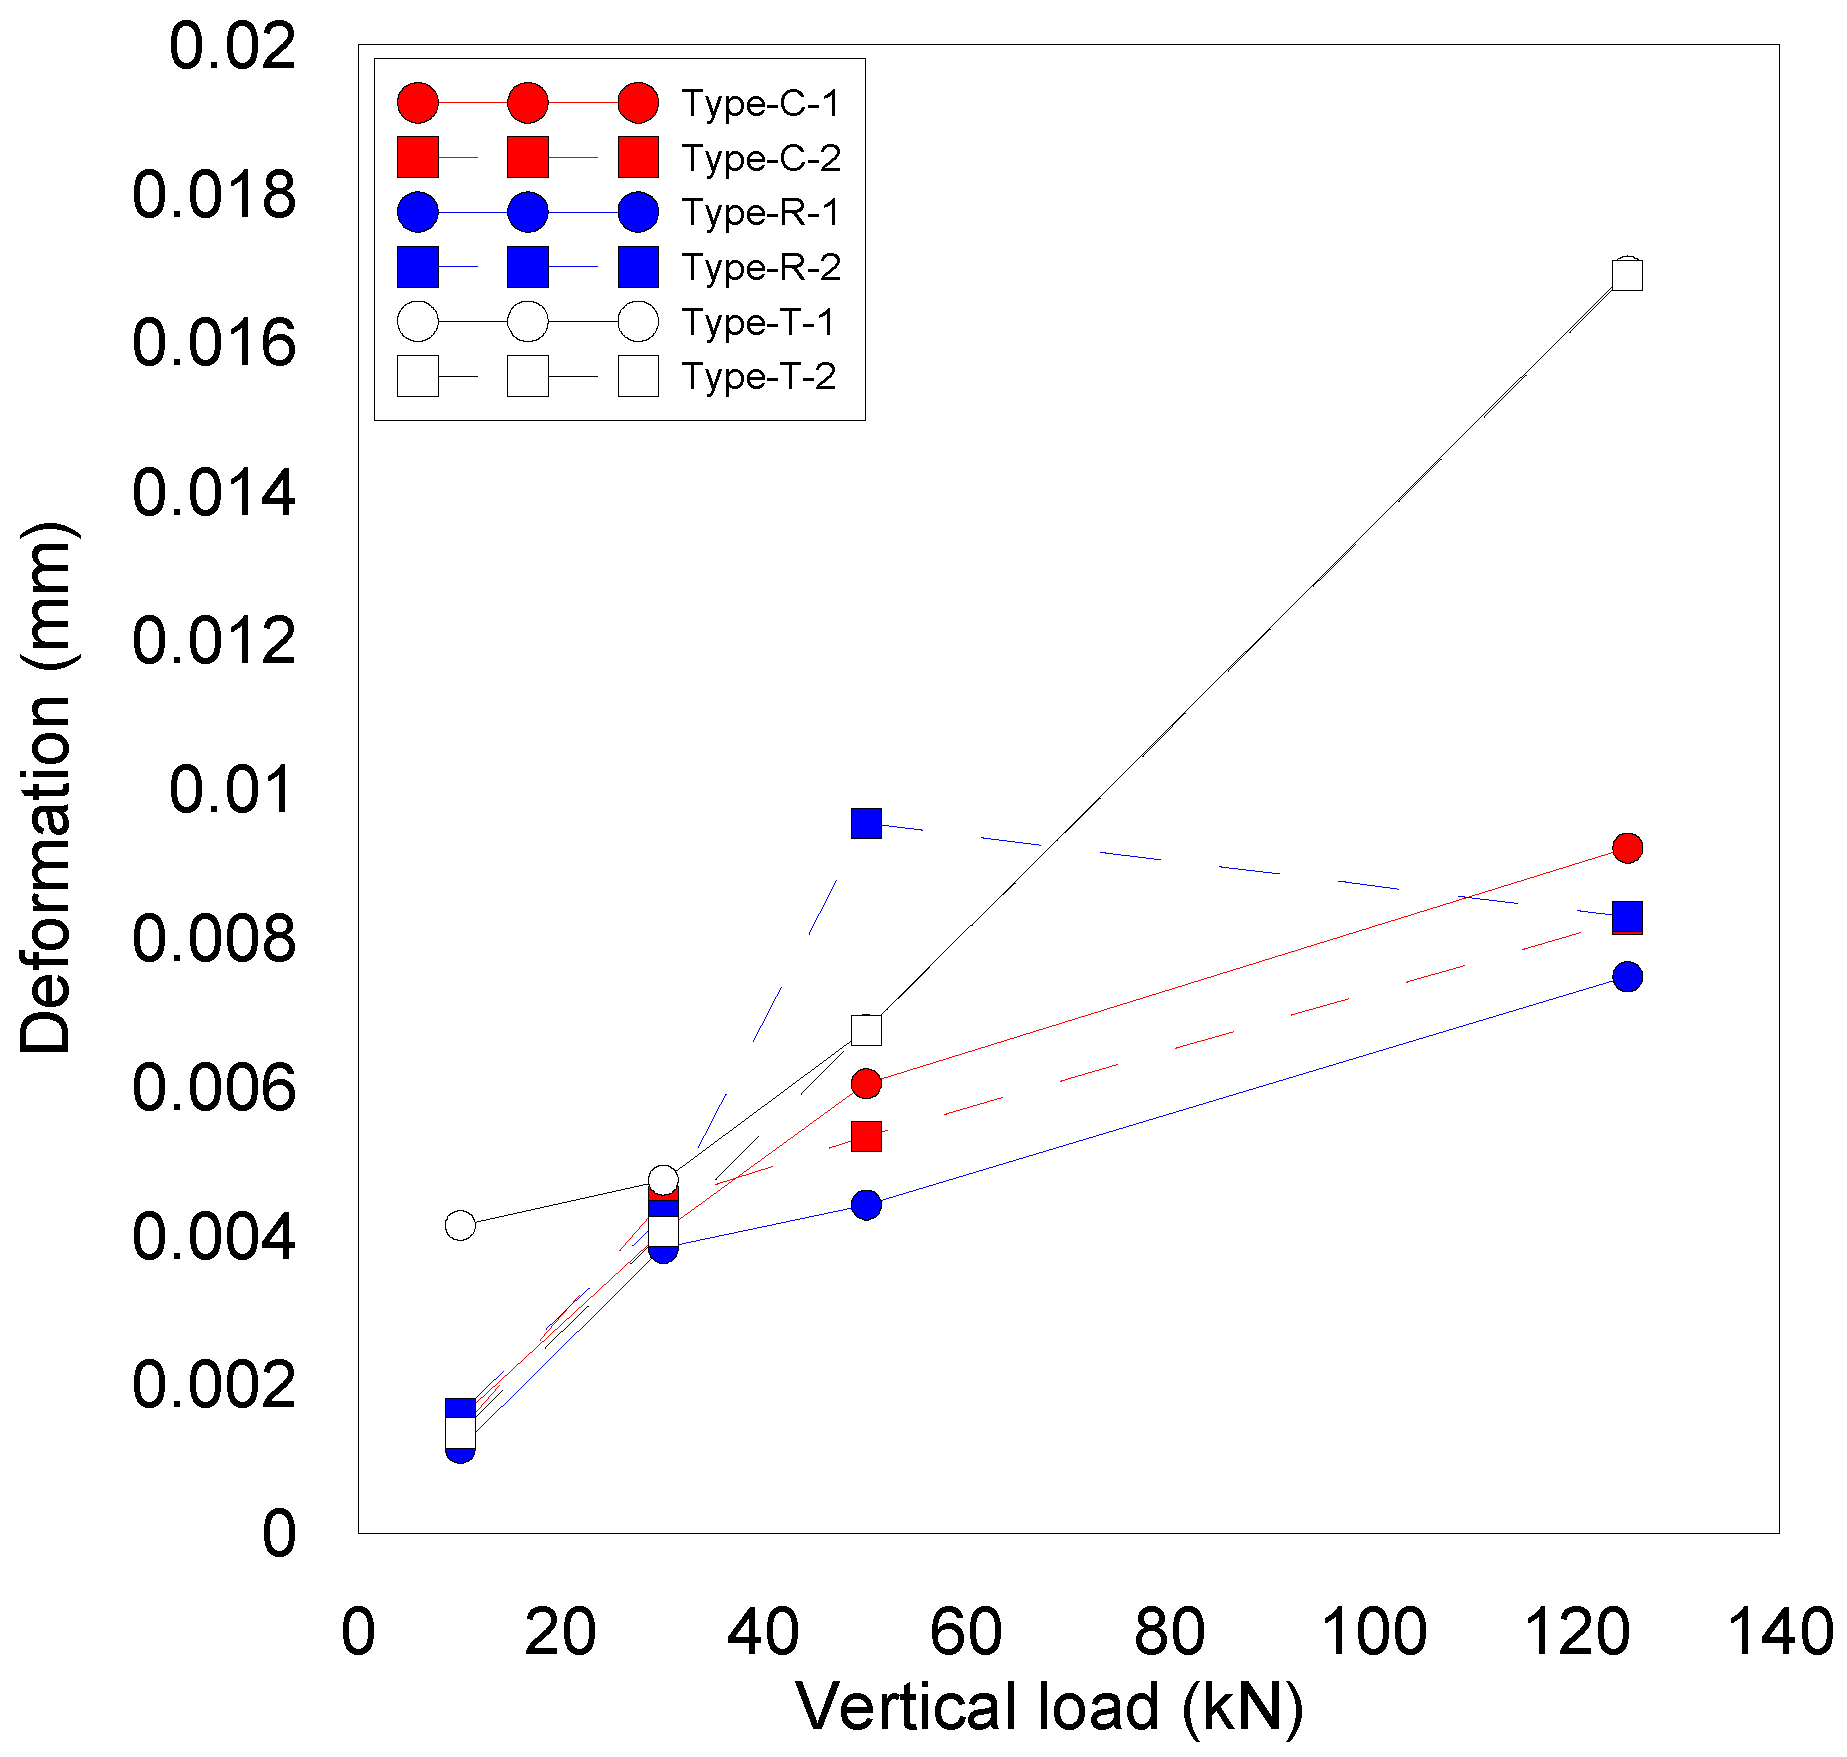
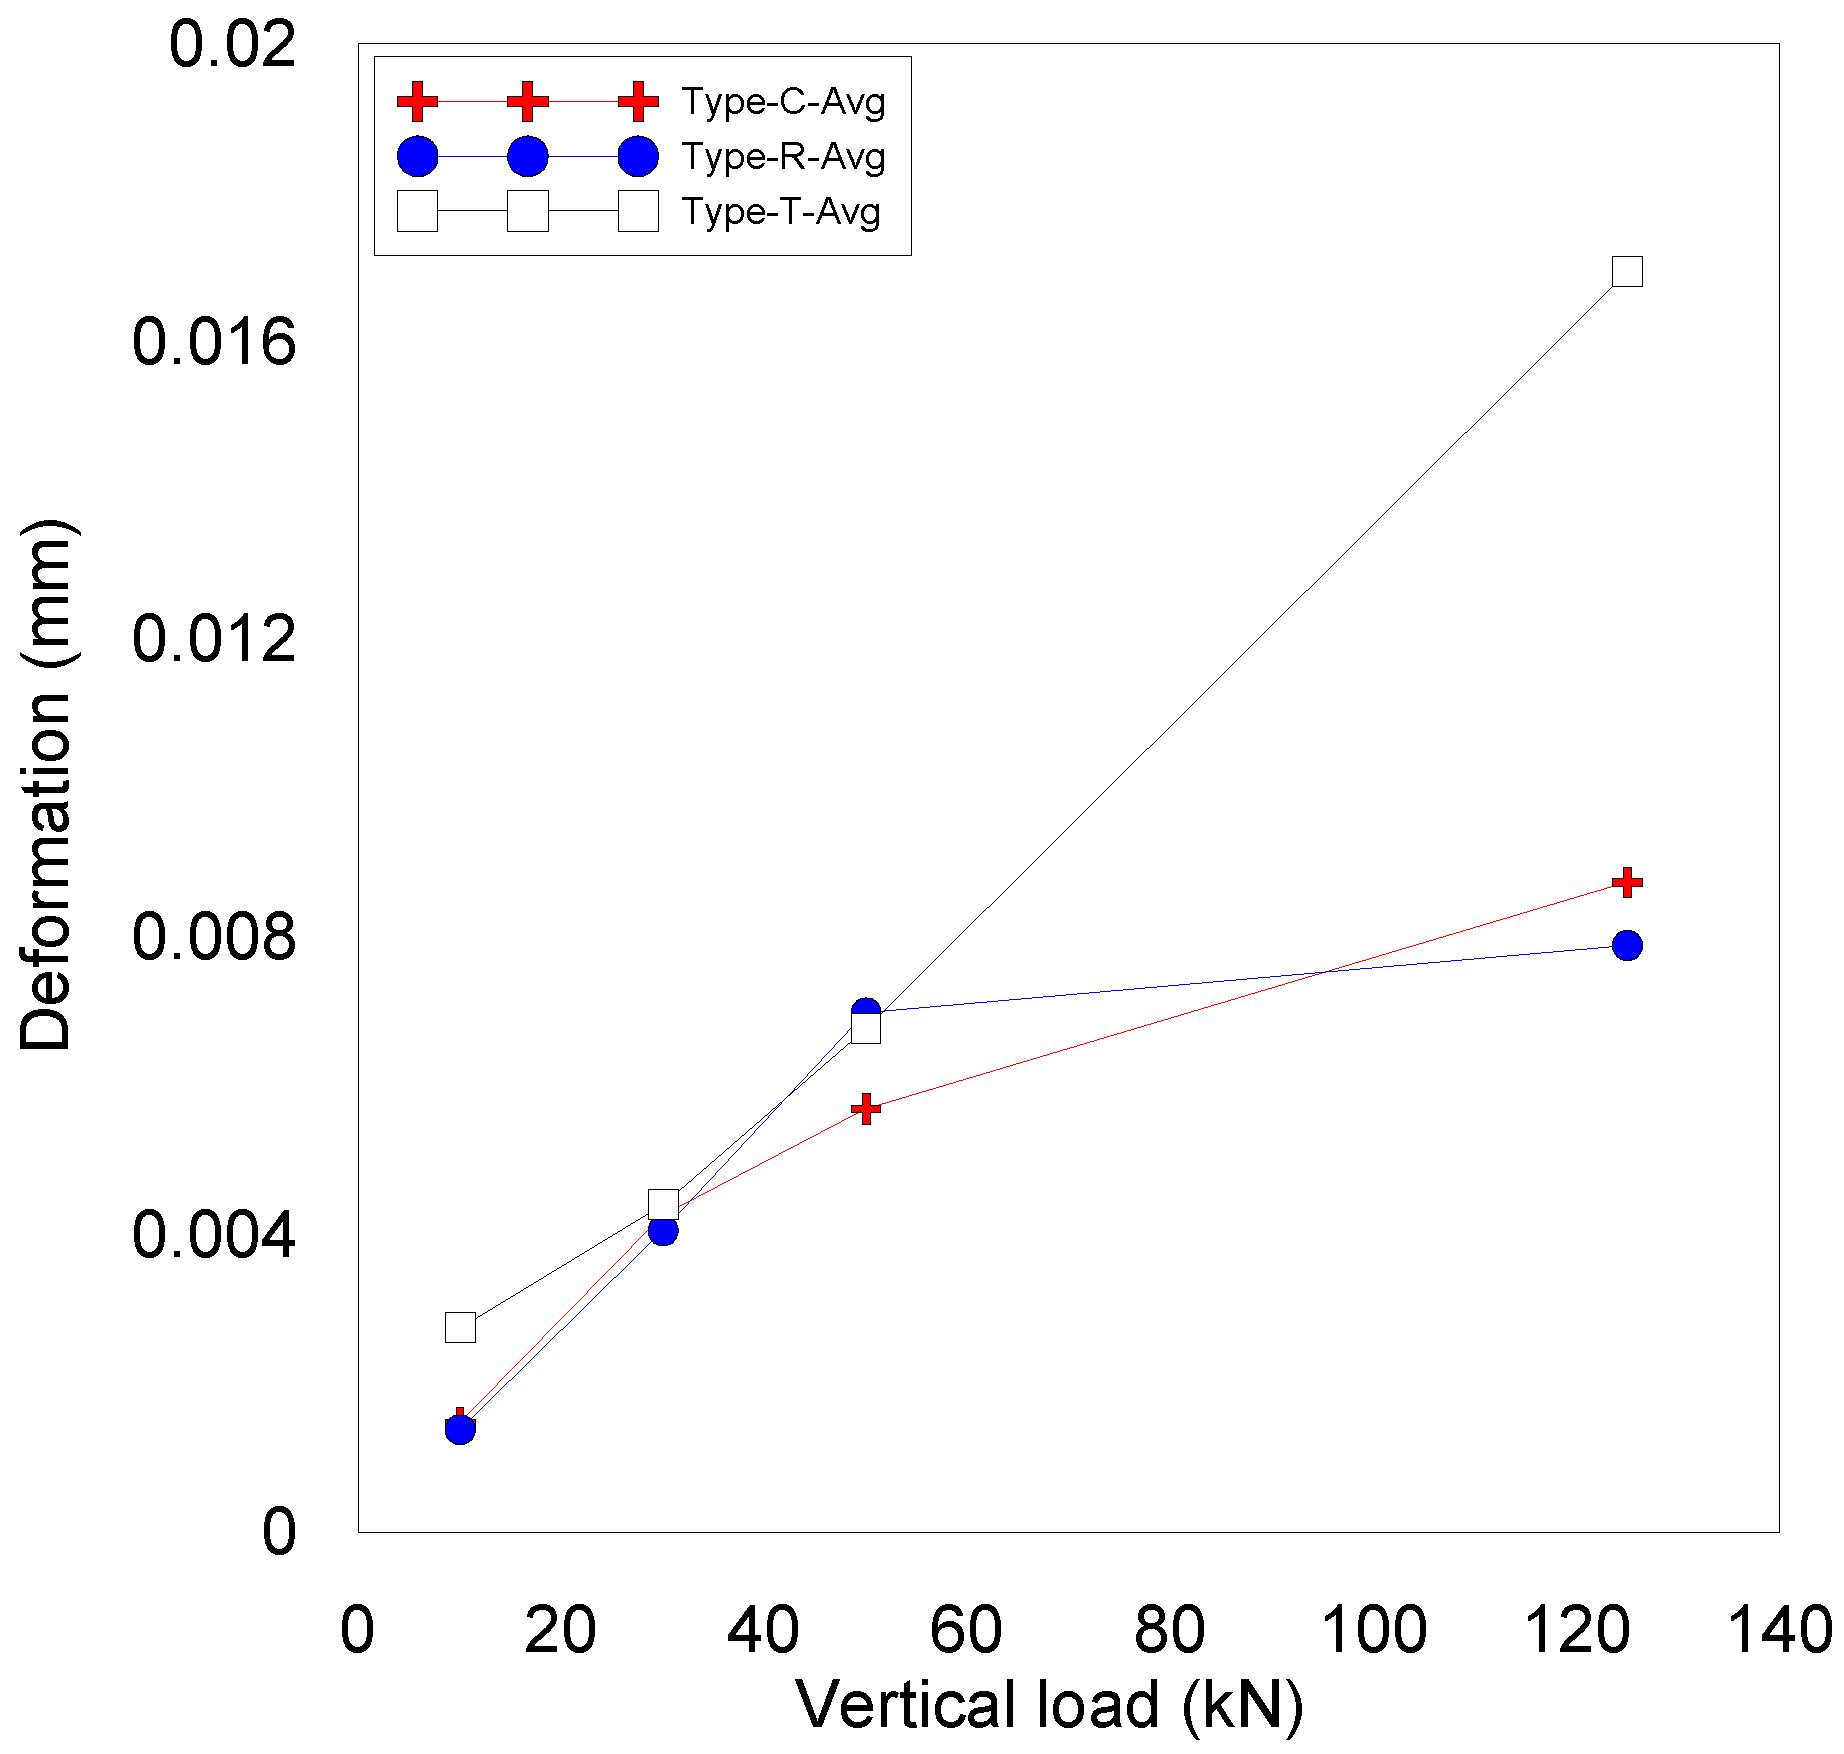
It can be seen that the amount of deformation of the sliding plate also occurs similarly to the amount of increase in stress in Figure 15. As the magnitude of the vertical load increases in all types C, R, and T, the deformation of sliding surfaces increases. Likewise, this pattern can be seen in deformation. Figure 16 represents the relationships of the averaged deformation–vertical load on the sliding plate for each type. In cases of under 50 kN of the vertical load, the difference of three types represents under 10%, but in the case of 125 kN, it represents about 50% compared to the other two types. Based on these results, it can be seen that the patterns of stress and deformation by vertical loads are similar. As a result, all types C, R, and T have the effect of improving friction behavior, but in the case of type T, there is a risk of damage if a load larger than the design load occurs. The C and R types show similar behaviors, but it can be seen that it is advantageous to use type C, which is easy to process, as a friction material in terms of productivity.

5. Conclusions

This study investigated how the changes in the shape of the edge on a ceramic friction material can affect frictional behavior of a ceramic sliding plate interface of bearing supports. The results of actual test and FEA were compared, and the following conclusions can be drawn.
(1)
The horizontal motion of the ceramic friction material allowed it to penetrate the underlying stainless-steel sliding plate because of the higher hardness of the ceramic compared to that of the stainless-steel. Compared to the actual test, the finite element model under-evaluated the horizontal load by less than 4.3% and overestimated the relative slip at the maximum horizontal load. Such slight discrepancy could be attributed to the fact that the finite element model was constructed in idle conditions and adopted elastic conditions for the ceramic. On the other hand, the manufacturing tolerance of the actual specimen caused a large slip to occur when the horizontal load was applied. Nevertheless, the developed model provided sufficient accuracy for the evaluation of the frictional behavior.
(2)
The stress and deformation of the ceramic friction material increased with larger vertical loads, but the increments varied depending on the improved edges of the ceramic friction material. The improved shapes adopting chamber and round edges achieved a low increment in stress and deformation, whereas the tapered edge provided stress and deformation increments proportional to the increase in the vertical load. The size effect for the camber and round edges was relatively low with a difference in stress and deformation below 10%.
(3)
All C, R, and T types have the effect of improving friction behavior, but in the case of type T, there is a risk of damage if a load larger than the design load occurs. The C and R types show similar behaviors, but it can be seen that it is advantageous to use type C, which is easy to process, as a friction material in terms of productivity.

Author Contributions

Software, formal analysis, data curation, and writing—original draft preparation, O.H.; Conceptualization, supervision and methodology, J.-W.K.; validation, investigation, and resources, J.-W.L.; visualization, project administration, and funding acquisition, W.-J.H. All authors have read and agreed to the published version of the manuscript.

Funding

Research for this paper was carried out under the KICT Research Program (project no. 20220327-001, Development of sliding pads for bridge bearings with improved durability using ceramic) funded by the Ministry of Science and ICT.

Institutional Review Board Statement

Not applicable.

Informed Consent Statement

Not applicable.

Data Availability Statement

Not applicable.

Conflicts of Interest

The authors declare no conflict of interest.

References

  1. Yang, Y.; Zhang, Y.; Ju, J. Study on the mechanical properties of a type of spherical bearing. J. Theor. Appl. Mech. 2021, 59, 539–550. [Google Scholar] [CrossRef] [PubMed]
  2. Peng, T.; Yan, B.; Li, F. The hysteresis model of the friction pendulum bearing based on the moment balance theory. Ain Shams Eng. J. 2022, 13, 101707. [Google Scholar] [CrossRef]
  3. Adamov, A.A.; Kamenskikh, A.A.; Pankova, A.P. Influence Analysis of the Antifriction Layer Materials and Thickness on the Contact Interaction of Spherical Bearings Elements. Lubricants 2022, 10, 30. [Google Scholar] [CrossRef]
  4. Askari, E.; Flores, P. Coupling multi-body dynamics and fluid dynamics to model lubricated spherical joints. Arch. Appl. Mech. 2020, 90, 2091–2111. [Google Scholar] [CrossRef]
  5. Yuan, Y.; Wang, S.; Tan, P.; Zhu, H. Mechanical performance and shear constitutive model study of a new high-capacity polyurethane elastomeric bearing. Constr. Build. Mater. 2020, 232, 117227. [Google Scholar] [CrossRef]
  6. Wei, W.; Yuan, Y.; Igarashi, A.; Zhu, H.; Luo, K. Generalized hyper-viscoelastic modeling and experimental characterization of unfilled and carbon black filled natural rubber for civil structural applications. Constr. Build. Mater. 2020, 253, 119211. [Google Scholar] [CrossRef]
  7. Adamov, A.A.; Kamenskih, A.A.; Pankova, A.P. Numerical analysis of the spherical bearing geometric configuration with antifriction layer made of different materials. PNRPU Mech. Bull. 2020, 4, 15–26. [Google Scholar] [CrossRef]
  8. Joh, C.; Yoon, H.; Kim, Y.J. Accumulated Sliding Distance of the Sliding Element in the Bridge Bearing; Korean Society of Civil Engineers: Seoul, Republic of Korea, 2006; pp. 1320–1323. [Google Scholar]
  9. Oh, S.T.; Lee, D.J.; Yeon, J.S.; Lee, H.J.; Jeong, S.H. Dynamic Behaviors of Bearings of the Two-Span Continuous PSC Box Bridge with 40 m Span for KTX Vehicle. In Proceedings of the 25th Annual Conference, KSR2013A032; The Korean Society for Railway: Daegu, Republic of Korea, 2013; pp. 130–132. [Google Scholar]
  10. EN 1337-2:2004; Structural Bearings—Part 2: Sliding Elements. European Committee for Standardization: Brussels, Belgium, 2004.
  11. Choi, E.S.; Choi, Y.B.; Lee, J.I.; Lee, S.J. Assessment of friction of EP frictional materials used for spherical bearings of railway bridges. J. Korean Soc. Steel Const. 2019, 31, 293–299. [Google Scholar] [CrossRef]
  12. Dong, S.; Jung, G.H.; Lee, G.S. Effect of surface roughness of counterface on tribological characteristics of PTFE and UHMWPE. J. Korean Soc. Tribol. Lubr. 2011, 27, 293–301. [Google Scholar] [CrossRef] [Green Version]
  13. Kamenskih, A.; Trufanov, N. Numerical analysis of the stress state of a spherical contact system with an interlayer of antifriction material. Comput. Contin. Mech. 2013, 6, 54–61. [Google Scholar] [CrossRef]
  14. Pavlenko, V.I.; Bondarenko, G.G.; Tarasov, D.G.; Edamenko, O.D. Gamma modification of radiation-resistant fluoroplastic composite. Inorg. Mater. Appl. Res. 2013, 4, 389–393. [Google Scholar] [CrossRef]
  15. Oh, S.T.; Lee, D.J.; Jun, S.M.; Jeong, S.H. A long-term friction test of bridge bearings considering running speed of next generation train. J. Korea Inst. Struct. Maint. Insp. 2016, 20, 34–39. [Google Scholar]
  16. Wang, H.; Sun, A.; Qi, X.; Dong, Y.; Fan, B. Experimental and analytical investigations on tribological properties of PTFE/AP composites. Polymers 2021, 13, 4295. [Google Scholar] [CrossRef]
  17. Mnif, R.; Ben Jemaa, M.C.; Kacem, N.H.; Elleuch, R. Impact of viscoelasticity on the tribological behavior of PTFE composites for valve Seals application. Tribol. Trans. 2013, 56, 879–886. [Google Scholar] [CrossRef]
  18. Zhang, Y.; Xu, S.; Zhang, Q.; Zhou, Y. Experimental and theoretical research on the stress-relaxation behaviors of PTFE coated fabrics under different temperatures. Adv. Mater. Sci. Eng. 2015, 2015, 319473. [Google Scholar] [CrossRef] [Green Version]
  19. Feng, C.; Zhang, D.; Chen, K. In situ microscopic observations of dynamic viscoelastic contact and deformation at a friction interface. Mater. Express 2019, 9, 235–244. [Google Scholar] [CrossRef]
  20. Oh, J.; Jang, C.; Kim, J.H. A study on the characteristics of bridge bearings behavior by finite element analysis and model test. J. Vibroeng. 2015, 17, 2559–2571. [Google Scholar]
  21. Lee, K.H.; Park, D.B.; Jang, K.S.; Sim, K.C.; Choi, J.S. Evaluate the Friction Coefficient of Friction Pendulum Bearing applied New Friction Material; Korean Society of Civil Engineers: Seoul, Republic of Korea, 2017; pp. 1353–1354. [Google Scholar]
  22. Kim, M. Study on tensile properties of polyamide 12 produced by laser-based additive manufacturing process. J. Korea Acad. Ind. Coop. Soc. 2019, 20, 217–223. [Google Scholar]
  23. Jae, H. The trend of the recent analysis of engineering plastics. Conf. Polym. Soc. Korea 2020, 45, 47–48. [Google Scholar]
  24. Lee, S.H. A Study on Engineering Plastic Bearing Cage Injection Process; The Korean Society of Manufacturing Process Engineers: Seoul, Republic of Korea, 2020; p. 244. [Google Scholar]
  25. Kang, D.H.; Hyun, J.H. Evaluation of the durability of spherical bridge bearing using polyamide engineering plastic middle plate. J. Korean Soc. Urban Railw. 2021, 9, 1021–1031. [Google Scholar] [CrossRef]
  26. Korea Highway Bridge Specifications; Korean Ministry of Construction and Transportation: Sejong, Republic of Korea, 2016.
  27. Roughness EN ISO 4288; 1997 Geometrical Product Specifications (GPS)—Surface Texture: Profile Method—Rules and Procedures for the Assessment of Surface Texture (ISO 4288:1996). ISO: Geneva, Switzerland, 1996.
  28. Frantsen, J.E.; Mathiesen, T. Specifying Stainless Steel Surfaces for the Brewery, Dairy and Pharmaceutical Sectors; Nace Corrosion: Houston, TX, USA, 2009; p. 9573. [Google Scholar]
  29. EN 1337-7:2004; Structural Bearings—Part 7: Spherical and Cylindrical PTFE Bearings. European Committee for Standardization: Brussels, Belgium, 2004.
  30. Abaqus Documentation, Version 6.12; Dassault System: Waltham, MA, USA, 2012.
  31. Kim, K.S.; Han, O.; Gombosuren, M.; Kim, S.H. Numerical simulation of Y-type perfobond rib shear connectors using finite element analysis. Steel Compos. Struct. 2019, 31, 53–67. [Google Scholar]
  32. Tahmasebinia, F.; Ranzi, G.; Zona, A. Probabilistic three-dimensional finite element study on composite beams with steel trapezoidal decking. J. Constr. Steel Res. 2013, 80, 394–411. [Google Scholar] [CrossRef]
  33. Qureshi, J.; Lam, D.; Ye, J. The influence of profiled sheeting thickness and shear connector’s position on strength and ductility of headed shear connector. Eng. Struct. 2011, 33, 1643–1656. [Google Scholar] [CrossRef]
  34. Qureshi, J.; Lam, D.; Ye, J. Effect of shear connector spacing and layout on the shear connector capacity in composite beams. J. Constr. Steel Res. 2011, 67, 706–719. [Google Scholar] [CrossRef]
  35. Veritas, D.N. DNV-RP-C208: Determination of Structural Capacity by Non-Linear FE Analysis Methods; Det Norske Veritas: Bærum, Norway, 2013. [Google Scholar]
Figure 1. Configuration of bearing support: (a) Concept figure; (b) Schematic diagram.
Applsci 13 00234 g001
Figure 2. Corrosion of bearing supports: (a) high-strength brass friction material rust; (b) corrosion of bearing supports due to rust.
Applsci 13 00234 g002
Figure 3. Test setup: (a) friction testing machine and setup; (b) shape and dimensions of ceramic friction material specimen; (c) ceramic friction material.
Applsci 13 00234 g003
Figure 4. Loading protocol.
Applsci 13 00234 g004
Figure 5. Friction test results: (a) horizontal load-slip curve; (b) deformation of ceramic friction material; (c) surface of ceramic friction material; (d) deformation of sliding plate.
Applsci 13 00234 g005
Figure 6. Shape and dimensions of specimens: (a) Type-Ref; (b) Type-C-1; (c) Type-C-2; (d) Type-R-1; (e) Type-R-2; (f) Type-T-1; (g) Type-T-2.
Applsci 13 00234 g006
Figure 7. Finite element model: (a) full-scale model including sliding plate and ceramic friction material; (b) meshing.
Applsci 13 00234 g007
Figure 8. Stress–strain relationship of stainless-steel.
Applsci 13 00234 g008
Figure 9. Interactions and load conditions in FEA model.
Applsci 13 00234 g009
Figure 10. Horizontal load–slip relationships (only +direction, 10 kN vertically loaded).
Applsci 13 00234 g010
Figure 11. Deformation of the sliding plate (only +direction, 10 kN vertically loaded): (a) distribution on the sliding plate at 30 mm (with the ceramic friction material); (b) distribution on the sliding plate at 30 mm (without the ceramic friction material).
Applsci 13 00234 g011
Figure 12. Maximum stress–vertical load relationships: (a) with Type-Ref; (b) without Type-Ref.
Applsci 13 00234 g012
Figure 13. Averaged stress–vertical load curves.
Applsci 13 00234 g013
Figure 14. Stress distribution for each ceramic friction material type.
Applsci 13 00234 g014aApplsci 13 00234 g014b
Figure 15. Deformation of sliding plate according to vertical load.
Applsci 13 00234 g015
Figure 16. Averaged deformation–vertical load curves.
Applsci 13 00234 g016
Table 1. Specifications of testing machine.
Technical SpecificationValue
Maximum vertical load100 kN
Maximum vertical loading rate100 mm/s
Maximum vertical stroke±100 mm
Maximum horizontal load50 kN
Maximum horizontal loading rate100 mm/s
Maximum horizontal stroke±100 mm
Table 2. Material properties.
SpecificationCeramicStainless-Steel
Young’s modulus (GPa)220210
Compressive/Tensile strength (MPa)3,997656
Poisson’s ratio0.2970.3
Hardness (Vickers hardness)1,100152
Roughness0.80.8
Table 3. Designation and characteristics of specimens.
Specimen DesignationEdge TypeEdge Size/Angle
Type-RefNot modified
Type-C-1Camber1.25
Type-C-2Camber0.625
Type-R-1Round1.25
Type-R-2Round0.625
Type-T-1Taper
Type-T-2Taper
Disclaimer/Publisher’s Note: The statements, opinions and data contained in all publications are solely those of the individual author(s) and contributor(s) and not of MDPI and/or the editor(s). MDPI and/or the editor(s) disclaim responsibility for any injury to people or property resulting from any ideas, methods, instructions or products referred to in the content.