Abstract
To improve machining efficiency and product precision in scroll manufacturing, we studied three adaptive milling processes: adaptive feed rate planning, chatter suppression measures, and optimization of milling parameters during the rough, semi-fine, and fine machining of scrolls. In the rough machining of scrolls, adaptive feed rate planning was used to compute the cutting area per cutter tooth in real time in order to adjust the feed rate and optimize the material removal rate (MRR) under a given maximum acceptable cutting load. To suppress the possibility of chatter in the semi-fine and fine machining processes, the chatter frequencies were detected with a microphone and the spindle speeds were promptly modified using a developed program in combination with the controller of the milling machine. Based on the Taguchi method and analysis of variance (ANOVA), we determined the optimum milling parameters for the fine machining processes to improve contour characteristics, such as the profile errors and surface roughness of scrolls. Experimental tests were implemented to demonstrate and verify the feasibility of the adaptive milling processes proposed in this study.
1. Introduction
Scroll-type compressors, which were first patented by Léon Creux [1] and commercialized in the 1980s, are widely used in small- and medium-sized refrigeration and air conditioning systems. The key components of a scroll-type compressor are a pair of fixed and orbiting involute scrolls, where the fixed scroll meshes with the moving one in a revolving orbital motion. A method for describing the scroll geometry and a thermodynamic model of the scroll compressor have been proposed by Blunier et al. [2]. For the scroll-type compressor, Liu et al. [3] developed a design optimization procedure and investigated the problem of reducing frictional losses in bearing components. Unlike conventional compressors, the scroll-type compressor is the only type of compressor that utilizes multiple symmetric compressing chambers during its operational periods, and it has few moving parts. This leads to advantages such as lower energy use, smooth operation, less vibration, and noise-producing benefits [4]. However, the manufacture of scroll-type compressors generally needs longer machining time and higher product precision.
Considering the requirements for rapid material removal rates and high product precision in the manufacture of scroll components, conventional methods commonly use trial and error to approach the most appropriate machining parameters. However, these usually yield lower efficiency and have higher costs. To shorten the machining time and improve the product precision, various strategies, such as feed rate planning, chatter suppression measures, and optimization of milling parameters, have been proposed for consideration in the manufacturing of scrolls.
Regarding feed rate planning, Altintas and Erkorkmaz [5] developed a feed rate optimization technique to minimize the cycle time for machining spline tool paths. Dong et al. [6] examined the possibility of scheduling or varying the feed rate by considering the geometry of the contour. Saï et al. [7] suggested an adaptive feed rate based on the chip thickness and the different types of tool motions. Calleja et al. [8] proposed a method to generate the flank milling paths of ball-end-mill tools in five-axis CNC machining. Tunc [9] examined how tool-path planning and generation can be used to decrease the total cycle time in five-axis milling. Hashemian et al. [10] presented a jerk minimization algorithm in the context of multi-axis flank CNC machining, the tool path of which was reparameterized with a B-spline function. Li et al. [11] investigated how the total machining can be reduced and presented a multi-pass tool-path generation method for flank milling of thin-walled workpieces at the semi-finish and finish machining stages.
With regard to the issue of chatter suppression [12,13,14], Delio et al. [15] showed that a microphone can provide a proper and consistent signal for reliable chatter detection and control using frequency domain processing and deterministic frequency domain chatter theory. Quintana et al. [16] determined the stability lobe diagram (SLD) for a milling process using a sound mapping methodology by collecting the milling process sounds with a microphone placed inside the machine-tool enclosure. Using the semi-discretization method and the geometrical modeling approach, Tehranizadeh et al. [17] studied the stability of crest-cut tools and analyzed the effect of edge wave geometry on stability. Wang et al. [18] proposed a rapid method for the acquisition of the time-varying modal parameters of a workpiece by combining experimental measurements with the receptance coupling method.
To obtain the appropriate milling parameters for scroll manufacturing, Ghani et al. [19], for example, used the Taguchi method to optimize the cutting parameters in end milling. They considered the machining processes under semi-fine and fine high-speed cutting conditions and evaluated the milling parameters, such as cutting speed, feed rate, and depth of cut. Kato et al. [20] determined the wearing mechanism that could reduce tool wear, supplied an effective coolant system, and developed an appropriate tool geometry for the milling of scrolls with high precision and efficiency. For the rapid measurement of scroll profiles, Yang et al. [21] proposed a measurement system and analyzed the measurement errors. Coşkun et al. [22] planned experiments based on the Taguchi L27 orthogonal array to investigate and optimize the effects of control parameters on system performance in waste heat recovery applications using a mechanical heat pump. Zhang et al. [23] focused on estimating the performance of a scroll-type hydrogen pump for fuel-cell vehicles and utilized the Taguchi method to determine the optimum conditions for volumetric efficiency and evaluate the effects of design factors.
To improve machining efficiency and product precision, this study proposes three adaptive milling processes for scroll manufacturing applications: adaptive feed rate planning, chatter suppression measures, and optimization of milling parameters. For the adaptive feed rate planning implemented with rough machining processes, we computed the cutting area per cutter tooth to simulate the cutting amount and the adjustable feed rate during the milling processes. The results were used to increase the material removal rate (MRR) under a given maximum acceptable cutting load. For the chatter suppression measures considered for the semi-fine and fine machining processes, we developed programs based on MATLAB that can connect a PC and the controller (Delta NC311A) of a milling machine to process the signals of the chatter frequency detected with a microphone. The developed programs can also be used to adjust the real-time spindle speeds to suppress the occurrence of chatter. For the determination of the optimum milling parameters in the fine machining processes, such as the spindle speed, tool feed rate, and tool path, we applied the Taguchi method to implement optimization processes and analysis of variance (ANOVA) to analyze the profile accuracy, such as the profile errors and surface roughness of scrolls. Using a TMV-760 vertical milling machine made by Tongtai Company, we also undertook actual experiments and tests to demonstrate and verify the feasibility of the proposed methods.
2. Adaptive Feed Rate Planning
In the production of scrolls, a chunk of aluminum alloy, which is the material most widely used, is sequentially machined in rough, semi-fine, and fine machining processes. As about 65% of the whole material is removed during the rough machining process, it is worth increasing the material removal rate to shorten the overall machining time. Conventionally, increasing the material removal rate means directly increasing the feed rate during the machining processes. However, the overall stiffness of the milling machine, the surface smoothness of the workpiece, and the cutter lifetime are diminished if the feed rate is too high. In this section, in contrast to conventional solutions, adaptive feed rate planning, which can be used to adjust the feed rate during machining processes where cutting loads are kept close to a given maximum acceptable value, is proposed to increase machining efficiency.
Earlier research has shown that the real tooth path of a milling cutter is a trochoid [24,25]. A trochoidal tooth path is often used to simulate and compute the chip thickness for machining conditions involving a fixed cutting width and depth. In the analysis of scroll manufacturing, however, the simulation of a trochoidal tooth path is cumbersome and not easy to compute. Therefore, we used circular arcs to approximately simulate the tooth path and then determine the cutting area, which is the intersection of the tooth path and the workpiece’s shape. From the cutting area per cutter tooth, we also determined the cutting amount per cutter tooth, since machining scrolls is also a kind of plane-milling process.
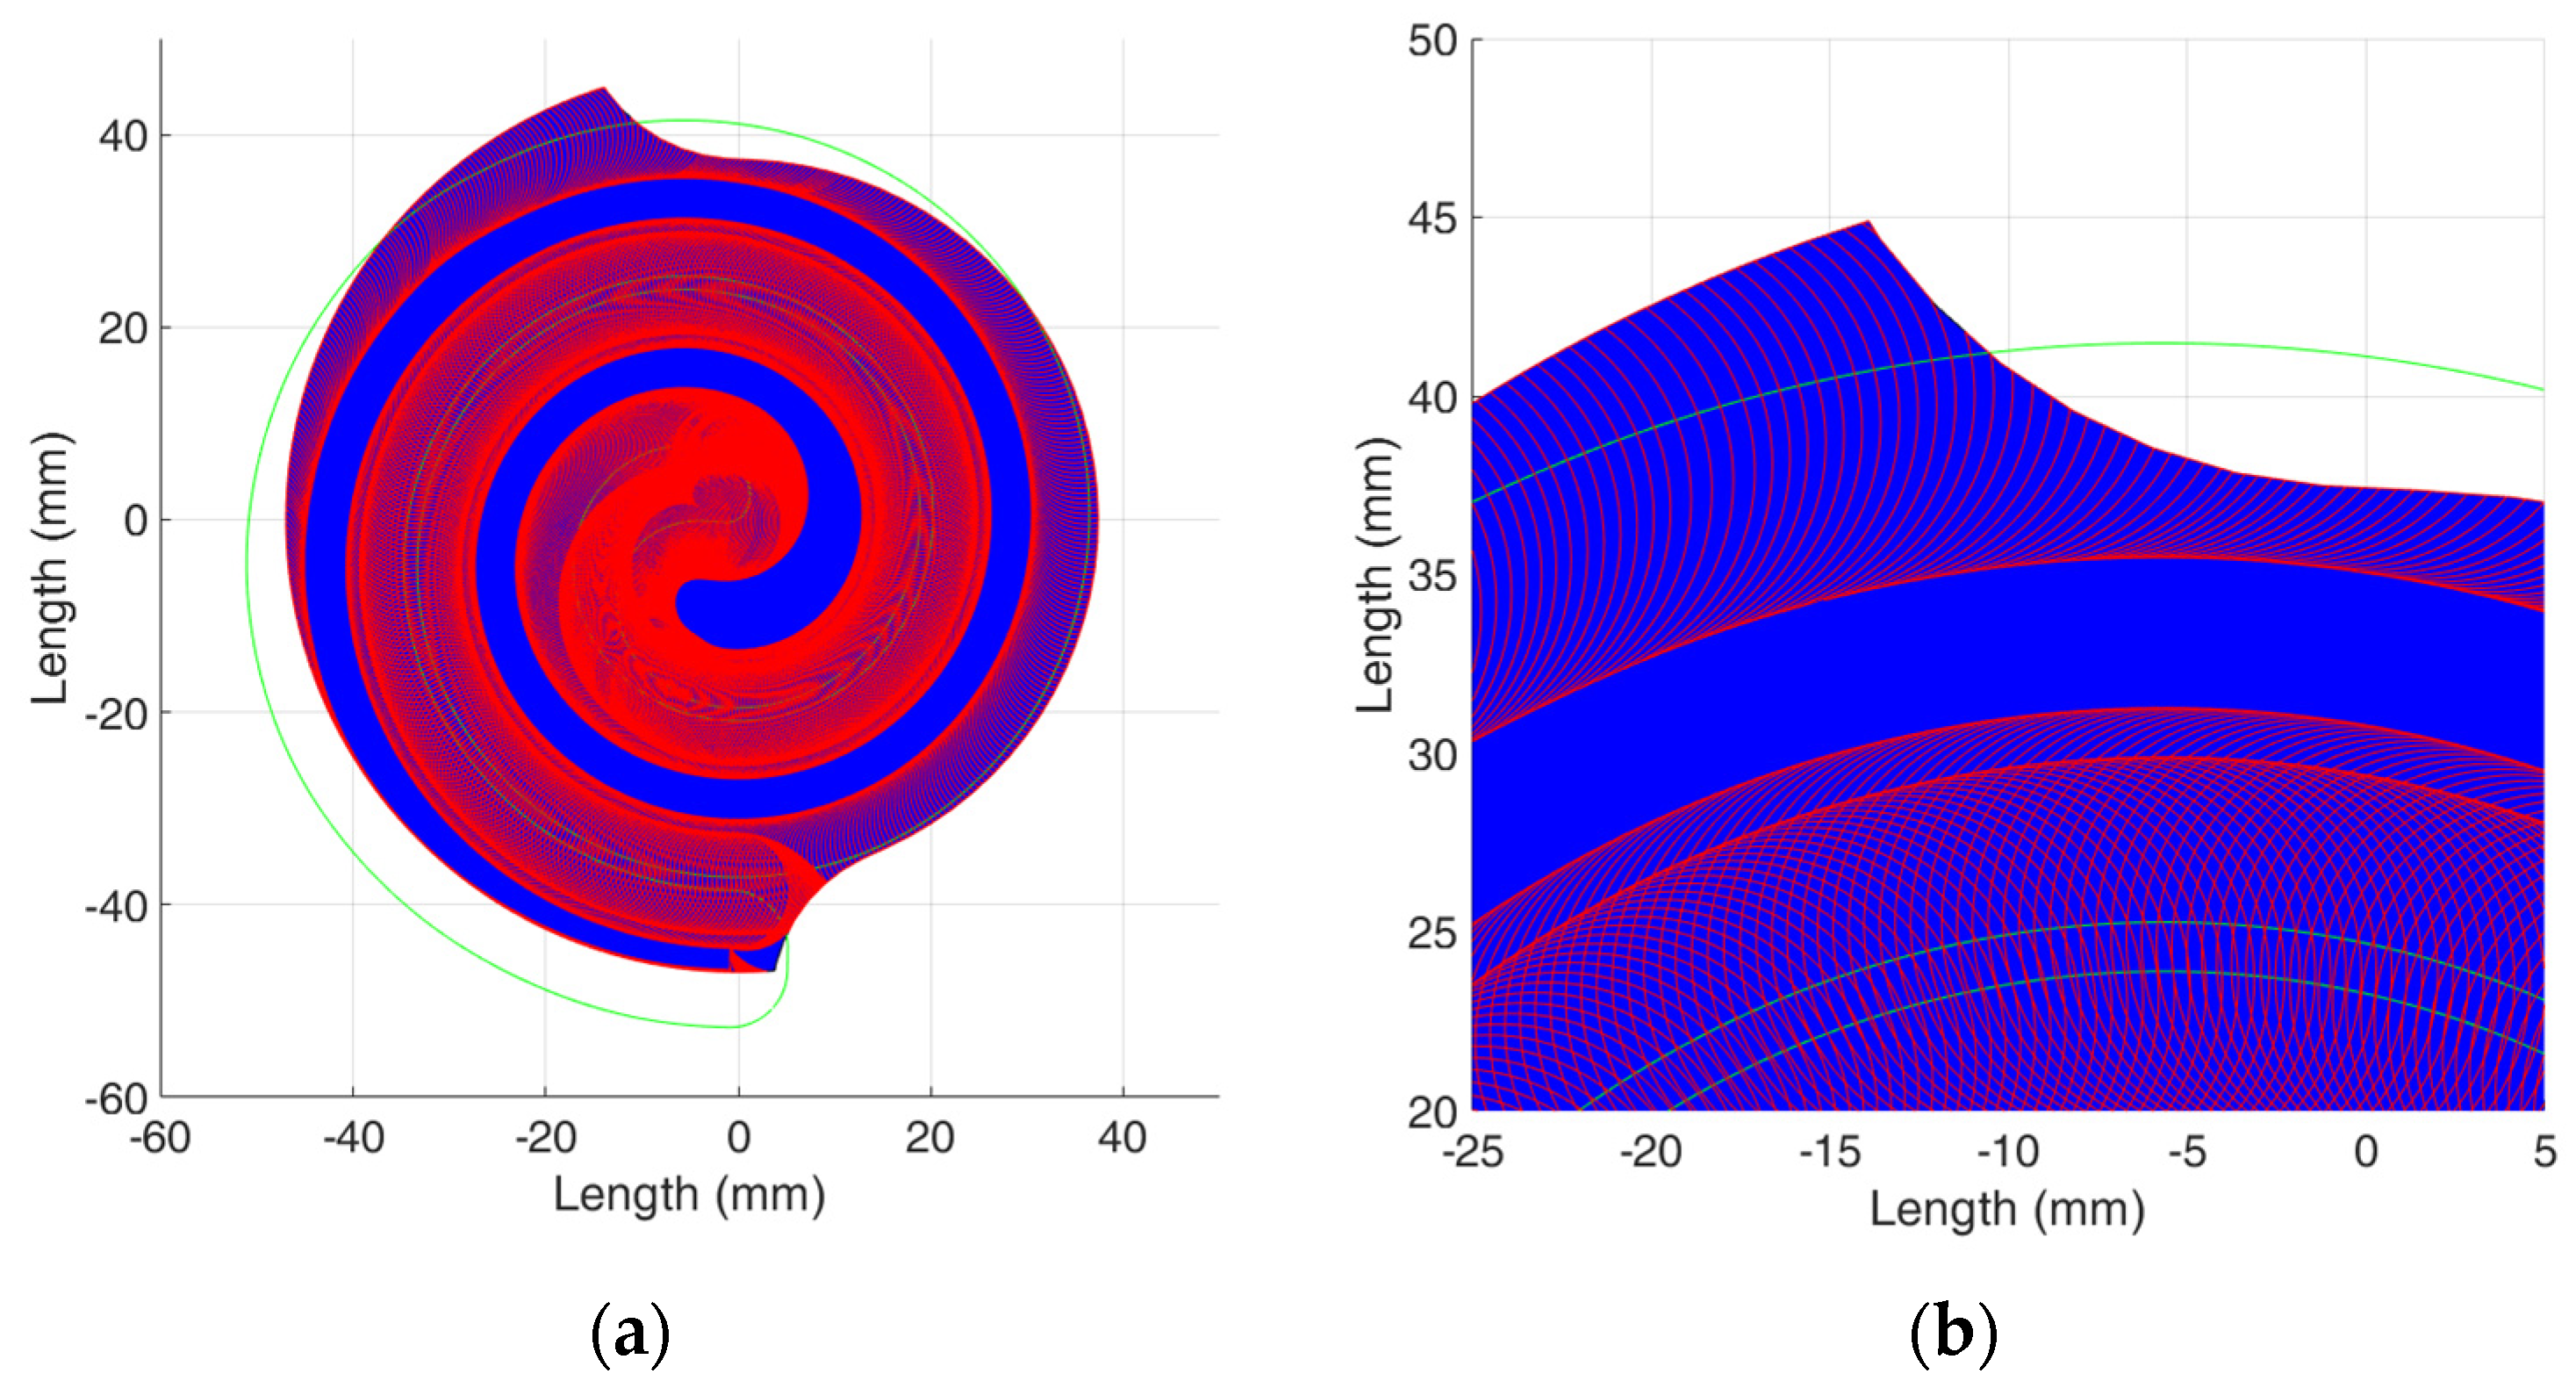
As shown in Figure 1, the cutting area per cutter tooth can be obtained from the calculation of the area intersected by two adjacent tooth paths; i.e., the circular arc segments depicted by red curves and the workpiece’s shape depicted by the blue block. The feed rate per cutter tooth, denoted , and the average cutting area per cutter tooth for each path segment, denoted , can be obtained with the following equations:
where F is the feed rate, S is the spindle speed, Z is the number of teeth for a cutter, A is the cutting area for each path segment, and l is the length of each path segment.
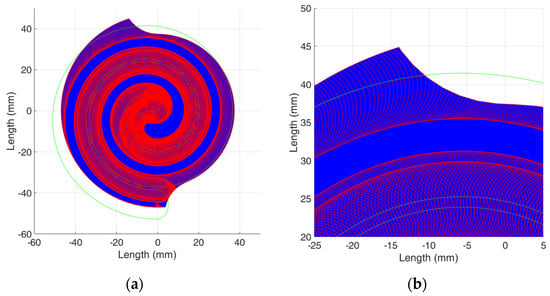
Figure 1.
Cutting area intersected by tooth paths and scroll workpiece: (a) full view, (b) zoomed-in view.
Combining Equations (1) and (2) and eliminating Fz yields:
where Fadp is the adaptive feed rate, which can be deduced from the cutting area per cutter tooth. By inputting the adaptive feed rate obtained with Equation (3) into the controller of the milling machine, we were able to accomplish adaptive feed rate planning.
3. Chatter Suppression
After the rough machining processes, most of the workpiece materials are removed and the stiffness of the scrolls is significantly diminished. The overall stiffness of the milling machine will be also reduced if the spindle speed and the feed rate are raised to increase the machining efficiency. These conditions are prone to eventually induce the occurrence of chatter. Therefore, it is worth considering the issues of chatter suppression while confronting such conditions during the machining of thin-wall workpieces for the manufacture of scrolls, as mentioned above.
In end-milling processes, Altintas [26] proposed the vibration model to be a system with two degrees of freedom. The vibration amplitude simulated from this system corresponds to the regenerative waviness and can be used to compute the chip thickness. The phase shift occurring between two tool paths affects the chip thickness, decreases the machining quality, and varies the force on the cutting edge. Applying a varying force to a machining process system eventually induces the occurrence of chatter. Therefore, to stabilize the machining processes, it is necessary to keep the chip thickness consistent and avoid the occurrence of phase shifts. The relationship between vibration frequency and tooth frequency is shown by the following equation [27]:
where h is the vibration frequency, hz is the tooth frequency, N is the number of complete waveforms between adjacent teeth, and ε is the phase shift angle between two corrugations. When chatter occurs, the vibration frequency h shown in Equation (4) is also called the chatter frequency. As mentioned above, the phase shifts between the cutting ripples occurring in the milling processes, except for phase angles equal to 0° and 180°, vary the chip thickness and are prone to induce the occurrence of chatter. It can also be observed from Equation (4) that the ratio between vibration frequency and tooth frequency is not an integer when chatter occurs.
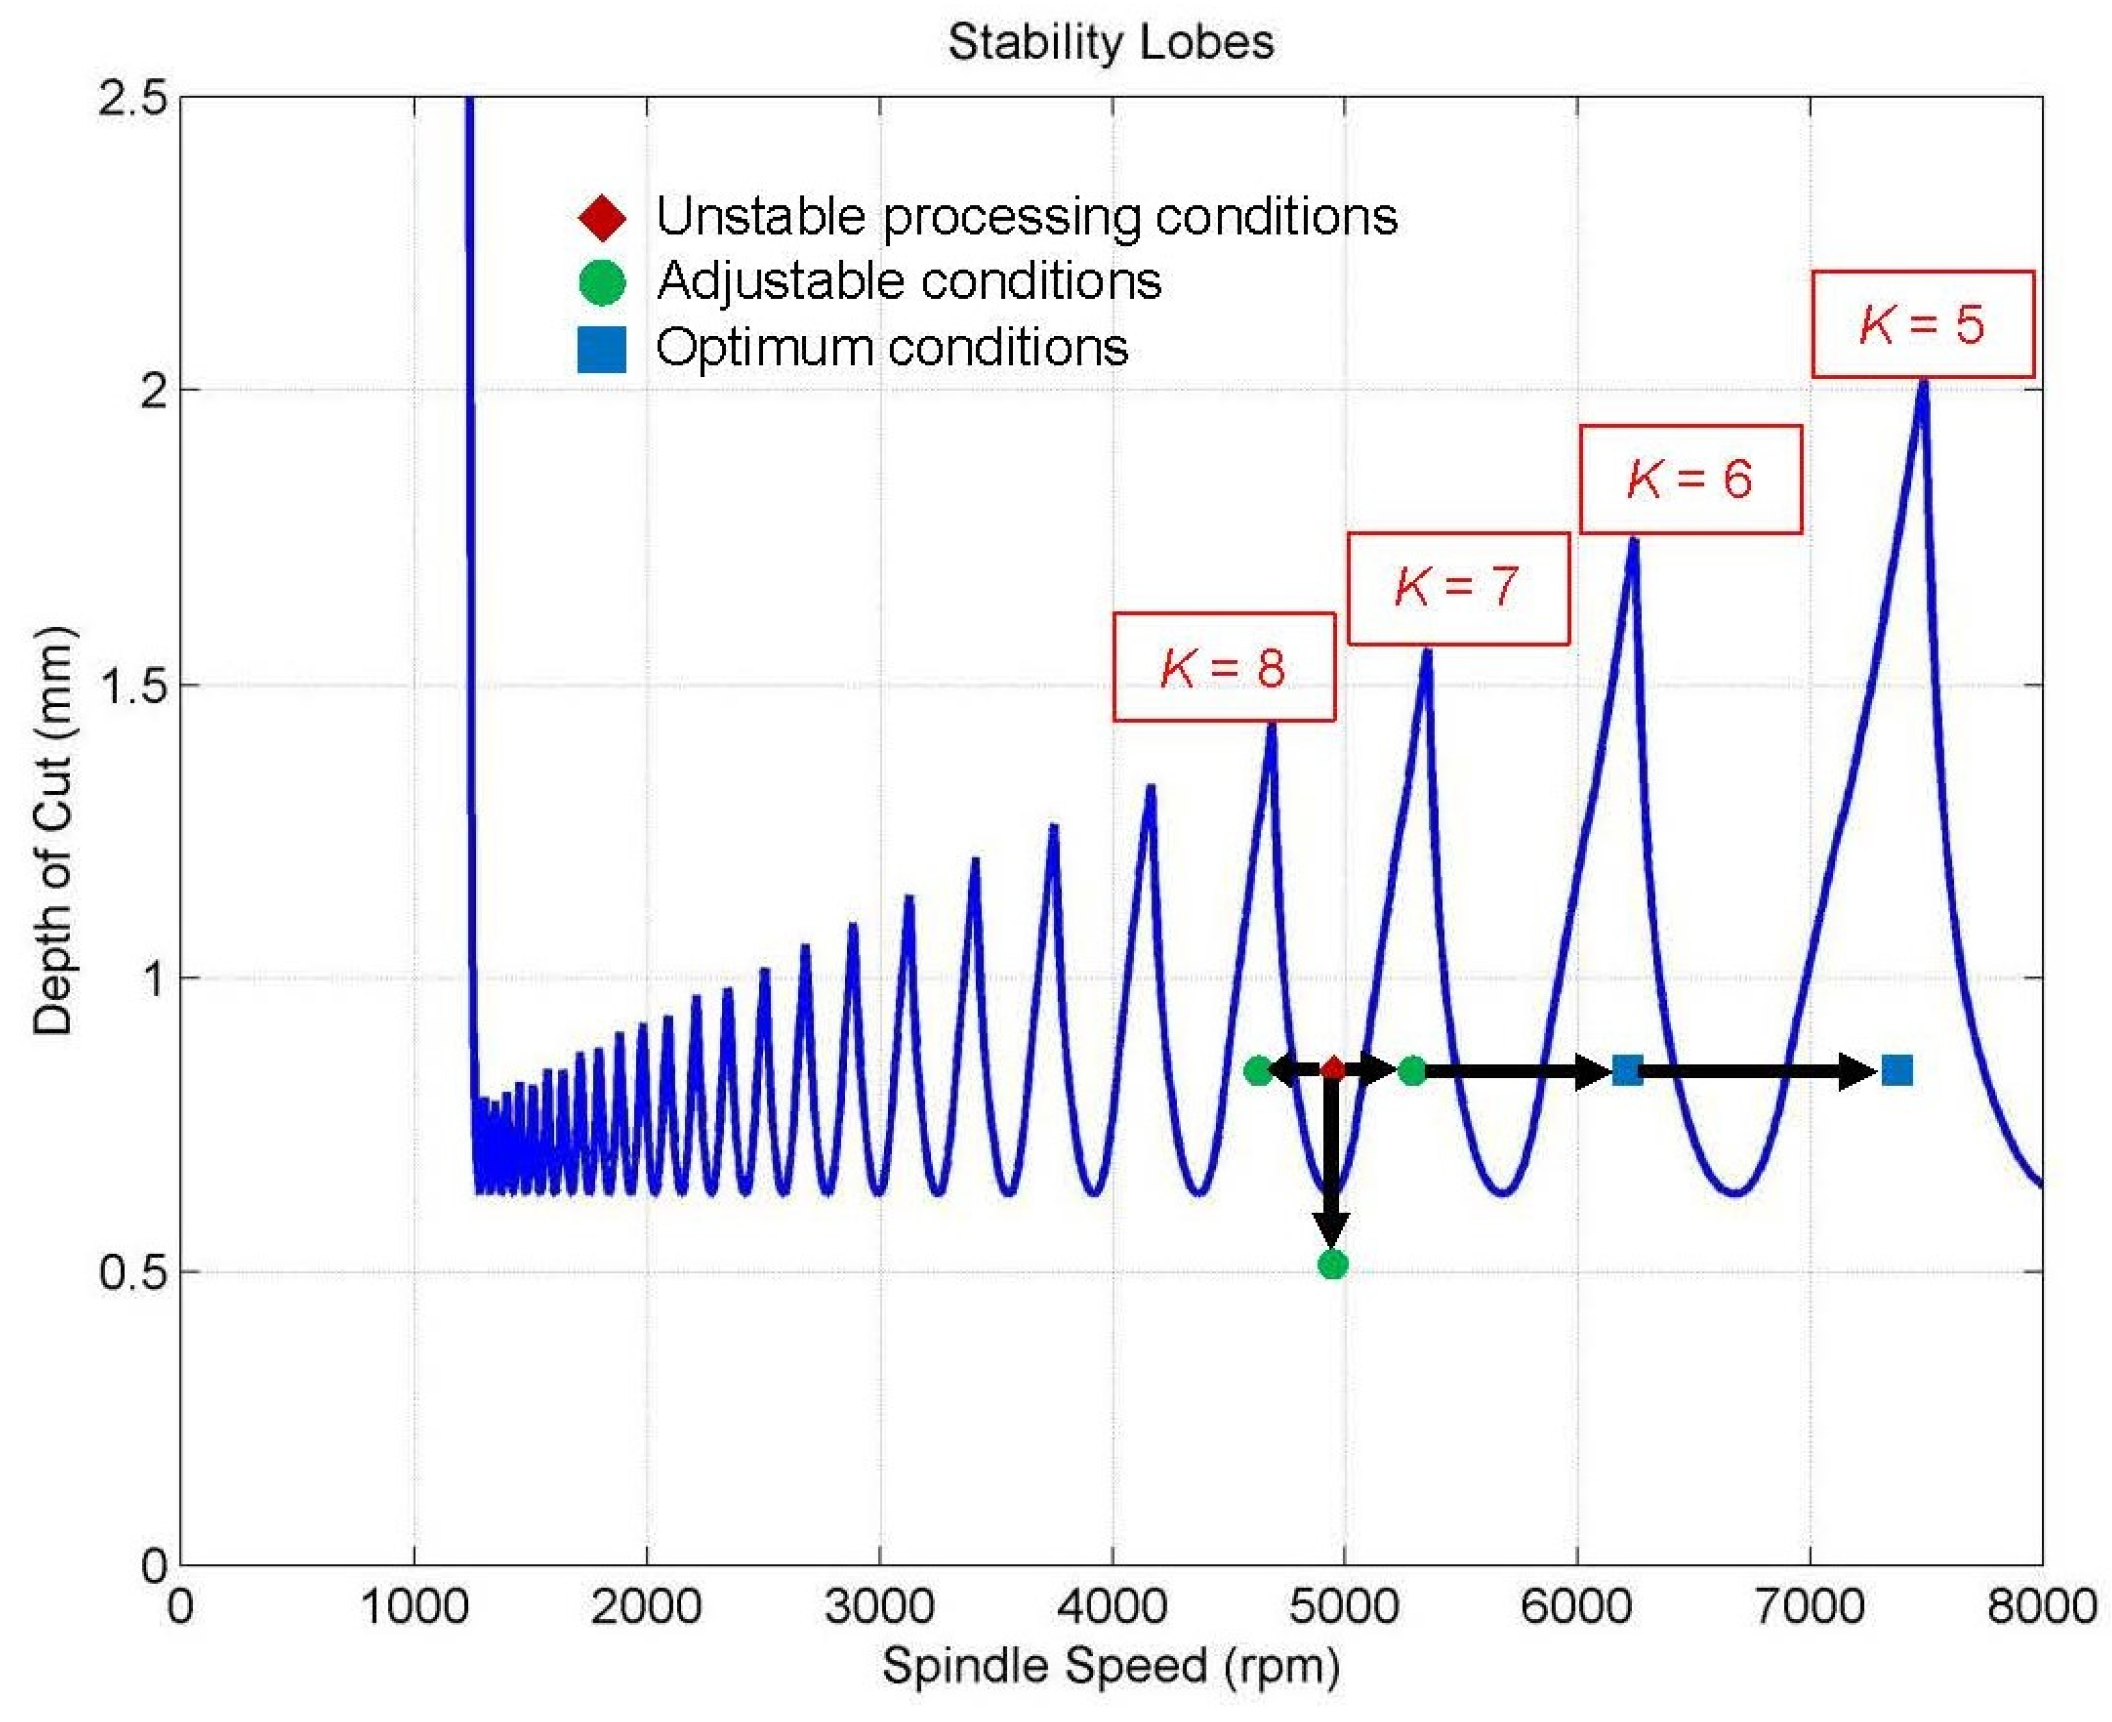
As shown in Figure 2, the relationships between the spindle speed and the depth of the cut, which are named the stability lobes, can be obtained from the transfer function of the vibration system mentioned above. The results shown in Figure 2 can also be obtained by subjecting the cutter to a percussion test. In the milling process, the machining parameters may be located in the upper region of the stability lobes (for example, the red diamond indicated in Figure 2), and this also means that cutting instability occurs. To prevent the occurrence of chatter, two methods can be used: one is to reduce the axial cutting depth and the other is to change the spindle speed. For example, as shown in Figure 2, the red diamond can be moved to the locations of the green dots or blue squares, which are stable regions. As the axial cutting depth cannot be directly changed during the machining process, we changed the real-time spindle speed to suppress the occurrence of chatter.
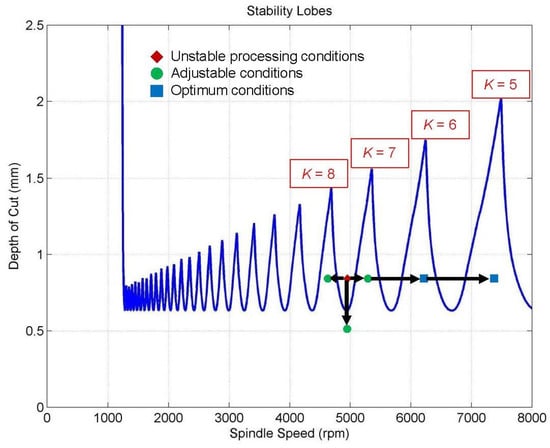
Figure 2.
Stability lobes and multiple factor K.
Differently from the detecting methods used by Munoa et al. [28]—i.e., with vibration sensors embedded in the spindle—we utilized a microphone to capture the audio signals and detect the tooth frequency. A general-purpose microphone was sufficient for the experiments since the monitored chatter frequency was around 2300 Hz. In addition, a line-directional microphone was chosen to minimize the effects of environmental noise. The fast Fourier transformation (FFT) was used to convert the audio frequencies from the time domain to the frequency domain promptly. The results were used to observe the distribution and intensity of the tooth frequency. We also used the amplitude to determine the magnitude of the tooth frequency when chatter occurred and calculated the multiple factor, which is denoted K and defined as the ratio between the tooth frequency and the vibration frequency detected by the microphone. The multiple factor K can indicate the position of the current machining parameter on the stability lobes. It can be expressed as:
where fc is the chatter frequency detected by the microphone. The purpose of this study was not to derive and predict the occurrence of chatter frequency but to recognize it using the detecting sensor (i.e., a microphone) and then implement the proposed suppression processes. Equation (5) was used to locate the possible position of the chatter frequency on the stability lobe diagram. When the value of K is an integer (i.e., the chatter frequency (fc) is an integer multiple of the product of the number of cutter teeth (Z) and the spindle speeds (S)), the chip thickness is consistent and cutting instability can be avoided to retain the machining quality since there is no phase shift between the cutting ripples. It also means that the machining parameters will be located at the peak values of the stability lobes, as shown in Figure 2, and the system vibration will be a kind of forced vibration.
As mentioned previously, we changed the real-time spindle speed to suppress chatter. Furthermore, considering that the stability lobes can be shifted by the effects of external disturbances and system defects, we gave priority to increasing the spindle speed to a specific value, as shown in Figure 2, which uses the peak value of the multiple factor K. To avoid cutting instability, the new spindle speed, indicated by Snew, can be obtained as:
where Knew denotes the nearby peak value of K that is input into the simulation system.
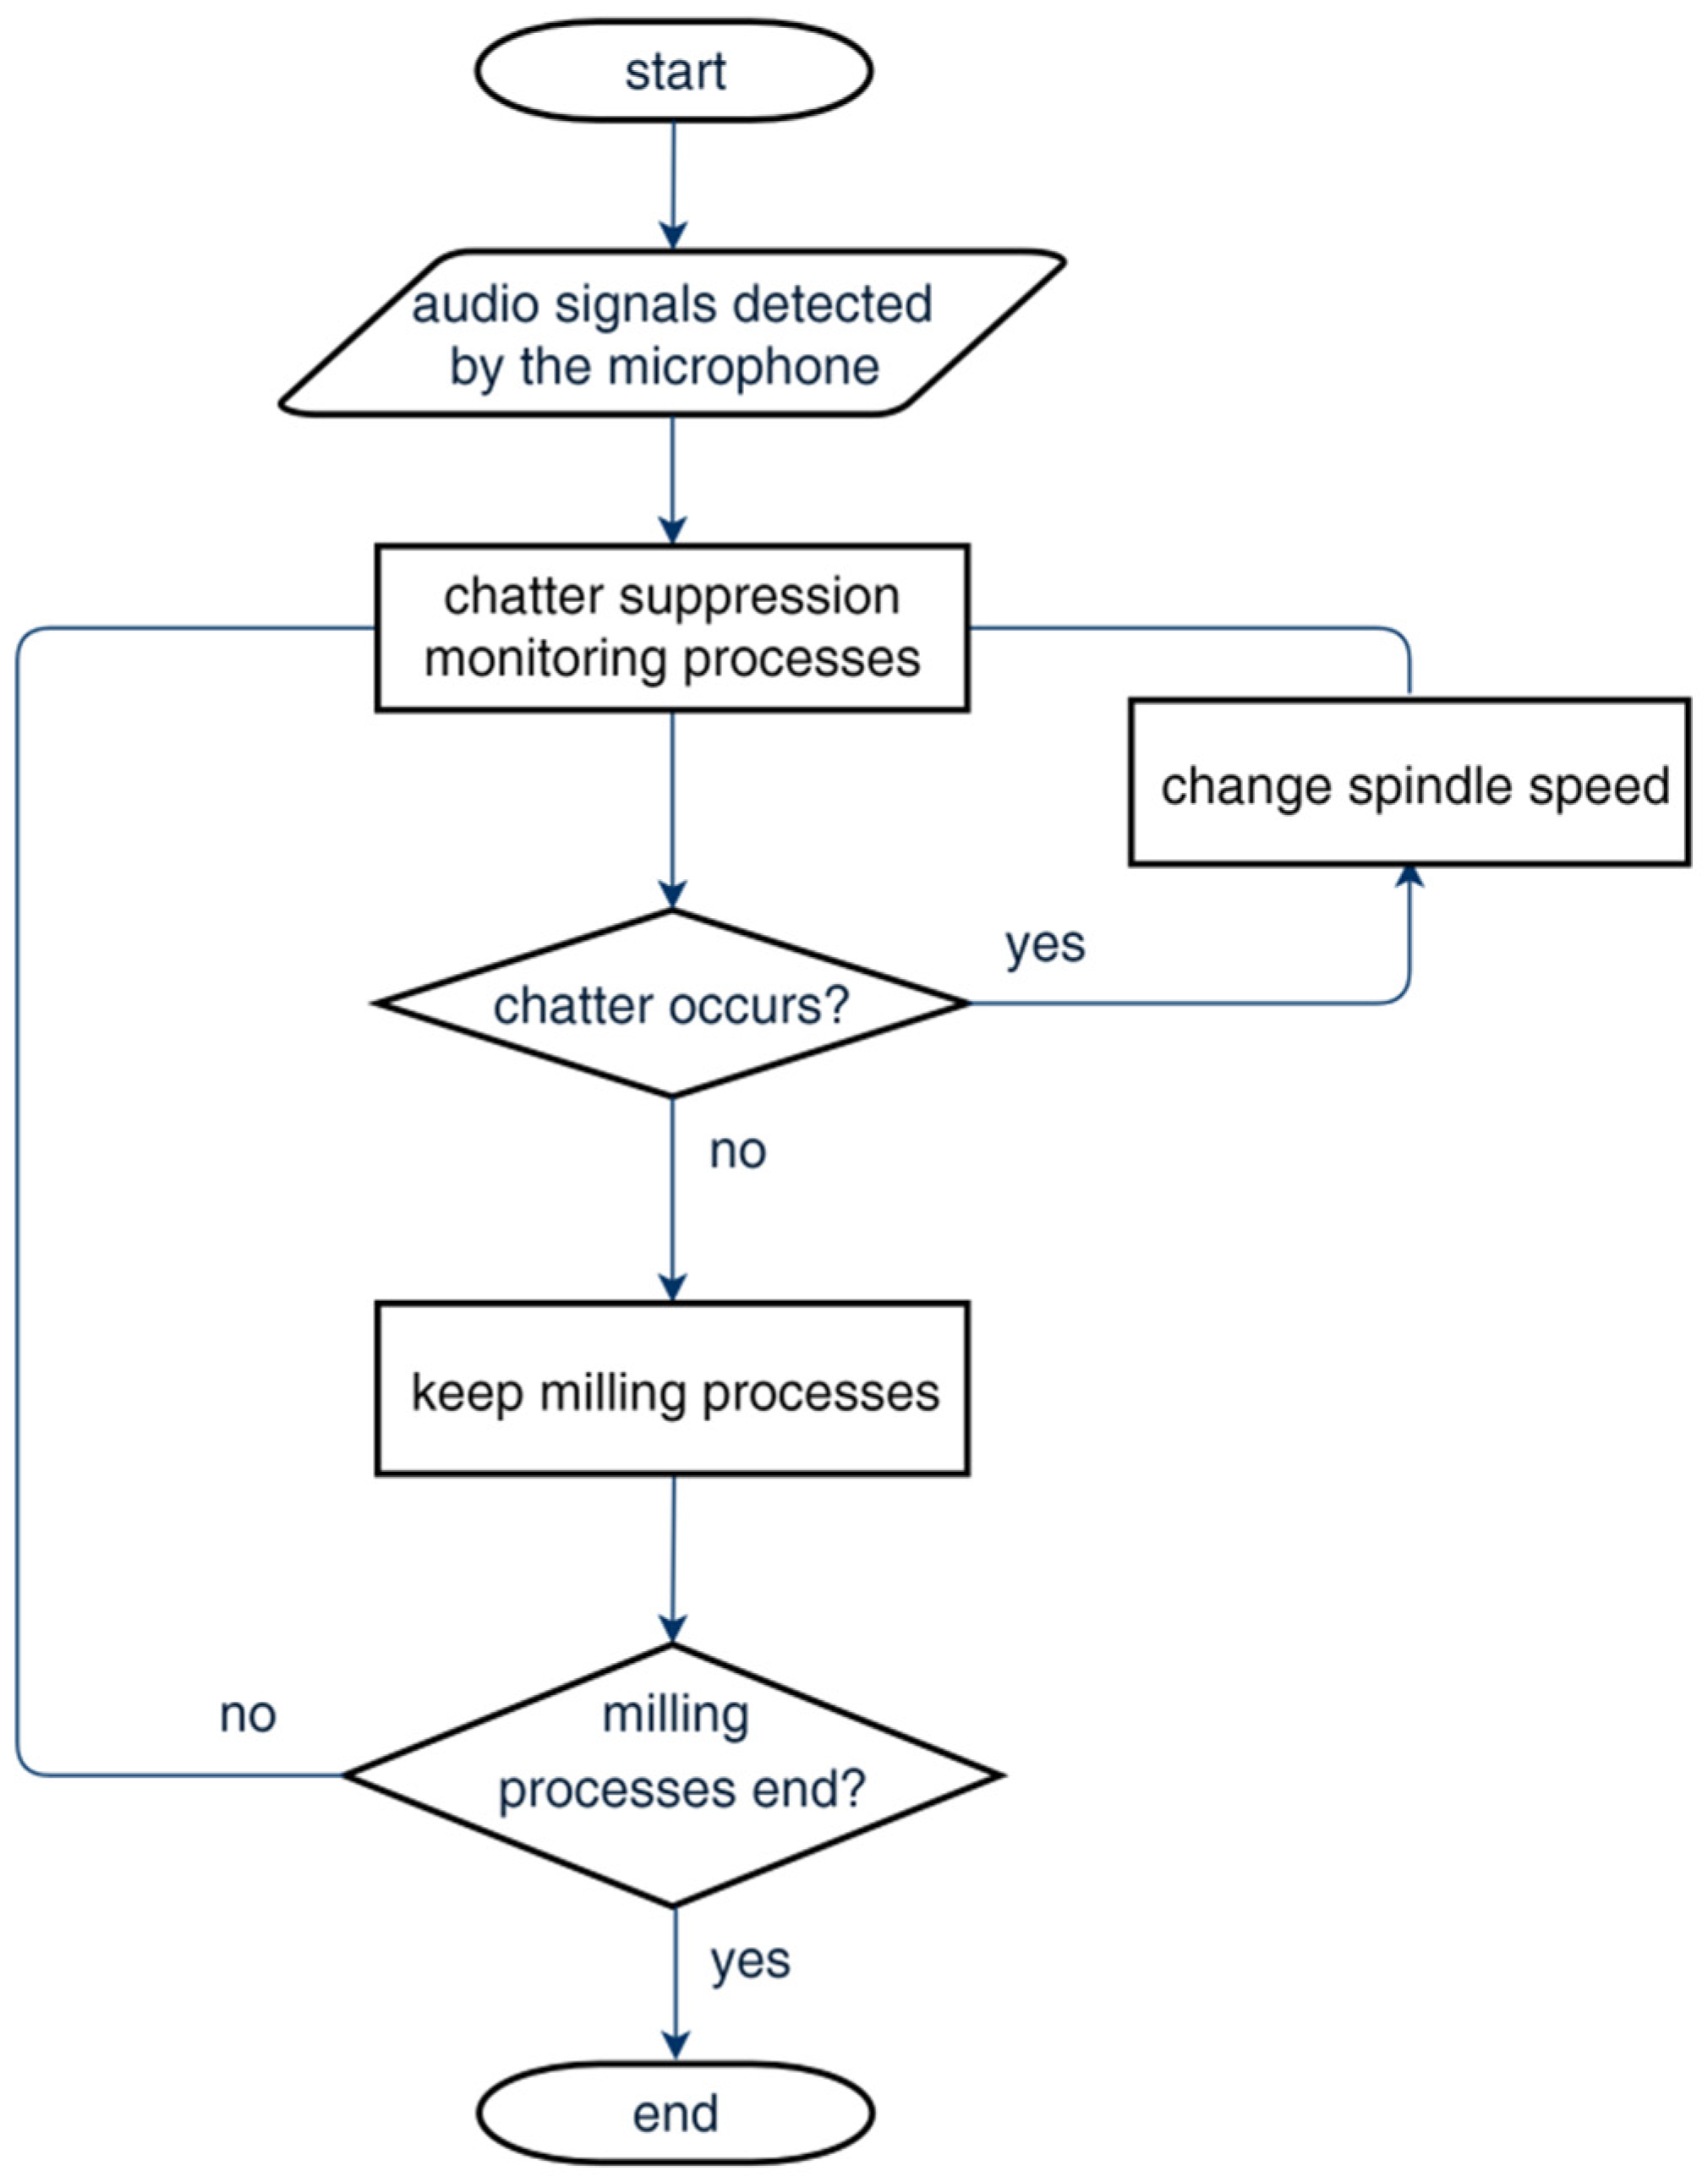
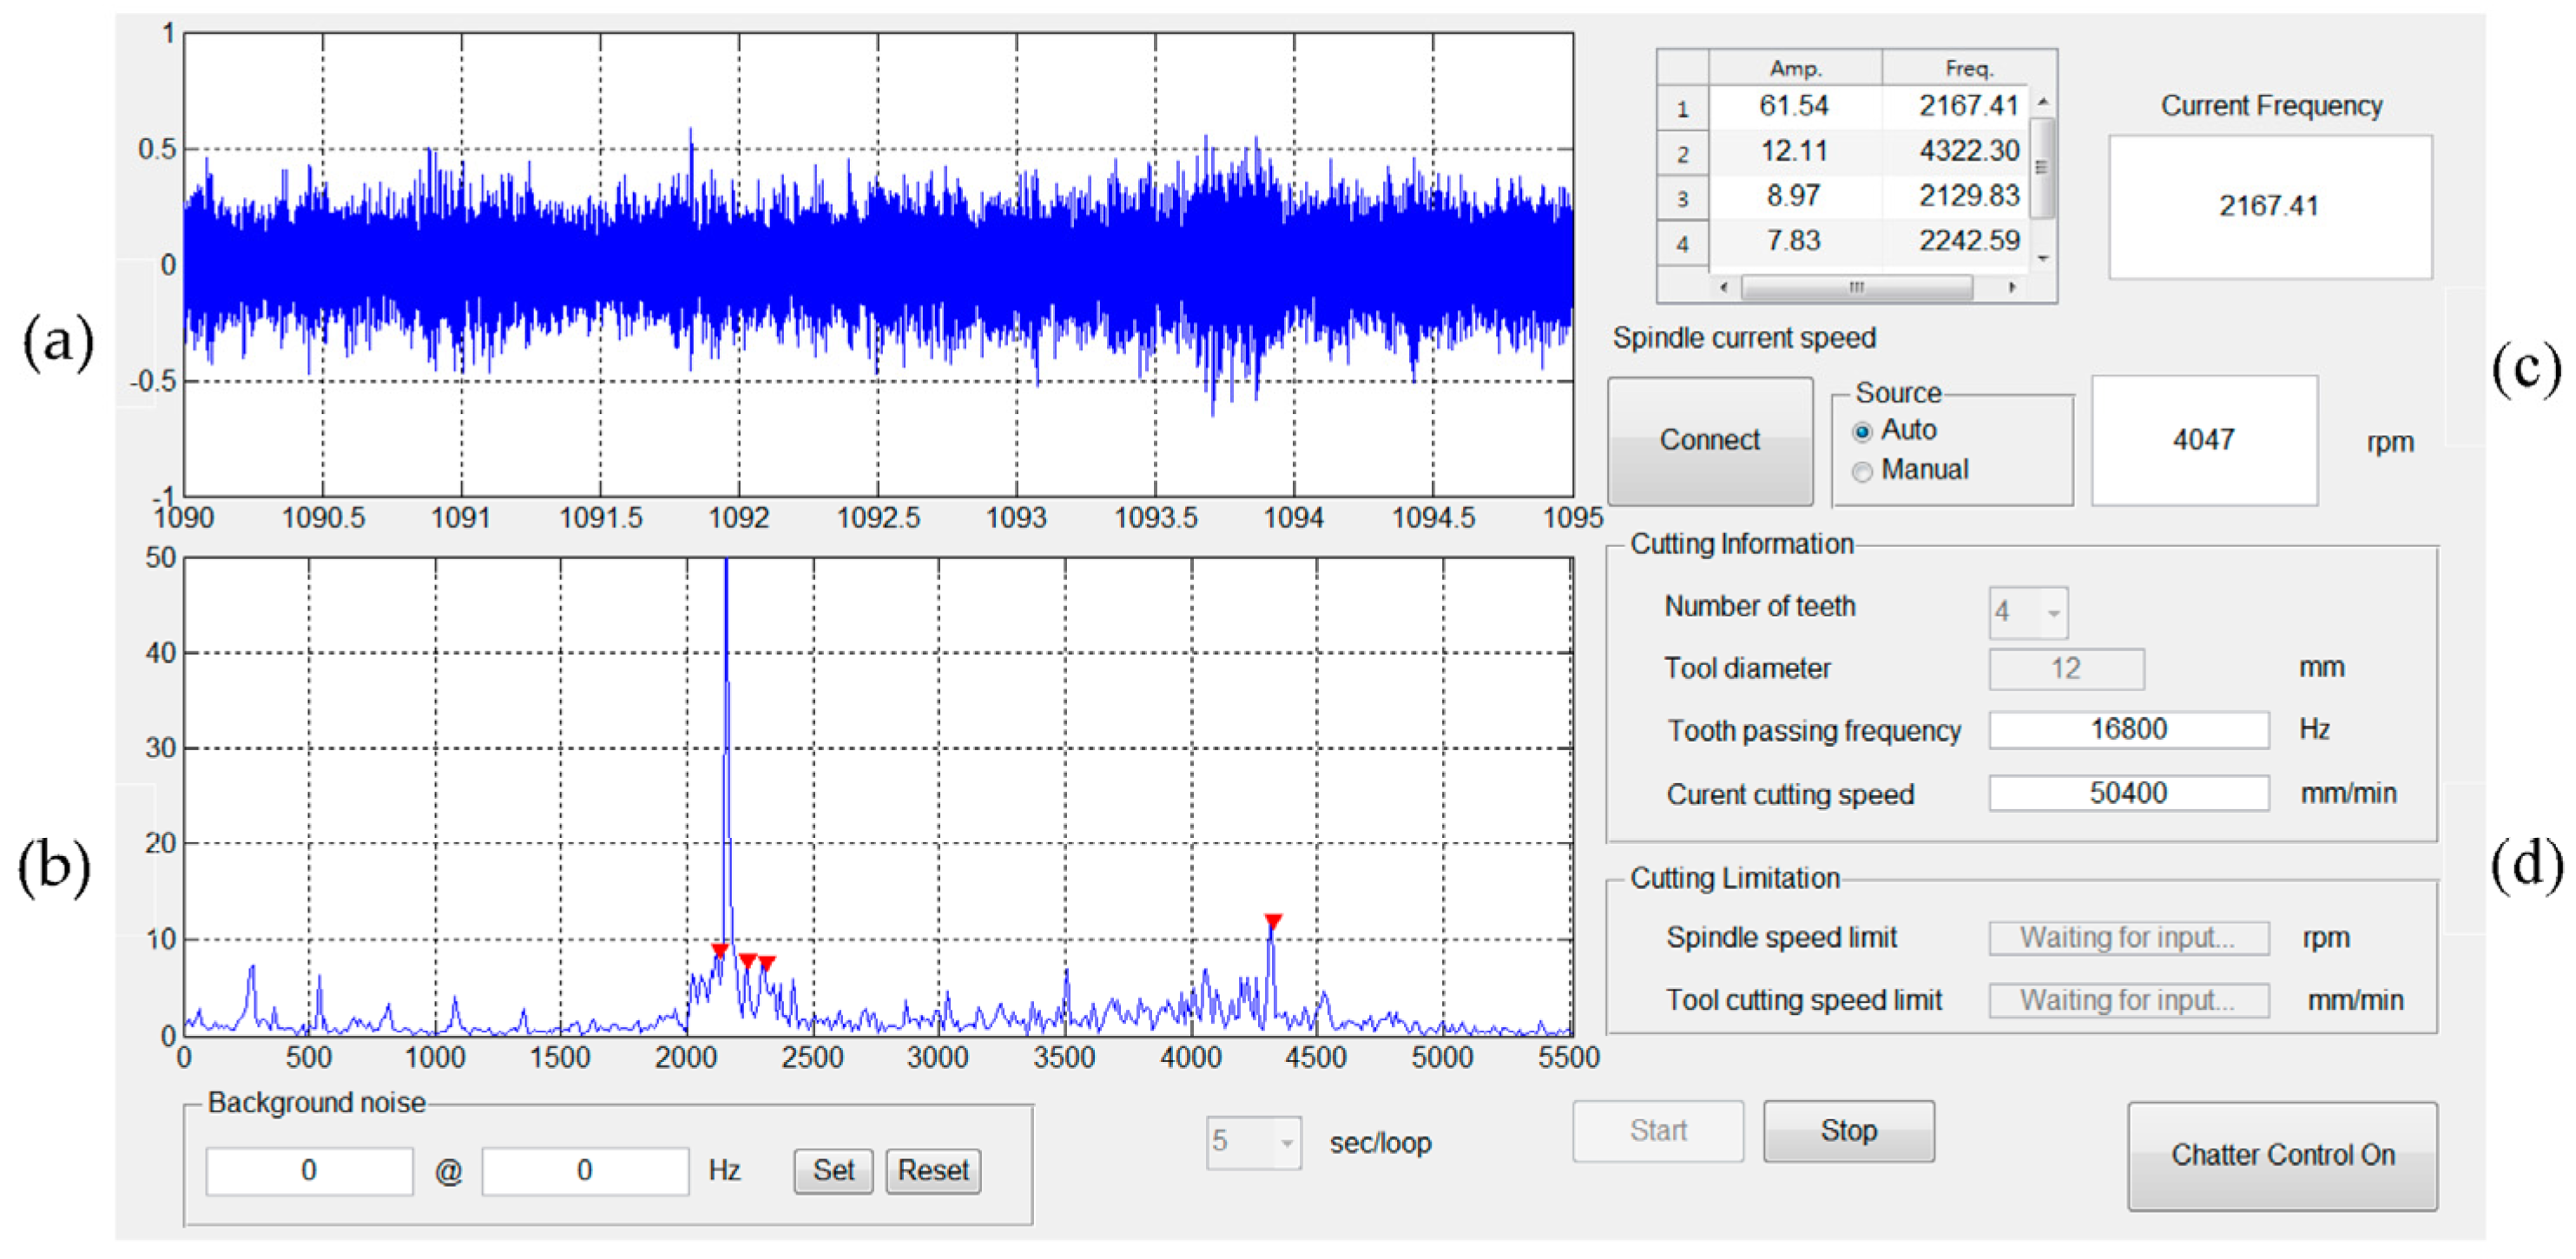
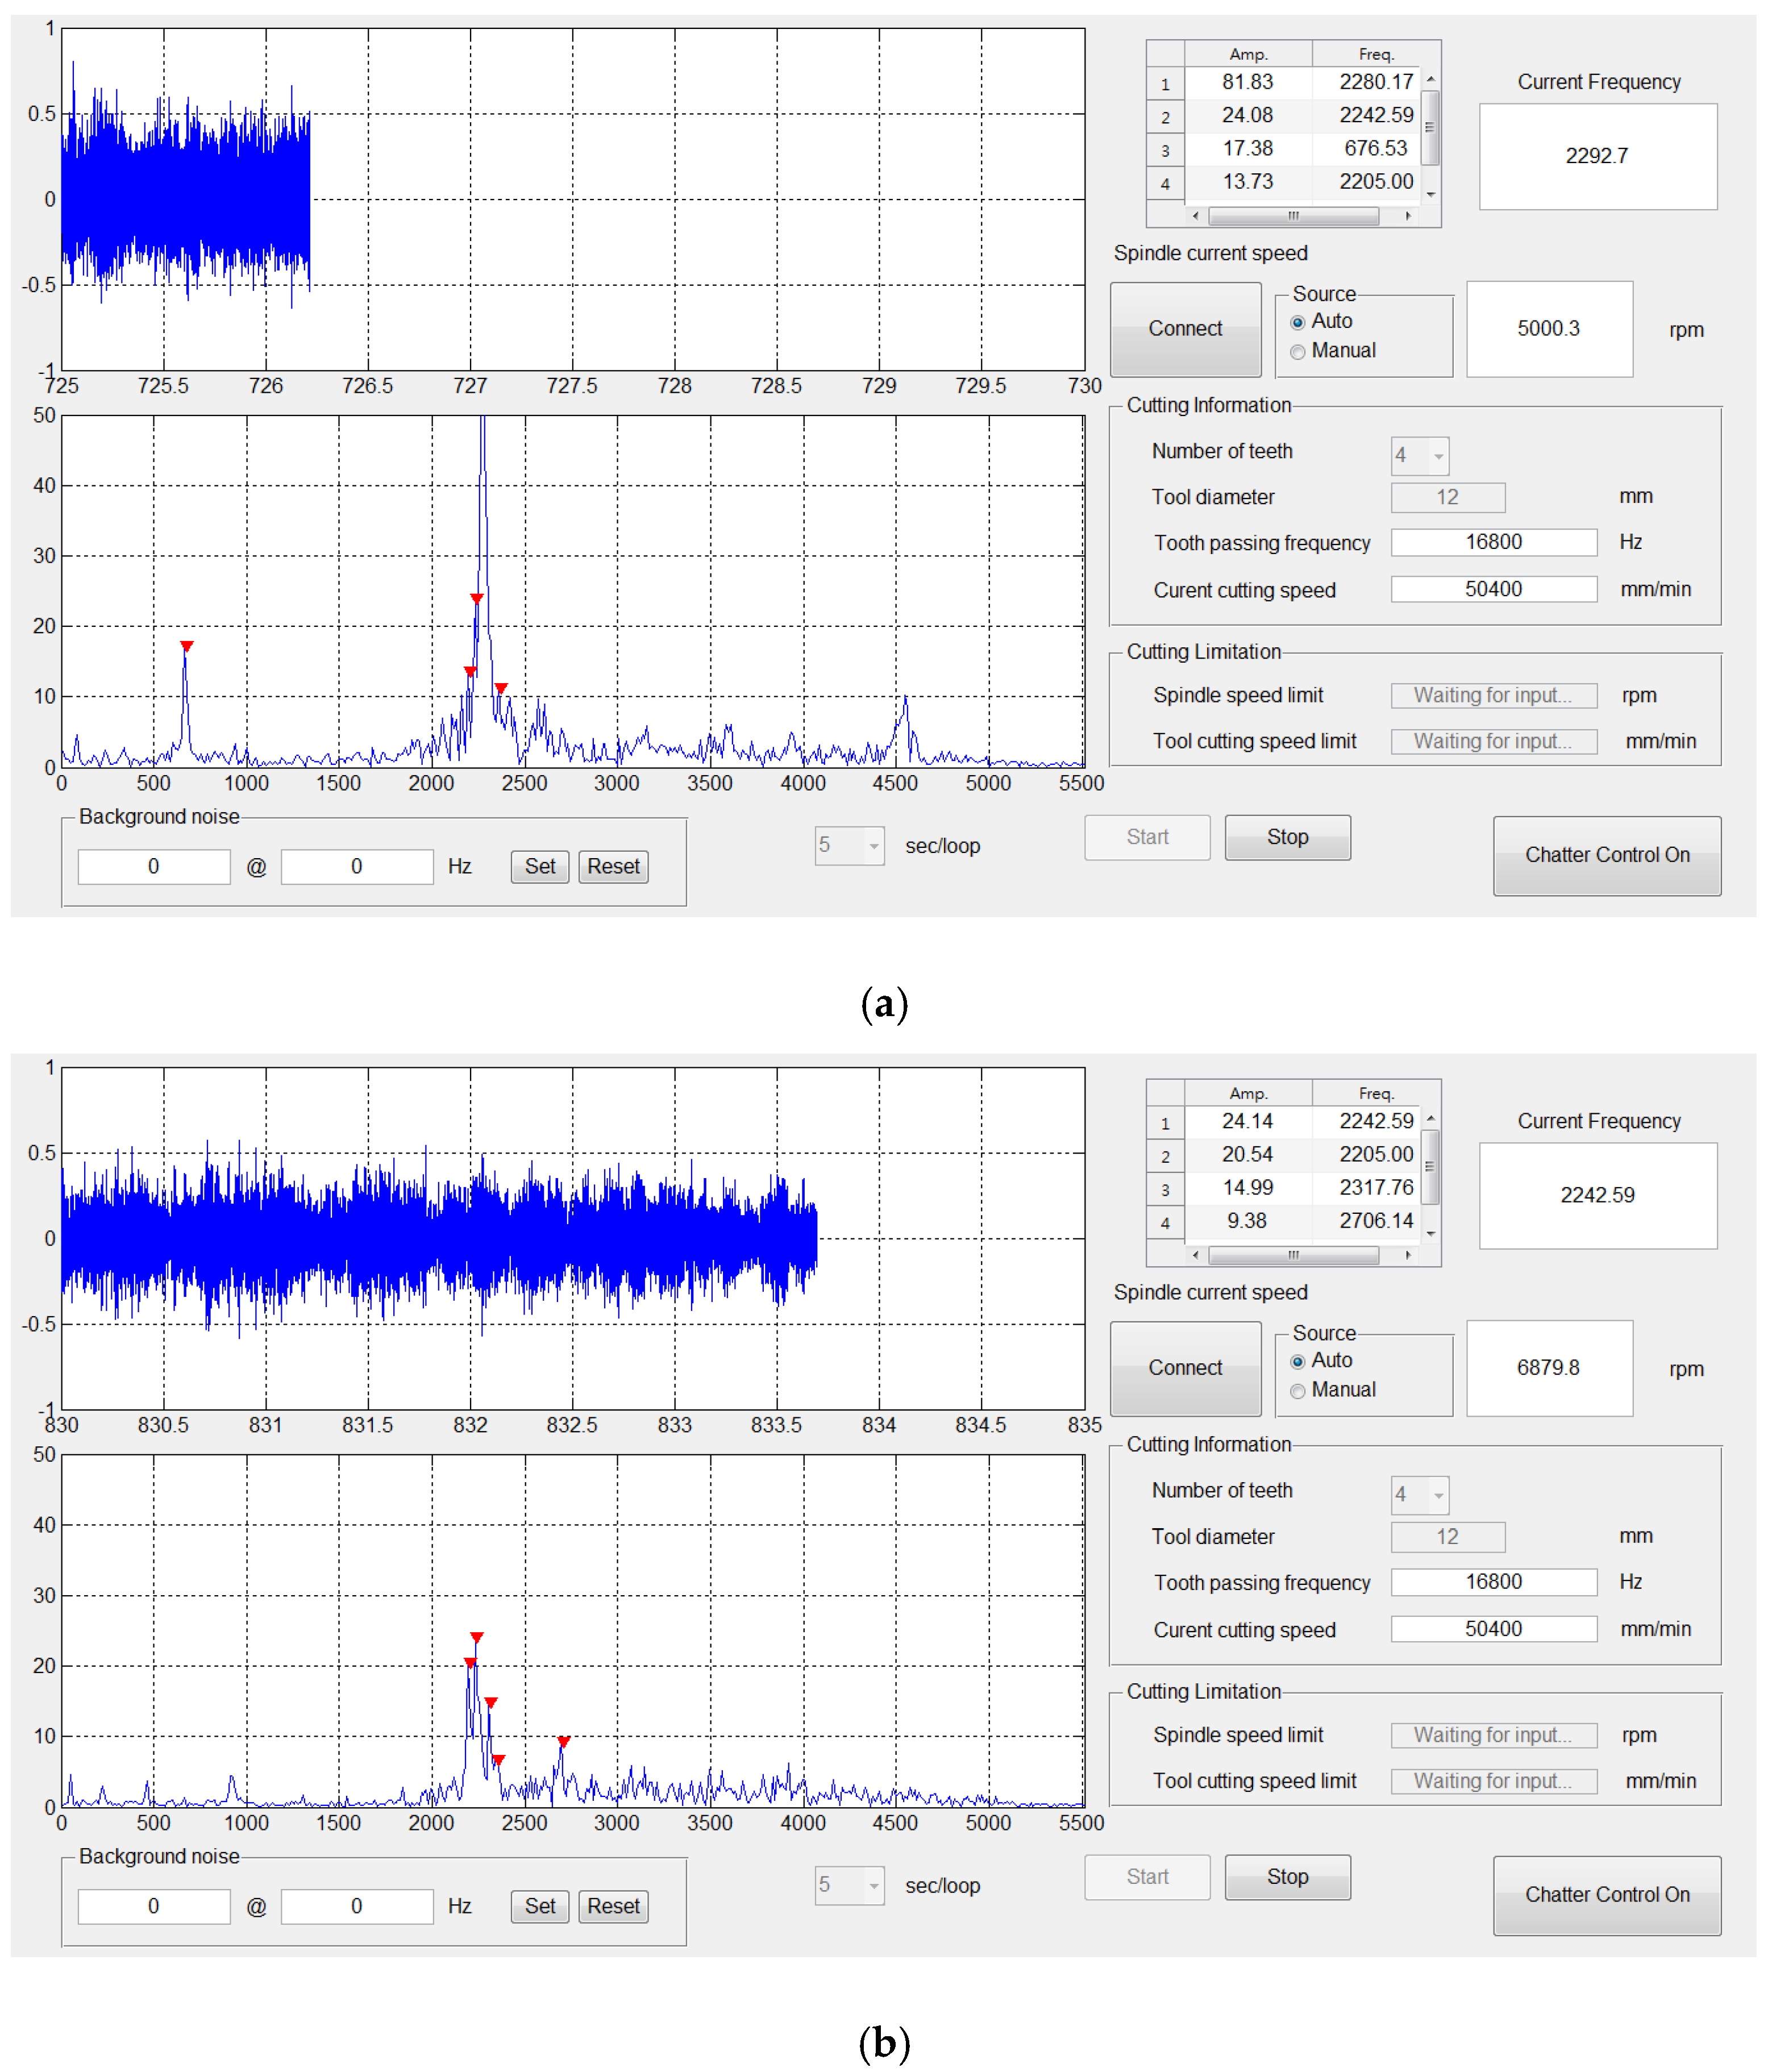
The flowchart of the PC-based program for chatter suppression developed using MATLAB is illustrated in Figure 3, and the operation interface of the program is shown in Figure 4. The audio frequency detected by the microphone is shown in the time domain in Figure 4a, and the user can select the amount of data displayed in the diagram. Figure 4b shows the spectrum, which can be instantly obtained by using the FFT on the audio frequency, and the user can input the background noise conditions to filter the audio signals with frequencies or intensity that are too low. The part of the interface in Figure 4c lists the frequencies with the top five intensities and reveals the current spindle speed. Users can manually input the spindle speed into the system or automatically read the spindle speed from the controller in the milling machine. In the part of the interface shown in Figure 4d, the user can input the conditions of the cutter and the upper limit of the cutting conditions to avoid the spindle or tool speed being too high. After detecting the frequency and intensity of chatter, we could command the controller to change the spindle speed and achieve real-time chatter suppression when chatter occurs.
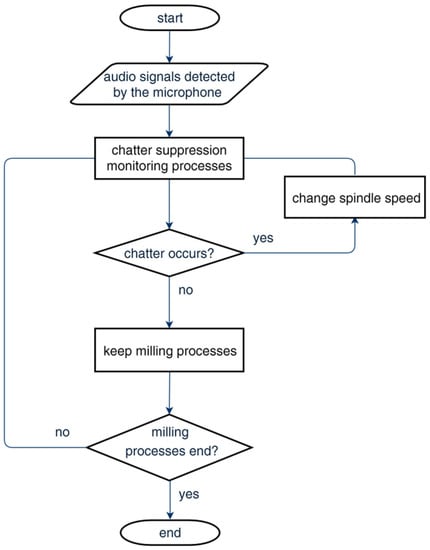
Figure 3.
Flowchart of chatter suppression program.
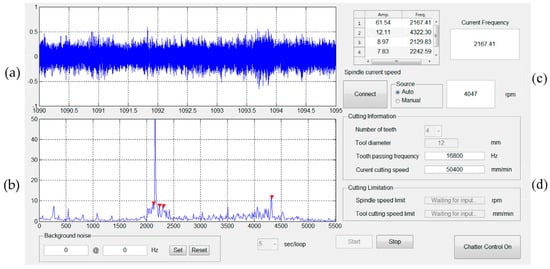
Figure 4.
Operation interface for chatter suppression program: (a) microphone audio frequency in the time domain, (b) FFT spectrum of the audio frequency, (c) frequency information and current spindle speed, (d) machining information and conditions.
4. Optimization of Milling Parameters
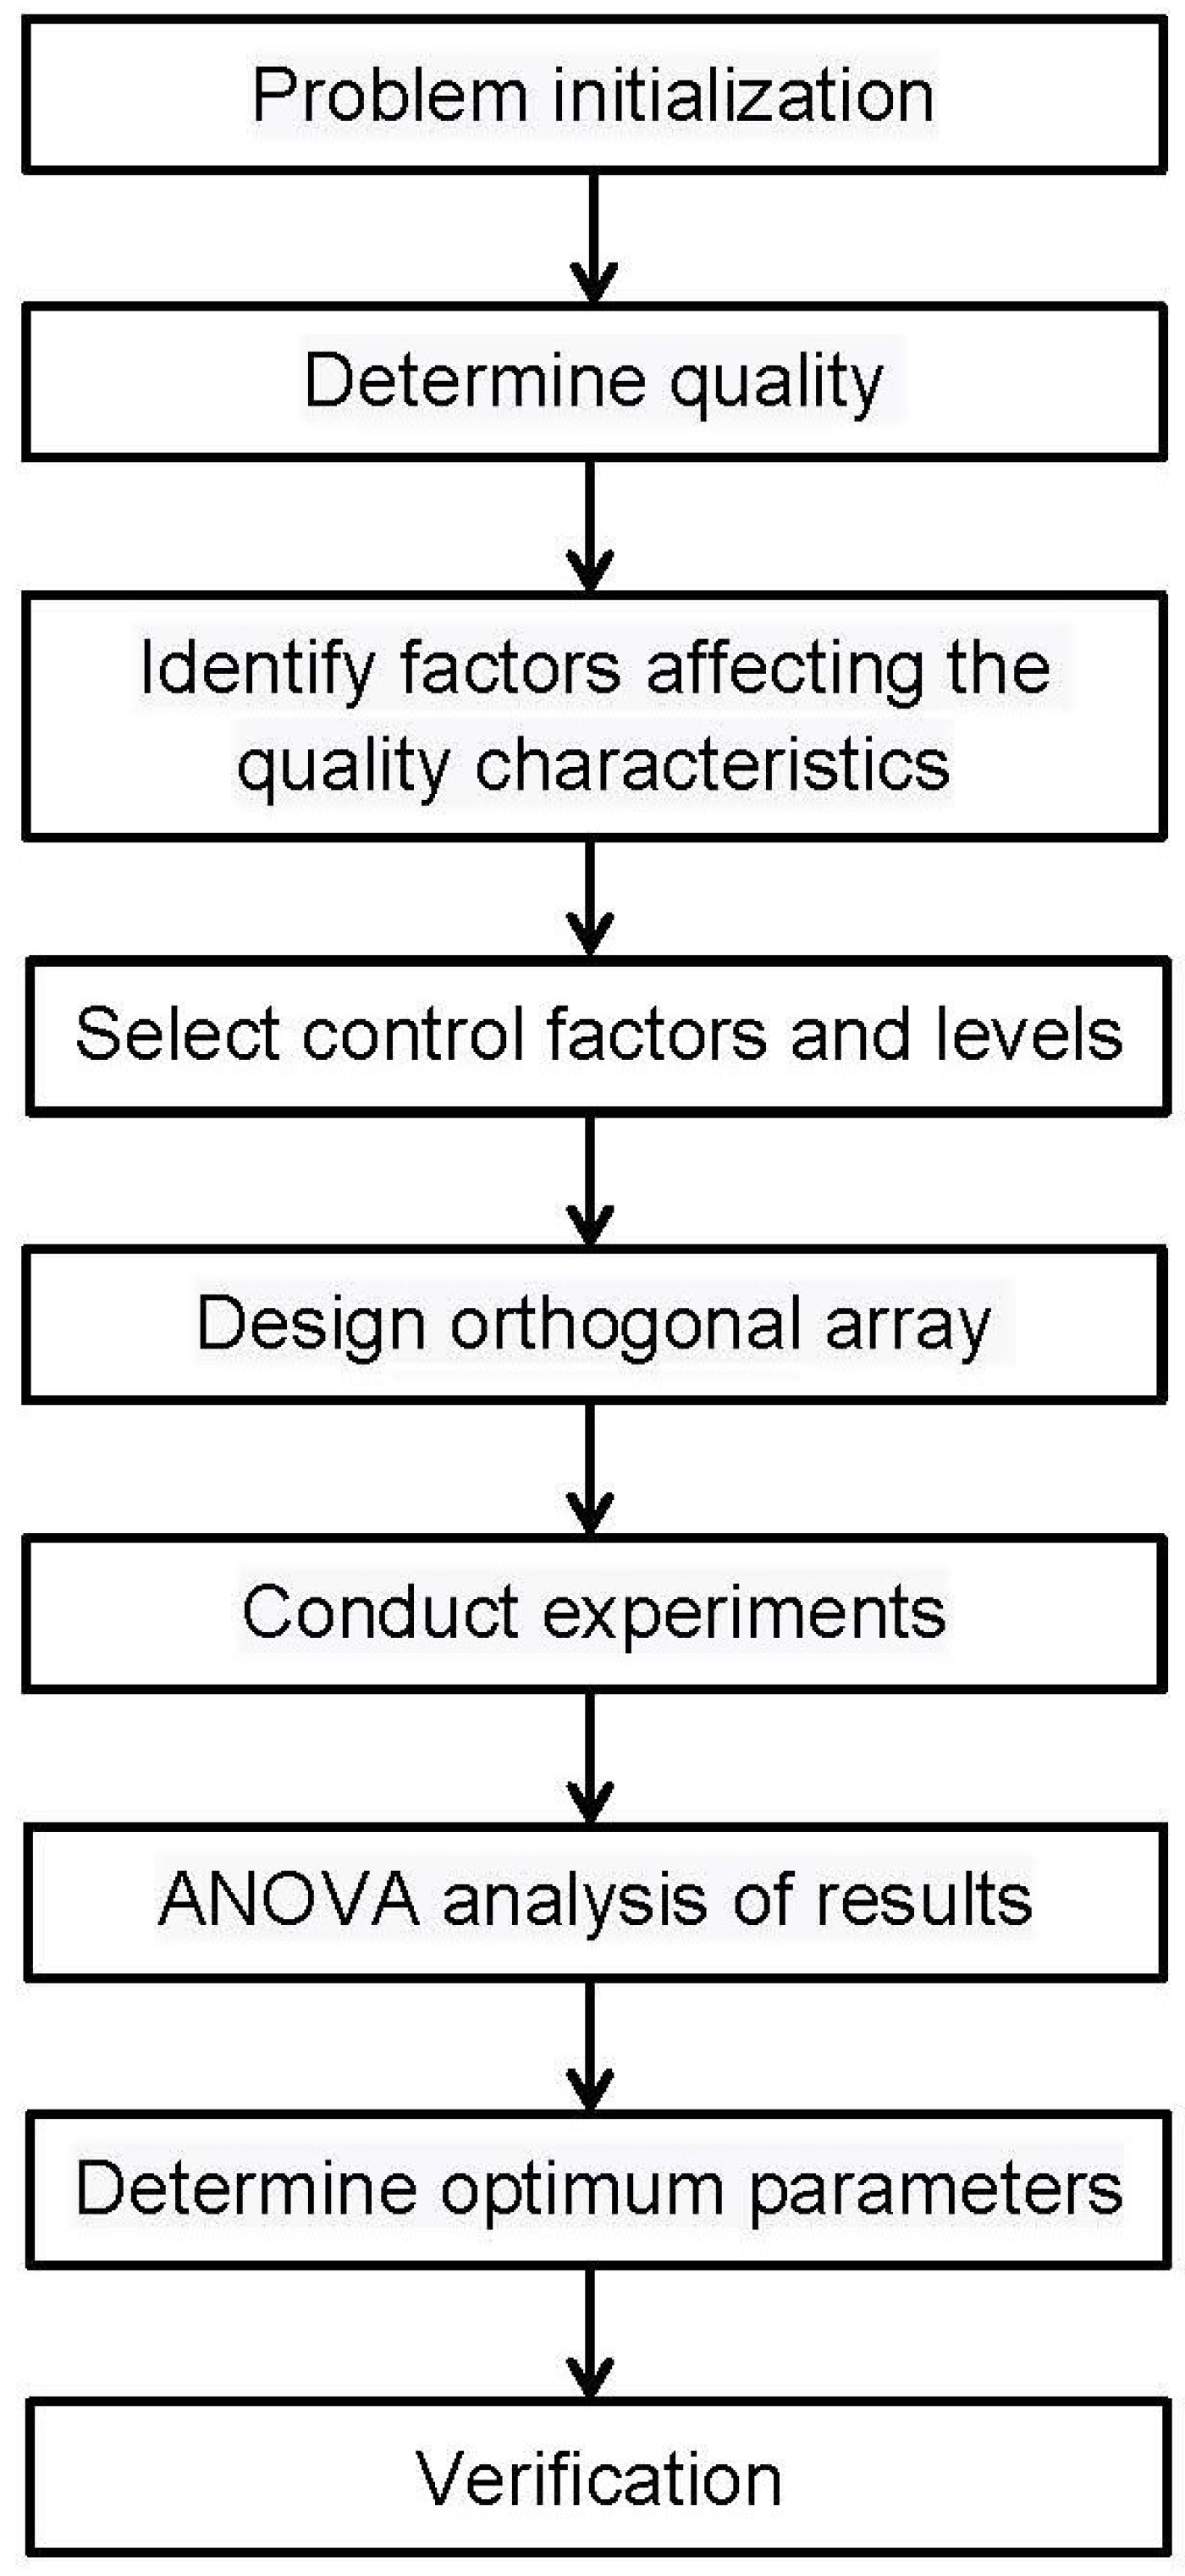
In accordance with the procedures of the Taguchi method [29,30] shown in Figure 5, we investigated the problem of optimizing the milling parameters in fine machining processes for scroll manufacturing and determined the quality characteristics to be the scroll profile errors and surface roughness. Considering the factors affecting the scroll’s quality characteristics, such as the tool path, feed rate, cutting depth, cutter tooth, etc., we selected the tool path, feed rate, and rotational speed of spindle as the control factors. For the experiments, we designed an L9(33) orthogonal array with three factors, each being at three levels. After the machining experiments, the profile errors and surface roughness of the scrolls were measured. The signal-to-noise (S/N) ratios were calculated and analysis of variance (ANOVA) was conducted to determine the optimum combination of machining parameters for the tool path, feed rate, and rotational speed of spindle that would lead to minimum profile errors and surface roughness. Finally, validation experiments were implemented to verify the obtained results concerning the optimum combination of machining parameters.
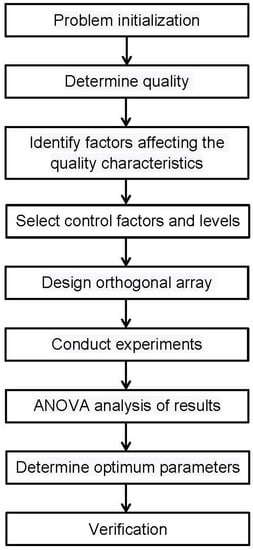
Figure 5.
Procedures of the Taguchi method.
5. Experimental Results and Discussion
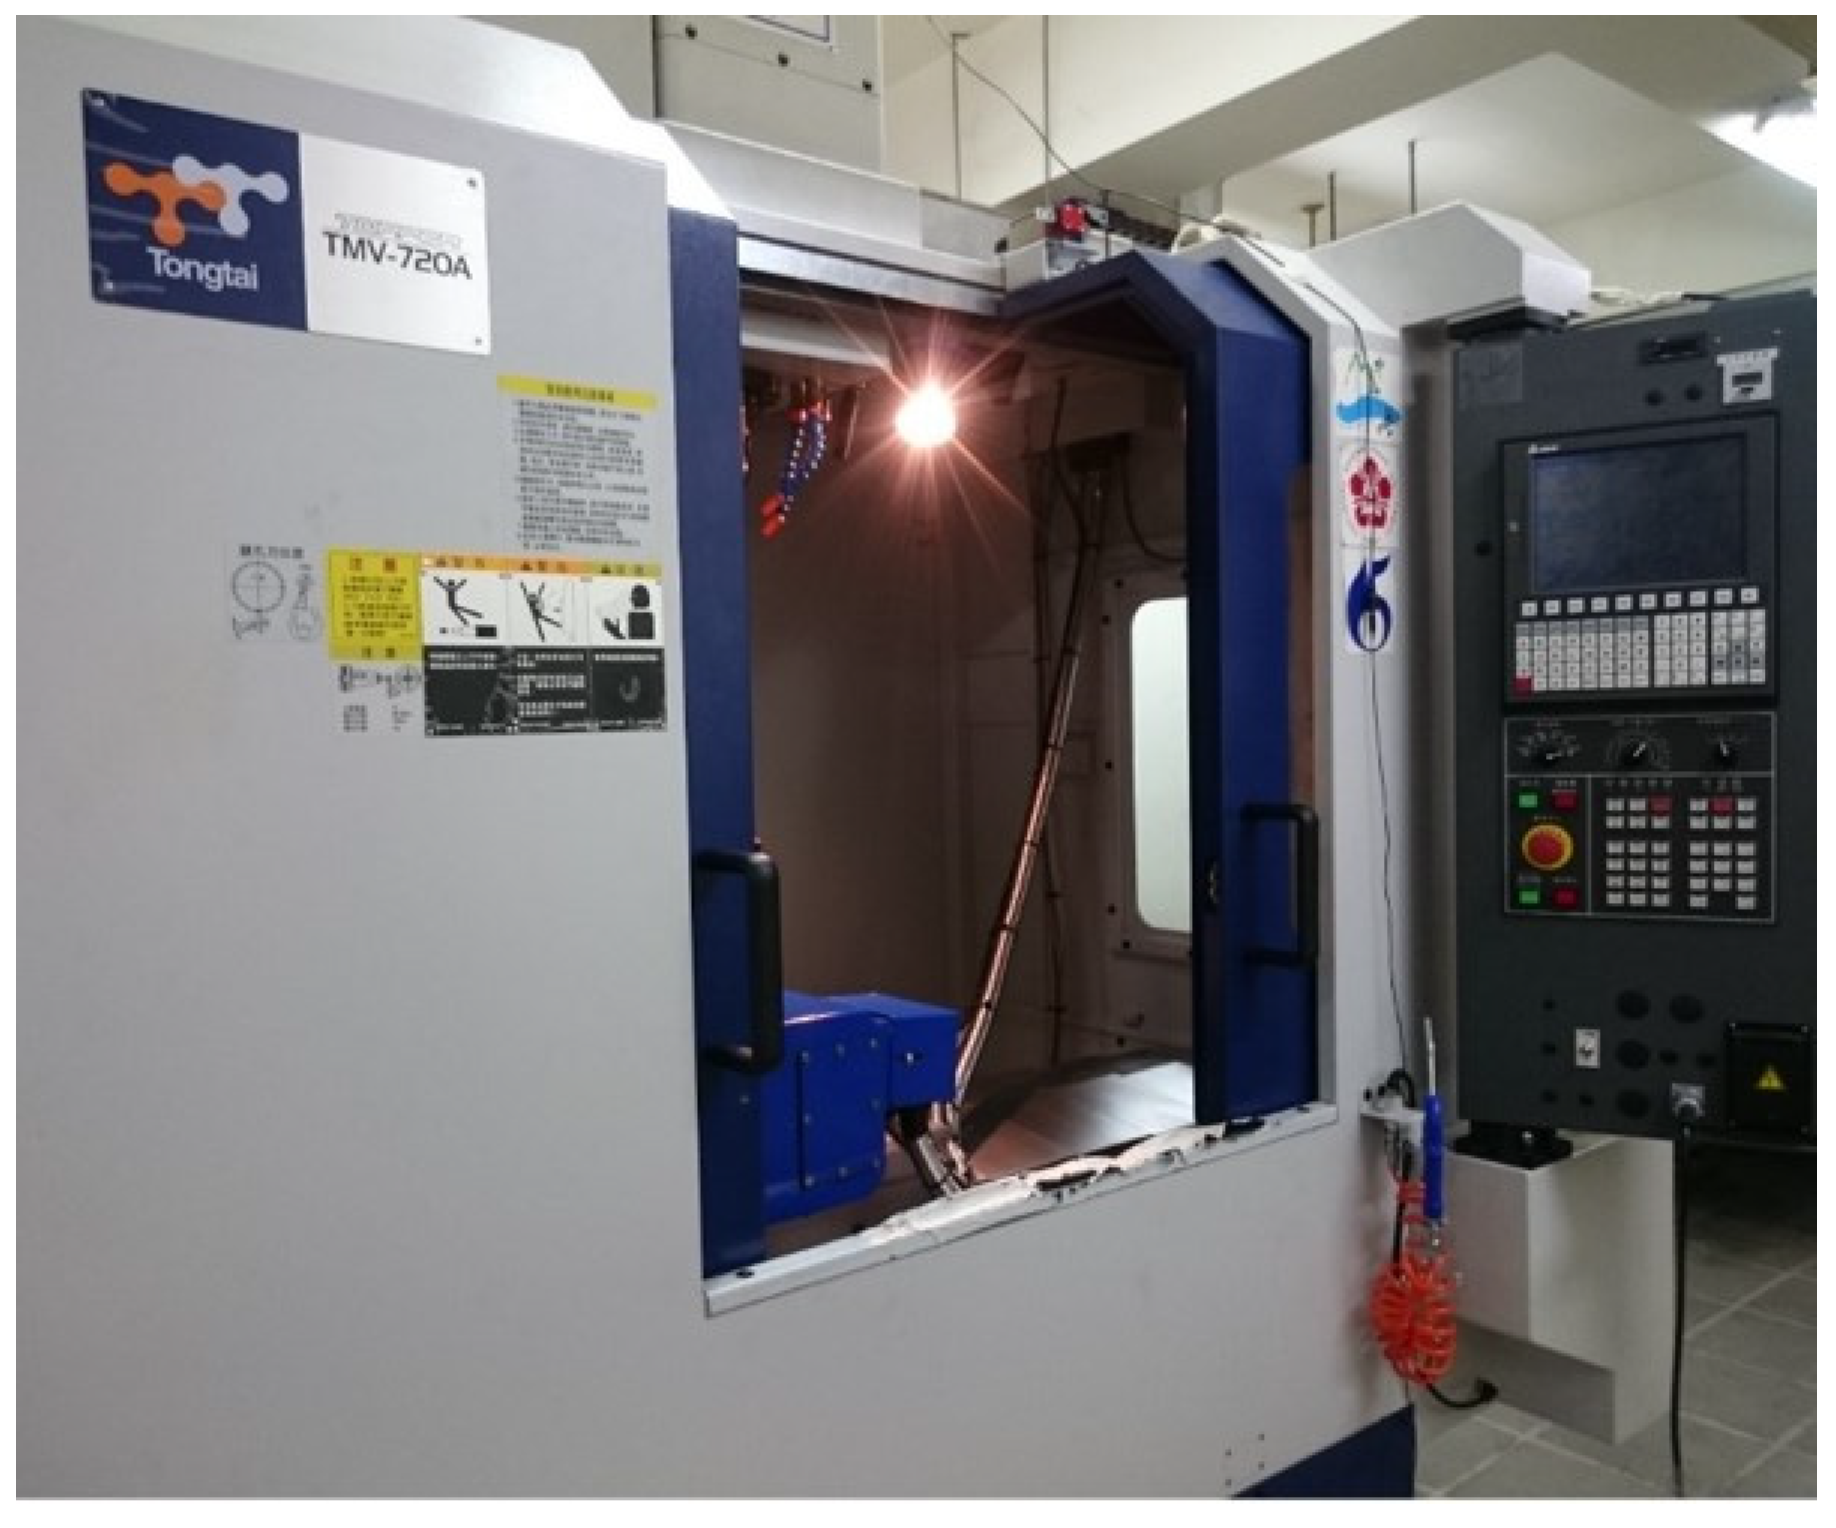
Figure 6 shows the vertical milling machine utilized in this study to implement the experiments testing the methods described in the previous sections. In these experiments, the material of the workpieces was aluminum–magnesium alloy Al6061, and the diameter was 96.0 mm and the height 75.0 mm. The maximum tensile strength of Al6061 is 150 MPa, and the maximum yield strength is 83 MPa.
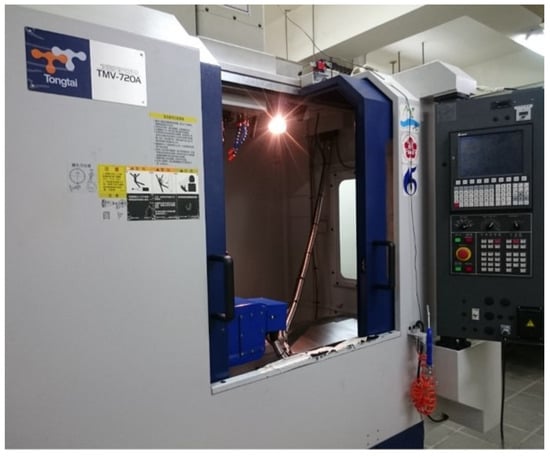
Figure 6.
Tongtai TMV-720A vertical milling machine.
5.1. Tests of Adaptive Feed Rate Planning
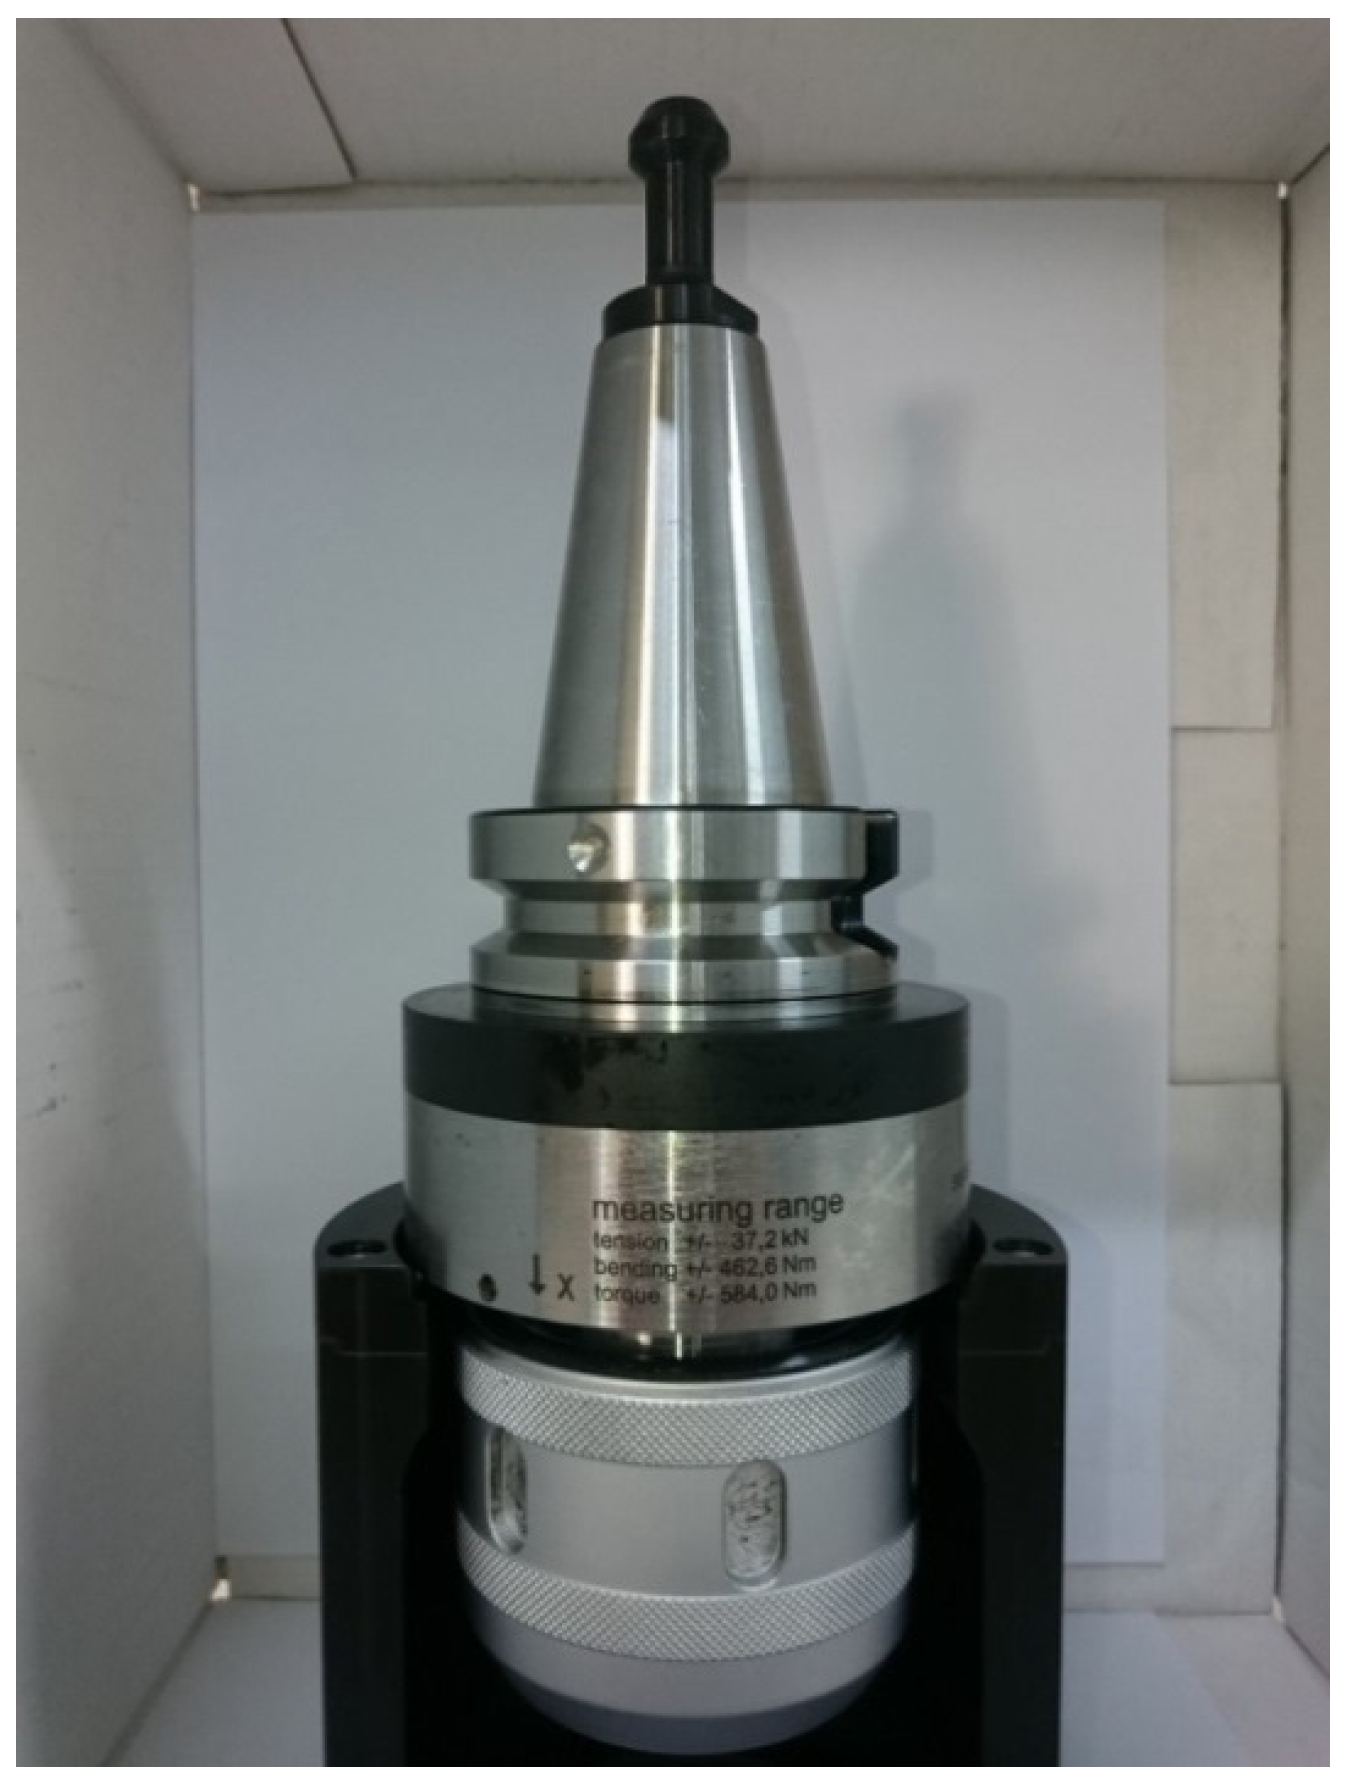
To verify the effects of the adaptive feed rate planning on the promotion of machining efficiency and the consistency of machining quality, we conducted experimental tests on the rough machining processes of scrolls (Video S1: Scroll machining processes). In these experiments, the cutter was a Starpoint S2009, the specifications of which are shown in Table 1. As shown in Figure 7, a tool holder embedded with sensors was used to measure the tension, bending moment, and torque. Table 2 shows the specifications of the tool holder, which was based on a BT-40. As the data transmission frequency was 2.45 GHz, the sampling rate reached up to 1.8 kHz, and the spindle speed was 6000 rpm. This was sufficient for experiments on the estimation of the dynamic performance.

Table 1.
Specifications of the Starpoint S2009 cutter.
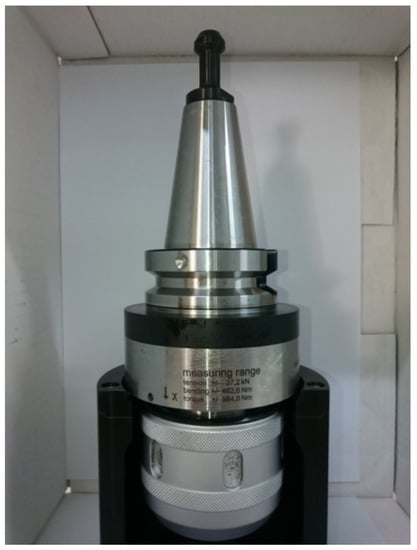
Figure 7.
Tool holder embedded with sensors (Spike® from Pro-micron GmbH).

Table 2.
Specifications of the tool holder.
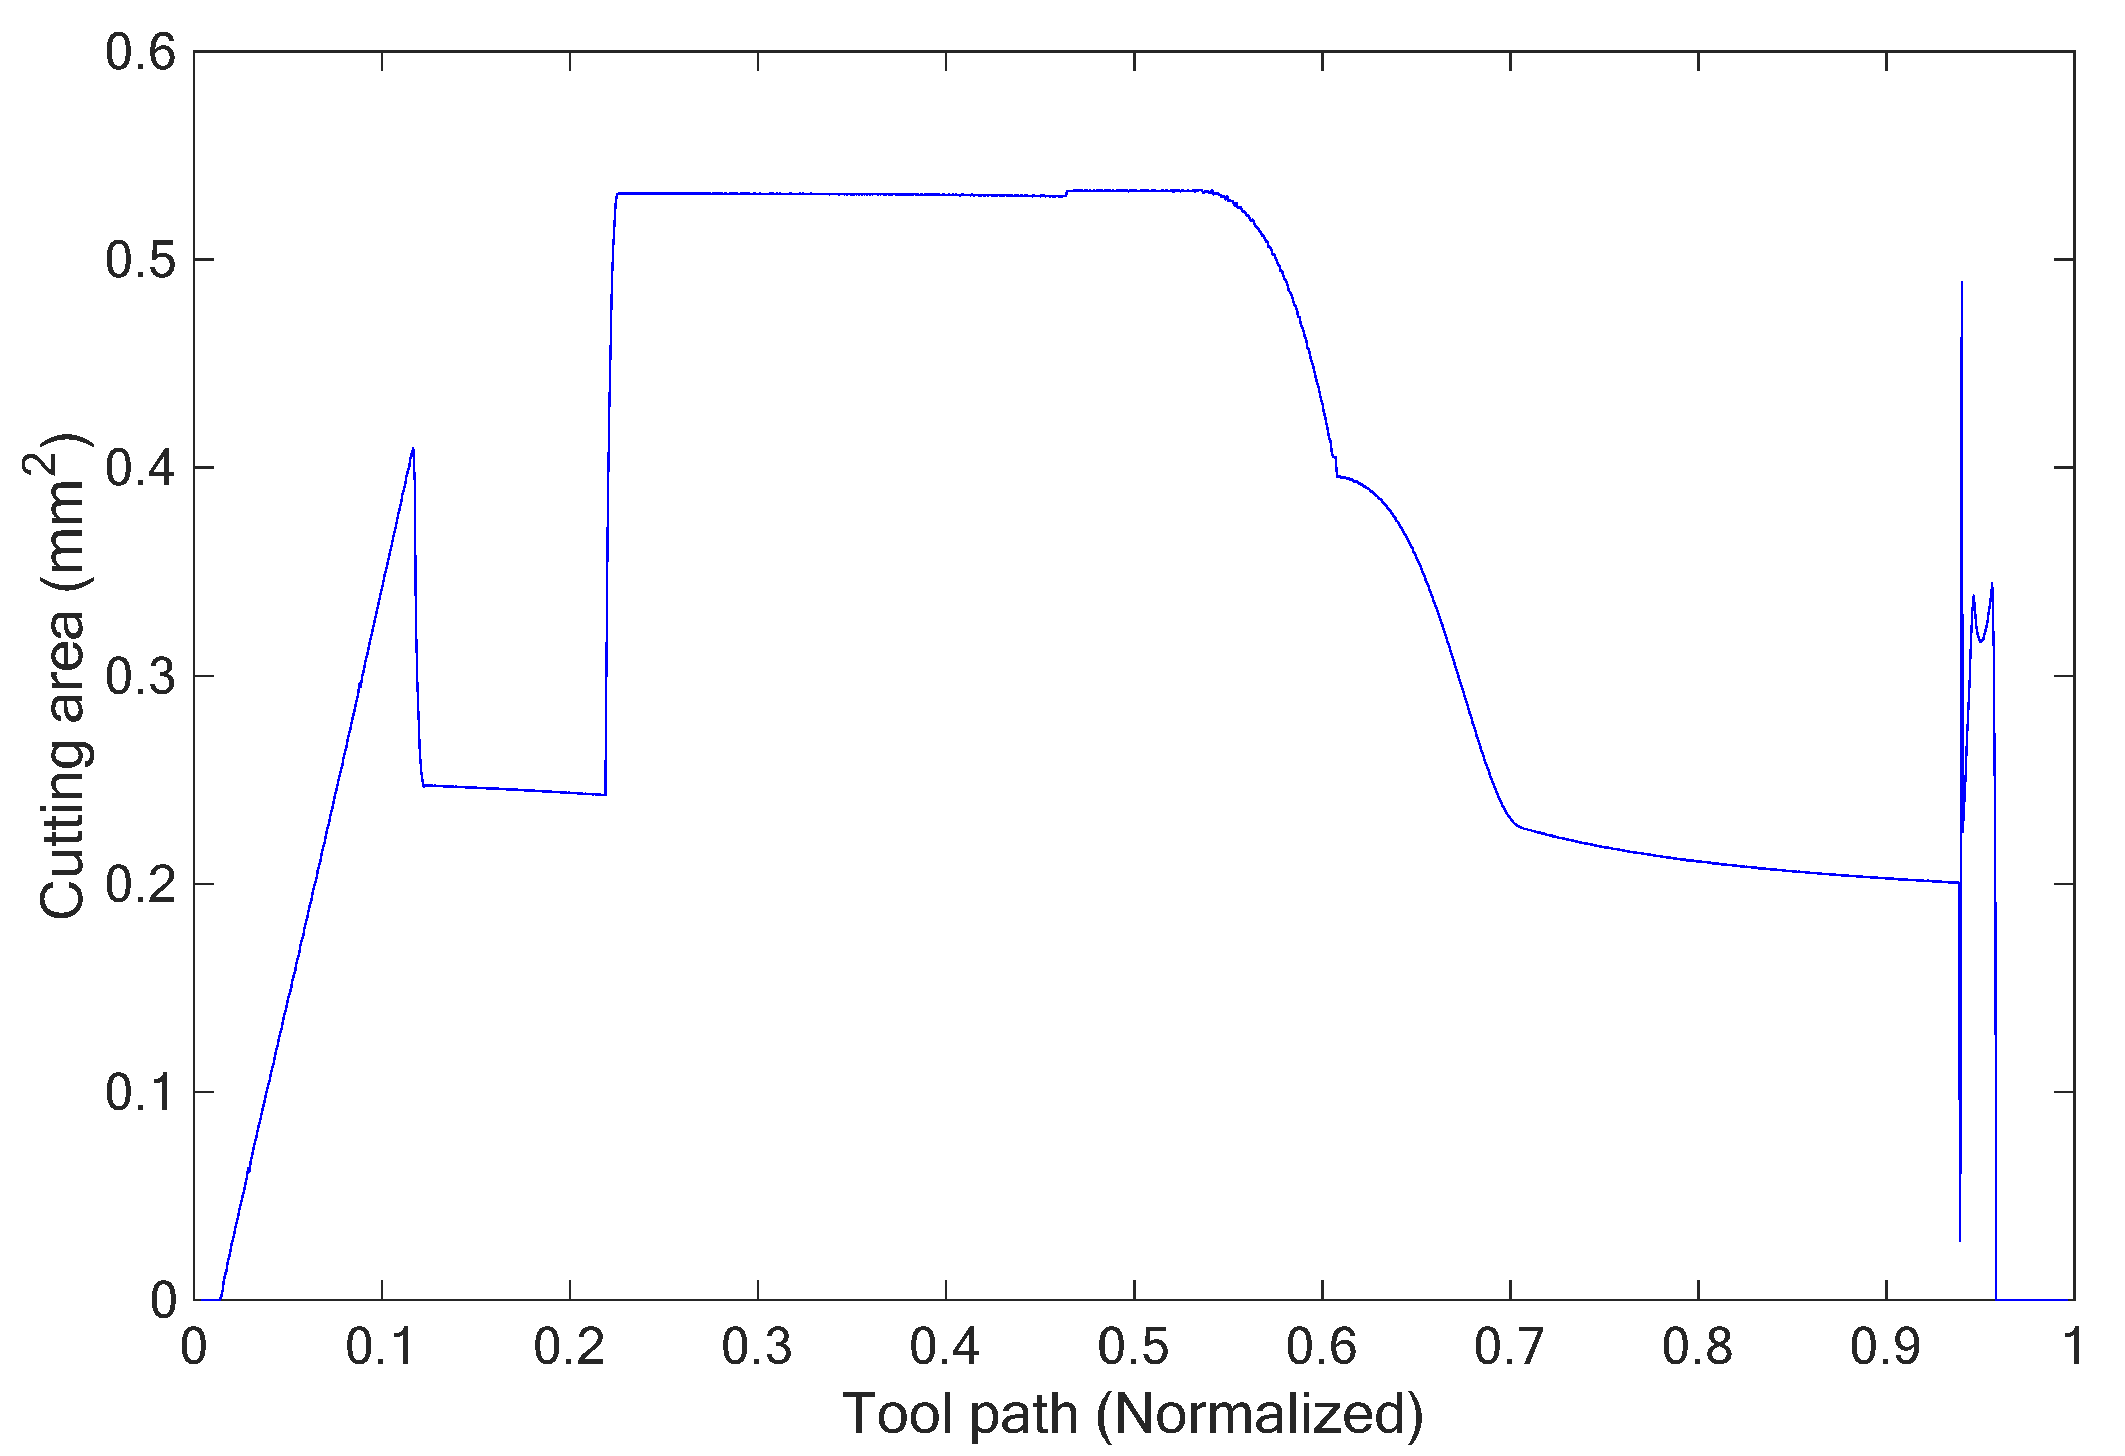
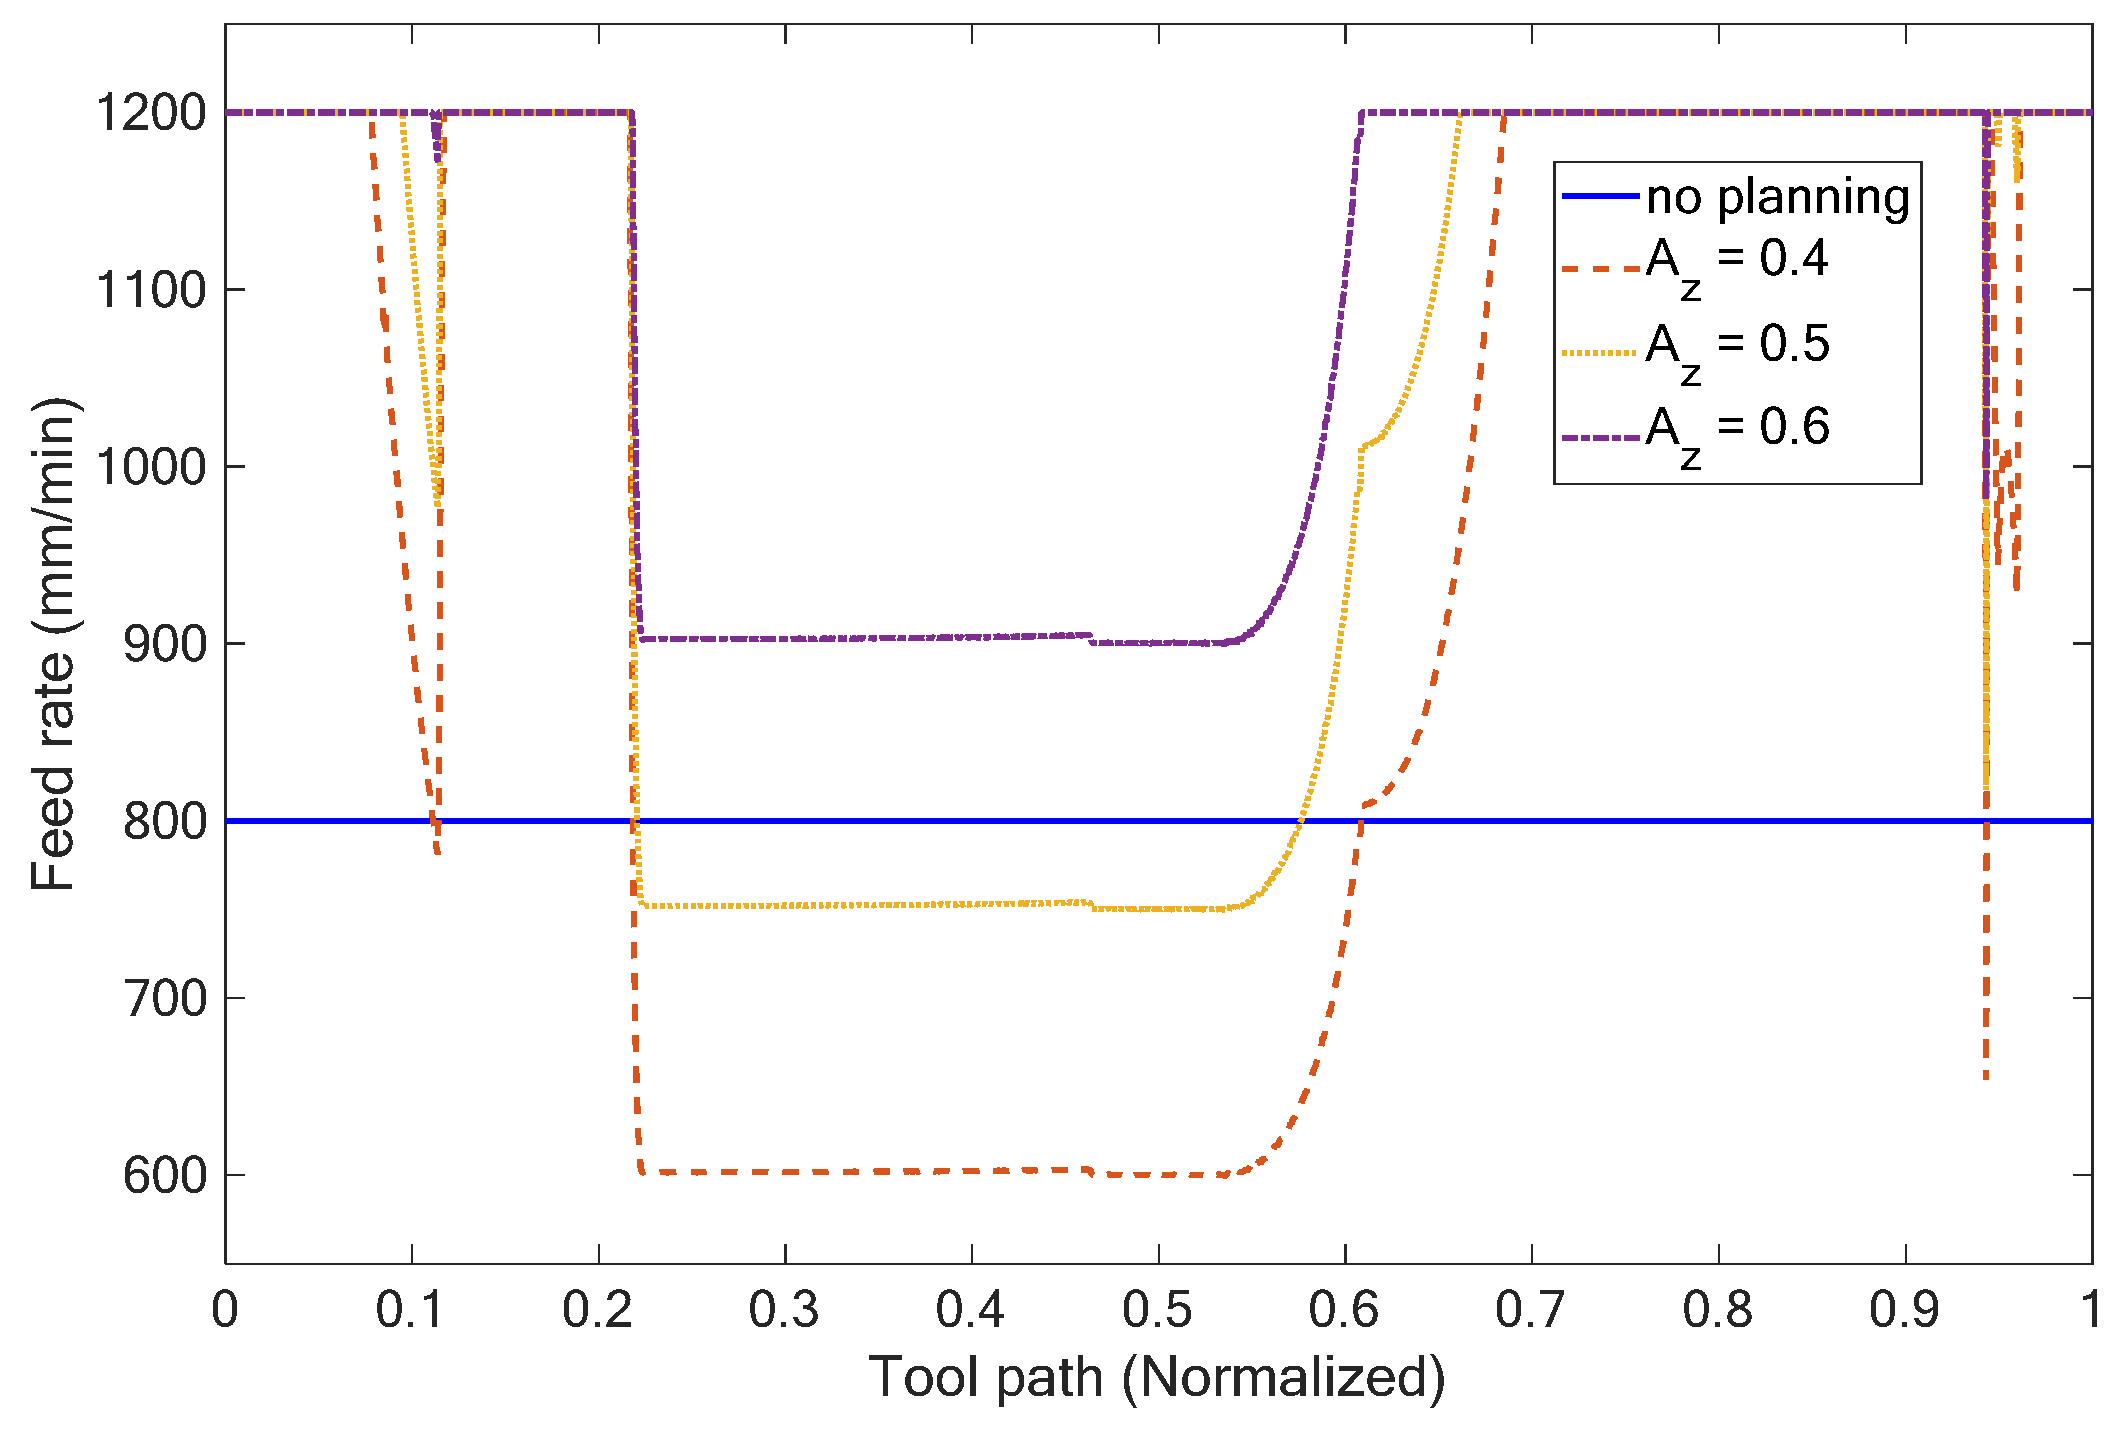
Utilizing Equations (1) and (2), Figure 8 shows the simulation results for the cutting area per cutter tooth, which were calculated with a spindle speed of 6000 rpm and a feed rate of 800 mm/min. Based on the adaptive feed rate planning method (i.e., Equation (3)), we were able to simulate adjustable feed rates with different cutting areas per cutter tooth Az, such as 0.4, 0.5, and 0.6 mm2. The simulated results are depicted in Figure 9.
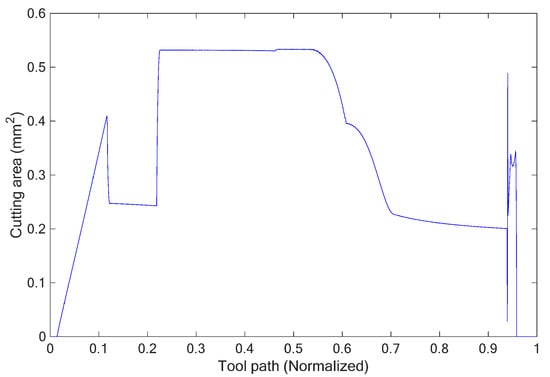
Figure 8.
Cutting area per cutter tooth in the rough machining process.
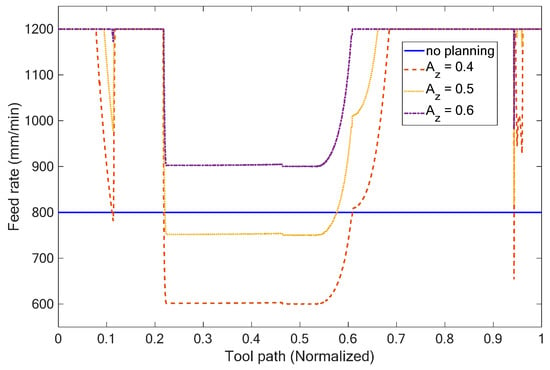
Figure 9.
Variation in feed rate for different cutting areas per cutter tooth.
To compare the different effects of the machining processes without and with adaptive feed rate planning, Table 3 lists the experimental results. They include the maximum bending moment, the machining time, and the material removal rate and different cutting areas per cutter tooth Az and feed rate limits from 700 to 1200 mm/min were employed. These experiments were implemented with a cutting depth of 2 mm and a stretched length of 55 mm for the cutter stretching out of the holder. The bending moment was used to evaluate the instantaneous cutting load since it is linearly proportional to the tool force for a cutter with a fixed stretched length.

Table 3.
Experimental results without and with adaptive feed rate planning.
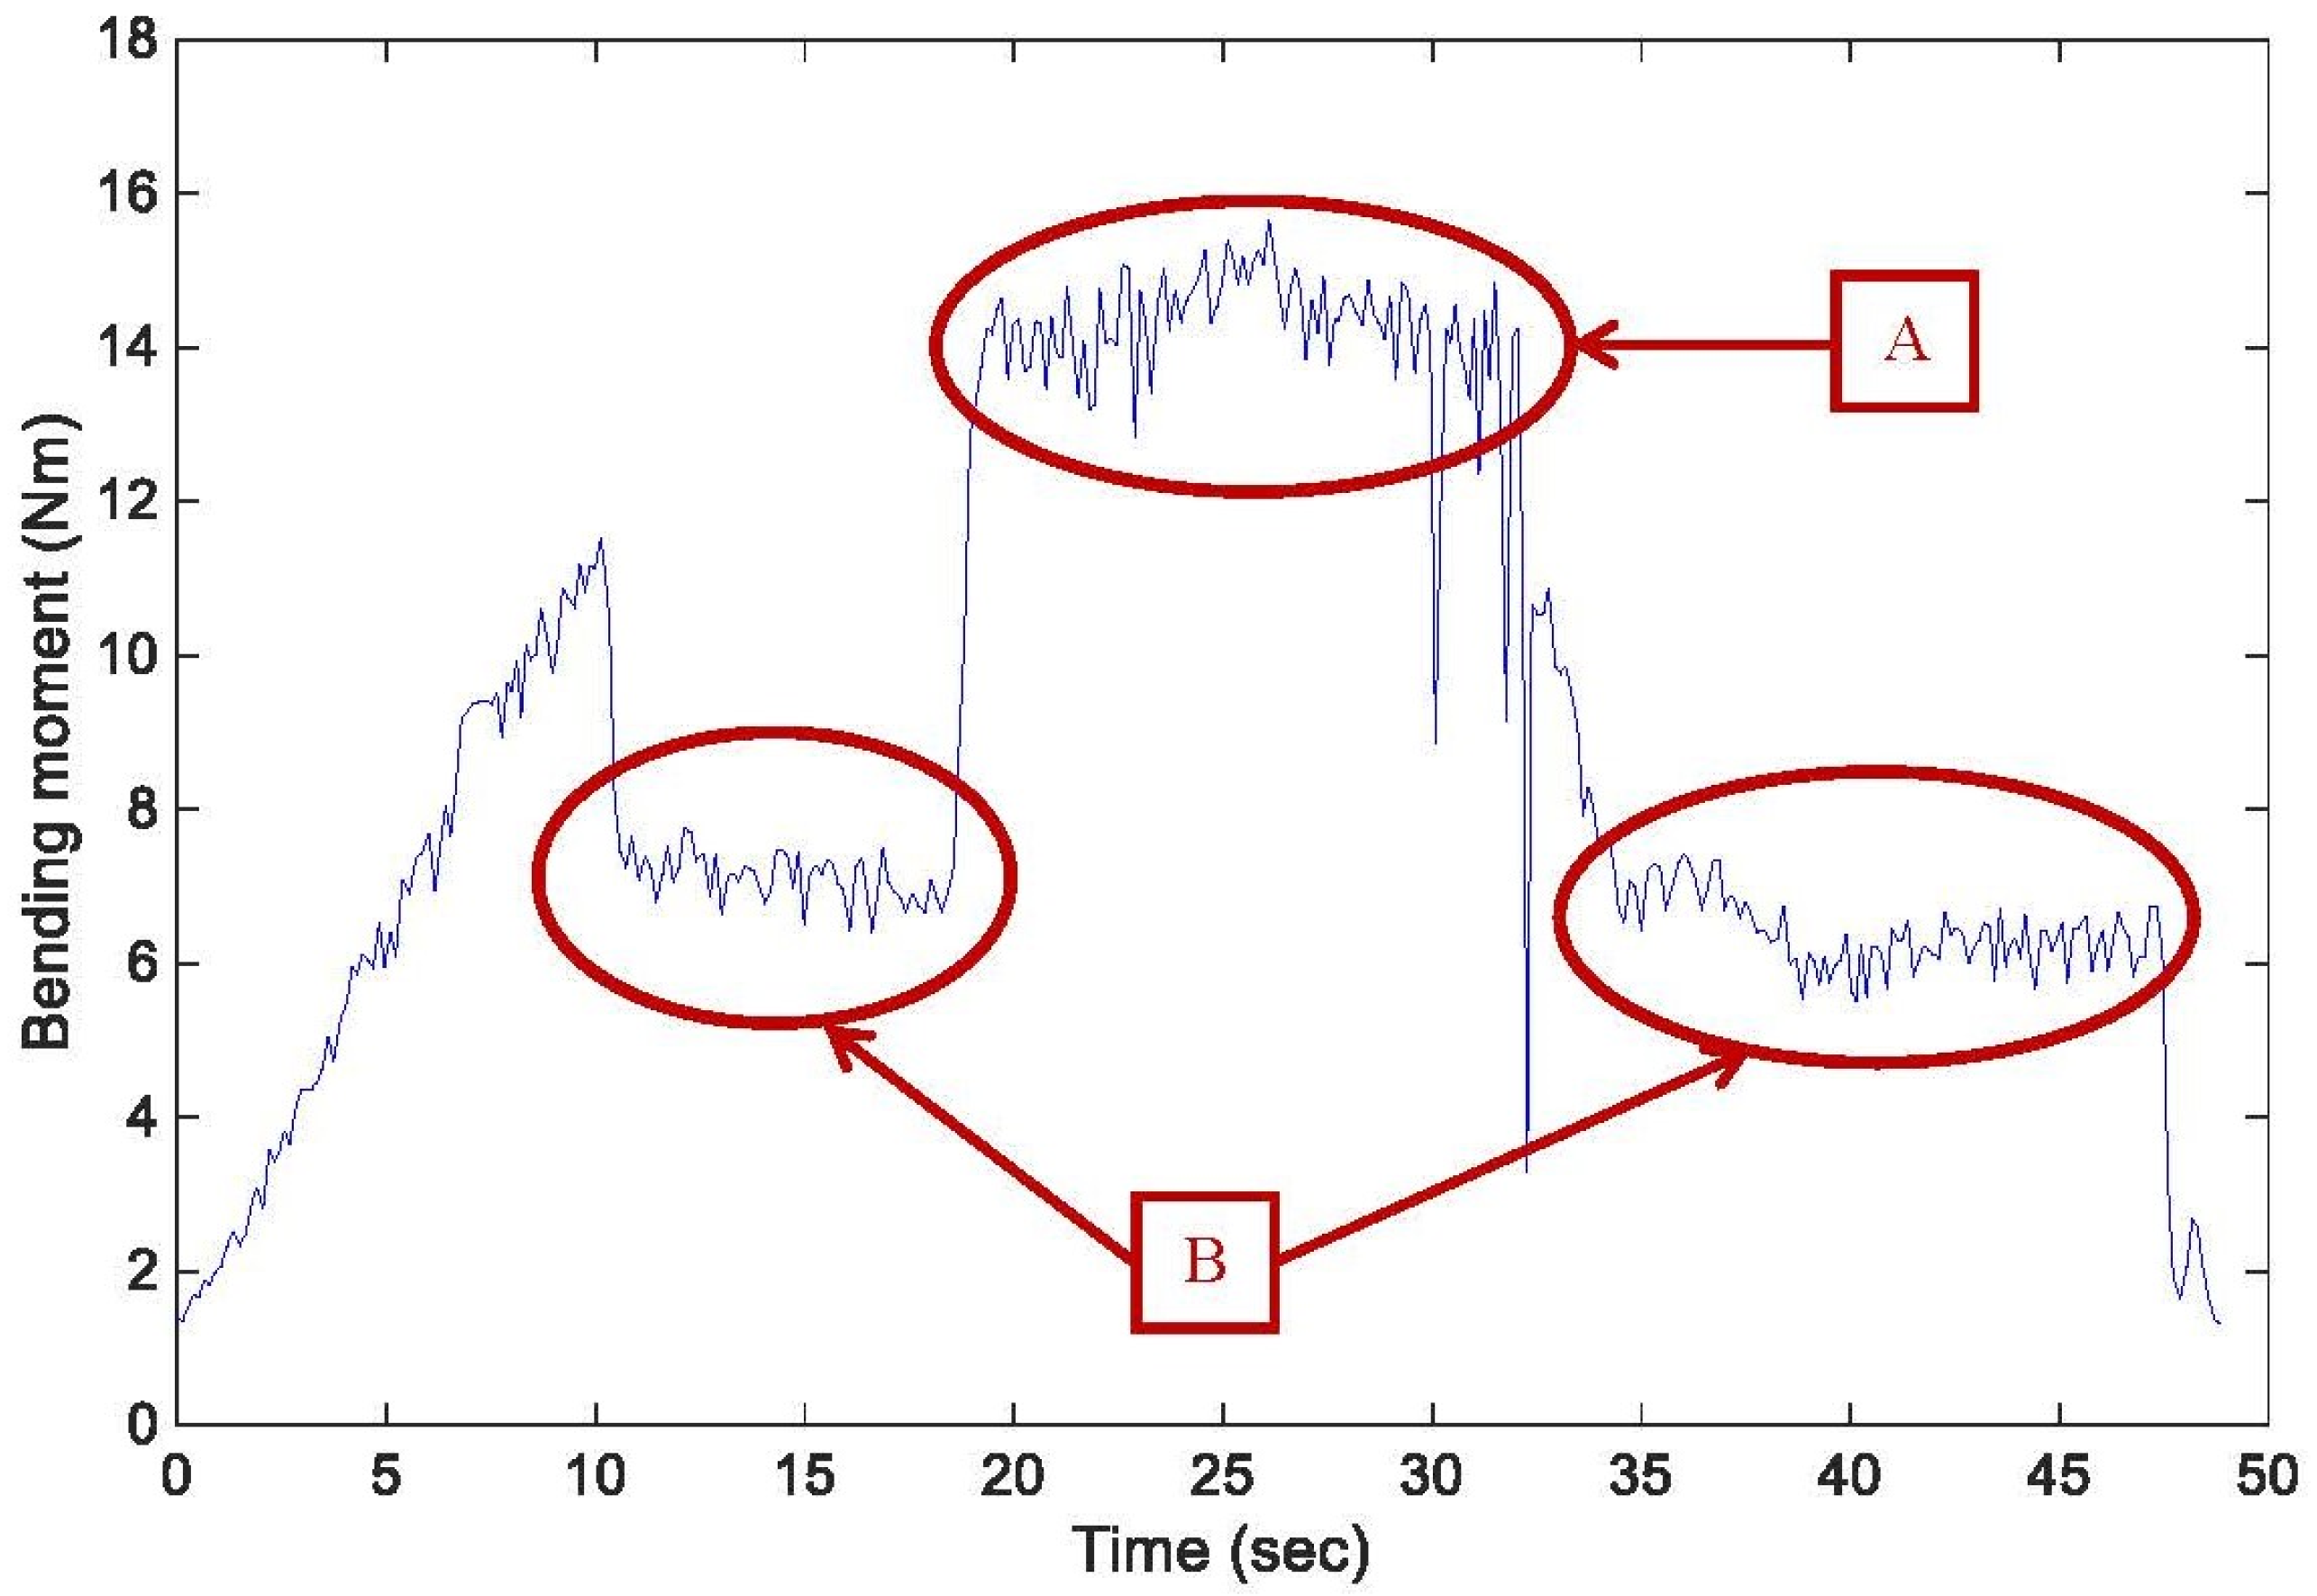
Utilizing the experimental results obtained without adaptive feed rate planning, Figure 10 illustrates as an example the bending moment with a constant feed rate of 800 mm/min, the variation in which is approximately similar and depends on that of the cutting area shown in Figure 8. In Figure 10, period A is the region with the highest bending moment since the slot-milling processes occur in this period. We utilized adaptive feed rate planning to decrease the feed rate of the machining in period A and then to reduce the cutting loads and stabilize the machining quality during the rough machining processes. Period B represents the region with the lower bending moment because the side-milling processes occur in this period. We also used the adjustment provided by the adaptive feed rate planning to increase the feed rate of the machining according to the calculation of the cutting area and, thus, enhanced the material removal rate and the machining efficiency.
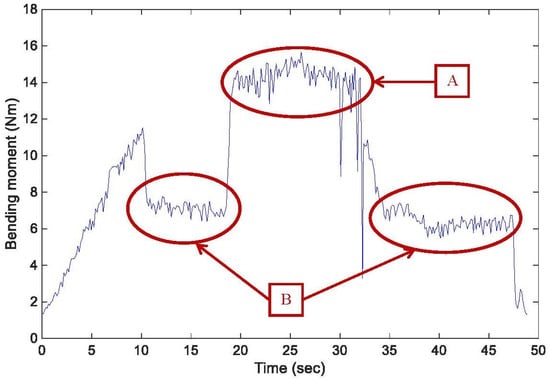
Figure 10.
Variation in bending moments with a constant feed rate of 800 mm/min.
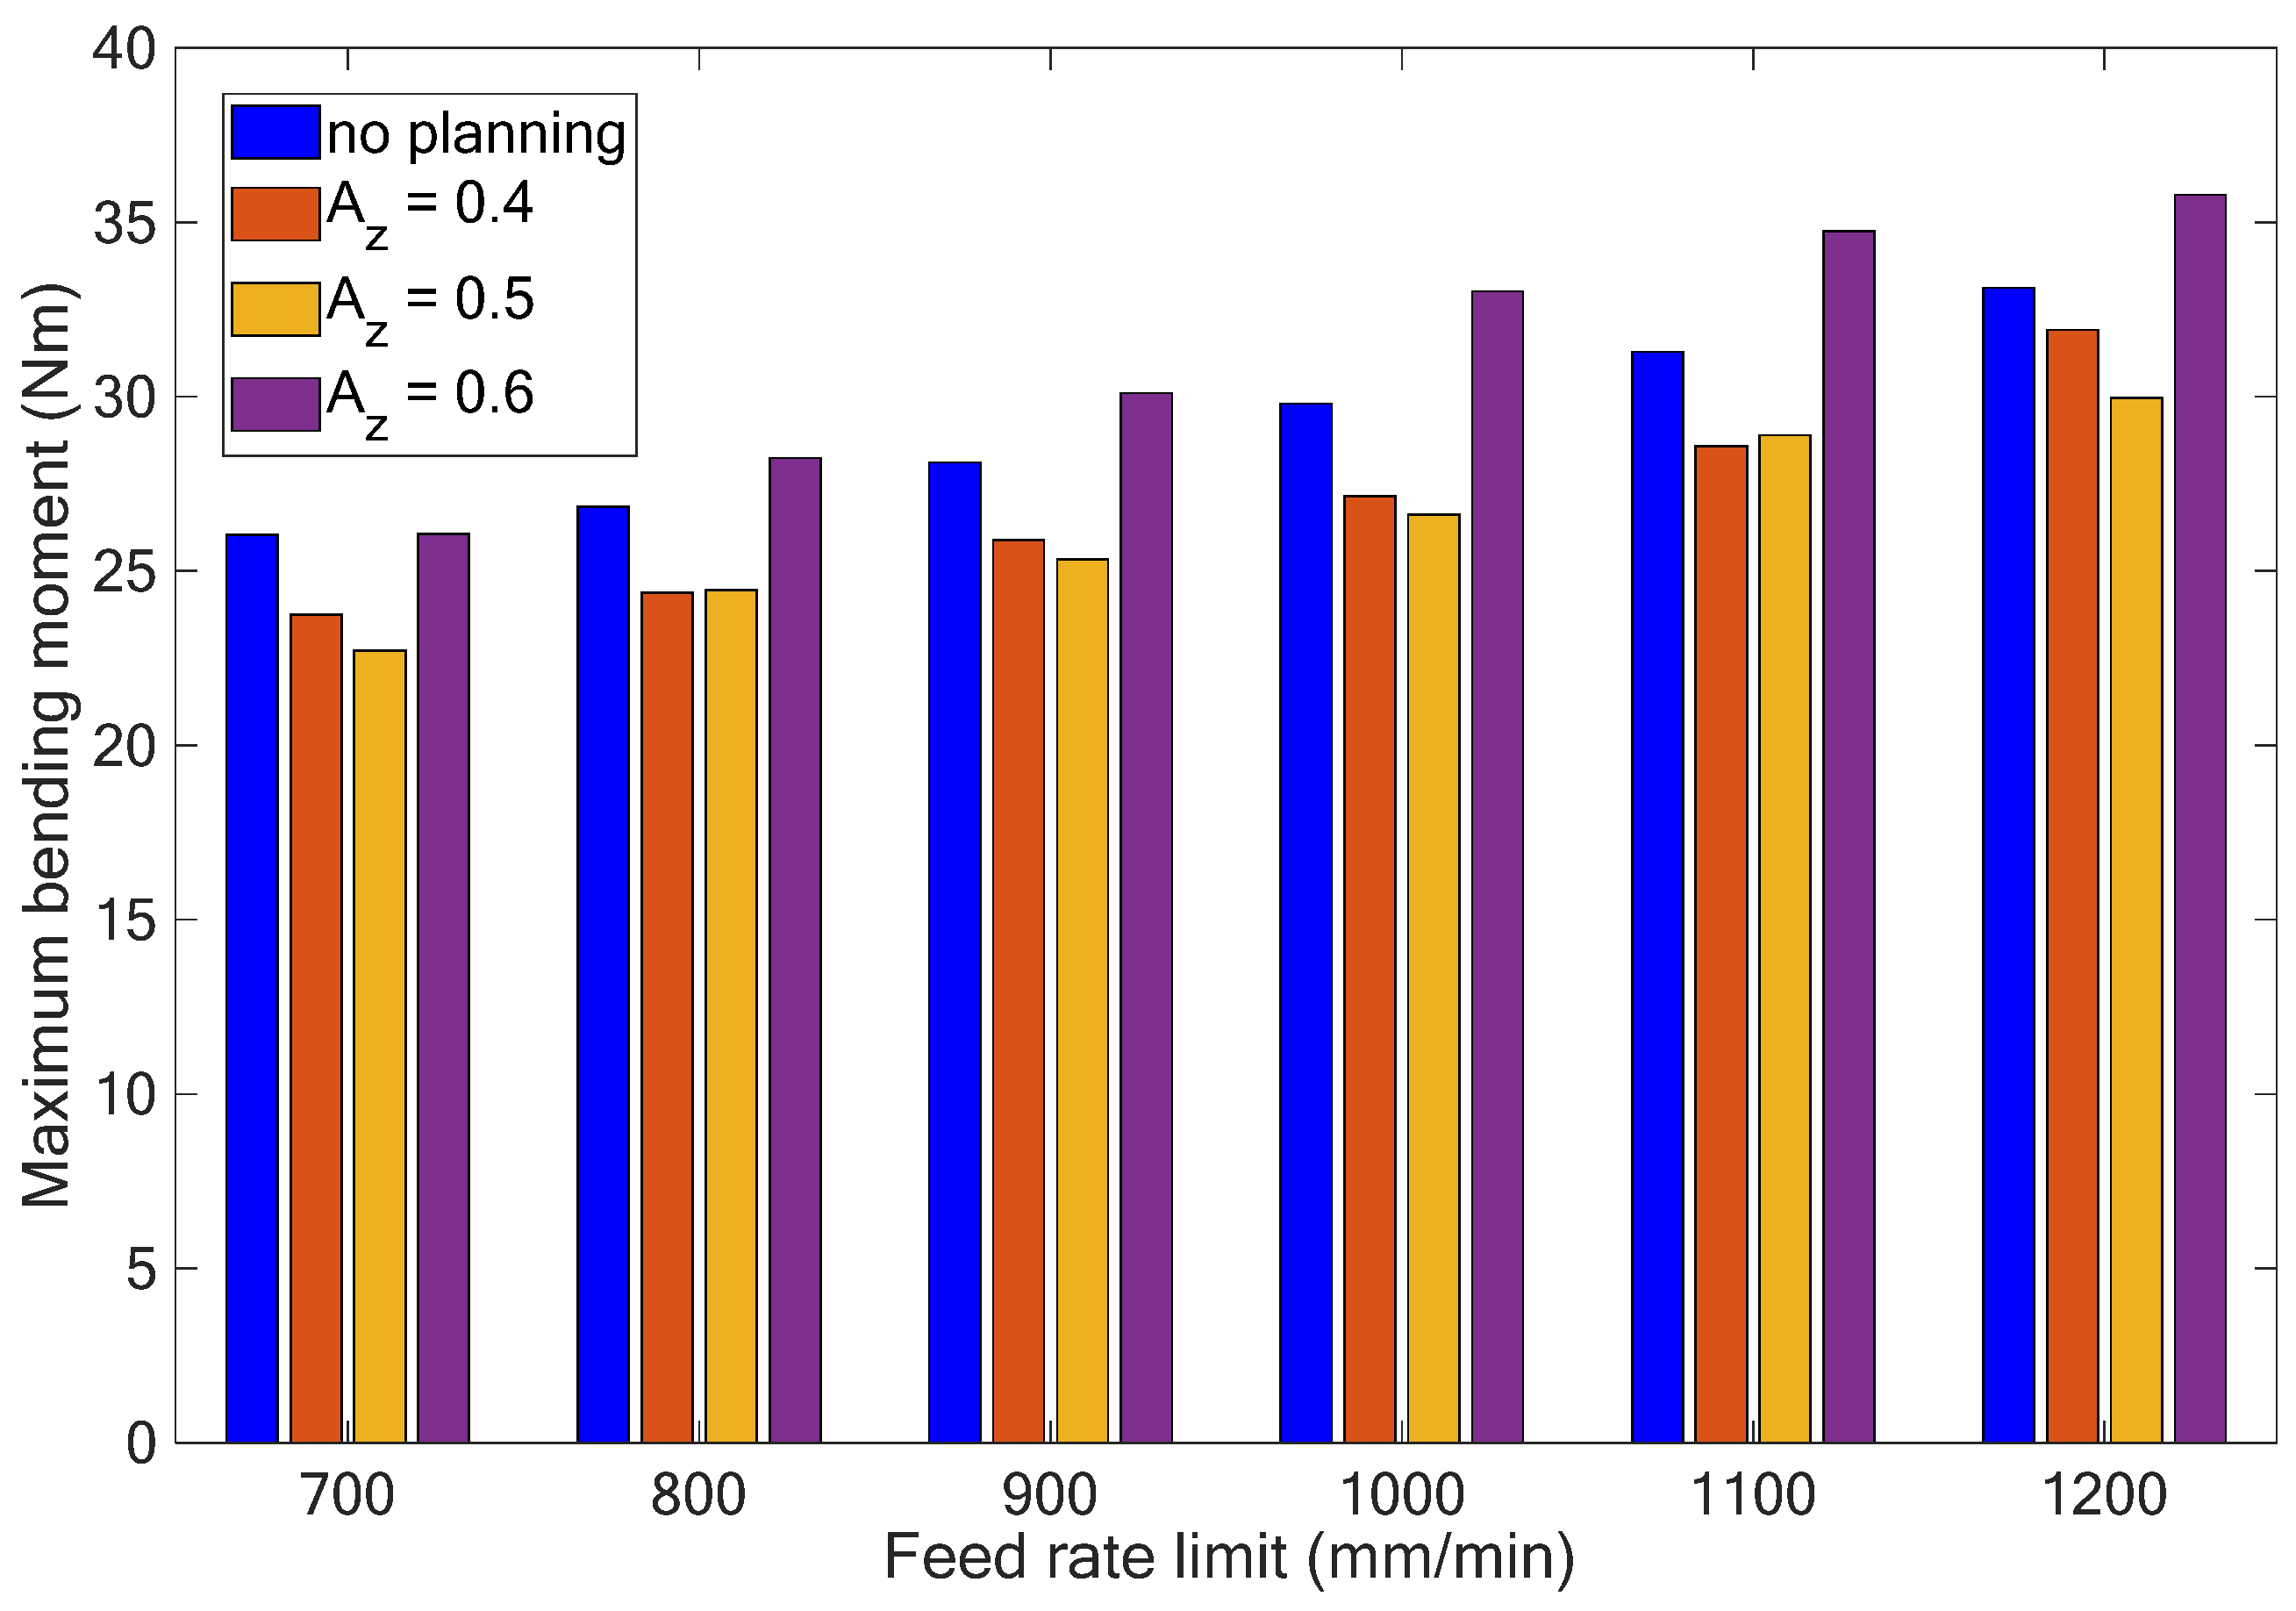
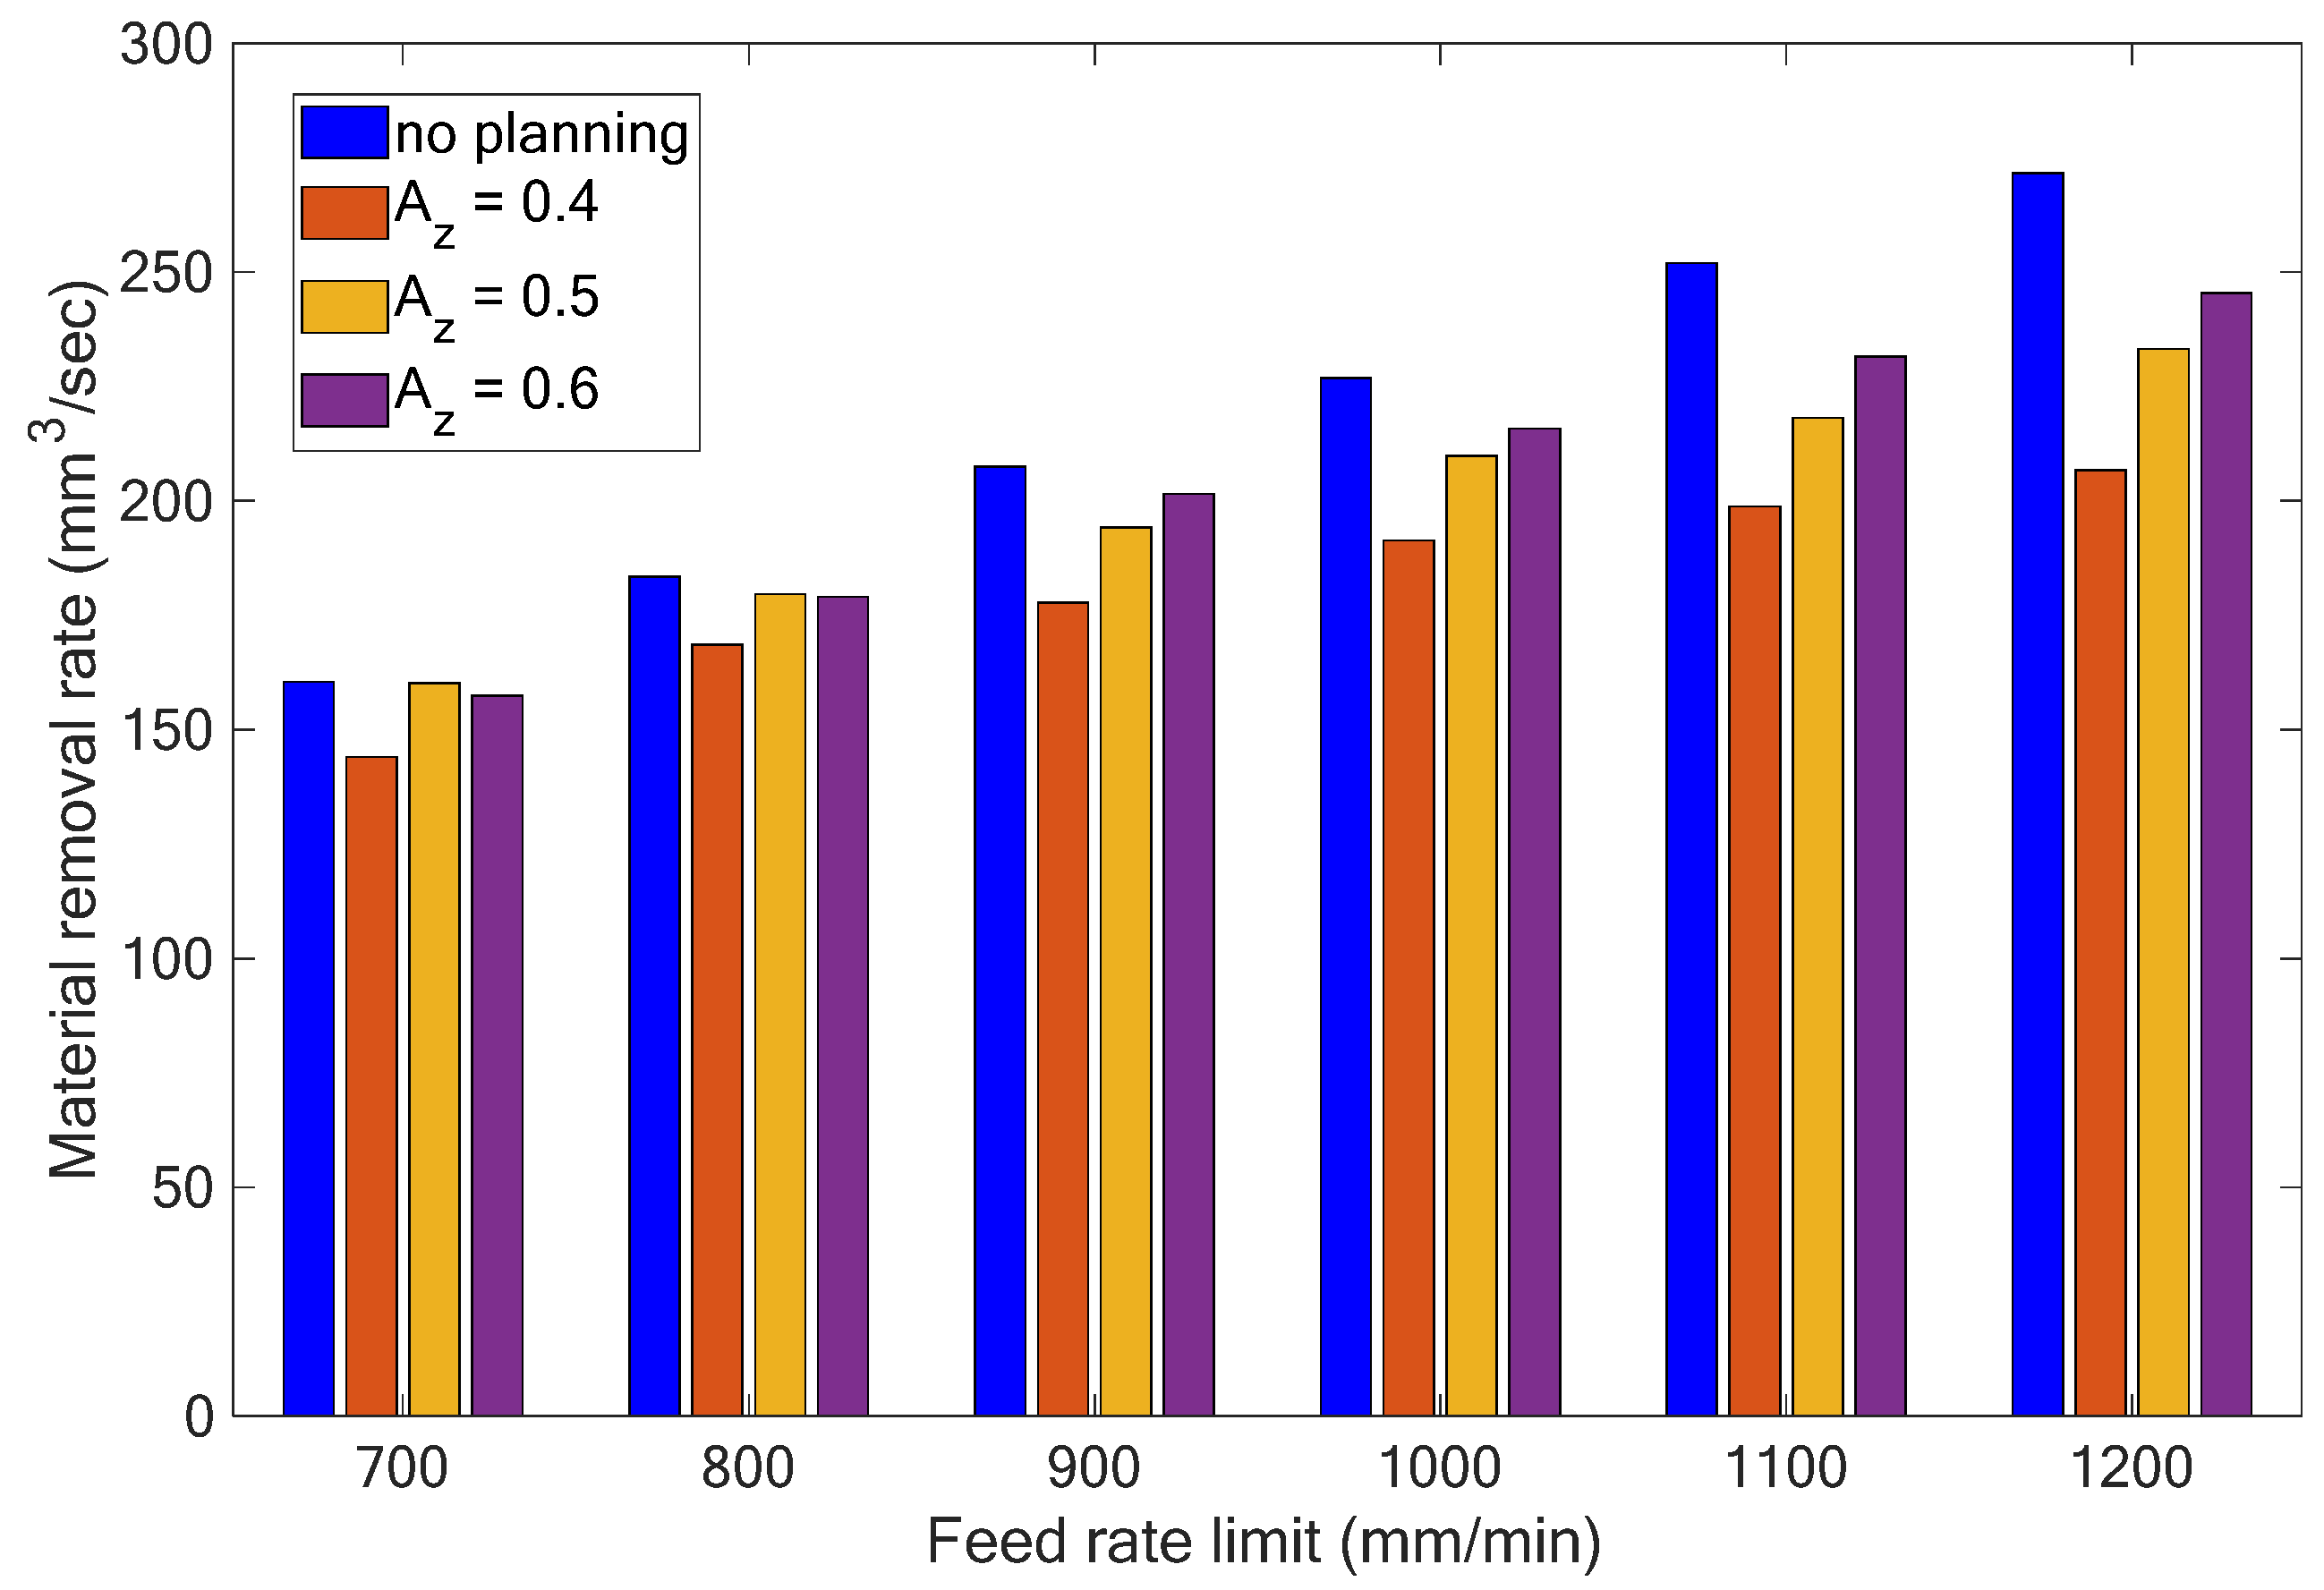
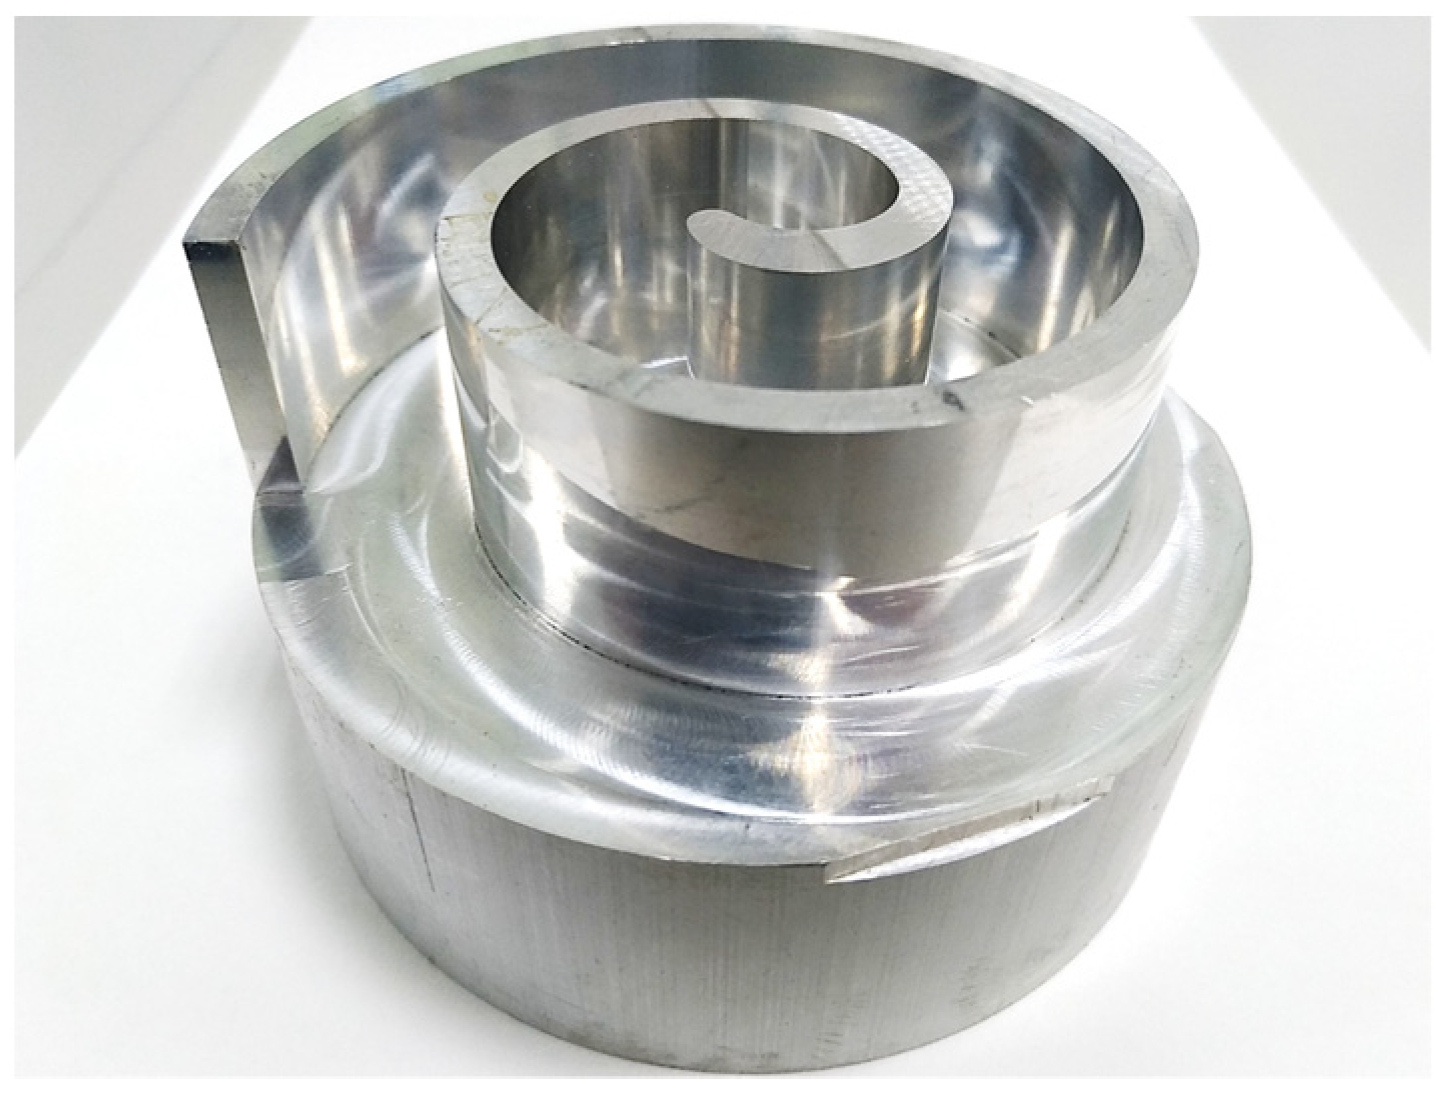
Based on the results shown in Table 3, Figure 11 and Figure 12 depict the schematic relationship between the maximum bending moments, material removal rates, and feed rate limits without and with adaptive feed rate planning, respectively. Considering the previous example shown in Figure 10, the maximum bending moment was 26.84 Nm with the feed rate limit of 800 mm/min and without adaptive feed rate planning. According to the results shown in Table 3 and Figure 11 and Figure 12, the cutting area per cutter tooth Az was 0.5 mm2 and the maximum feed rate limit was 1000 mm/min with a close value for the maximum bending moment of 26.62 Nm. However, it can be also observed that the material removal rates were 183.35 and 209.74 mm3/s, and the machining time was 48.83 and 42.69 s, respectively. This means that the method of adaptive feed rate planning can increase the material removal rate by about 14.4% and shorten the cutting time by about 12.6% under a given maximum acceptable cutting load. Figure 13 shows the scroll workpiece after the rough machining processes.
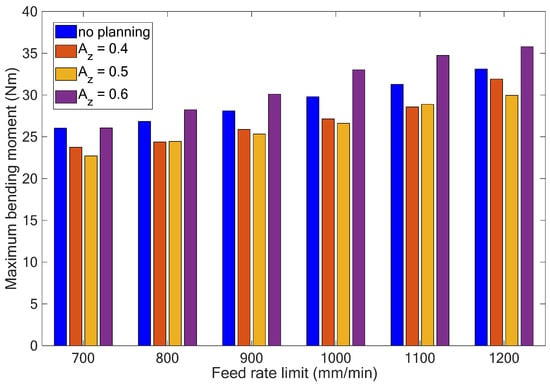
Figure 11.
Maximum bending moments with different feed rate limits and adaptive feed rate planning.
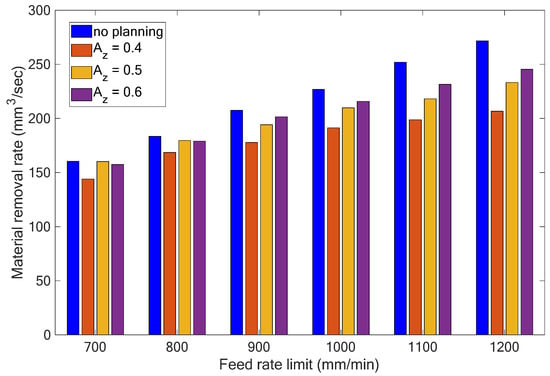
Figure 12.
Material removal rates with different feed rate limits and adaptive feed rate planning.
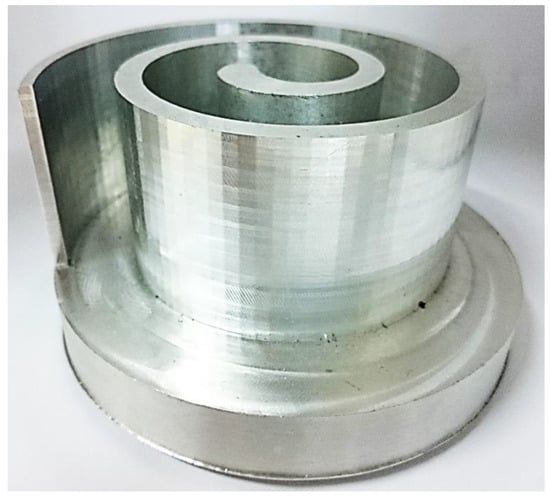
Figure 13.
Scroll workpiece after the rough machining processes.
5.2. Experiments on Chatter Suppression
After the rough machining processes, the semi-fine and fine machining processes were implemented to improve the surface roughness and precision of the scrolls. In this part of the study, experiments on chatter suppression were conducted. We used a microphone to detect the audio signals and the developed program to illustrate real-time spectrum diagrams and monitor the machining conditions. When chatter occurred, the command to change speed was given to the spindle through the connection between the Ethernet and the controller of the milling machine to suppress the chatter. The cutter used in these experiments was a Nachi List 6212, and the microphone was an Audio-Technica AT9942. The specifications of the cutter and the machining parameters are listed in Table 4. The experimental results are shown in Table 5 and Figure 14.

Table 4.
Specifications of the Nachi LIST 6212 cutter and the machining parameters.

Table 5.
Results of the chatter suppression tests.
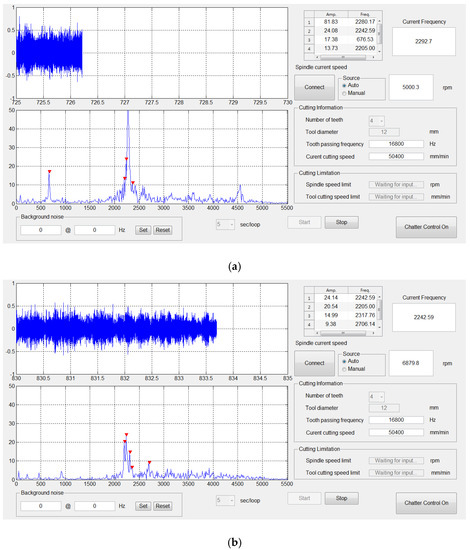
Figure 14.
Experimental results displayed in the operation interface of the developed program: (a) S = 5000 rpm, (b) S = 6879 rpm.
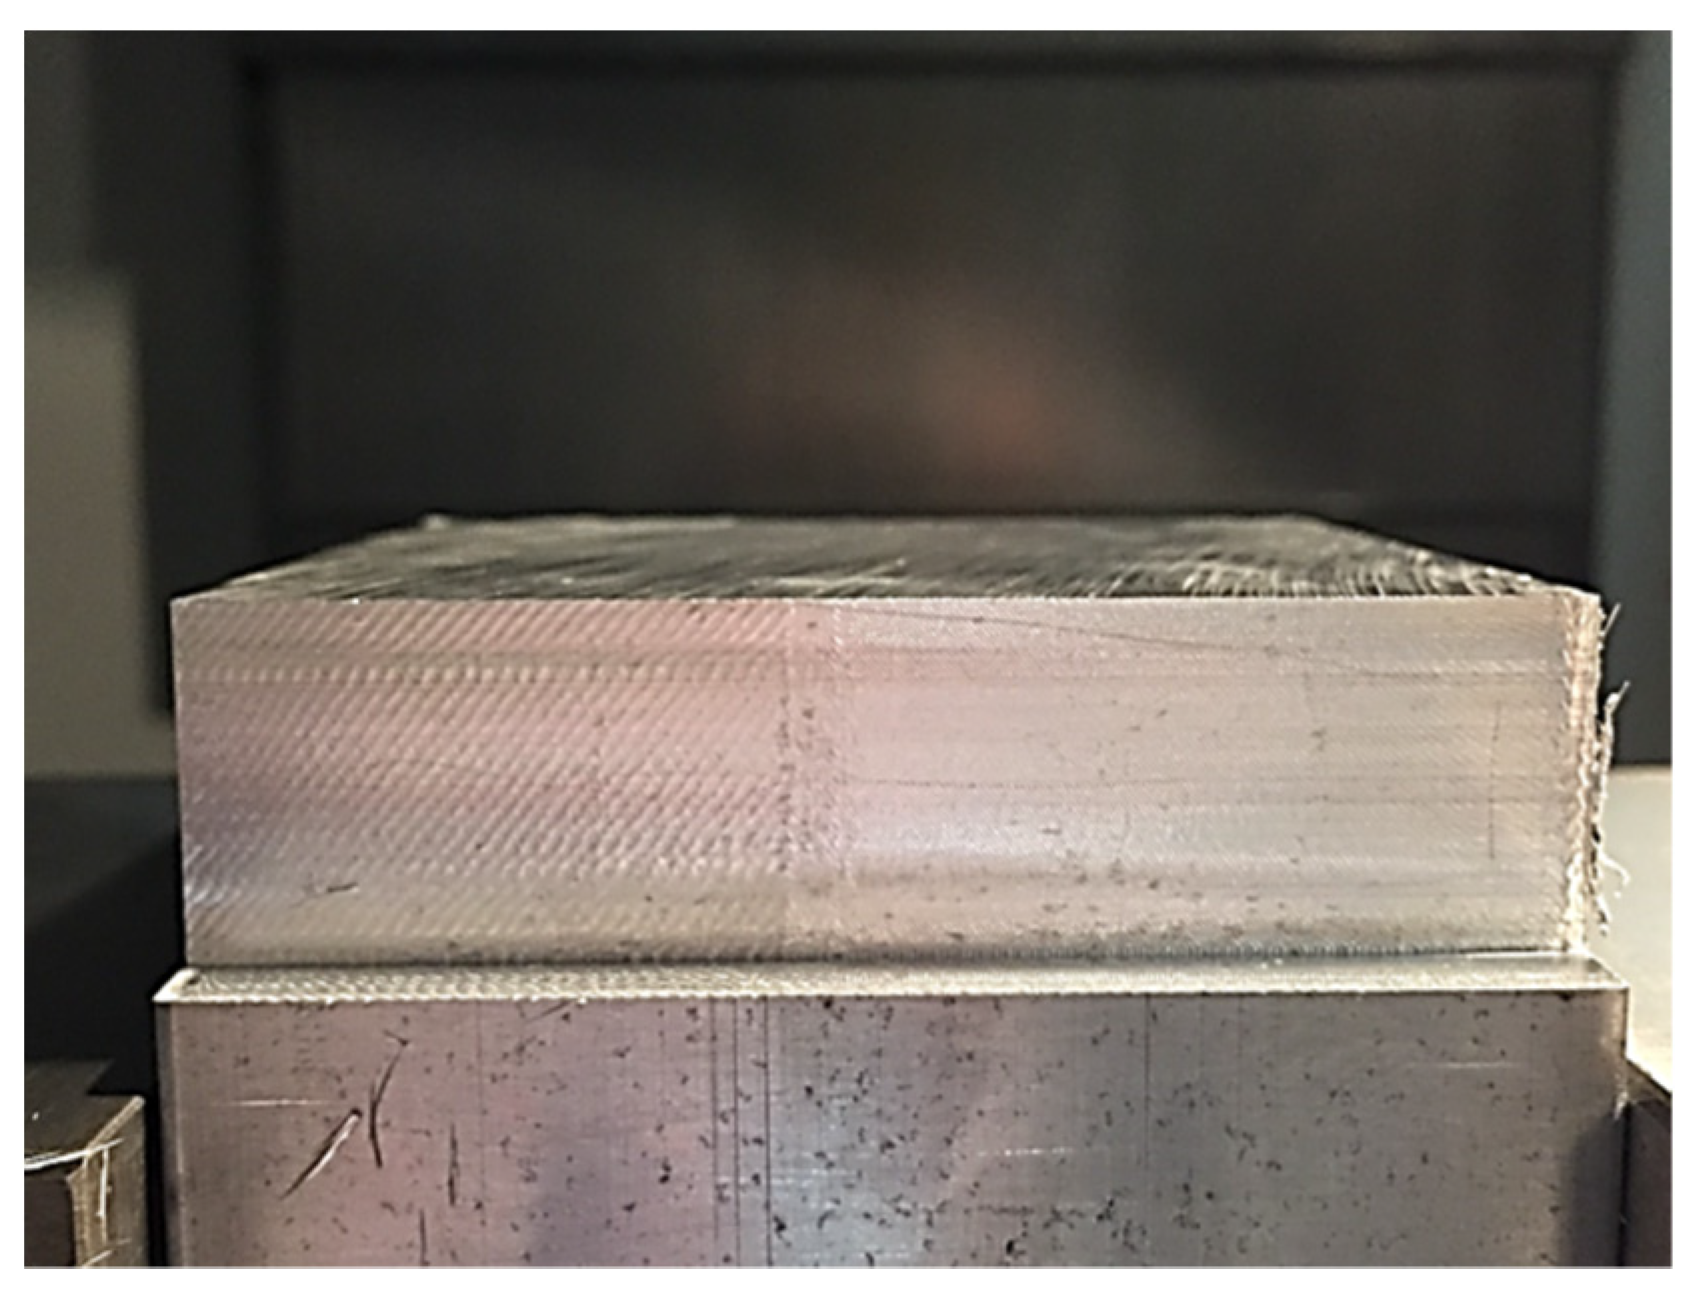
The chatter frequency (2293 Hz) shown in Table 4 was obtained by observing the cutting edge; the regenerative waviness was detected from the surface of the workpiece, and the vibration type can be thought of as a self-excited one. The results in Table 5 also verified that, when the multiple factor K, which is expressed in Equation (5), was an integer, there was no chatter. As shown by the experimental results, the proposed methods could reduce and disperse the energy of the chatter frequency, and the machining conditions of the system could be stabilized by changing the real-time spindle speed. As signal interference from noise and the variation in the workpiece stiffness in the machining processes might shift the stability lobes, it is suggested that an increase in the spindle speed could be first adopted to avoid unstable machining conditions and to achieve chatter suppression. To conveniently demonstrate the effects of chatter suppression, Figure 15 shows the surface of the block of aluminum alloy with and without the occurrence of chatter, respectively. In the figure, the left side of the block without chatter suppression reveals a significant chatter effect, and the right side with a smooth surface shows the result of chatter suppression. In this example, the transition time for the variations in spindle speeds was about 80 milliseconds (ms), and the transition length on the workpiece surface was about 1.05 mm. The obtained results also verified the feasibility of the proposed methods for chatter suppression.
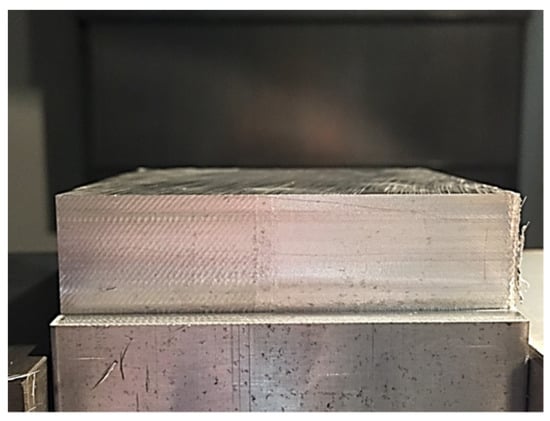
Figure 15.
Effects of chatter suppression.
5.3. Experiments on the Optimization of Milling Parameters
We conducted experiments to determine and verify the optimum milling parameters for the fine machining processes. The cutter used in these experiments was a 7 leaders E143-8, and Table 6 reveals its specifications. As mentioned in the previous section, we selected the tool path, feed rate, and spindle speed as the control factors, and each factor had three levels. At the beginning of the experiments, we calibrated the tool runout by measuring the center deviation of the tool using a dial test indicator made by Mitutoyo company. Table 7 lists the details for the factors and levels used in the experiments, and Table 8 shows their corresponding arrangements for the orthogonal array.

Table 6.
Specifications of the 7 leaders E143-8 cutter.

Table 7.
Factors and levels used in the experiments.

Table 8.
Orthogonal array of the experimental factors and levels.
5.3.1. Optimum Combination of Milling Parameters for Profile Errors
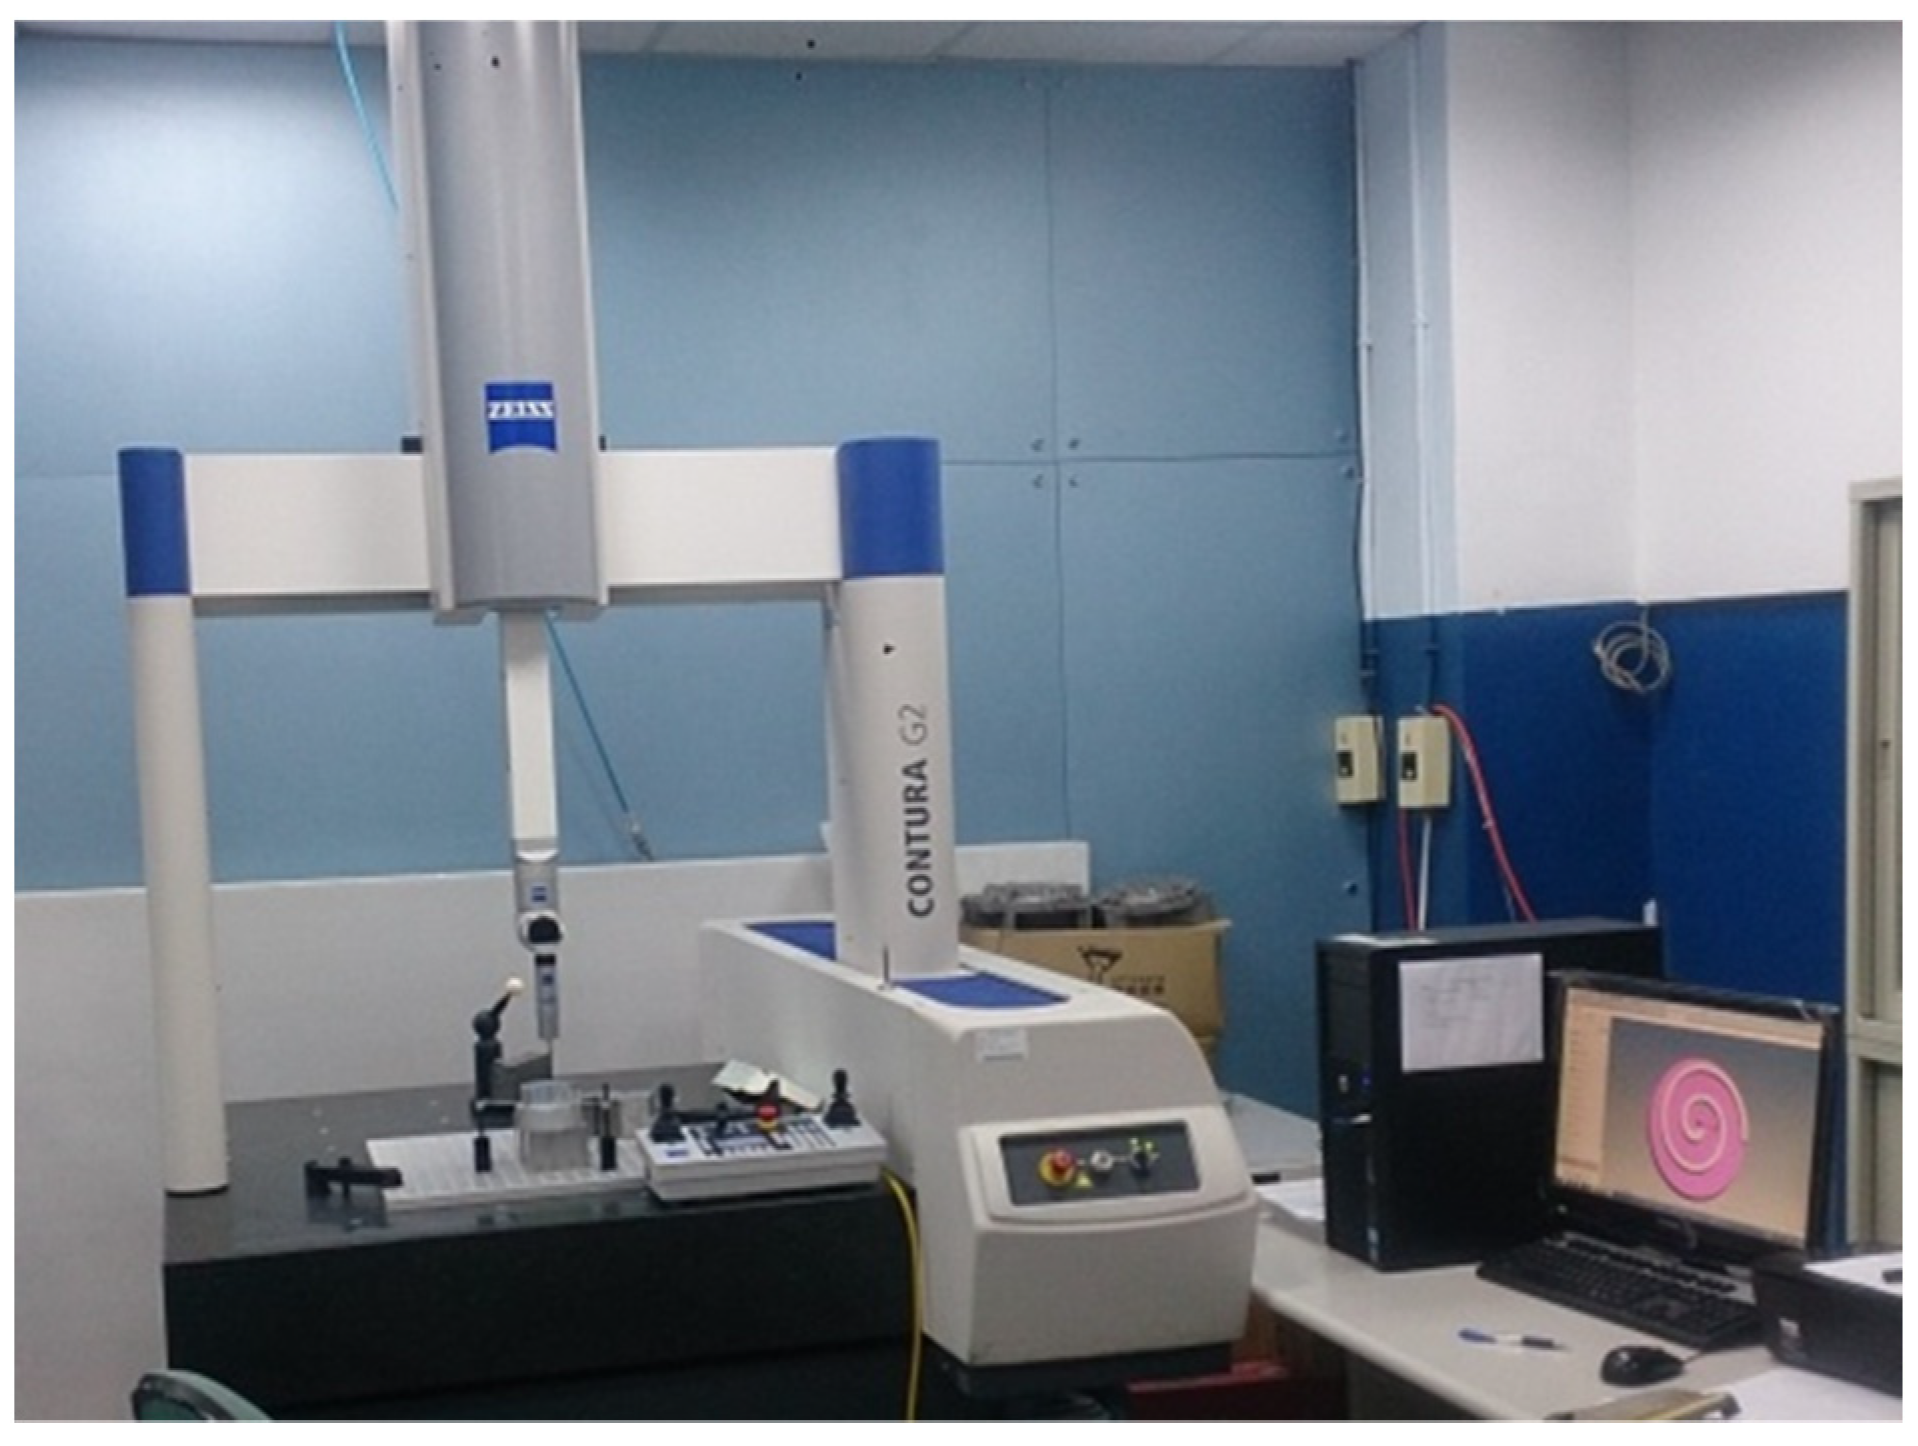
After the fine machining processes, we used a Zeiss Contura G2 coordinate measuring machine (CMM) and Hommel Tester T500 roughness measuring instrument, as shown in Figure 16 and Figure 17, to measure the profile errors and surface roughness of scrolls, respectively (Video S2: Profile error measuring processes). The experimental results for the profile errors, including their measured values and response characteristics, such as means and S/N ratios, are shown in Table 9. Due to the fact that a smaller profile error results in higher precision for the scrolls, this study utilized the smaller-is-better formula (i.e., Equation (7)) to calculate the S/N ratios [30]. The results are listed in the last column of Table 9.
where ηj and its subscript j represent the S/N ratio and experiment number, respectively; n is the measured number of profile errors for each experiment, and yi indicates the measured profile error.
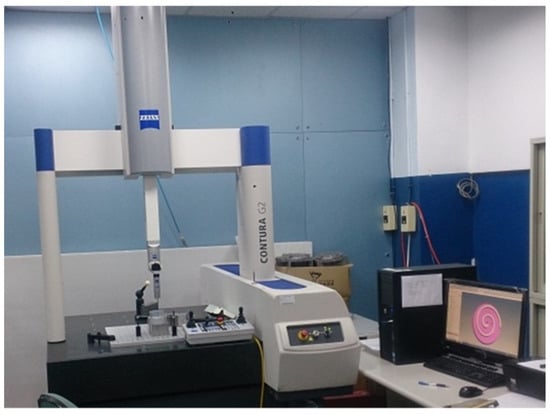
Figure 16.
Measurement of the profile errors for scrolls.
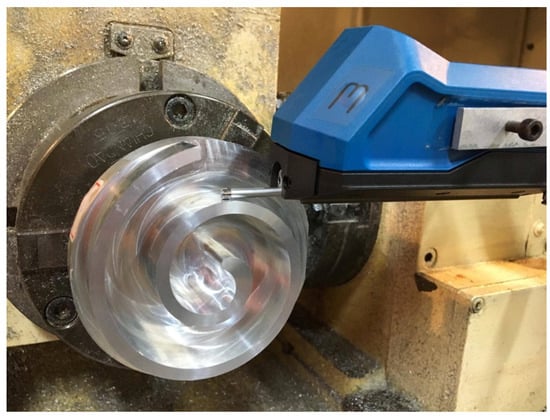
Figure 17.
Measurement of the surface roughness of scrolls.

Table 9.
Measured values, means, and S/N ratios of profile errors.
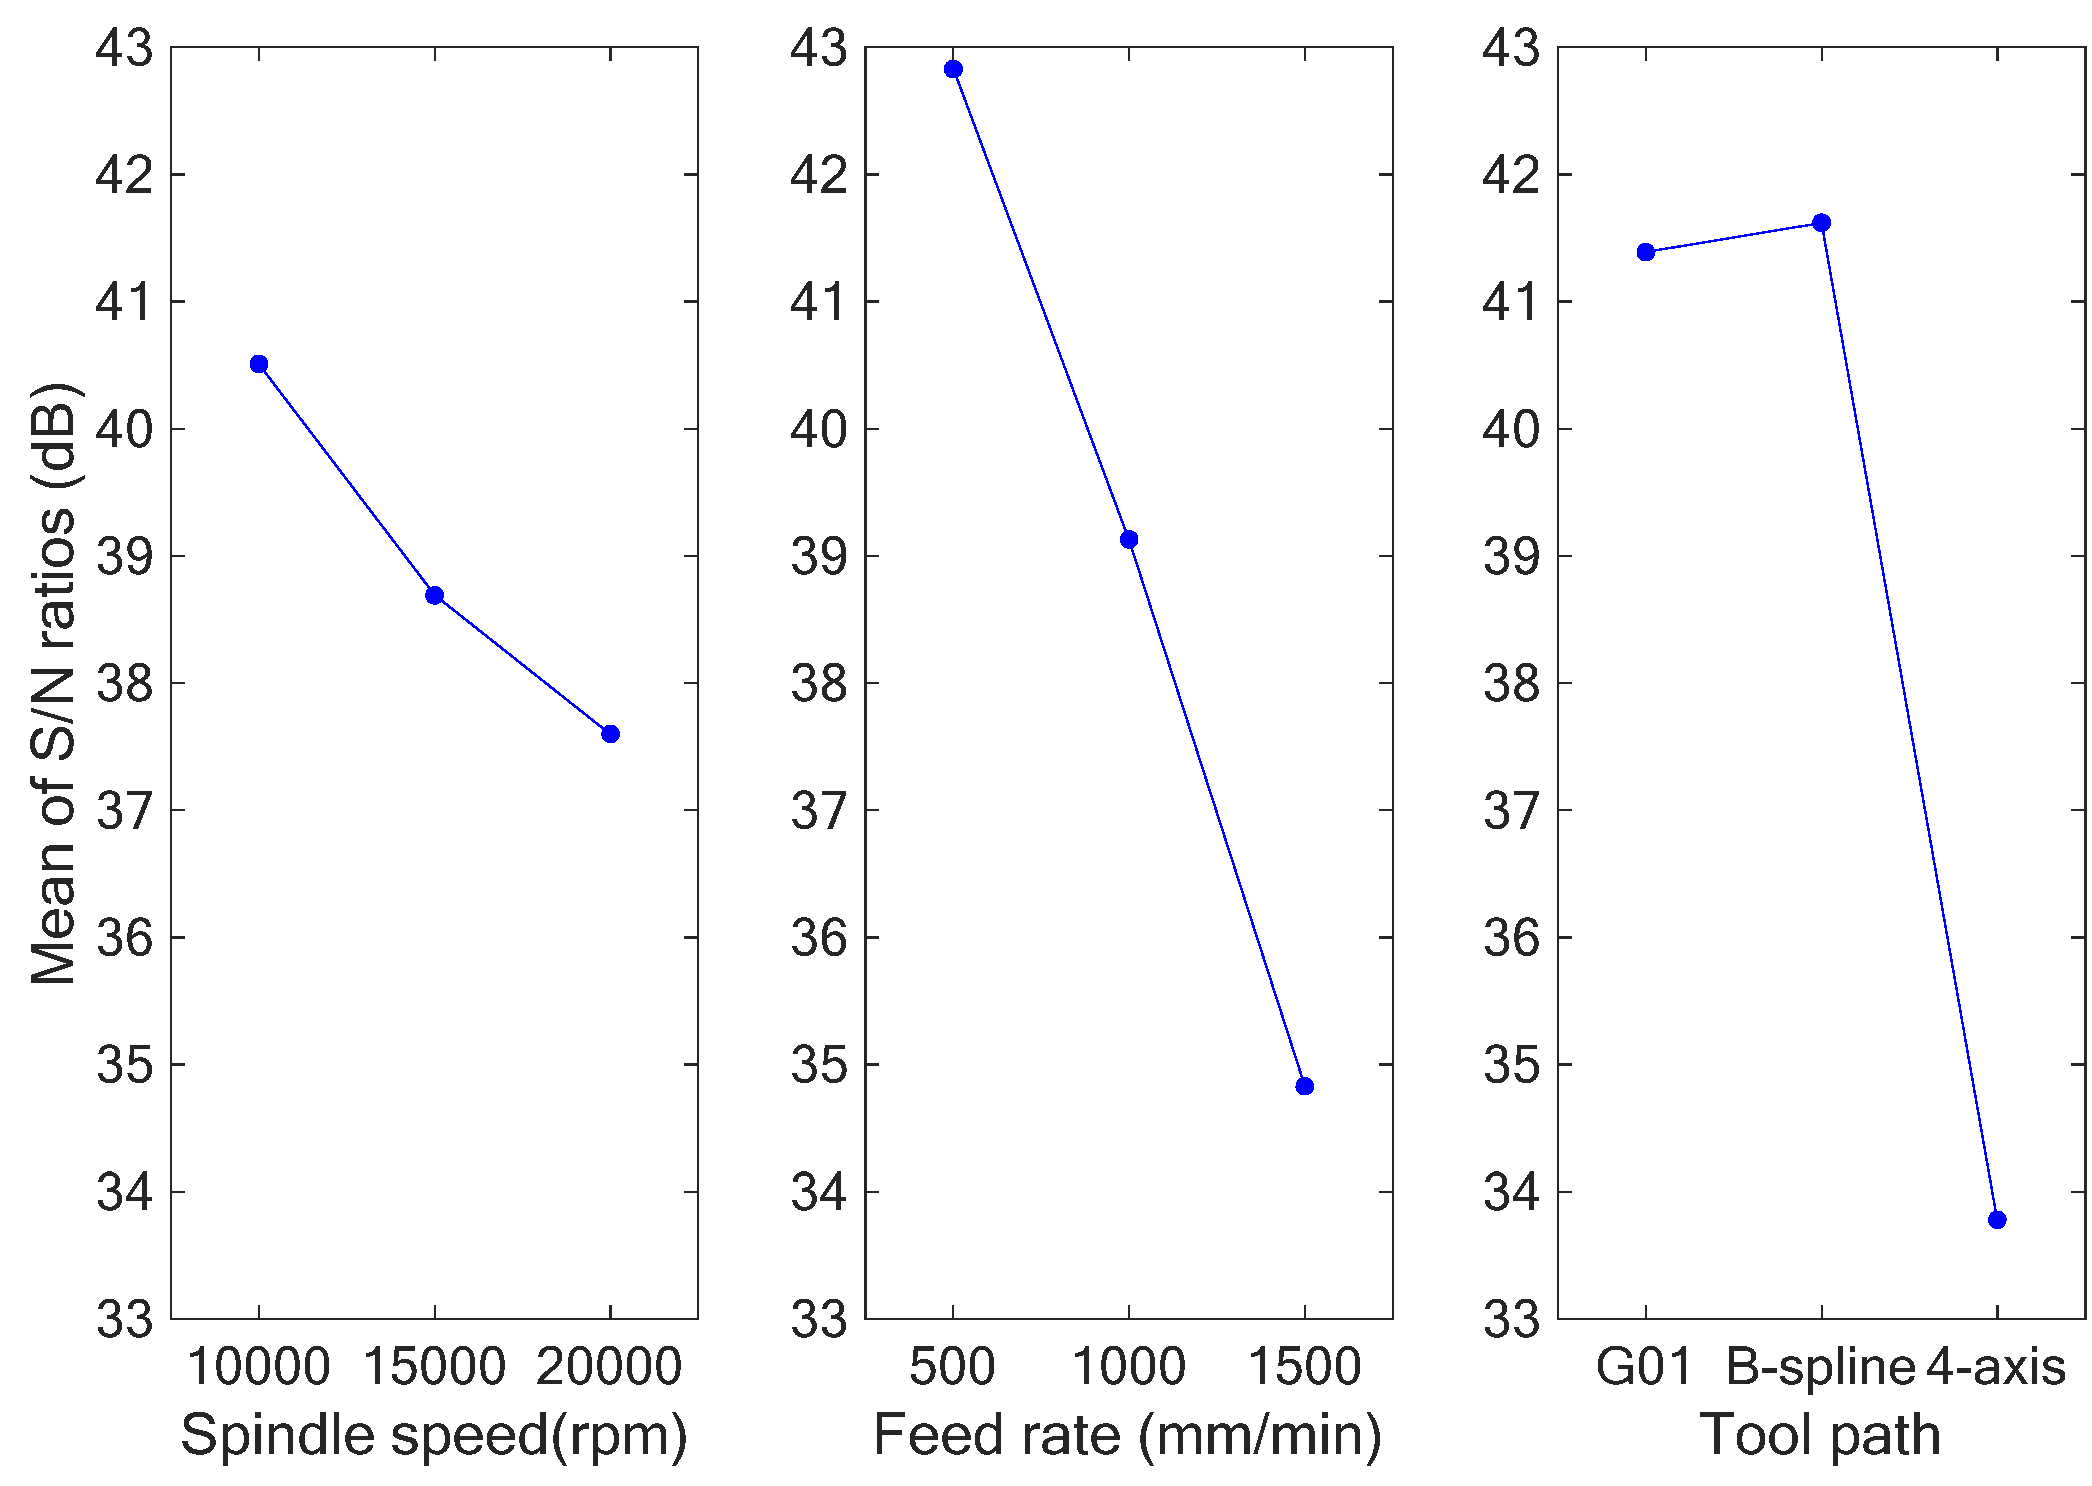
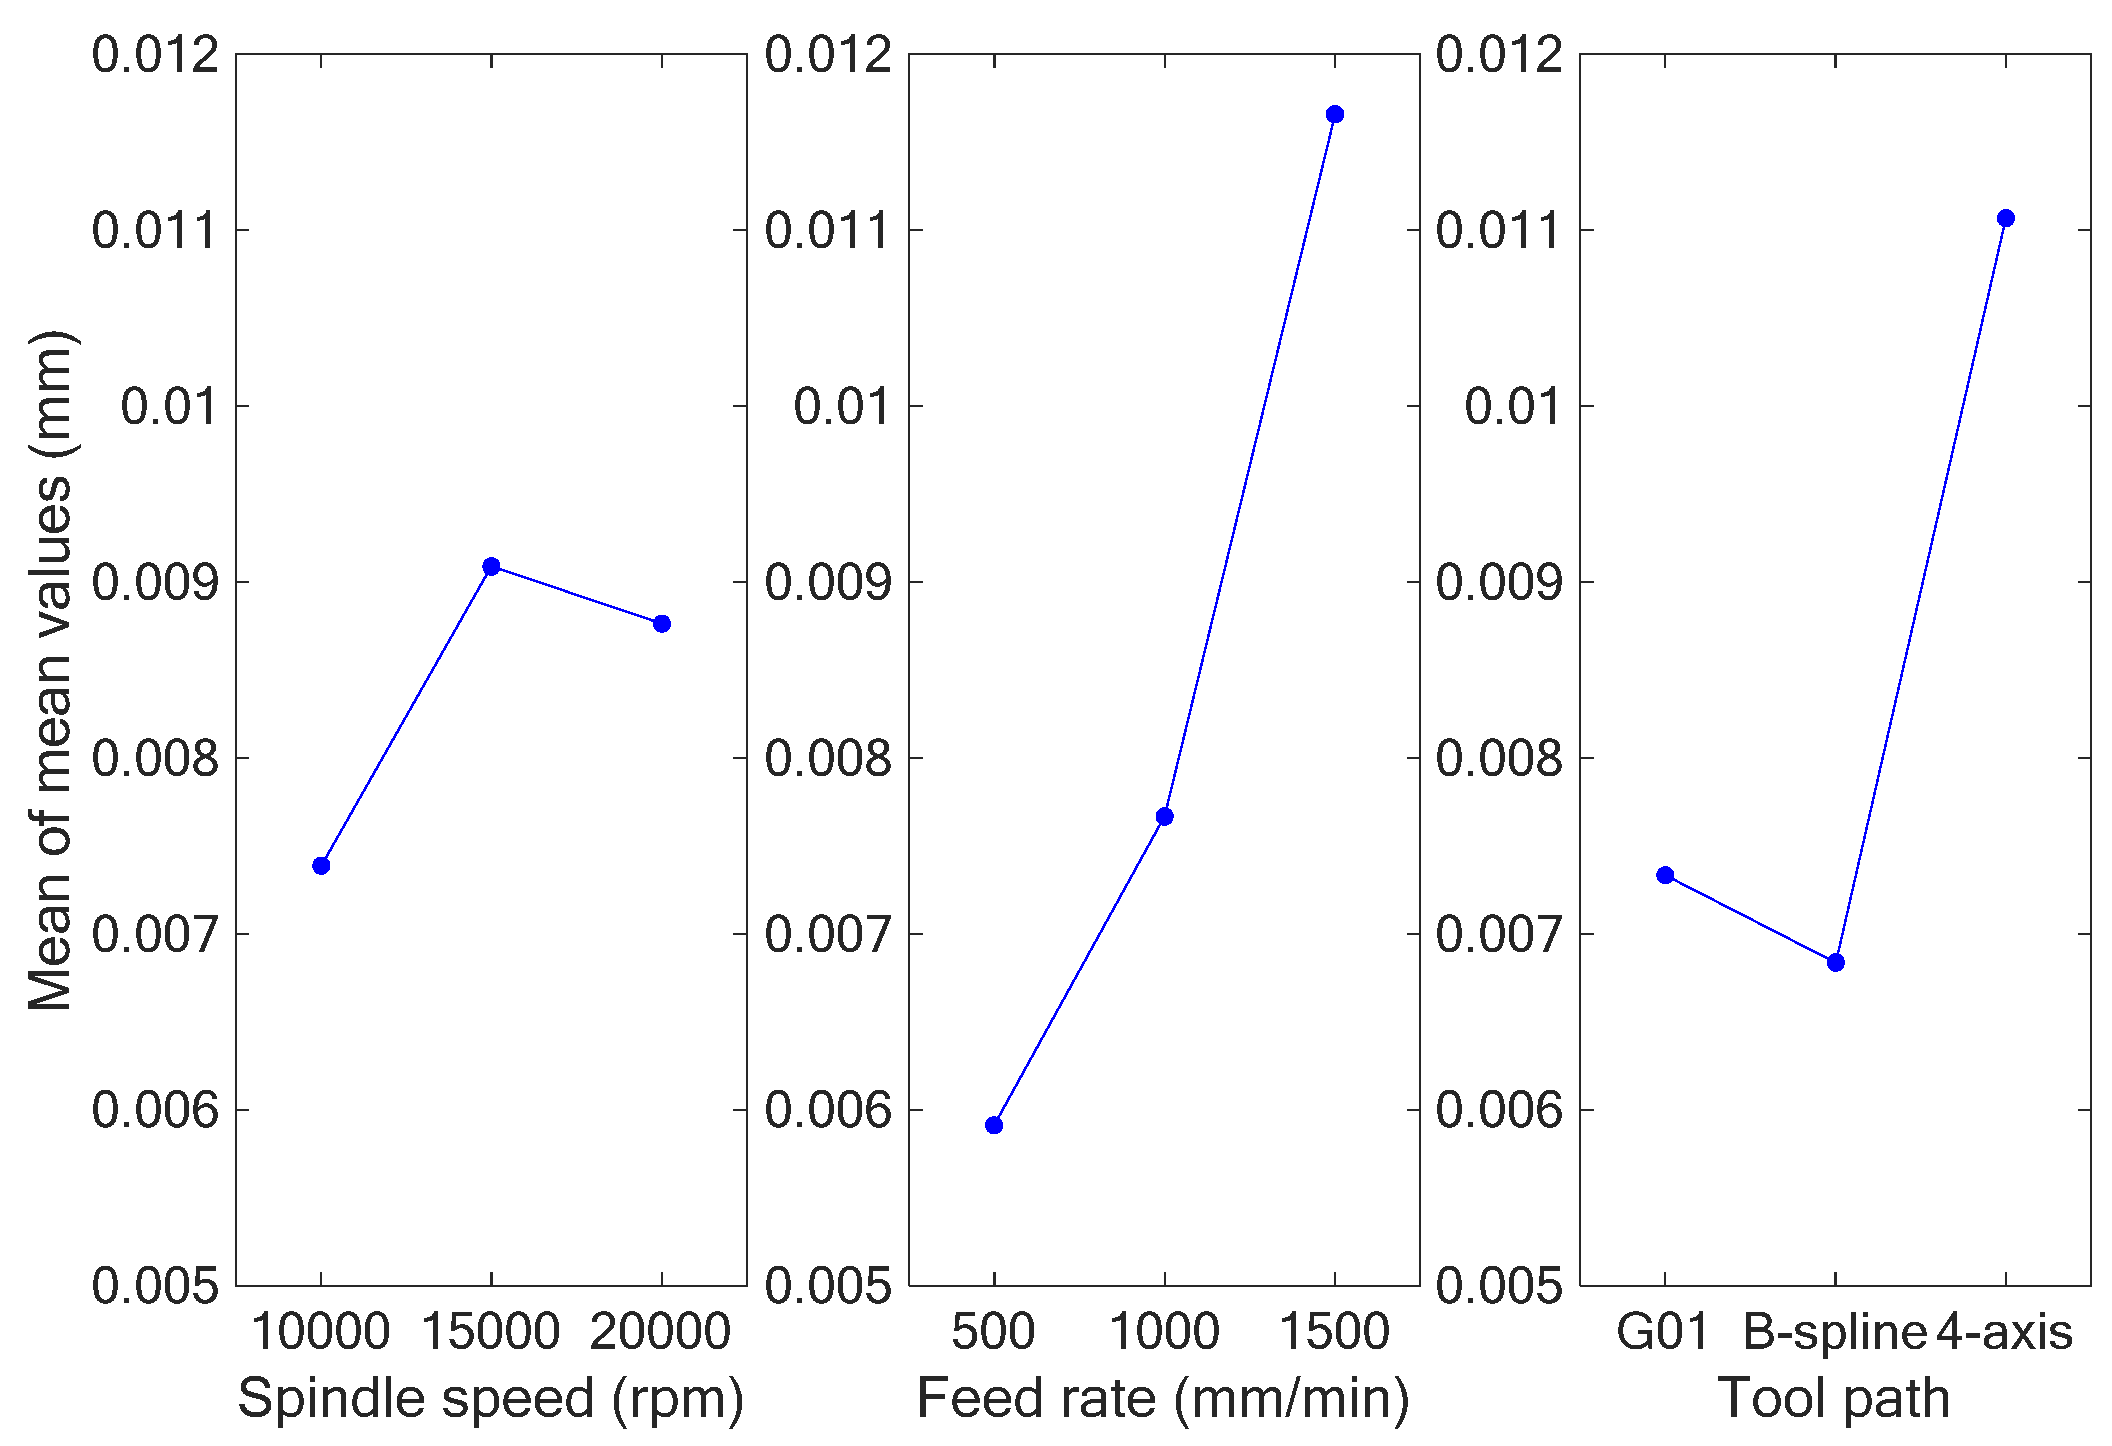
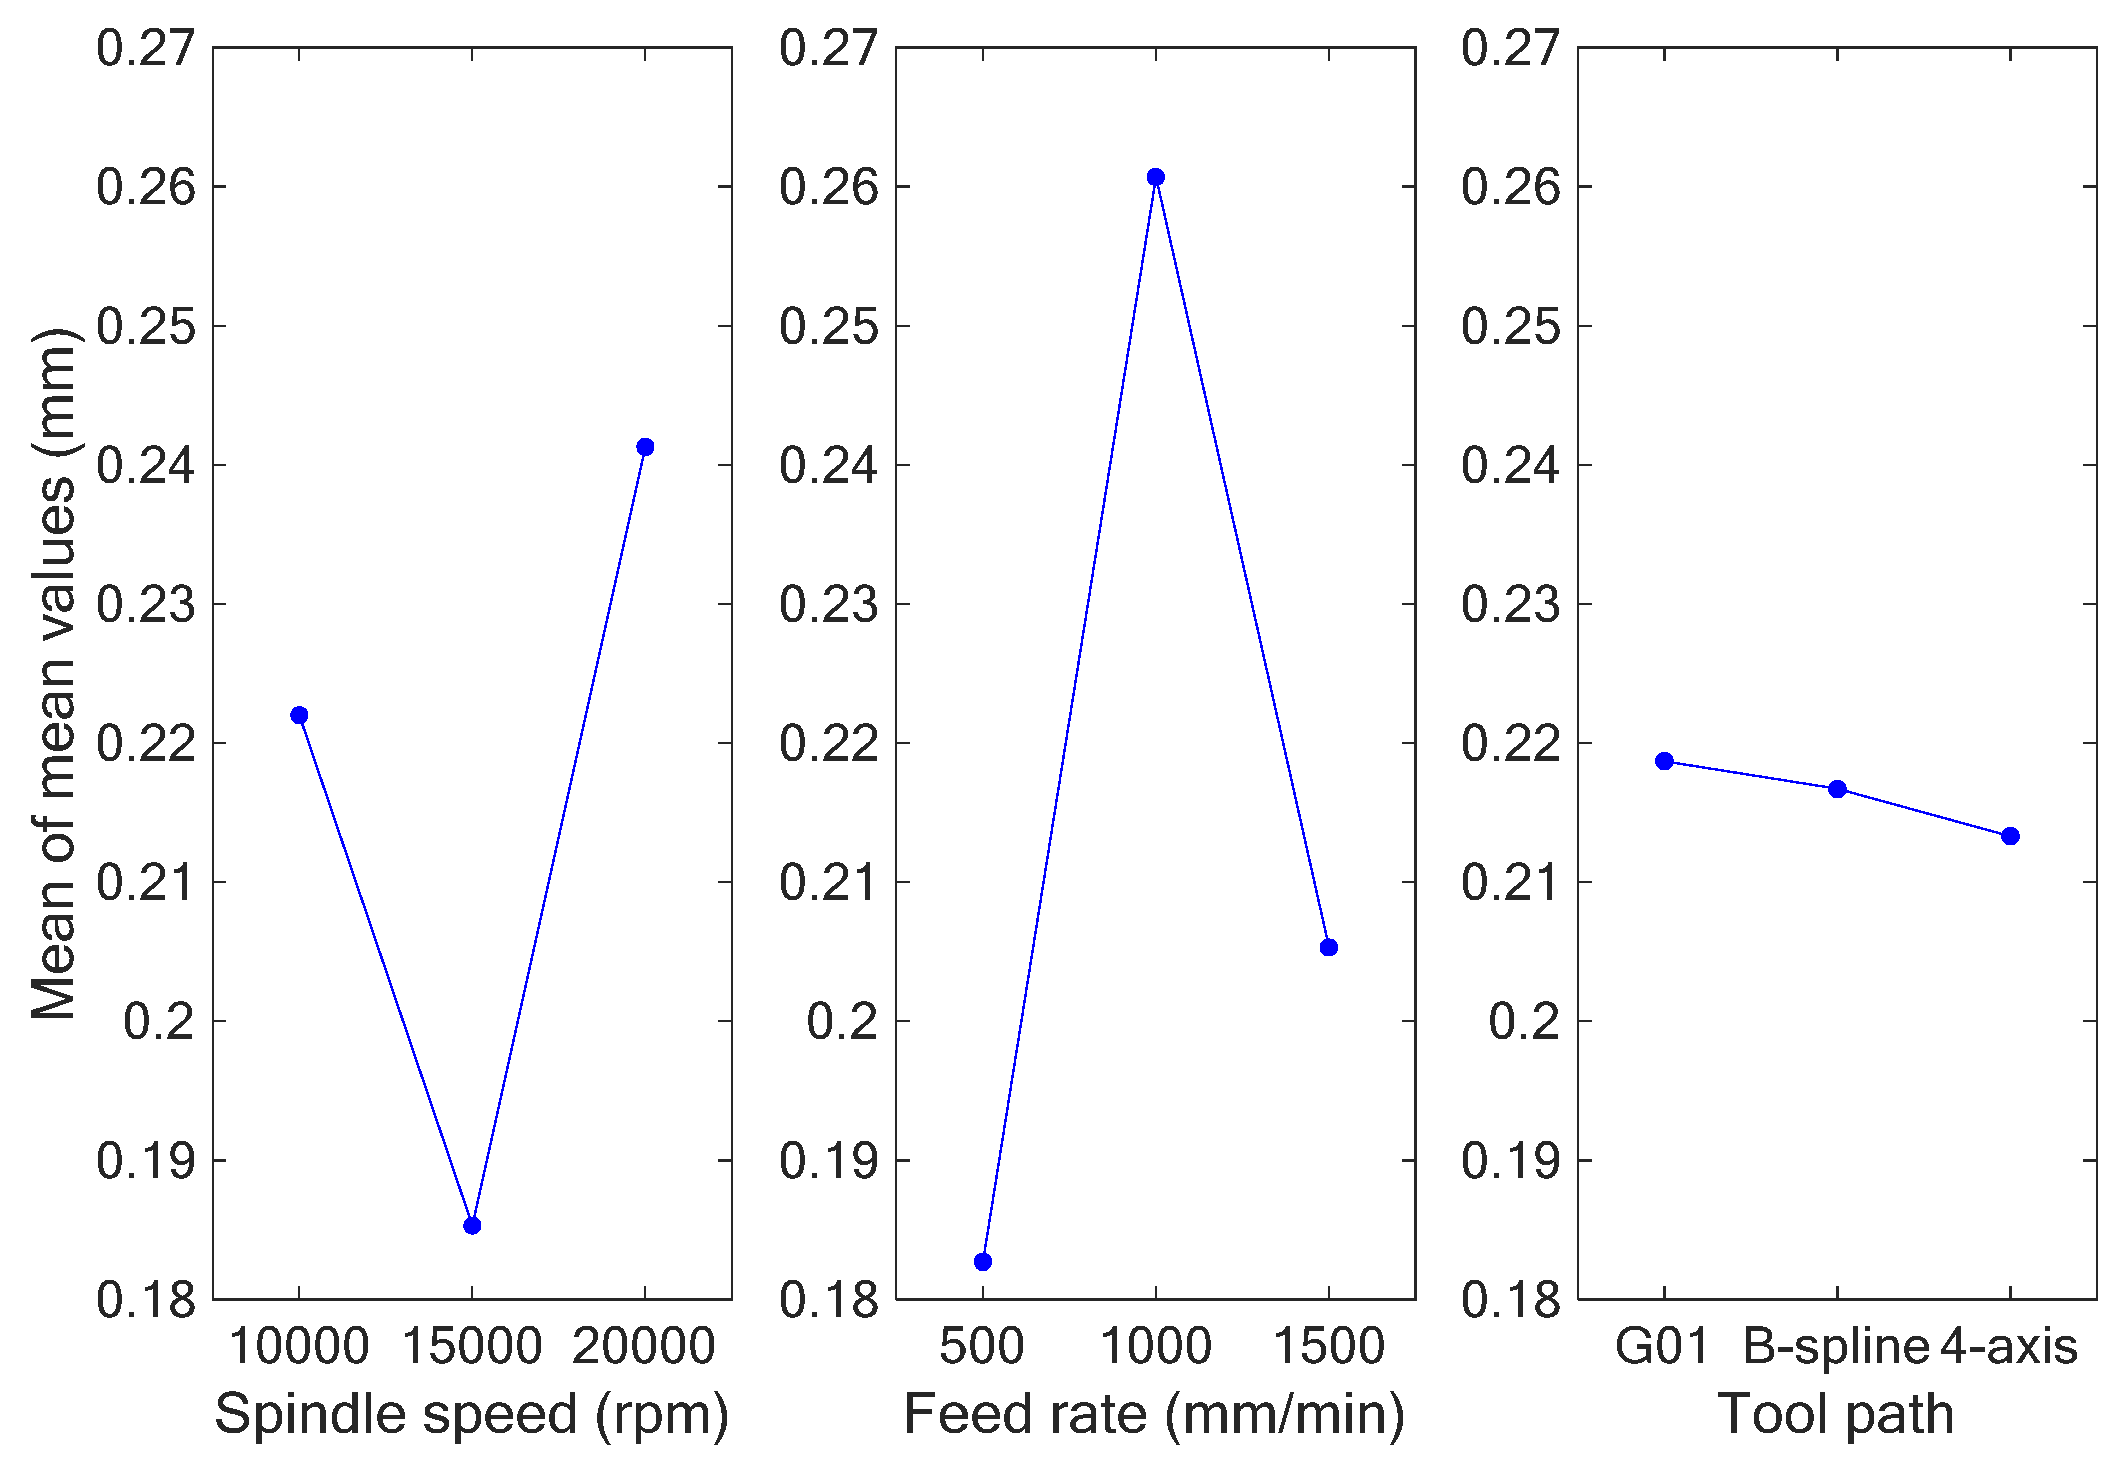
Table 10 and Table 11 are the response tables for the S/N ratios and means, respectively, including their average values at each level and factor; the difference, denoted Δmax-min, between the maximum and minimum average response values for each factor; and the ranks, where rank 1 means the highest difference value, rank 2 the second-highest, and so on. In accordance with the results shown in Table 10 and Table 11, Figure 18 and Figure 19 depict the main effect plots for the S/N ratios and mean values. From Table 10 and Table 11 and Figure 18 and Figure 19, it can be observed that the larger the S/N ratio is, the smaller the mean value is for every control factor. As a larger S/N ratio also means better-quality characteristics, we were consequently able to conclude that the optimum combination of milling parameters was a spindle speed of 10,000 rpm, feed rate of 500 mm/min, and B-spline tool path (A1B1C2).

Table 10.
Response table for S/N ratios for profile errors.

Table 11.
Response table for mean values for profile errors.
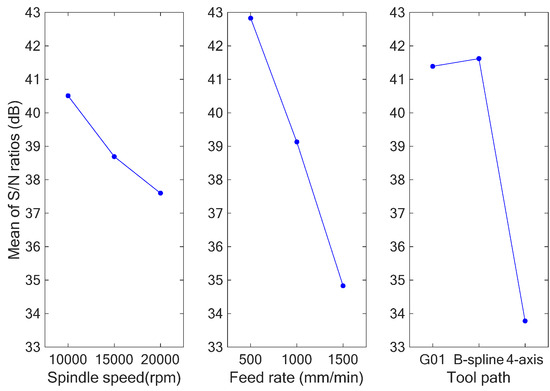
Figure 18.
Graph of S/N ratios for profile errors.
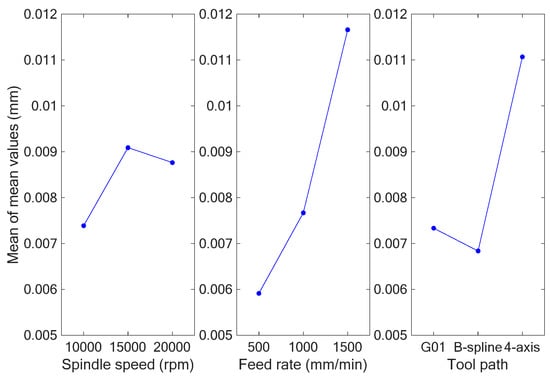
Figure 19.
Graph of mean values for profile errors.
5.3.2. ANOVA and Verification of the Profile Errors
Table 12 shows the results of the ANOVA for the profile errors of scrolls. In this table, the degree of freedom (DF) for each factor is equal to its number of levels minus 1.

Table 12.
ANOVA for the profile errors.
The sum of squares of the S/N ratios for the control factors (SSX) and the total sum of squares of the S/N ratios (SST) can be obtained with the following equations, respectively [30]:
where the subscript of the symbol SSX represents the control factor, m is the number of S/N ratios at each level for each control factor, p is the number of levels, and n is the total number of S/N ratios; i.e., . The error sum of squares is obtained as the difference between SST and the total sum of SSX, which can be expressed as:
The mean squares for each factor (MSX) and error (MSError) are obtained from the ratios of the sum of squares and their degrees of freedom. The ANOVA results shown in Table 12 reveal that the control factor (i.e., the spindle speed) is much less significant than the other two factors; therefore, we pooled this factor into the error term. The results also show that the degree of freedom of the pooled error was 4, the sum of squares was 38.86, and the mean square (MSPooled error) was 9.72. The F-ratio (FX) and percentage of contribution (PX) can be obtained with the following equations [30]:
In accordance with the table of percentage points of the F distribution [30], where the value of F0.1, 2, 4 is 4.32 at a 90% confidence level, we concluded that the feed rate and tool path have much greater influences on the profile errors since their F values are larger than 4.32. Based on the previously revealed results, we determined the optimum combination of milling parameters for fine machining processes: a spindle speed of 10,000 rpm, feed rate of 500 mm/min, and B-spline tool path. For the verification of the recurrence of the optimum combination, we utilized the additive forecast model (i.e., Equation (13)) to predict the S/N ratio of the optimum combination for profile errors. In Equation (13), the symbol indicates the predicted value of the S/N ratio for the optimum combination, is the mean value of all the S/N ratios (here equal to 38.93 dB), and represents the response values of all factors and levels with the optimum combination shown in Table 10.
According to Equation (13), the predicted S/N ratio of the optimum combination of milling parameters was 47.1 dB. We then conducted verification experiments, the results of which are shown in Table 13. Table 13 shows that the verified average S/N ratio was 44.38 dB. Comparing the predicted and verified S/N ratios, we determined that their error was 6.1%, which is under 10%. Table 13 also shows that the results for the optimum combination of milling parameters were obtained with a 90% confidence level.

Table 13.
Measured values, means, and S/N ratios of profile errors from verification experiments.
5.3.3. Optimum Combination of Milling Parameters for Surface Roughness
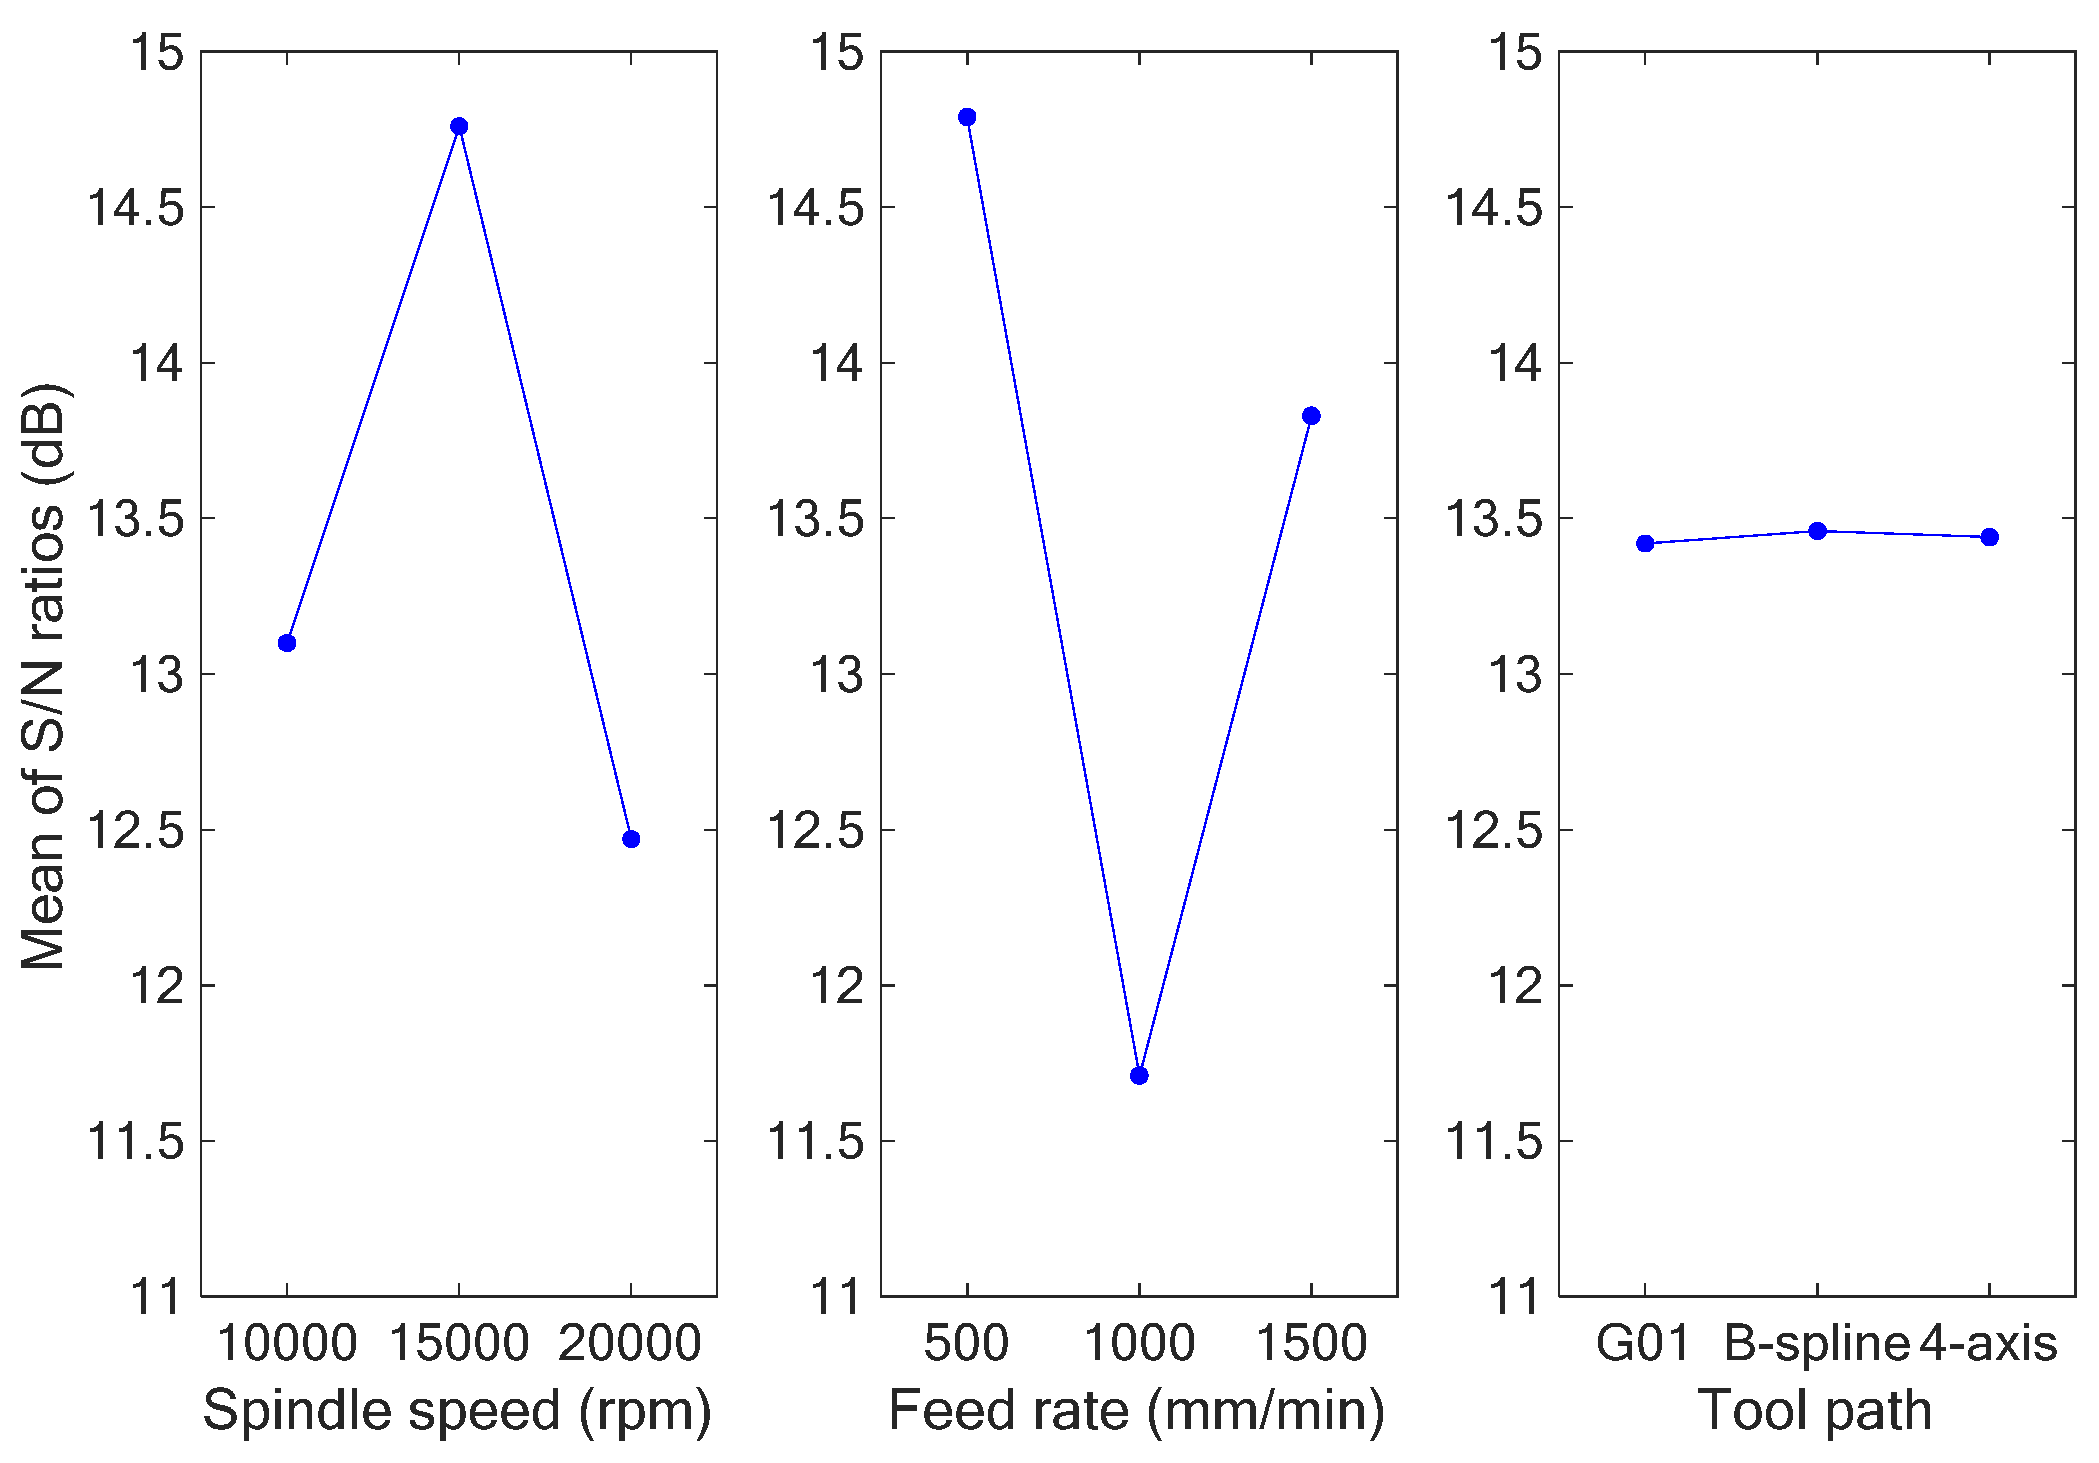
The surface roughness (Ra) of a machined scroll can be used to detect its surface quality. Since lower surface roughness indicates better surface quality, we measured the surface roughness and utilized the smaller-is-better formula (i.e., Equation (7)) to calculate the S/N ratios. Table 14 shows the results for the measured surface roughness, along with the mean values, and the calculated S/N ratios from the experiments. Table 15 and Table 16 are the response tables for the S/N ratios and mean values, respectively, at each level of the factors, showing the differences between the maximum and minimum average response values Δmax−min and the ranks. In accordance with the results shown in Table 15 and Table 16, Figure 20 and Figure 21 depict the main effect plots for the S/N ratios and mean values. As a larger S/N ratio also means better-quality characteristics, we concluded from Table 15 and Table 16 and Figure 20 and Figure 21 that the optimum combination of milling parameters for surface roughness was a spindle speed of 15,000 rpm, feed rate of 500 mm/min, and B-spline tool path (A2B1C2).

Table 14.
Measured values, means, and S/N ratios for surface roughness.

Table 15.
Response table for S/N ratios for surface roughness.

Table 16.
Response table for means for surface roughness.
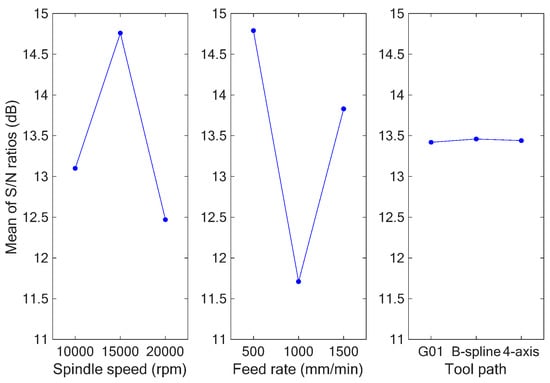
Figure 20.
Graph of S/N ratios for surface roughness.
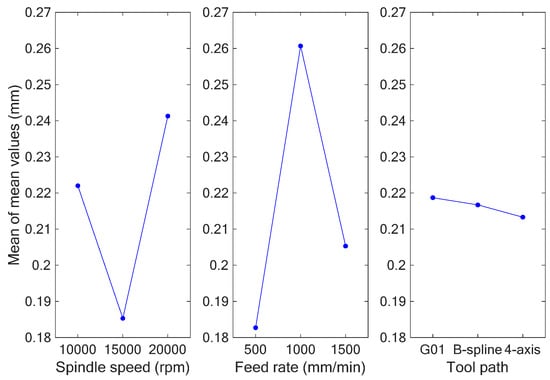
Figure 21.
Graph of mean values for surface roughness.
5.3.4. ANOVA and Verification of the Surface Roughness
Table 17 shows the results of the ANOVA for the surface roughness of the scrolls. As the results shown in Table 17 revealed that the tool path was much less significant than the other two factors, we pooled this control factor with the error term. In accordance with the table of percentage points of the F distribution, where the value of F0.05, 2, 4 is 6.94 at a 95% confidence level, we concluded that the spindle speed and feed rate have much greater influences on the surface roughness since their F values are larger than 6.94.

Table 17.
ANOVA for surface roughness.
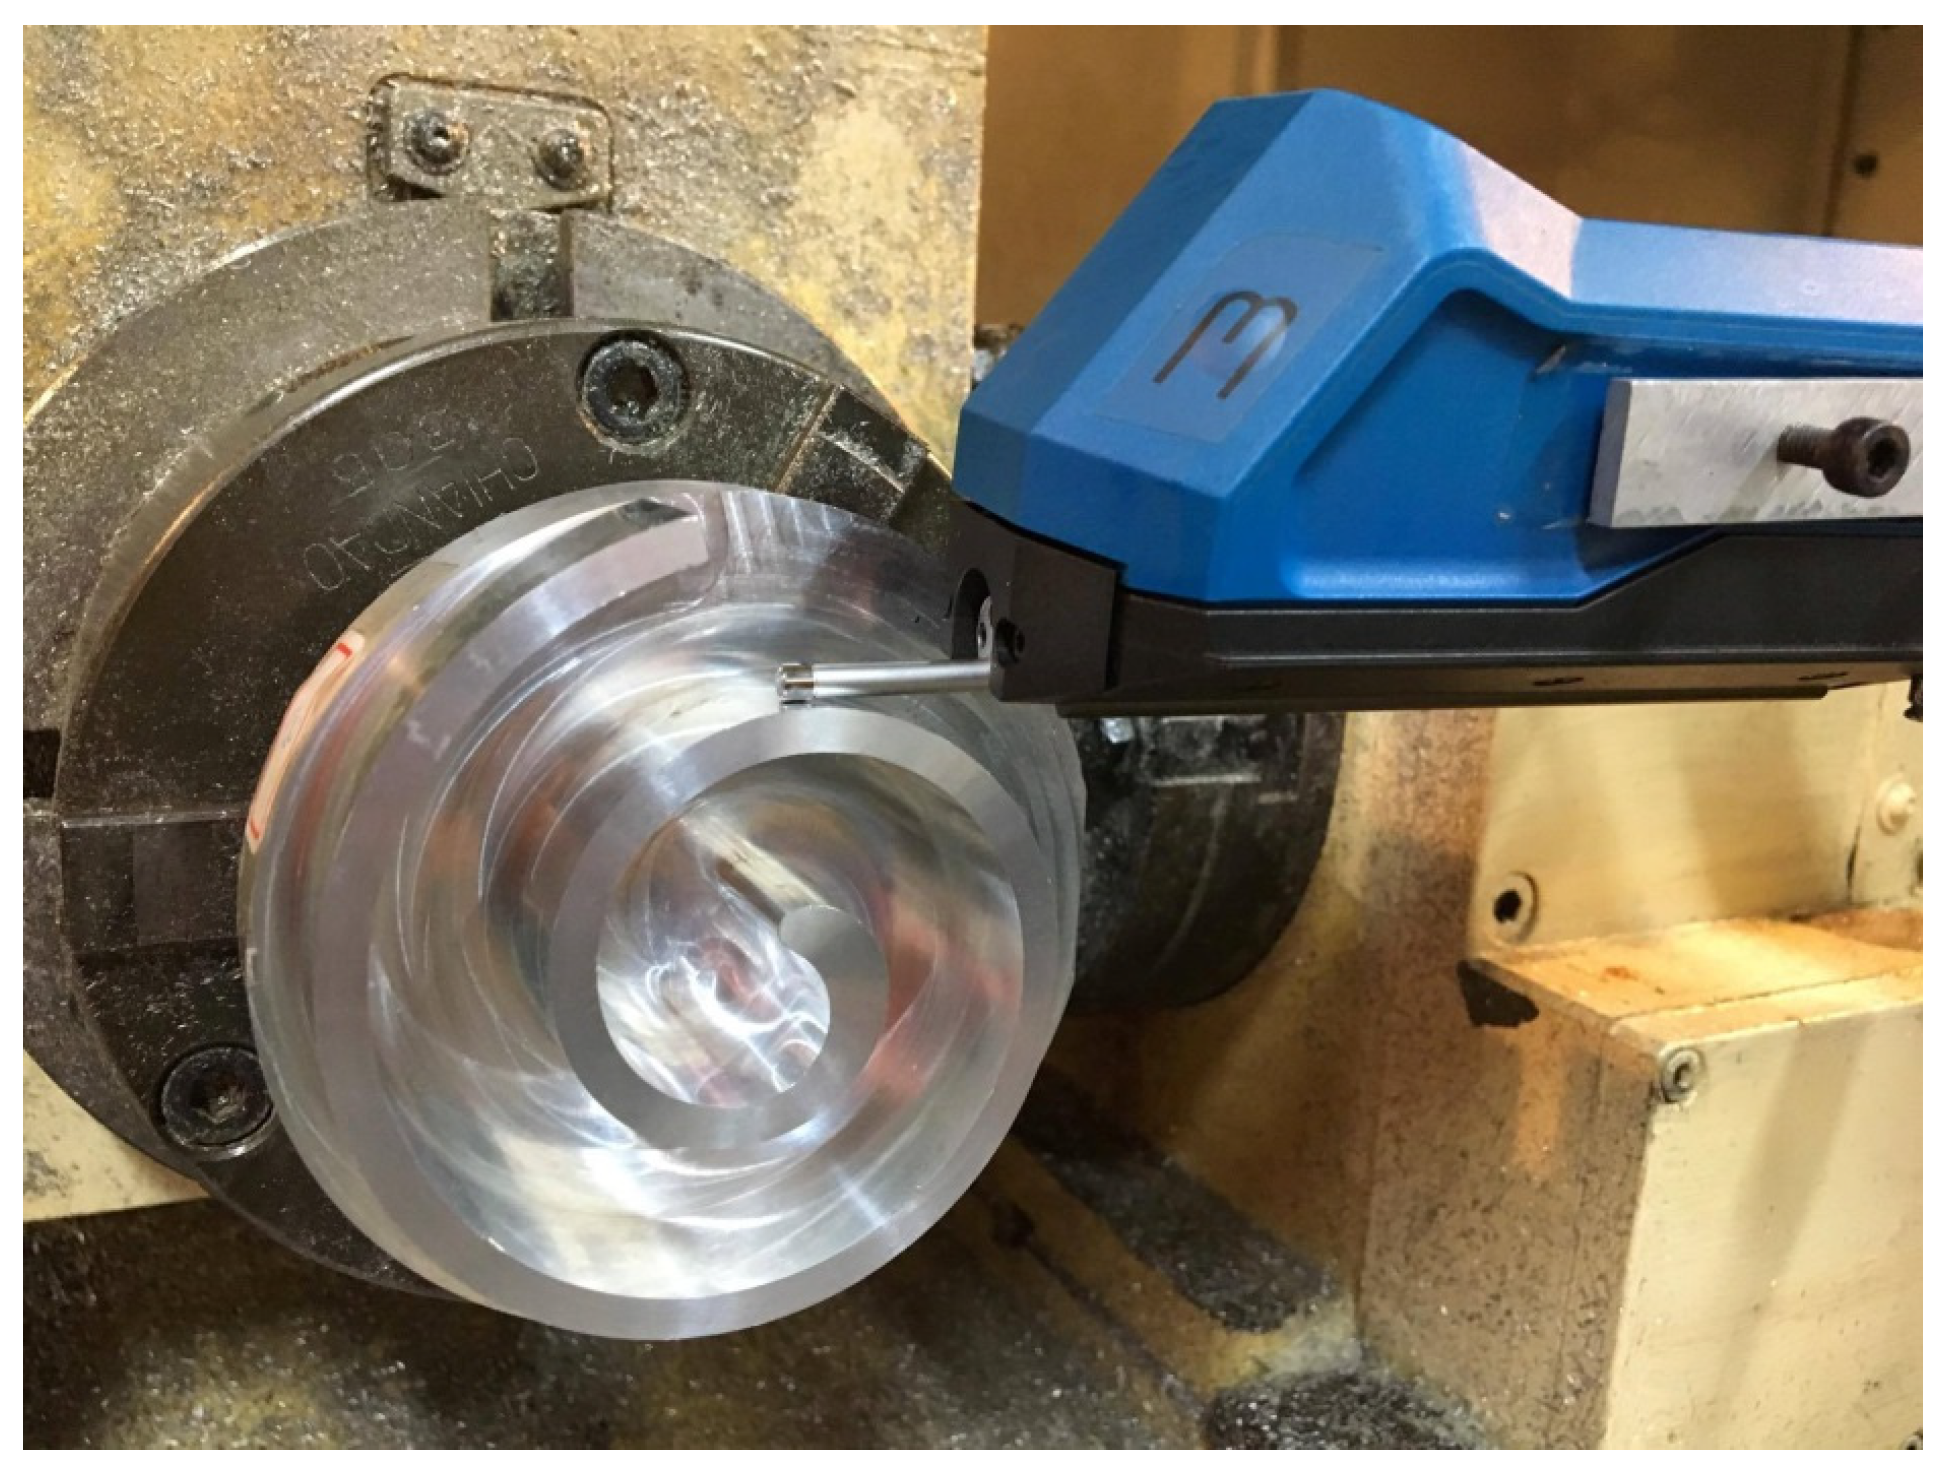
To verify the recurrence of the optimum combination of milling parameters for surface roughness, similarly to Equation (13), we calculated that the predicted S/N ratio for the optimum combination was equal to 16.13 dB. Table 18 demonstrates the results of the verification experiments and shows that the verified average S/N ratio was 15.42 dB. Comparing the predicted and verified S/N ratios, we determined that their error was 4.6%, which is under 5%. Table 18 also shows that the results for the optimum combination of milling parameters for surface roughness were obtained with a 95% confidence level. Finally, Figure 22 shows the scroll workpiece after the fine machining processes.

Table 18.
Mean values and S/N ratios for surface roughness from verification experiments.
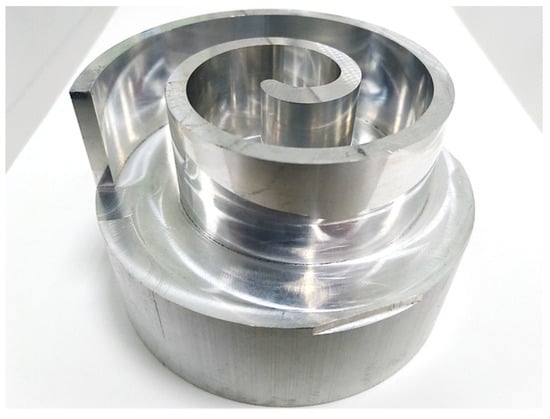
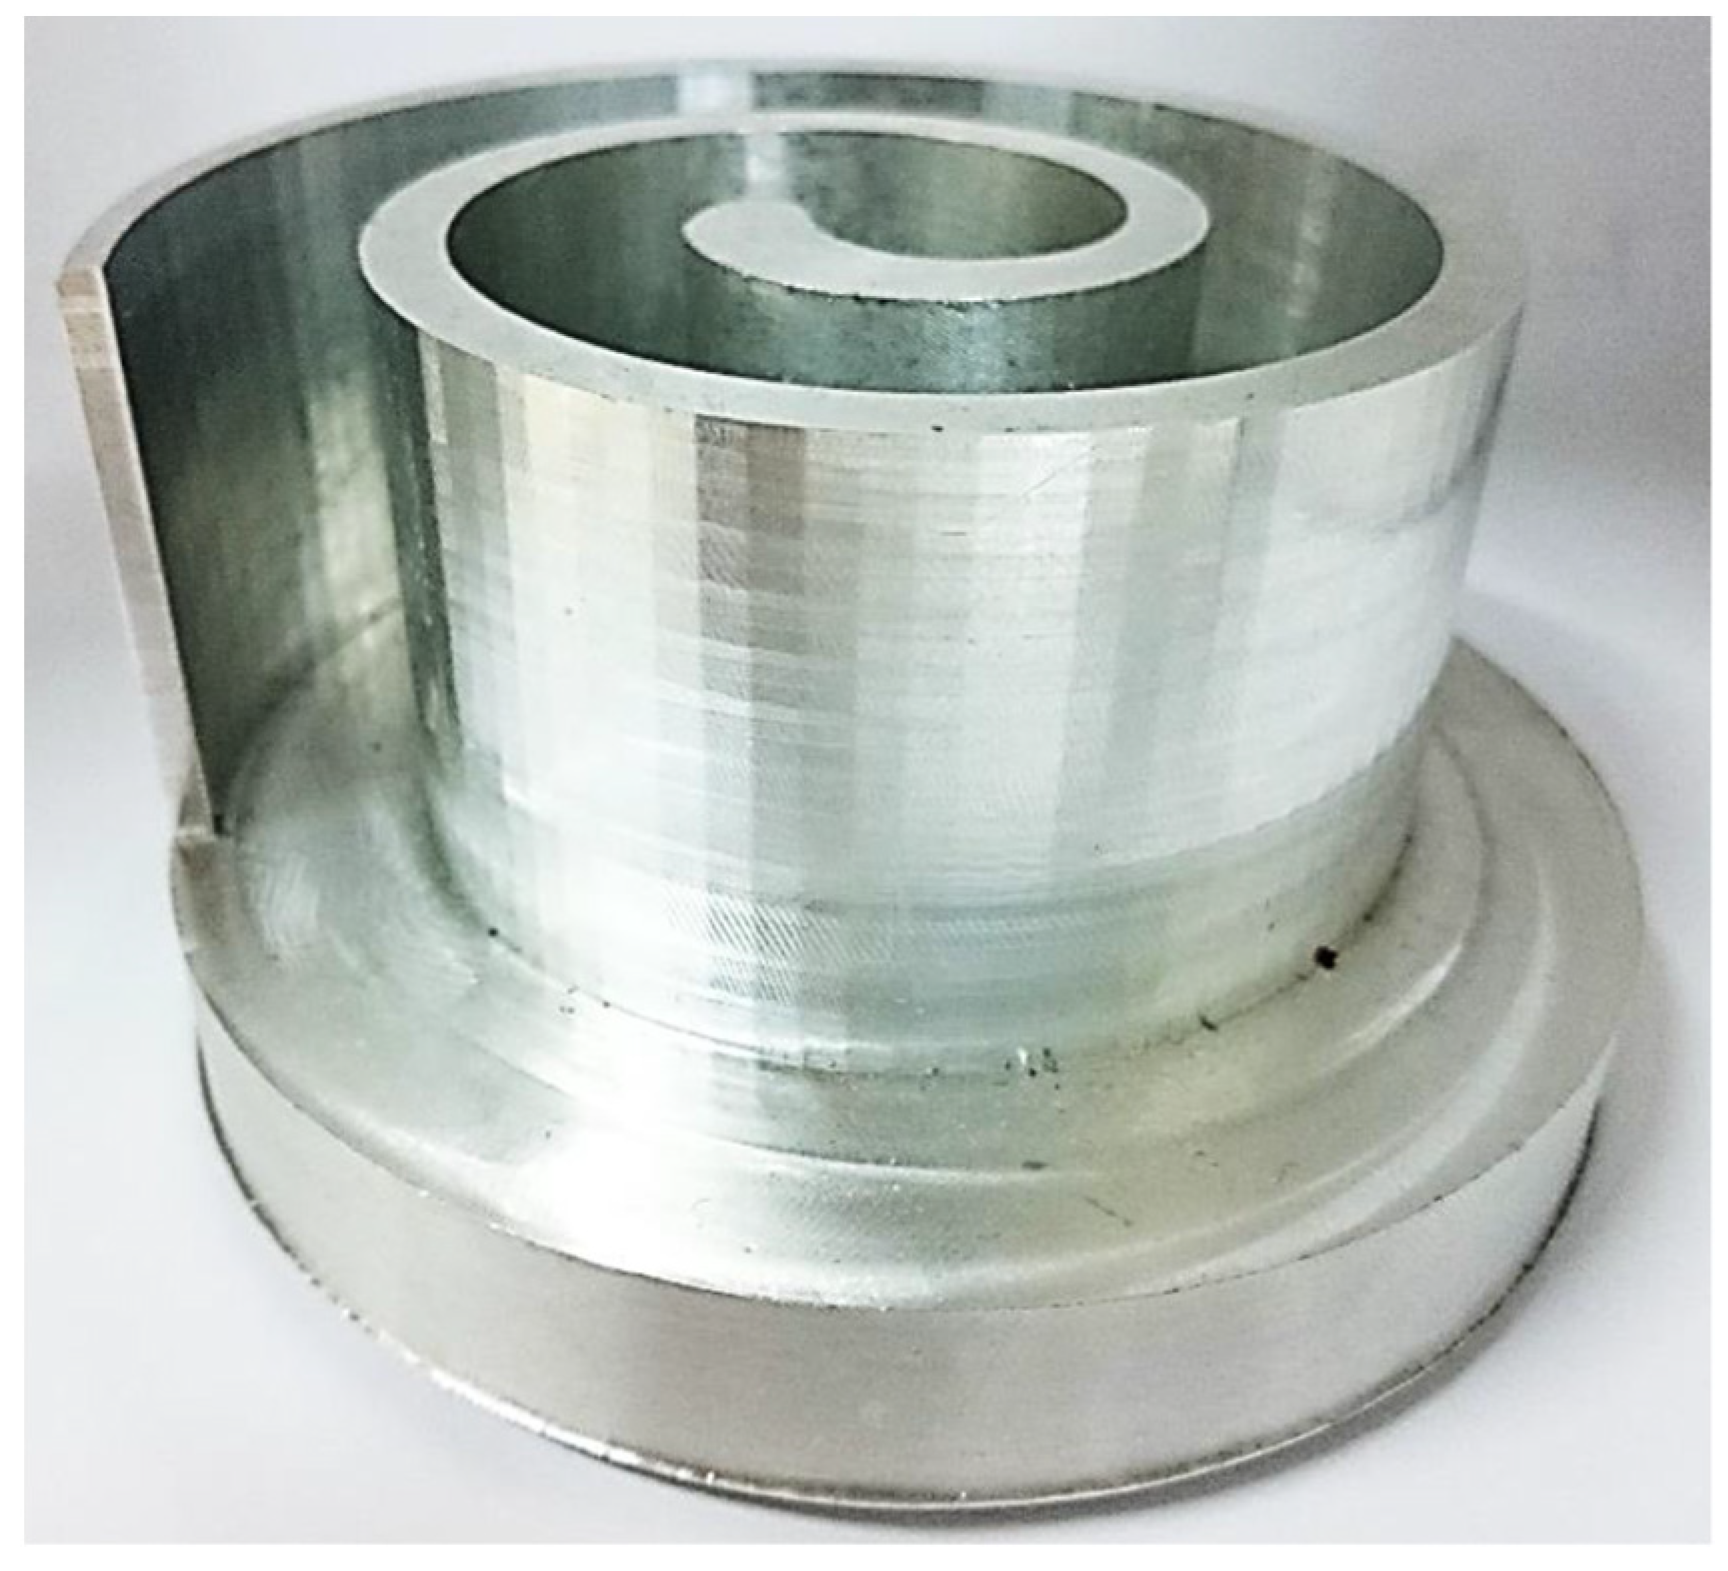
Figure 22.
Scroll workpiece after the fine machining processes.
6. Conclusions
To increase machining efficiency, retain machining precision, and increase the added value from scroll manufacturing, we proposed and demonstrated adaptive milling processes. These processes included adaptive feed rate planning for rough machining processes, chatter suppression for semi-fine and fine machining processes, and optimization of milling parameters for fine machining processes. The experimental tests also demonstrated the following:
- The method of adaptive feed rate planning could increase the material removal rate by about 14.4% and shorten the cutting time by about 12.6% with the following major machining parameters: spindle speed of 6000 rpm, cutting area per cutter tooth of 0.5 mm2, maximum feed rate limit of 1000 mm/min, and maximum bending moment of 26.62 Nm;
- The proposed methods for chatter suppression were feasible with a transition time of 80 ms, and the transition length on the workpiece surface was about 1.05 mm;
- For profile errors, the optimum combination of milling parameters obtained with a 90% confidence level was a spindle speed of 10,000 rpm, feed rate of 500 mm/min, and B-spline tool path;
- For surface roughness, the optimum combination of milling parameters obtained with a 90% confidence level was a spindle speed of 15,000 rpm, feed rate of 500 mm/min, and B-spline tool path;
- The program developed in this study can also successfully perform with and connect to the controllers made by FANUC and DELTA.
As revealed in points 3 and 4, this study demonstrated the usefulness of the Taguchi method in obtained optimum milling parameters. Although it can be observed that the resulting parameters for spindle speeds were different for different profile errors and surface roughness levels, the results of the ANOVA also showed that the spindle speed was much less significant than the other two control factors (i.e., the feed rate and tool path) for profile errors. Further research developing a series of feedforward compensation algorithms to modify tool paths before machining processes is under preparation for publication.
Supplementary Materials
The videos of the machining of the scroll and the measurement of its profile errors can be downloaded at: https://www.mdpi.com/article/10.3390/app13010286/s1, Video S1: Scroll machining processes; Video S2: Profile error measuring processes.
Author Contributions
Conceptualization, Y.-T.L., J.-L.J. and D.-M.T.; methodology, Y.-T.L., J.-L.J., M.S., D.-M.T., G.-S.H. and B.-J.L.; software, Y.-T.L. and J.-L.J.; validation, Y.-T.L., J.-L.J., M.S., D.-M.T., G.-S.H. and B.-J.L.; formal analysis, Y.-T.L. and J.-L.J.; investigation, Y.-T.L. and J.-L.J.; resources, M.S. and B.-J.L.; data curation, Y.-T.L. and J.-L.J.; writing—original draft preparation, Y.-T.L., J.-L.J. and G.-S.H.; writing—review and editing, G.-S.H.; visualization, Y.-T.L., J.-L.J. and G.-S.H.; supervision, D.-M.T.; project administration, D.-M.T.; funding acquisition, D.-M.T. All authors have read and agreed to the published version of the manuscript.
Funding
This research received no external funding.
Institutional Review Board Statement
Not applicable.
Informed Consent Statement
Not applicable.
Data Availability Statement
Not applicable.
Acknowledgments
The authors sincerely appreciate the support from the projects MOST 111-2221-E-110-037, 111-2927-I-110-504, and 111-2218-E-110-004 granted by the Ministry of Science and Technology, Taiwan, as well as DAAD project 408 ID: 57602200 from the Deutscher Akademischer Austauschdienst, Germany. Tongtai Machine and Tool Co., Ltd. deserves our special thanks for their endorsements.
Conflicts of Interest
The authors declare no conflict of interest.
References
- Creux, L. Rotary Engine. U.S. Patent No. 801182, 3 October 1905. [Google Scholar]
- Blunier, B.; Cirrincione, G.; Herve, Y.; Miraoui, A. A new analytical and dynamical model of a scroll compressor with experimental validation. Int. J. Refrig. 2009, 32, 874–891. [Google Scholar] [CrossRef]
- Liu, Y.G.; Hung, C.H.; Chang, Y.C. Design optimization of scroll compressor applied for frictional losses evaluation. Int. J. Refrig. 2010, 33, 615–624. [Google Scholar] [CrossRef]
- Murthy, A.A.; Subiantoro, A.; Norris, S.; Fukuta, M. A review on expanders and their performance in vapour compression refrigeration systems. Int. J. Refrig. 2019, 106, 427–446. [Google Scholar] [CrossRef]
- Altintas, Y.; Erkorkmaz, K. Feedrate optimization for spline interpolation in high speed machine tools. CIRP Ann. 2003, 52, 297–302. [Google Scholar] [CrossRef]
- Dong, J.; Ferreira, P.M.; Stori, J.A. Feed-rate optimization with jerk constraints for generating minimum-time trajectories. Int. J. Mach. Tools Manuf. 2007, 47, 1941–1955. [Google Scholar] [CrossRef]
- Saï, L.; Saï, W.B.; Zghal, A. Chip thickness analysis for different tool motions for adaptive feed rate. J. Mater. Process. Technol. 2008, 204, 213–220. [Google Scholar] [CrossRef]
- Calleja, A.; Bo, P.; Gonzalez, H.; Barton, M.; Lopez de Lacalle, L.N. Highly accurate 5-axis flank CNC machining with conical tools. Int. J. Adv. Manuf. Technol. 2018, 97, 1605–1615. [Google Scholar] [CrossRef]
- Tunc, L.T. Smart tool path generation for 5-axis ball-end milling of sculptured surfaces using process models. Robot. Comput. Integr. Manuf. 2019, 56, 212–221. [Google Scholar] [CrossRef]
- Hashemian, A.; Bo, P.; Barton, M. Reparameterization of ruled surfaces: Toward generating smooth jerk-minimized toolpaths for multi-axis flank CNC milling. Comput.-Aided Des. 2020, 127, 102868. [Google Scholar] [CrossRef]
- Li, Z.; Yan, Q.; Tang, K. Multi-pass adaptive tool path generation for flank milling of thin-walled workpieces based on the deflection constraints. J. Manuf. Process. 2021, 68, 690–705. [Google Scholar] [CrossRef]
- Smith, S.; Tlusty, J. An overview of modeling and simulation of the milling process. ASME J. Eng. Ind. 2008, 113, 169–175. [Google Scholar] [CrossRef]
- Quintana, G.; Ciurana, J. Chatter in machining processes: A review. Int. J. Mach. Tools Manuf. 2011, 51, 363–376. [Google Scholar] [CrossRef]
- Wang, W.K.; Wan, M.; Zhang, W.H.; Yang, Y. Chatter detection methods in the machining processes: A review. J. Manuf. Process. 2022, 77, 240–259. [Google Scholar] [CrossRef]
- Delio, T.; Tlusty, J.; Smith, S. Use of audio signals for chatter detection and control. ASME J. Eng. Ind. 1992, 114, 146–157. [Google Scholar] [CrossRef]
- Quintana, G.; Ciurana, J.; Ferrer, I.; Rodríguez, C.A. Sound mapping for identification of stability lobe diagrams in milling processes. Int. J. Mach. Tools Manuf. 2009, 49, 203–211. [Google Scholar] [CrossRef]
- Tehranizadeh, F.; Berenji, K.R.; Budak, E. Dynamics and chatter stability of crest-cut end mills. Int. J. Mach. Tools Manuf. 2021, 171, 103813. [Google Scholar] [CrossRef]
- Wang, D.; Penter, L.; Hänel, A.; Ihlenfeldt, S.; Wiercigroch, M. Stability enhancement and chatter suppression in continuous radial immersion milling. Int. J. Mech. Sci. 2022, 235, 107711. [Google Scholar] [CrossRef]
- Ghani, J.A.; Choudhury, I.A.; Hassan, H.H. Application of Taguchi method in the optimization of end milling parameters. J. Mater. Process. Technol. 2004, 145, 84–92. [Google Scholar] [CrossRef]
- Kato, K.; Takeuchi, Y.; Maeda, Y.; Yamanaka, T.; Onozuka, H. High precision and high efficiency machining of the scroll compressor pieces: Improvement of machining accuracy in constant cutting point control. Trans. Jpn. Soc. Mech. Eng. Ser. 2005, 71 Pt C, 304–310. (In Japanese) [Google Scholar]
- Yang, J.; Arai1, Y.; Gao, W. Rapid measurement of involute profiles for scroll compressors. Meas. Sci. Rev. 2009, 9, 67–70. [Google Scholar] [CrossRef][Green Version]
- Coşkun, S.; Motorcu, A.R.; Yamankaradeniz, N.; Pulat, E. Evaluation of control parameters’ effects on system performance with Taguchi method in waste heat recovery application using mechanical heat pump. Int. J. Refrig. 2012, 35, 795–809. [Google Scholar] [CrossRef]
- Zhang, Q.; Feng, J.; Zhang, Q.; Peng, X. Performance prediction and evaluation of the scroll-type hydrogen pump for FCVs based on CFD-Taguchi method. Int. J. Hydrog. Energy 2019, 44, 15333–15343. [Google Scholar] [CrossRef]
- Martellotti, M.E. An analysis of the milling process part 2: Down milling. ASME Trans. 1945, 63, 677–700. [Google Scholar] [CrossRef]
- Li, H.Z.; Liu, K.; Li, X.P. A new method for determining the undeformed chip thickness in milling. J. Mater. Process. Technol. 2001, 113, 378–384. [Google Scholar] [CrossRef]
- Altintas, Y. Manufacturing Automation: Metal Cutting Mechanics, Machine Tool Vibrations, and CNC Design; Cambridge University Press: Cambridge, UK, 2000. [Google Scholar]
- Tlusty, J. High-speed machining. Ann. CIRP 1993, 42, 733–738. [Google Scholar] [CrossRef]
- Munoa, J.; Iglesias, A.; Olarra, A.; Dombovari, Z.; Zatarain, M.; Stepan, G. Design of self-tunable mass damper for modular fixturing systems. CIRP Ann.-Manuf. Technol. 2016, 65, 389–392. [Google Scholar] [CrossRef]
- Taguchi, G.; Chowdhury, S.; Wu, Y. Taguchi’s Quality Engineering Handbook; John Wiley & Sons, Inc.: Hoboken, NJ, USA, 2005. [Google Scholar]
- Lee, H.H. Taguchi Methods: Principles and Practices of Quality Design; Gau Lih Book Co.: Taipei City, Taiwan, 2020. (In Chinese) [Google Scholar]
Disclaimer/Publisher’s Note: The statements, opinions and data contained in all publications are solely those of the individual author(s) and contributor(s) and not of MDPI and/or the editor(s). MDPI and/or the editor(s) disclaim responsibility for any injury to people or property resulting from any ideas, methods, instructions or products referred to in the content. |
© 2022 by the authors. Licensee MDPI, Basel, Switzerland. This article is an open access article distributed under the terms and conditions of the Creative Commons Attribution (CC BY) license (https://creativecommons.org/licenses/by/4.0/).

