Article

Optimization of the Cutting Parameters Affecting the Turning of AISI 52100 Bearing Steel Using the Box-Behnken Experimental Design Method

1
Department of Industrial Engineering, Faculty of Engineering and Natural Sciences, Bursa Technical University, Bursa 16330, Turkey
2
Department of Mechanical Engineering, Faculty of Engineering, Amasya University, Amasya 05100, Turkey
*
Author to whom correspondence should be addressed.
Appl. Sci. 2023, 13(1), 3; https://doi.org/10.3390/app13010003
Submission received: 28 November 2022 / Revised: 8 December 2022 / Accepted: 13 December 2022 / Published: 20 December 2022

Abstract

:
In this study, we aimed to optimize the cutting parameters that affect the minimum temperature and power consumption in the turning of AISI 52100 bearing steel. For this, the Box-Behnken experimental design method, which was used for the lowest number of experiments in the experimental systems created using the response surface method (RSM), was used. The cutting parameters affecting the turning of the AISI 52100 bearing steel were determined as the cutting speed, depth of cut, and feed rate based on a literature research. The temperature and power consumption values were obtained via analyses according to the experimental design method determined by the finite element analysis (FEM) method. The results obtained were analyzed in Design Expert 13 software. According to the analysis results, the parameter values were determined for the minimum temperature and power consumption. The temperature and power consumption variables were affected by all three parameters, namely the cutting speed, depth of cut, and feed rate. For the minimum temperature and power consumption, a cutting speed of 162.427 m/min, depth of cut of 1.395 mm, and feed rate of 0.247 mm/rev, as well as the feed rate parameters, affected both the temperature and power consumption the most. In addition, it was determined that the cutting speed parameter had the least effect on both the temperature and power consumption variables. In addition, validation experiments were carried out in a real experimental environment with optimum values for the cutting parameters. The results showed that the output values obtained within the limits of the study with the obtained equation were quite close (3.3% error for temperature, 6.6% error for power consumption) to the real experimental outputs.

1. Introduction

Machining is basically a chip formation process in which the excess material on a workpiece is removed using cutting tools [1]. There are important factors that are used to determine the quality increase in the products manufactured using the machining method, including the machine tool, characteristics and coating of the cutting tools, coolant, cutting conditions, cutting speed, depth of cut, and feed of cut that are used. These elements are the parameters that directly affect the quality of the produced material [2]. Choosing the appropriate cutting parameters and cutting tool in machining operations provides important advantages such as high productivity, the desired surface roughness, low costs, and energy efficiency [3,4].
In machining processes, because of the wear of the cutting tool in various ways, some changes occur as it moves away from the initial conditions. A lack of homogeneity in the structural compositions of the tool and test material could be the origin of changes in the ideal initial conditions. In addition, factors such as the type and amount of tool wear [5], chip shape, fluctuations in cutting forces, and chattering vibrations that occur in the natural course of the process are also factors that disrupt the continuity of the machining and cause unpredictable results [6]. Therefore, it is important to examine many variables such as the wear of cutting tool, surface integrity, cutting tool breakage, cutting temperature, and power consumption in machining operations [7,8].
Metal cutting is performed because of the movement of the tool and the test material relative to each other. By transferring the energy given to the machine to the cutting tool and test material, the process of chip removal is carried out with linear or circular motions in various axes. For this reason, the cutting speed, feed rate, and depth of cut come to the fore as basic parameters [6]. One of the oldest and most used techniques for metal cutting is turning with a single-point cutting tool. During turning, some of the energy transferred to the machine to remove chips from the material turns into heat energy due to the high cutting speeds and pressure, as well as high temperatures at the tool and workpiece contact points. Although the increase in temperature facilitates deformation, it affects the material properties and accelerates diffusion [9]. Although the main trigger of the generating temperature is the friction force, the shear strength and plastic deformation also have a share in increasing the cutting temperatures. Thanks to the chip, a significant percentage of the heat generated during cutting is removed. However, the spread of a small amount of heat towards the cutting tool and the workpiece affects the material properties and leads to the advancement of various wear mechanisms and wear types on the edge of the cutting tool. Consequently, it is essential to examine the factors that affect the cutting temperatures [10].
In addition to the cutting temperature, the energy savings for machine tools used in a significant part of the production sector in industrial equipment is becoming increasingly important for customers, consumers, industrial equipment, and governments [11]. The power requirements of a machine tool include variable and fixed power components. It has been determined that a machine tool’s energy consumption depends on the average power demands and the machining time determined by the cutting parameters. The environmental performance of processing systems may be significantly improved by increasing the energy efficiency of the machines. With the recent increase in energy demands, energy conservation has become a priority in the manufacturing industry. When the effects of the processing parameters on the power consumption have been examined using parameter optimization methods such as the Taguchi, response surface method (RSM), and ANOVA techniques, it has been revealed that up to 40% energy conservation can be achieved by choosing the optimum parameters [12]. Turning, which is frequently used in machining, is one of the most frequently used methods in experimental studies on machining. In order to reduce time and cost in production, the use of scientific methods is becoming more common by the day. Experimental design methods also play an important role for businesses to increase their market share and work effectively in increasing competition conditions [13].
In this paper, the studies on the optimization of the cutting parameters that are effective in the processing of AISI 52100 bearing steel used in our work, together with the studies using the RSM method for the optimization of the parameters that are effective in the processing of materials, are analyzed in the Materials and Methods section.
For the machining experiments we used AISI 52100 steel bearing, which is widely used in various mechanical applications due to its high tensile and fatigue strengths. The experiments were first performed with the FEM (finite element method) and parameter optimization was carried out with an experimental design method using a Box-Behnken-based RSM approach. The input parameters used in the study were selected as the feed rate, cutting speed, and depth of cut, considering the studies in the literature. Using these input parameters, the effects of these parameters on the power consumption and temperature outputs were analyzed. By using the optimum values obtained for the cutting parameters, estimations with the regression equation, simulations with the FEM, and validation experiments in a real experimental environment were performed. The aim of this study was to optimize the cutting parameters for the minimum temperature and power consumption when turning AISI 52100 bearing steel using the RSM method. Thus, we aimed to increase the durability of the cutting tools by optimizing both the temperature and power consumption variables to protect the microstructure of the processed material and to provide benefits such as energy savings. With the equations obtained here, real experiments were carried out on a machine tool with the optimum input parameters.
The contribution of this study is the optimization of the power consumption and temperature outputs for AISI 52100 steel bearings by analyzing them with FEM experiments and real experiments, and to the best knowledge of the authors, this study is the first in the literature. In addition, this study is the first to use the Box-Behnken method with output responses for power consumption and temperature. All experimental data are shared in this paper in order to contribute to the machining community.
In the next section of the study (Section 2), the cutting process, RSM, and related studies in the literature are summarized. Additionally, Section 2 includes the FEM simulation and experimental design method. Section 3 includes the comparative results and a discussion of the study. In Section 4, the conclusions and future study directions are given.

2. Materials and Methods

Figure 1 shows a diagram of the methodology used in the study. Firstly, similar studies in the literature were discussed, and considering these studies, the input parameters and response outputs of the cutting process were determined. However, the Box-Behnken experimental design, which has not been used in this field before, was used as the method in the literature. The experiments were first performed with FEM in accordance with the experimental design approach. The effects of the input parameters on the outputs were examined and their relationships were analyzed. Then, the optimum values of the input parameters were obtained, and by using these values both the regression equation was estimated and the FEM experiments and real experiments were carried out for validation. Finally, the results obtained by these three methods were compared and analyzed.

2.1. Experimental Design Methods

Experimental design helps identify variables that affect the quality characteristics in a process. Thus, the expected performance from the process or the optimum level of the related quality characteristic can be determined and the quality of the process can be improved. Experimental design is used in many sectors, especially in the development of production processes, new product design, formulation development, and process optimization. It allows the experimental study to be carried out without the consumption of excessive resources (time, material, personnel, equipment, etc.) and the results to be interpreted and all factor effects to be seen [14].
Thanks to the experimental design methods, the parameters of the relevant process can be defined and the important parameters can be controlled [15]. While using an experimental design method to determine how parameters affect the objective or response functions, as the traditional approach, one variable is changed at a time. However, this approach is time-consuming, especially for multivariate systems and also when considering multiple responses. The statistical design of experiments, on the other hand, reduces the number of experiments that need to be conducted, considers the interactions between variables, and can be applied to optimize the process parameters of multivariate systems [16].
Experimental designs are primarily divided into two groups as classical and modern methods. These methods are briefly described below.

2.1.1. Classical Methods

One factor at a time: According to classical experimental design approaches, the easiest and most frequently applied method is to observe the changes in product or process performance by changing the level of a single factor in each experiment. As the number of factors at hand increases, different classical designs that can be applied begin to appear.
Full factorial experimental design: The experimental design method that seems most ‘optimal’ in terms of evaluating and interpreting the effects of factors is the full factorial experimental design approach because all possible combinations of different levels of factors are evaluated. In such designs, an equal number of test results are taken from each level of each factor and they are compared with each other. This method can only be used when very few factors are involved because the number of experiments required increases rapidly with the number of factors and their levels.
Partial factorial experimental design: With this approach, only a consciously chosen part of the possible combinations is tried and evaluated. In this way, all resources, especially manpower, as well as time and money are saved during the experiments. With this design method, orthogonal indexes are used. By changing the level of more than one factor in each experiment, it is ensured that the levels of all factors are tested with a small number of experiments. In order to reduce the number of experiments for partial factorial experimental design, “high value” and “low value” are chosen as the two possible factor levels. Thus, instead of performing all combinations of experiments, only the effects of the factors and levels that are thought to affect the results in terms of the performance characteristics can be investigated [17].

2.1.2. Modern Experimental Design

Taguchi experiment design: The Taguchi method allows the creation of full factorial experiments with a small number of partial factorial selections to a high degree. In the experimental design achieved with this method, experimental errors can be reduced and the reproducibility and efficiency of the laboratory experiments can be increased. With this method, which allows different situations to be designed together, flexible, and compatible with each other, the effects of the parameters on the results can be determined independently of each other [18].

2.1.3. Response Surface Method (RSM)

The RSM covers a collection of mathematical and statistical techniques that rely on fitting a polynomial equation to experimental data and need to describe the behavior of a data set in order to make statistical predictions. This approach can be well applied when a response or a set of responses of interest is affected by several variables. The aim is to optimize the levels of these variables simultaneously to achieve the best system performance [19]. The experimental work using the RSM is greatly reduced compared to the number of runs determined using the full factorial design. Besides the reduction in experimental studies, the results from the RSM are claimed to be statistically acceptable [20].
The response surface method (RSM) was used in the experimental design. The RSM is an engineering tool used in the design phase of a new product or process to improve and optimize its performance [21]. The RSM was first introduced by Box and Wilson (1951) and later developed for an experimental design and data analysis [22]. The method includes a sequential process in which statistical and mathematical techniques are used. In this process, the researcher investigates the type of appropriate approximation function, the selection of the appropriate experimental design layout, the location and shape of the optimum region, and the necessity for transformation for the response or design variables [22].
The RSM design process can be summarized in three steps: (i) designing a set of experiments for the measurement of responses (elimination trials); (ii) determining the mathematical model with the best fit between the input variables and the response and obtaining the optimal set of experimental settings that yields the response’s maximum or minimum values (region research); (iii) expressing the effects of the parameters affecting the process with 2D or 3D graphics [23].
The RSM is mostly about approximating an unknown complex function using a first-order or second-order model of a low-order polynomial [15]. If the response variable is expressed as a linear function of the independent variables, the use of the first-order model is appropriate [24]. If there is a curvilinear relationship in the system, the main effect models called first-order models are insufficient. In this case, there is the establishment of a higher order polynomial, such as a second-order polynomial. This model is also called the second-order model.
The following first-order model (Equation (1)) is generated if the system response in the RSM fits the independent variable well as a linear function [25]:
y = β 0 + β 1 x 1 + β 2 x 2 + + β k x k + ε ,  
A quadratic model (Equation (2)) could be more suitable if the system’s response surface is curved:
y = β 0 + j = 1 k β j x j + j = 1 k β j j x j 2 + i k 1 β i j x i x j + ε
where y is the response variable, β k is the unknown regression parameter, x i and x j are process variables, and ε is the error term.
The RSM method uses two different designs, the Box-Behnken design and central composite design [25].
Central Composite Designs (CCD): The design developed by Box and Wilson in 1951 can work with both linear and quadric models. The CCD can be considered as a good alternative to the three-level full factorial design, providing a smaller number of experiments [26].
Box-Behnken design: This is a very important experimental design that allows for calculating the response function and estimating the system performance at any experimental point in the examined range by performing a small number of studies [16].
The Box-Behnken method, which is used to develop the models created on the basis of the designs and to determine the optimum experimental conditions, is a three-level design that yields a second-order multivariate polynomial with factor and response surfaces, the number of which can be increased. The response surface results allow the determination of variables within the range of their maximum or minimum values. In addition to the factorial designs, midpoints connecting the corner points of the study area and repeat experiments at the center are used [19].
It is stated that the Box-Behnken design is obtained by combining the two-level factorial design with the incomplete block design and adding a certain number of copy center points. Additionally, the implementation of the second-level model is seen as the second-best option in the Box-Behnken design. An advantage of the Box-Behnken design is that successful results can be obtained with fewer experiments [16]. Box-Behnken designs are used effectively in the quadratic estimation of models, construction of sequential models, analyses of confidence, blocks, and experimental designs [15].
If we look at the experimental designs in general, the number of experiments required for a factorial design is very large. Therefore, it loses its effectiveness in modeling quadratic functions. Designs that present a smaller number of experimental points, such as Box-Behnken and CCD designs, are more often used [27], as they often require more experimental work for more than two variables than can be accommodated in practice.
When the CCD and Box-Behnken designs are compared, the Box-Behnken design requires a smaller number of experiments under the same conditions. In this design, each variable can be examined separately at three different levels, and since the lower and upper limits for all variables are never covered at the same time, unsatisfactory results created by extreme values are prevented [28]. For this reason, the Box-Behnken experimental design was used in our study.
In this context, a literature review was performed for the studies using the RSM for the optimization of the parameters that are effective in the processing of materials in the literature, as summarized in Table 1.

2.2. Workpiece Material

AISI 52100 steel is of considerable interest in bearing and shaft construction due to its higher strength and better corrosion resistance. However, the machining of bearing steel materials such as AISI 52100 steel is one of the challenging areas in metal cutting industries due to their high hardness, resulting in low productivity and high production costs. Table 2 provides a summary of the studies on the optimization of the cutting parameters of AISI 52100 bearing steel.
When the literature review in Table 2 was conducted, it was determined that there was no study investigating the effects of the cutting parameters on the temperature and power consumption with the Box-Behnken design in the turning of AISI 52100 bearing steel. For this reason, it was decided to use AISI 52100 bearing steel in this study.
The AISI 52100 steel used in the study is a high-carbon (0.98–1.10%) and low-alloy supra-eutectoid steel with a chromium content of 1.3–1.6%. This steel can be deeply hardened by heat treatment and is widely used in automotive, gear, bearing, tool, and mold applications after its microstructure is changed and hardened as a result of different heat treatments. AISI 52100 steel is usually shaped by machining. However, annealed supra-eutectoid steels are not suitable for machining due to the hard and brittle cementite lamellae in their internal structure. Spheroidization heat treatment is the process of converting carbides into a spherical shape by slow cooling after keeping the steels around the Ac1 temperature for a long time with oscillating annealing in this region. After this process, the lamellar structure in the internal structure of the material is transformed into granular cementite, resulting in improvements in the ductility and machinability properties. During chip removal, a very high heat is generated because of the friction between the cutting tool and the workpiece and the plastic deformation of the workpiece material. The high heat that is generated causes an increase in temperature in the cutting zone, causing a decrease in the hardness of the cutting tool material and rapid wear [72]. The chemical composition and mechanical properties of the workpiece are shown in Table 3 and Table 4, respectively. In the experiments, the coated carbide tool in the form of SNMA120408 produced by Kennametal company in the K68 quality group was used.

2.3. FEM Simulations and Experimental Design

For the optimization of the cutting parameters affecting the turning of the AISI 52100 bearing steel material, the Box-Behnken experimental design, which was used in the lowest number of experiments in the experimental systems created with the RSM, was used. After the experimental design was decided, the cutting parameters affecting the turning of AISI 52100 bearing steel were determined based on the literature review in Table 2, with their levels given in Table 5.
After the experimental design was determined, the frequencies of the cutting parameters used in the studies in Table 2 were created and are given in Figure 2 to determine the cutting parameters affecting the turning of AISI 52100 bearing steel.
According to Figure 2, for the optimization of the cutting parameters used in the processing of AISI 52100 bearing steel, it was observed that the feed rate was used in all 19 studies and cutting speed and depth of cut parameters were used in 18 studies. Due to this result, it was decided to use these cutting parameters in our study, and their levels are given in Table 5.
According to the Box-Behnken experimental design, the number of experiments to be performed was determined as 15 experiments. In accordance with the experimental design created, the analyses were performed using the finite element method (FEM).
The FEM analyses were performed using Third Wave AdvantEdge™ (version 7.1) software. This software is FEM software that is optimized for machining operations. Boundary conditions are required to simulate metal cutting operations using the finite element approach. By choosing the best modelling technique and modeling the material, these criteria may be utilized to compute the deformation rate, comprehend how the material of the workpiece will react during plastic deformation, and simulate metal cutting operations. The strain rate and temperature impacts of the structural equations must be identified to describe the dynamic behavior of the model. Changes in metal stress are dependent on the strain, strain rate, and temperature [74,75,76]. This study describes the mechanical behavior of the workpiece using the Johnson–Cook (JC) yield-surface-forming material model. Using Equation (3) from the Johnson–Cook material model, the flow stress of the workpiece is obtained:
σ = A + B ε n E l a s t o - P l a s t i c 1 + C l n ε ˙ ε ˙ 0 V i s c o s i t y 1 T T r o o m T m e l t T r o o m m T h e r m a l   S o f t e n i n g  
The coefficient of friction used in AdvantEdgeTM is defined by the Coulomb friction shown in Equation (4):
F f = μ F n
where F n is the normal force exerted between the surfaces, µ is the coefficient of friction, and F f is the friction force. In this study, the coefficient of friction is defined as 0.5 between the cast iron and carbide materials.
A 4-node, 12-degree-of-freedom mesh structure was used for the workpiece and cutting tool. The initial and mesh structures are shown in Table 6.
The overall geometric framework for the finite element analysis with Third-Wave AdvantEdge is shown in Figure 3, for which 3D turning is preferred as the turning technique.
The dimensions of the workpiece material used in the first stage of the analysis process were 10 × 5 mm. The refractive constants and JC parameters (used by Pawar et al.) were used as listed in Table 7 [77]. Figure 4 displays the cutting tool shape that was used in the analysis.
The experiments were performed based on the experimental design determined using the FEM. As an example, the results for the temperature and power consumption related to experiment no. 9 are given in Figure 5.
The experiments were performed based on the experimental design determined using the FEM, and the obtained temperature and power consumption values are given in Table 8.

3. Results and Discussion

The experimental design and the obtained FEM analysis responses were analyzed using the Design Expert 13 software. As a result of the analysis, the quadratic regression model equations suitable for the optimum cutting parameters, which gave the minimum temperature and minimum power consumption when processing the material, were formed as in Equations (5) and (6).
R T = 266.998 + 5.7077 V + 19.101 d 692.607 f + 0.285 V d + 10.009 V f   119.245 d f 0.0199 V 2 9.225 d 2 1570.758 f 2
R P = 190.650 + 2.989 V 26.889 d 737.585 f + 0.080 V d + 6.286 V f + 161.705 d f 0.0107 V 2 + 10.978 d 2 762.804 f 2
The F test was used to determine the accuracy of the model and the coefficients in the model related to the temperature and power consumption values obtained from the FEM analysis study, and the analysis of variance (ANOVA) was used to determine the contributions of the cutting parameters affecting the turning to the temperature and power consumption variables. The results of the analysis of variance of the quadratic model are given in Table 9 and Table 10.
Looking at Table 9, it can be determined that the model was significant (the p-value is 0.0085 < 0.05) in the analysis of the temperature variables. From this analysis, it can be seen that the model parameters of the cutting speed (V), depth of cut (d), and feed rate (f) are significant and have an effect on the temperature variable. When the significance values are examined, it can be determined that the feed rate (f) has the greatest effect of the parameters on the temperature. When we look at the pairwise relations of the parameters, there is no significance. The adjusted R2 (0.8647) shows that the quadratic model can explain 86.47% of the variance in the response.
According to Table 10, the model made for the power consumption variable was significant (the p-value is 0.0099 < 0.05). In this analysis, it can be seen that the model parameters of the cutting speed (V), depth of cut (d), feed rate (f), and cutting speed–feed rate (Vf) are significant and have an effect on the power consumption variable. Considering the significance values of the parameters, it was determined that the feed rate (f) has the greatest effect of the parameters on the power consumption, as well as on the temperature variable. The adjusted R2 (0.8555) shows that the quadratic model can explain 85.55% of the variance in the response.
The predicted values obtained from the FEM analysis and quadratic regression model equations for the temperature and power consumption variables are given in Figure 6.
It can be seen in Figure 6 that the predicted values are compatible with the actual FEM analysis results. This result shows that the developed quadratic regression model can be used to optimize the parameters that are effective for the turnability of AISI 52100 steel.
After the ANOVA analysis, the effects of the parameters affecting the turning of the AISI 52100 bearing steel material on the temperature and power consumption variables were examined and the findings are given in Figure 7 and Figure 8. Accordingly, the effect of the parameters affecting the turning of AISI 52100 steel on the temperature can be seen in Figure 7.
In Figure 7, the effects of the factors affecting the turning of the AISI 52100 bearing steel material on the temperature variables are shown. Accordingly, when Figure 7a is examined, it can be seen that the depth of cut parameter has a greater effect on the temperature than the cutting speed parameter, and the temperature continuously increases when the depth of cut increases.
In Figure 7b, it can be seen that the feed rate parameter affects the temperature more than the cutting speed parameter, and the temperature increases more as the feed rate increases. The effects of the feed rate and depth of cut parameters on the temperature variables are given in Figure 7c. Accordingly, it can be seen that the feed rate parameter affects the temperature more than the depth of cut parameter, and the temperature increases as the feed rate increases.
When Figure 7 is examined, it can be seen that the pairwise interactions of the cutting speed–feed rate parameters increase the temperature the most, while the pairwise interactions of the cutting speed–depth of cut and depth of cut–feed rate parameters have almost the same effect on the temperature.
In Figure 8, the effects of the factors affecting the turning of the AISI 52100 bearing steel material on the power consumption are given. When Figure 8a is examined, it can be seen that the depth of cut parameter has a greater effect on the power consumption than the cutting speed parameter, and when the depth of cut increases, the power consumption increases more. In Figure 8b, it is seen that the feed rate parameter has a greater effect on power consumption than the cutting speed parameter, and the power consumption increases more when the feed rate increases. The effects of the depth of cut and feed rate parameters on the power consumption can also seen in Figure 8c. When the figure is examined, it can be seen that the depth of cut and feed rate parameters affect the power consumption almost at the same rate, and the power consumption increases with the increase in both parameter values. When all three pairwise interactions are taken into account, it can be determined that the depth of cut and cutting speed parameters increase the power consumption more.
After examining the effects of the parameters affecting the turning of AISI 52100 bearing steel on the temperature and power consumption, the optimum turning parameter values for the minimum temperature and power consumption and the temperature and power consumption values obtained with these values were obtained from the Design Expert 13 program and are given in Table 11.
In addition, these optimal values were used in the regression equations in Equations (1) and (2) and in the confirmation experiment in the FEM analysis, and the temperature and power consumptions were obtained. These obtained values are given in Table 12.
Additionally, the real experimental setup shown in Figure 9 was prepared and three validation experiments were performed with these optimum values in Table 11, and the output responses were obtained by averaging the test results (Table 12). The validation experiments were carried out on a Hannsa YTH 10700 CNC lathe under dry cutting conditions. The CNC lathe used had a 10 kW motor power and spindle-variable stepless speed, and could reach up to 3000 rpm. A Flir Thermal Imaging Camera was used to measure the cutting temperatures during cutting. A Hioki Po PW3198 phase power analyzer (Hioki Corporation, Nagano, Japan) was used to measure the effects of the cutting parameters on the power consumption during the experiments. This instrument had three current probes (CP-1201) and the measurements were made by connecting these probes separately to the energy input of the machine. In the study, since the effects of the cutting parameters on the power consumption were examined, it was reported that systems that increase the power consumption, such as the cooling system, should be turned off [78]. A schematic view of the turning experiments is presented in Figure 9.
When Table 12 is examined, it can be seen that there is a 0.5% error rate between the minimum temperature values obtained from the RSM and the regression model, and a 5.5% error between the power consumption values. The confirmation experiment using the FEM analysis shows that there is an error rate of 4.9% between the temperature values and of 11% between the power consumption values.
In the turning test carried out in the real experimental environment, the temperature and power consumption in the cutting zone were measured as 394.73 °C and 94.66 W, respectively. When these values are compared with the results obtained from RSM, it can be seen that there were error rates of 3.3% in temperature and 6.6% in power consumption. According to these results, the second-order regression model for the temperature and power consumption had less errors.
In the turning experiments, the temperature and power consumption in the cutting zone were measured at 394.73 °C and 94.66 W, respectively. Accordingly, it was noted that the second-order regression analysis for temperature and power consumption gave better results than the RSM results. When the results of the turning experiments in the real environment and FEM analyses were compared, it was seen that the temperature and power consumption results from the FEM analyses were higher than the turning experiments in the real environment.

4. Conclusions

In this study, we aimed to optimize the cutting parameters affecting the turning of AISI 52100 bearing steel with the three-level Box-Behnken experimental design combined with the response surface method. To achieve this aim, the temperature and power consumption values obtained from the FEM analysis based on the cutting speed, depth of cut, and feed rate cutting parameters were analyzed using Design Expert 13. Then, the cutting parameters affecting the temperature and power consumption variables were optimized. Based on the results of the optimization study, the following points were confirmed:
  • For the test result predictions made with the Box-Behnken experimental design, we obtained values of R2 (adjusted) = 0.8647 for the temperature and R2 (adjusted) = 0.8555 for the power consumption. These results indicated that the cutting parameters would be accurately predicted when turning the AISI 52100 bearing steel;
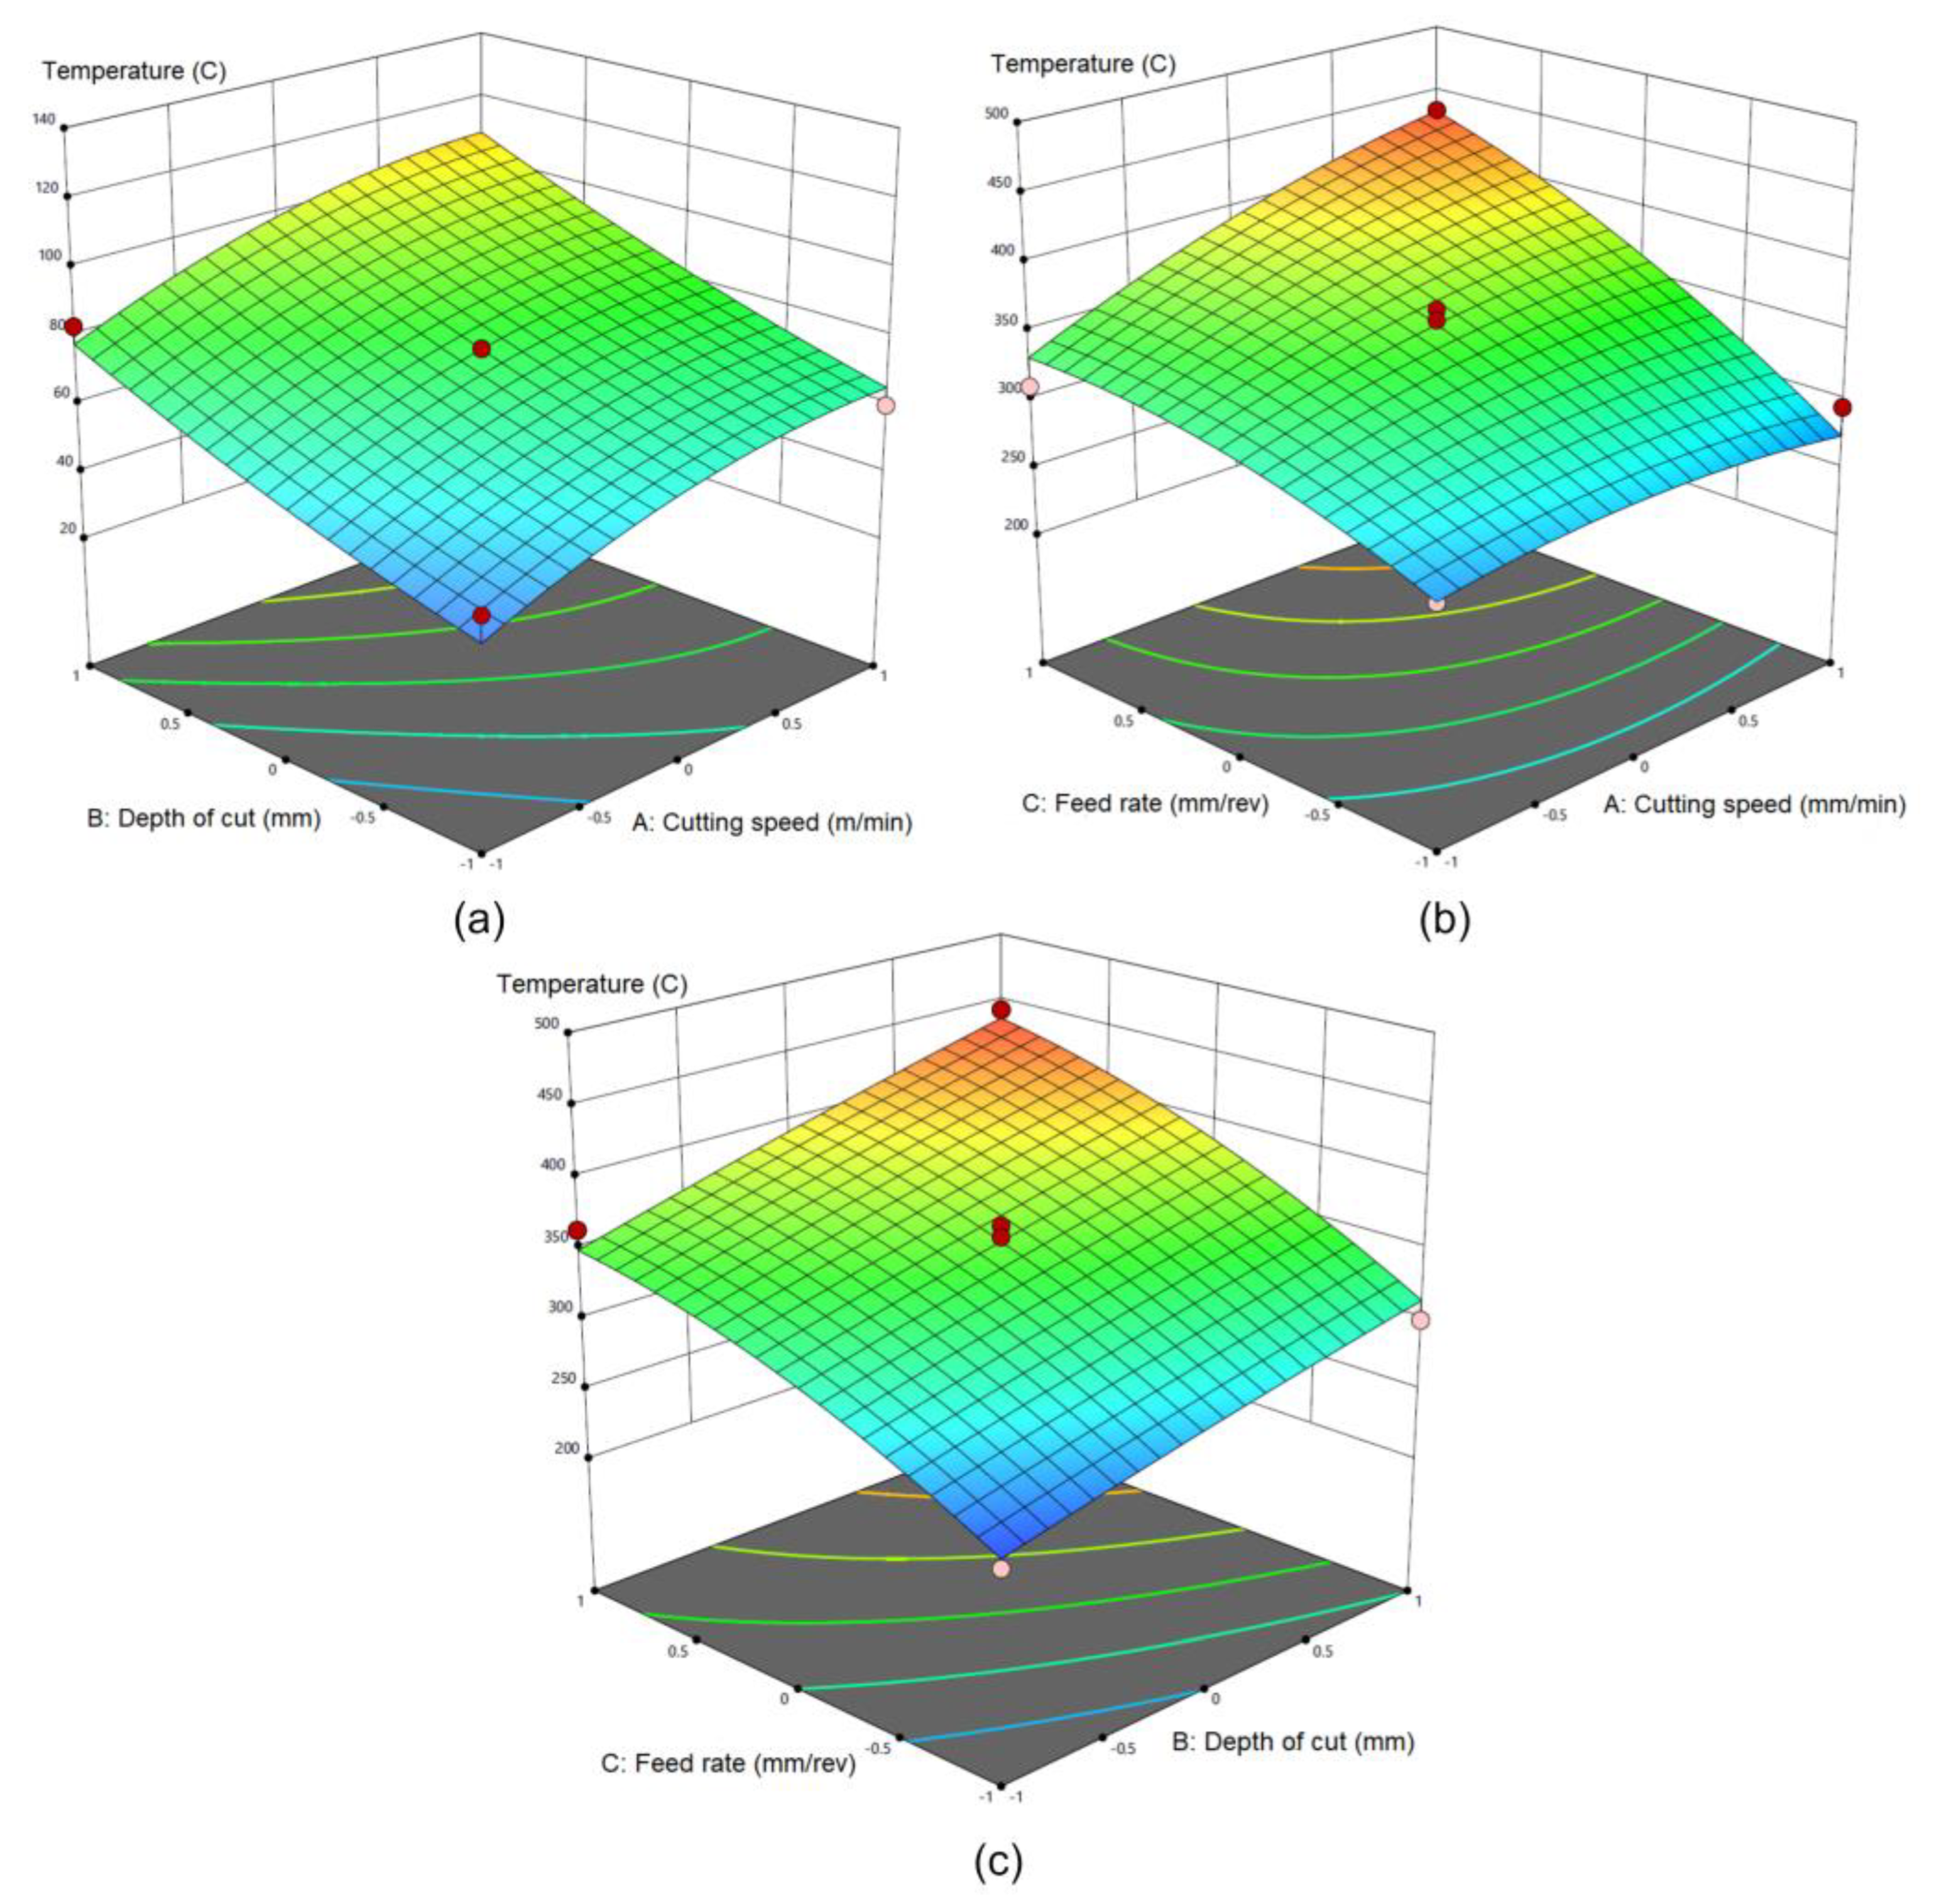
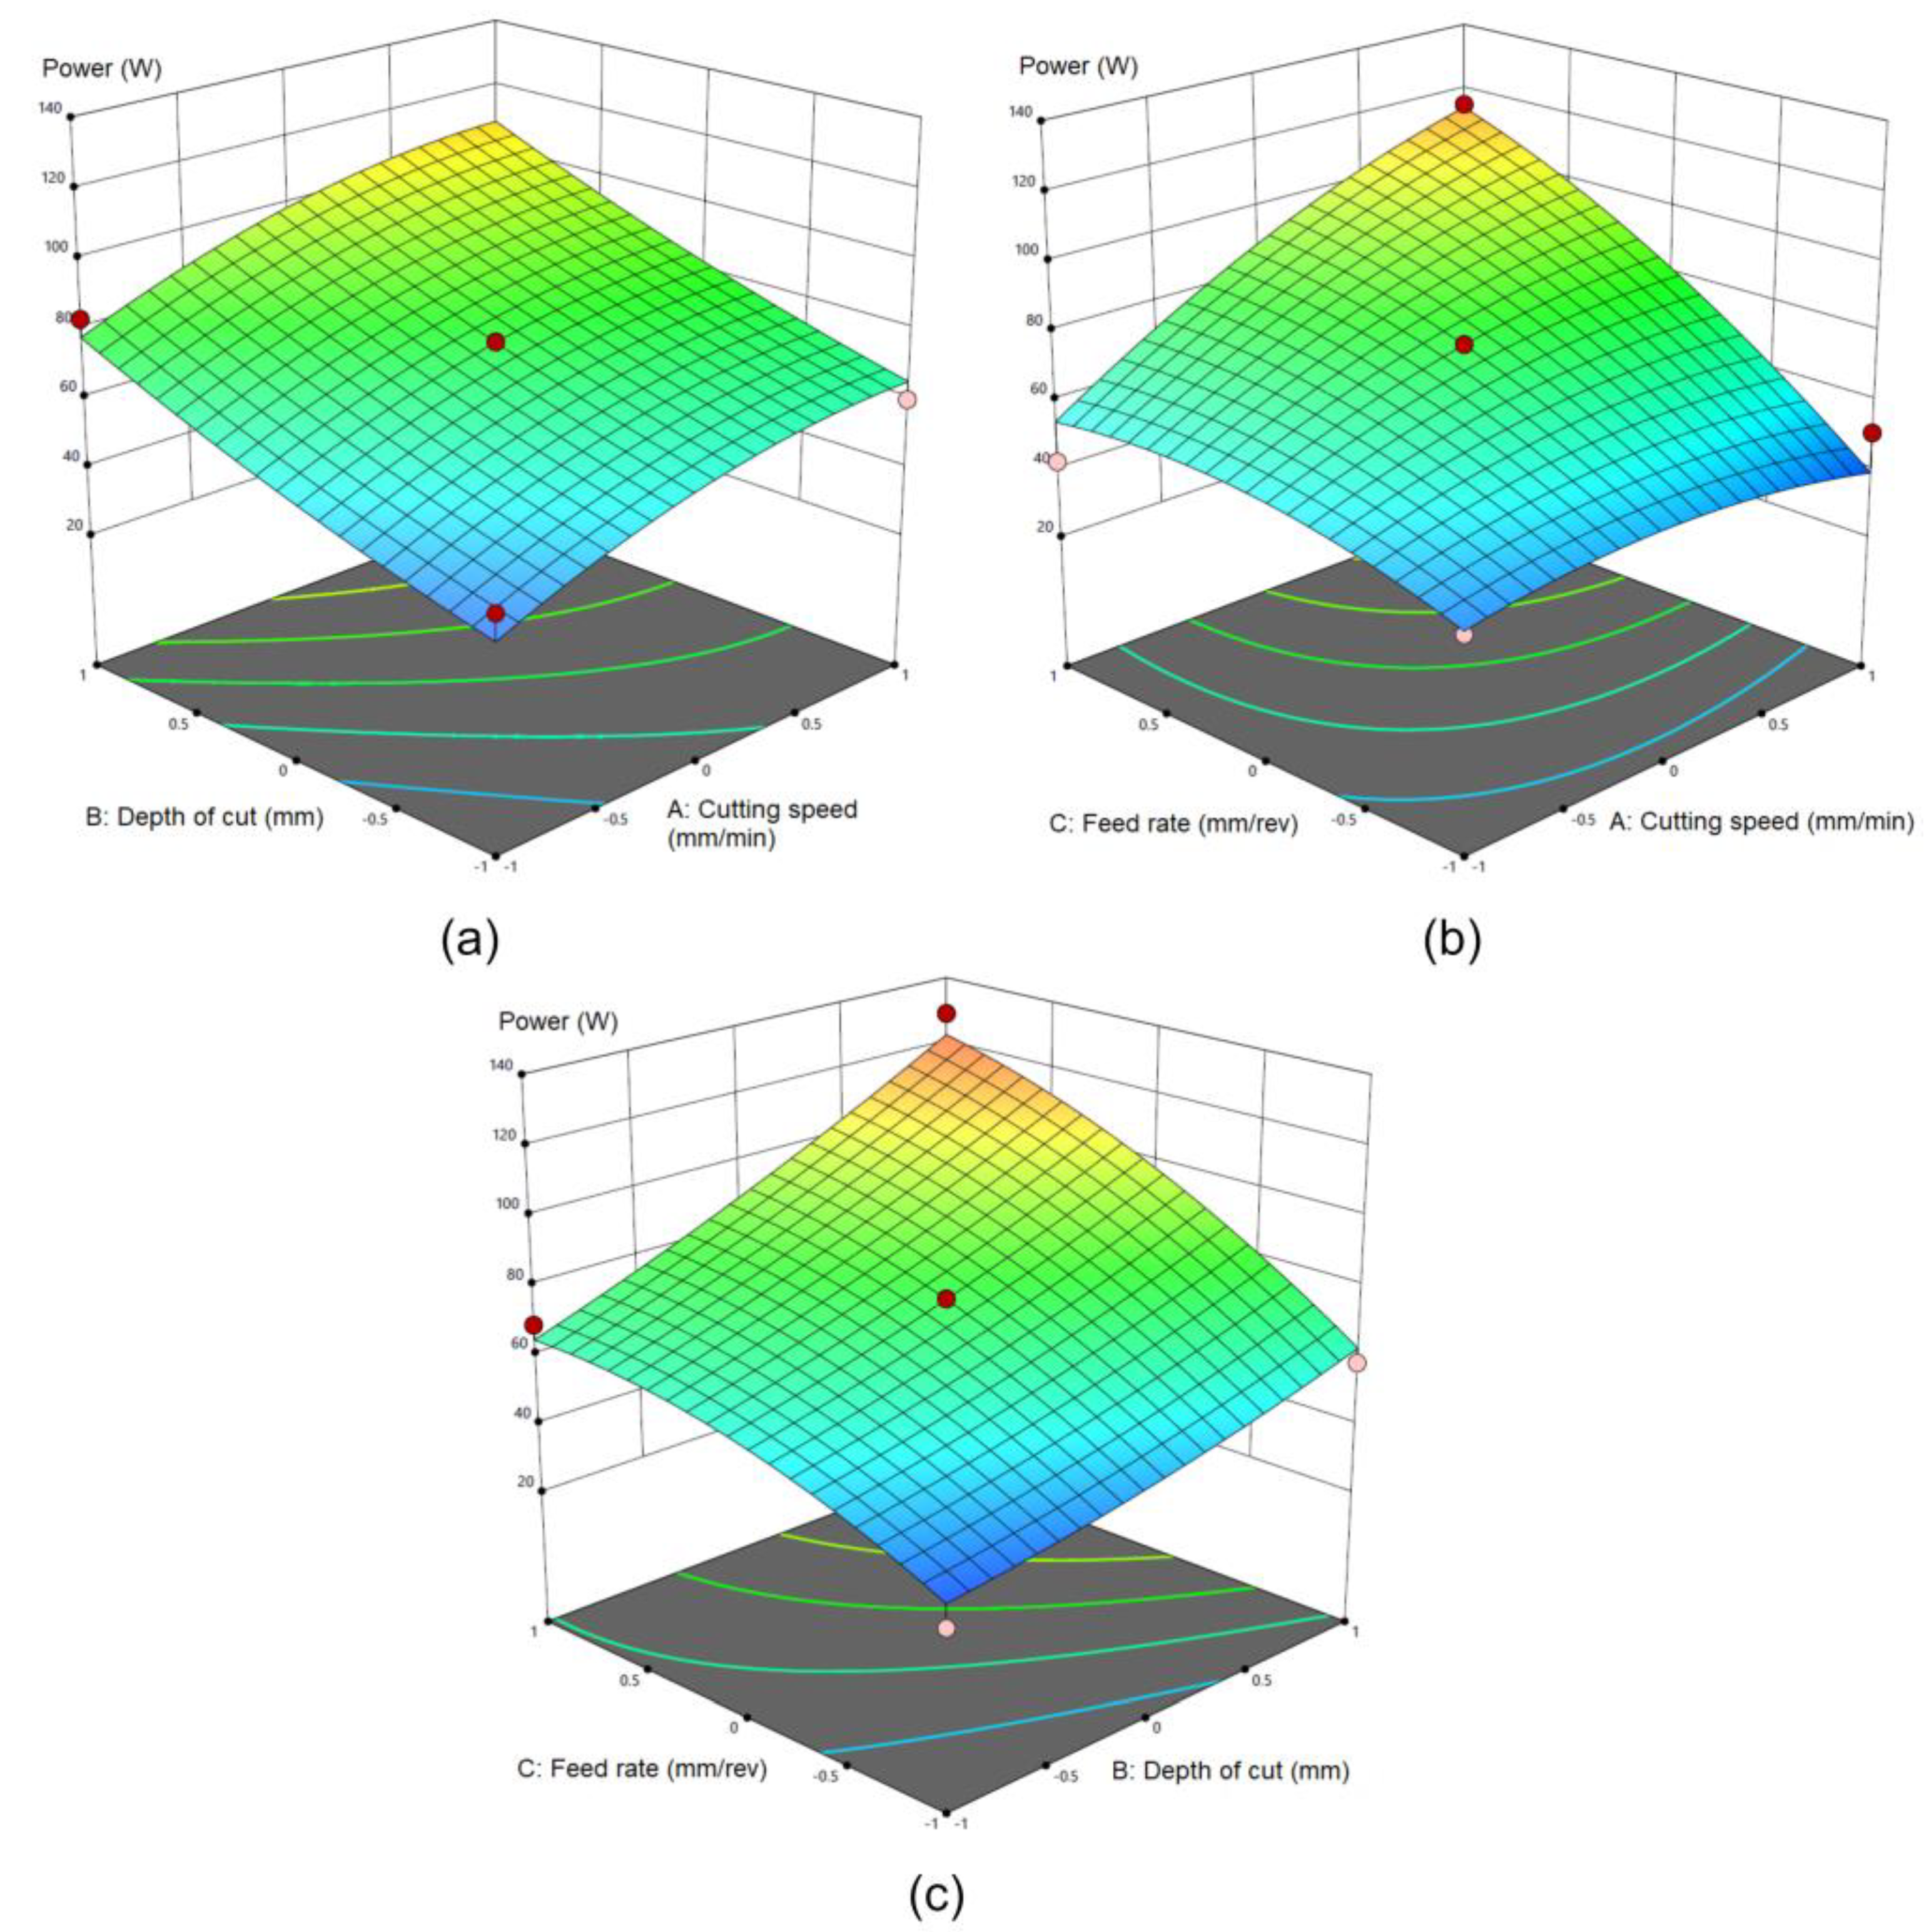
  • The temperature and power consumption variables are affected by the cutting speed, depth of cut, and feed rate parameters;
  • The feed rate parameter affects both the temperature and power consumption the most;
  • The cutting speed parameter has the least effect on both the temperature and power consumption variables;
  • The cutting speed should be 162.427 m/min, the depth of cut should be 1.395 (mm), and the feed rate should be 0.247 mm/rev for minimal temperature and power consumption;
  • When the results obtained from the RSM were compared in the turning experiments carried out in the real experimental environment, error rates of 3.3% for the temperature and 6.6% for the power consumption emerged. According to these results, it was seen that the quadratic regression equation gave results closer to the real experimental results;
  • Since the minimum temperature and power consumption values were obtained with FEM analysis, the Box-Behnken design and real experimental setup are very close to each other. The Box-Behnken experimental design can be used together with an FEM analysis for the optimization of the cutting parameters of AISI 52100 bearing steel.
When the literature on the optimization of the cutting parameters of AISI 52100 bearing steel was examined, no study was found that used the RSM and that simultaneously examined the output responses, temperature, and power consumption, as was examined in our study. In [69], in which the CCD and TOPSIS methods were used to determine the parameters that optimize the workpiece surface temperature, it was determined that the parameter that most affected the workpiece surface temperature was the negative rake angle.
In another study [70], it was determined that the parameters that affect the cutting temperature the most are the cutting speed and feed rate with the CCD experimental design. In this study, experiments were carried out in a multilayer coated carbide cutting tool insert under a high-velocity pulsing jet minimal cutting fluid application environment.
However, in our study, it was determined that the feed rate parameter affected the temperature the most under dry cutting conditions and with a different insert, and the cutting speed variable affected the temperature the least. It was thought that this result was due to the fact that the experiments were carried out in a dry-liquid environment and that the cutting tips were different.
In another study [65], which aimed to optimize the cutting forces and used the MLR and genetic algorithm methods, it was seen that the feed rate parameter affected the power consumption the most. This result was similar to the result obtained in our study.
When we look at the other cutting parameter optimization studies on AISI 52100 bearing steel in the literature, it can be seen that feed rate generally affects the surface roughness and the depth of cut affects the cutting forces. The first limitation of our study was that only three parameters and three levels were used in the experimental design. Additionally, the second limitation was that the tests were performed with only one type of insert.
In future studies, it is thought that these limitations will be eliminated by increasing the parameters and using at least two types of inserts. In addition to carrying out the activities to eliminate the limitations mentioned above, we aim to use machine learning techniques in the optimization of the cutting parameters by conducting more experiments.

Author Contributions

Conceptualization, A.Y., L.U. and İ.E.P.; methodology, A.Y., L.U. and İ.E.P.; writing—original draft preparation, A.Y. and İ.E.P.; writing—review and editing, A.Y. and İ.E.P. All authors have read and agreed to the published version of the manuscript.

Funding

This research received no external funding.

Data Availability Statement

Not applicable.

Conflicts of Interest

The authors declare no conflict of interest.

References

  1. Maity, S.R.; Chatterjee, P.; Chakraborty, S. Cutting tool material selection using grey complex proportional assessment method. Mater. Des. 2012, 36, 372–378. [Google Scholar] [CrossRef]
  2. Debnath, S.; Reddy, M.M.; Yi, Q.S. Influence of cutting fluid conditions and cutting parameters on surface roughness and tool wear in turning process using Taguchi method. Measurement 2016, 78, 111–119. [Google Scholar] [CrossRef]
  3. Rao, C.; Rao, D.N.; Srihari, P. Influence of Cutting Parameters on Cutting Force and Surface Finish in Turning Operation. Procedia Eng. 2013, 64, 1405–1415. [Google Scholar] [CrossRef] [Green Version]
  4. Groover, M.P. Fundamentals of Modern Manufacturing: Materials, Processes, and Systems; John Wiley & Sons: Hoboken, NJ, USA, 2020. [Google Scholar]
  5. Kuntoğlu, M.; Sağlam, H. Investigation of progressive tool wear for determining of optimized machining parameters in turning. Measurement 2019, 140, 427–436. [Google Scholar] [CrossRef]
  6. Kuntoğlu, M.; Aslan, A.; Sağlam, H. Investigation of the effects of approaching angle and cutting parameters on machinability of aisi 5140 steel during turning. J. Polytech. 2010, 135, 99–114. [Google Scholar]
  7. Zlü, B. Investigation of the effect of cutting parameters on cutting force, surface roughness and chip shape in turning of Sleipner cold work tool steel. J. Fac. Eng. Archit. Gazi Univ. 2021, 36, 1241–1251. [Google Scholar]
  8. Mohanraj, T.; Shankar, S.; Rajasekar, R.; Sakthivel, N.R.; Pramanik, A. Tool condition monitoring techniques in milling process—A review. J. Mater. Res. Technol. 2020, 9, 1032–1042. [Google Scholar] [CrossRef]
  9. Kuntoğlu, M.; Sağlam, H. Investigation of signal behaviors for sensor fusion with tool condition monitoring system in turning. Measurement 2020, 173, 108582. [Google Scholar] [CrossRef]
  10. Aslan, A. Tornalama Parametrelerinin Kesme Sıcaklığı ve Krater Aşınması Üzerine Etkilerinin Deneysel Olarak Araştırılması. Türk Doğa Ve Fen Derg. 2021, 10, 109–118. [Google Scholar] [CrossRef]
  11. Zhao, J.; Li, L.; Wang, Y.; Sutherland, J.W. Impact of surface machining complexity on energy consumption and efficiency in CNC milling. Int. J. Adv. Manuf. Technol. 2019, 102, 2891–2905. [Google Scholar] [CrossRef]
  12. Yavaşcı, E.; Kardökmak, A.Ş.; Demirsöz, R. Talaşlı imalatta kesme hızı, ilerleme ve kesme derinliği değişkenlerinin torna tezgâhı güç tüketimi üzerine etkileri. Çelik Araştırma Ve Geliştirme Derg. 2022, 3, 17–24. Available online: https://dergipark.org.tr/en/pub/jesred/issue/72095/1118426 (accessed on 2 November 2022).
  13. Akyıl, H.H.; Bican, O. Talaşlı İmalatta Kesme Parametrelerinin Geometrik Toleranslar Üzerine Etkilerinin Deneysel Olarak İncelenmesi. Aksaray Univ. J. Sci. Eng. 2022, 6, 107–122. [Google Scholar]
  14. Gündoğdu Ceylan, Y.; Gündüz, T.; Atıcı Ulusu, H. Taguchi yöntemi ile polimer hammadde karışım optimizasyonu. J. Ind. Eng. (Turk. Chamb. Mech. Eng.) 2021, 32, 164–176. [Google Scholar]
  15. Anderson-Cook, C.M.; Borror, C.M.; Montgomery, D.C. Response surface design evaluation and comparison. J. Stat. Plan. Inference 2009, 139, 629–641. [Google Scholar] [CrossRef]
  16. Akdemir, E.O. Box-Behnken deneysel tasarım metodunun boyalı sulardan kitosan koagülasyonu ile renk giderimine uygulanması. Eurasian J. Biol. Chem. Sci. 2021, 4, 5–11. [Google Scholar] [CrossRef]
  17. Savaskan, M. Performance Evaluation and Optimization of Thin Hard Ceramic Coated Drill Bits by Comparative Use of Experimental Design Methods. Ph.D. Thesis, Institute of Science and Technology, İstanbul, Turkey, 2003. [Google Scholar]
  18. Öztürk, B.; Uğur, L.; Yildiz, A. Investigation of effect on energy consumption of surface roughness in X-axis and spindle servo motors in slot milling operation. Measurement 2019, 139, 92–102. [Google Scholar] [CrossRef]
  19. Bezerra, M.A.; Santelli, R.E.; Oliveira, E.P.; Villar, L.S.; Escaleira, L.A. Response surface methodology (RSM) as a tool for optimization in analytical chemistry. Talanta 2008, 76, 965–977. [Google Scholar] [CrossRef]
  20. Said, K.A.M.; Amin, M.A.M. Overview on the response surface methodology (RSM) in extraction processes. J. Appl. Sci. Process Eng. 2015, 2, 8–17. [Google Scholar]
  21. Murat, D.; Ensarioğlu, C.; Gürsakal, N.; Oral, A.; Çakır, M.C. Evaluation of tool wear for hard turning operations through response surface methodology. J. Fac. Eng. Archit. Gazi Univ. 2018, 33. [Google Scholar] [CrossRef]
  22. Box, G.E.P.; Wilson, K.B. On the experimental attainment of optimum conditions. In Breakthroughs in Statistics: Methodology and Distribution; Kotz, S., Johnson, N.L., Eds.; Springer: Berlin/Heidelberg, Germany, 1992; pp. 270–310. [Google Scholar]
  23. Gunaraj, V.; Murugan, N. Application of response surface methodology for predicting weld bead quality in submerged arc welding of pipes. J. Mater. Process. Technol. 1999, 88, 266–275. [Google Scholar] [CrossRef]
  24. Kolarik, W.J. Creating Quality: Concepts, Systems, Strategies, and Tools; McGraw-Hill: New York, NY, USA, 1995. [Google Scholar]
  25. Myers, R.H.; Montgomery, D.C.; Anderson-Cook, C.M. Response Surface Methodology: Process and Product Optimization Using Designed Experiments; John Wiley & Sons, Inc.: Hoboken, NJ, USA, 2016. [Google Scholar]
  26. Sharif, K.; Rahman, M.; Azmir, J.; Mohamed, A.; Jahurul, M.; Sahena, F.; Zaidul, I. Experimental design of supercritical fluid extraction—A review. J. Food Eng. 2013, 124, 105–116. [Google Scholar] [CrossRef]
  27. Morris, M.D. A class of three-level experimental designs for response surface modeling. Technometrics 2000, 42, 111–121. [Google Scholar] [CrossRef]
  28. Narenderan, S.T.; Meyyanathan, S.N.; Karri, V.V.S.R. Experimental design in pesticide extraction methods: A review. Food Chem. 2019, 289, 384–395. [Google Scholar] [CrossRef]
  29. Patnaik, L.; Maity, S.R.; Kumar, S. Modeling of wear parameters and multi-criteria optimization by Box-Behnken design of AlCrN thin film against gamma-irradiated Ti6Al4V counterbody. Ceram. Int. 2021, 47, 20494–20511. [Google Scholar] [CrossRef]
  30. Kumar, V.; Kharub, M.; Sinha, A. Modeling and Optimization of Turning Parameters during Machining of AA6061 composite using RSM Box-Behnken Design. IOP Conf. Ser. Mater. Sci. Eng. 2021, 1057, 012058. [Google Scholar] [CrossRef]
  31. Ibrahim, G.; Hamni, A.; Nadhira, W.; Burhanudin, Y. Optimization of Cutting Parameters When Machining of Magnesium AZ31 Using Box Behnken Design. Int. J. Eng. Technol. Sci. 2019, 6, 15–23. [Google Scholar] [CrossRef]
  32. Shihab, S.K. Optimization of WEDM Process Parameters for Machining of Friction-Stir-Welded 5754 Aluminum Alloy Using Box-Behnken Design of RSM. Arab. J. Sci. Eng. 2018, 43, 5017–5027. [Google Scholar] [CrossRef]
  33. Abdullahi, Y.U.; Oke, S.A. Optimizing the Boring Parameters on CNC Machine using IS 2062 E250 Steel Plates: Taguchi-Pareto-Box Behnken Design and Taguchi-ABC-Box Behnken Design Perspectives. Eng. Access 2022, 8, 219–224. [Google Scholar]
  34. Güvercin, S.; Yildiz, A. Optimization of cutting parameters using the response surface method. Sigma J. Eng. Nat. Sci. 2018, 36, 113–121. [Google Scholar]
  35. Kumar, S.; Maity, S.R.; Patnaik, L. Application of Box-Behnken Method for Multi-response Optimization of Turning Parameters for DAC-10 Hot Work Tool Steel. In Recent Advances in Mechanical Engineering; Springer: Singapore, 2021; pp. 407–415. [Google Scholar] [CrossRef]
  36. Singh, P.; Singh, L.; Singh, S. A box behnken design approach for parametric optimization in processing of aluminum 6061 tubes. Mater. Manuf. Process. 2021, 37, 1110–1121. [Google Scholar] [CrossRef]
  37. Panchal, D. Optimization of Surface Roughness of EN-36 Alloy Steel on CNC Turning Machine using Box Behnken Method under RSM. Int. J. Res. Appl. Sci. Eng. Technol. 2020, 8, 608–625. [Google Scholar] [CrossRef]
  38. Sivaraj, S.; Bernard, S.S.; Kishore, R.; Kannan, G.K.; Lokeshkumar, J. Optimization of thrust force during drilling operation for Al-SiC composites using Box-Behnken approach. AIP Conf. Proc. 2022, 2519, 040006. [Google Scholar]
  39. Garcia, R.F.; Feix, E.C.; Mendel, H.T.; Gonzalez, A.R.; Souza, A.J. Optimization of cutting parameters for finish turning of 6082-T6 aluminum alloy under dry and RQL conditions. J. Braz. Soc. Mech. Sci. Eng. 2019, 41, 317. [Google Scholar] [CrossRef]
  40. Ic, Y.T.; Saraloğlu Güler, E.; Cabbaroğlu, C.; Dilan Yüksel, E.; Maide Sağlam, H. Optimisation of cutting parameters for minimizing carbon emission and maximising cutting quality in turning process. Int. J. Prod. Res. 2018, 56, 4035–4055. [Google Scholar] [CrossRef]
  41. Surya, M.S.; Prasanthi, G.; Kumar, A.K.; Sridhar, V.K.; Gugulothu, S.K. Optimization of cutting parameters while turning Ti-6Al-4 V using response surface methodology and machine learning technique. Int. J. Interact. Des. Manuf. (IJIDeM) 2021, 15, 453–462. [Google Scholar] [CrossRef]
  42. Trung, D. Influence of Cutting Parameters on Surface Roughness during Milling AISI 1045 Steel. Tribol. Ind. 2020, 42, 658–665. [Google Scholar] [CrossRef]
  43. Raghavendra, S.; Sathyanarayana, P.S.; Vs, T.; Kn, M. High speed machining of titanium Ti 6Al4V alloy components: Study and optimisation of cutting parameters using RSM. Adv. Mater. Process. Technol. 2020, 8, 277–290. [Google Scholar] [CrossRef]
  44. Vu, N.A.; Hung, M.B.V. Influence Of The Cutting Parameters On The Surface Roughness When Milling 060A4 Steel. J. Multidiscip. Eng. Sci. Technol. (JMEST) 2021, 8, 13952–13956. [Google Scholar]
  45. Radhi, H.E.; Marsool, K.S. Parametric Optimization of Martensitic Stainless Steel 440 C in CNC Turning Using Box-Behnken and Response Surface Method. Turk. J. Comput. Math. Educ. (TURCOMAT) 2021, 12, 3653–3665. [Google Scholar]
  46. Trung, D.D.; Ngoc, N.D.; Hong, T.T.; Van Khoa, V.; Tu, N.T.; Giang, T.N.; Dung, N.T.Q.; Pi, V.N. Influences of Cutting Parameters on Surface Roughness During Milling and Development of Roughness Model Using Johnson Transformation. In Proceedings of the International Conference on Engineering Research and Applications, Thai Nguyen, Vietnam, 1–2 December 2020; Springer: Cham, Switzerland, 2020; pp. 491–500. [Google Scholar] [CrossRef]
  47. Son, N.H.; Trung, D.D. Investigation of The effects of cutting parameters on surface roughness when grinding 3X13 steel using CBN grinding wheel. J. Multidiscip. Eng. Sci. Technol. 2019, 6, 10919–10921. [Google Scholar]
  48. Reddy, M.M.; William, L.C.S. Finite Element analysis: Predicting cutting force in turning of Inconel 625 using ceramic tools. IOP Conf. Ser. Mater. Sci. Eng. 2020, 943, 012019. [Google Scholar] [CrossRef]
  49. Deng, Z.; Wang, Z.; Shen, X. Surface Feature Prediction Modeling and Parameter Optimization for Turning TC17 Titanium Alloy. Int. Trans. Electr. Energy Syst. 2022, 2022, 2979858. [Google Scholar] [CrossRef]
  50. Güvercin, S.; Aydin, K.; Uğur, L.; Gül, F. Investigation of the machining performance of ferritic ductile cast iron in WEDM using response surface methodology. Sigma J. Eng. Nat. Sci. 2022, 40, 95. [Google Scholar] [CrossRef]
  51. Ugur, L. 7075 Alüminyum Malzemesinin Frezelenmesinde Yüzey Pürüzlülüğünün Yanıt Yüzey Metodu İle Optimizasyonu. Erzincan Univ. J. Sci. Technol. 2019, 12, 326–335. [Google Scholar]
  52. Shanthi, S.; Mohan, R.; Thangavelu, R. Experimental investigation for the optimization of the WEDM process parameters to obtain the minimum surface roughness of the AL 7075 aluminium alloy employed with a zinc-coated wire using RSM and GA, MTAEC9. Mater. Tehnol. 2019, 53, 349–356. [Google Scholar] [CrossRef]
  53. Abidi, Y.; Boulanouar, L.; Amirat, A. Experimental study on wear of mixed ceramic tool and correlation analysis between surface roughness and cutting tool radial vibrations during hard turning of AISI 52100 steel. J. Eng. Sci. Technol. 2018, 13, 943–963. [Google Scholar]
  54. Panda, A.; Sahoo, A.K.; Panigrahi, I.; Rout, A.K. Investigating machinability in hard turning of AISI 52100 bearing steel through performance measurement: QR, ANN and GRA study. Int. J. Automot. Mech. Eng. 2018, 15, 4935–4961. [Google Scholar] [CrossRef]
  55. Alok, A.; Das, M. Multi-objective optimization of cutting parameters during sustainable dry hard turning of AISI 52100 steel with newly develop HSN2-coated carbide insert. Measurement 2018, 133, 288–302. [Google Scholar] [CrossRef]
  56. Çetindağ, H.A.; Çiçek, A.; Uçak, N. The effects of CryoMQL conditions on tool wear and surface integrity in hard turning of AISI 52100 bearing steel. J. Manuf. Process. 2020, 56, 463–473. [Google Scholar] [CrossRef]
  57. Das, S.R.; Kumar, A.; Dhupal, D. Experimental investigation on cutting force and surface roughness in machining of hardened AISI 52100 steel using cBN tool. Int. J. Mach. Mach. Mater. 2016, 18, 501. [Google Scholar] [CrossRef]
  58. Bouacha, K.; Yallese, M.A.; Mabrouki, T.; Rigal, J.-F. Statistical analysis of surface roughness and cutting forces using response surface methodology in hard turning of AISI 52100 bearing steel with CBN tool. Int. J. Refract. Met. Hard Mater. 2010, 28, 349–361. [Google Scholar] [CrossRef]
  59. Umamaheswarrao, P.; Raju, D.R.; Suman, K.N.S.; Sankar, B.R. Optimizing cutting parameters in hard turning of AISI 52100 steel using TOPSIS approach. J. Mech. Energy Eng. 2019, 3, 227–232. [Google Scholar] [CrossRef]
  60. Azizi, M.W.; Belhadi, S.; Yallese, M.A.; Mabrouki, T.; Rigal, J.-F. Surface roughness and cutting forces modeling for optimization of machining condition in finish hard turning of AISI 52100 steel. J. Mech. Sci. Technol. 2012, 26, 4105–4114. [Google Scholar] [CrossRef]
  61. Sivaiah, P.; Bodicherla, U. Effect of Surface Texture Tools and Minimum Quantity Lubrication (MQL) on tool Wear and Surface Roughness in CNC Turning of AISI 52100 Steel. J. Inst. Eng. (India) Ser. C 2019, 101, 85–95. [Google Scholar] [CrossRef]
  62. Guddat, J.; M’Saoubi, R.; Alm, P.; Meyer, D. Hard turning of AISI 52100 using PCBN wiper geometry inserts and the resulting surface integrity. Procedia Eng. 2011, 19, 118–124. [Google Scholar] [CrossRef] [Green Version]
  63. Sankar, B.R.; Rao, P.U. Analysis of Forces during Hard Turning of AISI 52100 Steel Using Taguchi Method. Mater. Today Proc. 2017, 4, 2114–2118. [Google Scholar] [CrossRef]
  64. Keblouti, O.; Boulanouar, L.; Azizi, M.W.; Yallese, M.A. Effects of coating material and cutting parameters on the surface roughness and cutting forces in dry turning of AISI 52100 steel. Struct. Eng. Mech. 2017, 61, 519–526. [Google Scholar] [CrossRef]
  65. Serra, R.; Chibane, H.; Duchosal, A. Multi-objective optimization of cutting parameters for turning AISI 52100 hardened steel. Int. J. Adv. Manuf. Technol. 2018, 99, 2025–2034. [Google Scholar] [CrossRef]
  66. Paturi, U.M.R.; Yash, A.; Palakurthy, S.T.; Reddy, N. Modeling and optimization of machining parameters for minimizing surface roughness and tool wear during AISI 52100 steel dry turning. Mater. Today Proc. 2021, 50, 1164–1172. [Google Scholar] [CrossRef]
  67. Tzotzis, A.; Tapoglou, N.; Verma, R.K.; Kyratsis, P. 3D-FEM Approach of AISI-52100 Hard Turning: Modelling of Cutting Forces and Cutting Condition Optimization. Machines 2022, 10, 74. [Google Scholar] [CrossRef]
  68. Rafighi, M.; Özdemir, M.; Şahinoğlu, A.; Kumar, R.; Das, S.R. Experimental Assessment and TOPSIS Optimization of Cutting Force, Surface Roughness, and Sound Intensıty in Hard Turning of AISI 52100 Steel. Surf. Rev. Lett. 2022, 2250150. [Google Scholar] [CrossRef]
  69. Umamaheswarrao, P.; Rangaraju, D.; Suman, K.N.S.; Ravisankar, B. Application of TOPSIS for multi response optimization of Process Parameters in dry hard turning of AISI 52100 steel. INCAS Bull. 2021, 13, 211–224. [Google Scholar] [CrossRef]
  70. Mane, S.; Kumar, S. Response Surface Modeling and Optimization of Cutting Temperature in Turning of AISI 52100 Hardened Alloy Steel under Minimal Cutting Fluid Application. In Advances in Science and Technology; Trans Tech Publications Ltd.: Stafa-Zurich, Switzerland, 2021; Volume 106, pp. 60–67. [Google Scholar] [CrossRef]
  71. Bhandarkar, L.R.; Goswami, N.K.; Behara, M.K.; Mohanty, P.P.; Sarangi, S.K. Investigation and modeling of process parameters during the machinability study of AISI 52100 using advanced coated and uncoated tools. AIP Conf. Proc. 2021, 2341, 040021. [Google Scholar] [CrossRef]
  72. Caydas, U.; Kuncan, O.; Celik, M. Investigation Of The Machinability Of Aisi 52100 Bearing Steel For Surface Roughness, Tool Life And Temperature Criterions. J. Polytech. Politek. Derg. 2017, 20, 409–417. [Google Scholar]
  73. Pan, Z.; Liang, S.Y.; Garmestani, H.; Shih, D.S. Prediction of machining-induced phase transformation and grain growth of Ti-6Al-4 V alloy. Int. J. Adv. Manuf. Technol. 2016, 87, 859–866. [Google Scholar] [CrossRef]
  74. Rao, B.; Dandekar, C.R.; Shin, Y.C. An experimental and numerical study on the face milling of Ti–6Al–4V alloy: Tool performance and surface integrity. J. Mater. Process. Technol. 2011, 211, 294–304. [Google Scholar] [CrossRef]
  75. Shrot, A.; Bäker, M. Determination of Johnson–Cook parameters from machining simulations. Comput. Mater. Sci. 2012, 52, 298–304. [Google Scholar] [CrossRef]
  76. Xu, X.; Zhang, J.; Outeiro, J.; Xu, B.; Zhao, W. Multiscale simulation of grain refinement induced by dynamic recrystallization of Ti6Al4V alloy during high speed machining. J. Mater. Process. Technol. 2020, 286, 116834. [Google Scholar] [CrossRef]
  77. Pawar, S.; Salve, A.; Chinchanikar, S.; Kulkarni, A.; Lamdhade, G. Residual Stresses during Hard Turning of AISI 52100 Steel: Numerical Modelling with Experimental Validation. Mater. Today Proc. 2017, 4, 2350–2359. [Google Scholar] [CrossRef]
  78. Özlü, B. Evaluation of Energy Consumption, Cutting Force, Surface Roughness and Vibration in Machining Toolox 44 Steel Using Taguchi-Based Gray Relational Analysis. Surf. Rev. Lett. (SRL) 2022, 29, 1–17. [Google Scholar] [CrossRef]
Figure 1. The proposed methodology.
Applsci 13 00003 g001
Figure 2. The frequency rates of the cutting parameters used when turning 52,100 bearing steel.
Applsci 13 00003 g002
Figure 3. The mesh structure and boundary conditions of the FEM model.
Applsci 13 00003 g003
Figure 4. The cutting tool parameters.
Applsci 13 00003 g004
Figure 5. The analysis results for experiment no. 9.
Applsci 13 00003 g005
Figure 6. The Box-Behnken experimental versus predicted results: (a) temperature; (b) power consumption.
Applsci 13 00003 g006
Figure 7. The effects of the parameters affecting the turning of the AISI 52100 bearing steel material on the temperature variable: (a) depth of cut-cutting speed; (b) feed rate-cutting speed; (c) feed rate-depth of cut.
Applsci 13 00003 g007
Figure 8. The effects of the parameters affecting the turning of the AISI 52100 bearing steel material on the power consumption variables: (a) depth of cut-cutting speed; (b) feed rate-cutting speed; (c) feed rate-depth of cut.
Applsci 13 00003 g008
Figure 9. The experimental setup.
Applsci 13 00003 g009
Table 1. The literature review summary.
Author(s)Output ResponseInput Parameters UsedMaterial Used
Patnaik et al. [29]Surface roughness, coefficient of friction, disc mass loss, depth of wear, and hardnessApplied load, sliding speed, and sliding distanceTi6Al4V
Kumar et al. [30]Surface roughnessShank speed, feed rate, and depth of cutAluminium alloy 6061
Ibrahim et al. [31]Wear valueCutting speed, feed rate, and rotary tool speedMagnesium AZ31
Shihab [32]Metal removal rate, kerf width, and surface roughnessA pulse on time, pulse off time, and peak currentStir-welded 5754 aluminium alloy
Abdullahi and Oke [33]Surface roughnessSpeed, feed, depth of cut, and nose radiusIS 2062 E250 plate
Güvercin and Yildiz [34]Surface roughnessA feed rate cutting speed, depth of cutAISI 1040
Kumar et al. [35]Surface roughness and tool wear rateCutting speed, feed rate, and depth of cutDAC-10 tool steel
Singh et al. [36]Surface roughness Magnetic field strength, number of working cycles, and hydraulic pressureAluminium 6061 tubes
Panchal [37]Surface roughness and material removal rateFeed, cutting speed, and depth of cutEN-36 Alloy Steel
Sivaraj et al. [38]Thrust forceDrill diameter, feed rate, spindle speedAl-SiC
Garcia et al. [39]Surface roughnessCutting speed, feed rate, and depth of cut6082-T6 aluminium alloy
Ic et al. [40]Surface roughness and carbon emissionCutting speed, cutting tool material, depth of cut, and work piece material6061, 6082, and 7075 Aluminium alloys
Surya et al. [41]Surface roughness and material removal rateSpeed, feed, and depth of cut Ti6Al4 V
Trung [42]Surface roughnessCutting speed, feed rate, and depth of cutAISI 1045
Raghavendra et al. [43]Surface roughnessSpindle speed, depth of cut, feed rate, coolant flow rateTi 6Al4V
Vu and Hung [44]Surface roughnessCutting speed, the feed rate, and cutting depth060A4 steel
Radhi et al. [45]Surface roughness, material removal rate, and temperatureSpeed, feed, depth of cutAISI440
Trung et al. [46]Surface roughnessCutting speed, feed rate, and depth of cutC45 steel
Son and Trung [47]Surface roughnessVelocity of workpiece, feed rate, and depth of cut3X13 Steel
Reddy and William [48]Cutting forceCutting speed, feed rate, and depth of cutInconel 625
Deng et al. [49]Surface roughness and surface microhardnessCutting depth, the cutting speed, and feed rate TC17 titanium alloy
Aydın et al. [50]Surface roughness and process timeTable feed rate, pulse on time, and pulse spaceFerritic ductile cast iron (GGG-40)
Uğur [51]Surface roughnessCutting speed, feed rate, and depth of cutAl 7075
Shanthi et al. [52]Surface roughnessPulse on time, pulse off
time, wire feed, and wire tension
Al 7075
Table 2. A summary of studies on the optimization of the cutting parameters of AISI 52100 bearing steel.
Author(s)Input ParametersOutput ResponseResult AchievedMethod Used
Abidi et al. [53]Cutting speed, feed rate, and depth of cutRadial cutting vibrations and surface roughnessCutting speed has the most significant effect on both the tool life and radial cutting vibration. The feed rate has the most important effect on the surface roughnessTaguchi method
Panda et al. [54]Cutting speed, feed rate, and depth of cutSurface roughness, flank wear, and chip morphologyThe feed rate is the parameter that affects the output responses the most.Gray relationship analysis based on the Taguchi method
Alok and Das [55]Cutting speed, feed rate, and depth of cutCutting feed, radial force, surface roughness, and maximum flank wearThe cutting speed is the most effect parameter for output responsesCentral Composite Design (CCD)
Çetindağ et al. [56]Cutting speed, feed rate, and depth of cutTool wear, surface roughness, and residual stressesBetter surface roughness, less tool wear, and higher compressive stresses were obtained with wiper inserts.Minimum quantity lubrication (MQL)
Das et al. [57]Cutting speed, feed rate, and depth of cutCutting force and surface roughnessThe feed rate and cutting speed strongly affect the surface roughness. The depth of cut is the parameter that affects the cutting force the mostTaguchi method
Bouacha et al. [58]Cutting speed, feed rate, and depth of cutSurface roughness and cutting forcesThe depth of cut has the maximum effect on the cutting forces. The feed rate is the most important parameter affecting the surface roughnessRSM
Umamaheswarrao et al. [59]Cutting speed, feed, depth of cut, tool nose radius, and negative rake angleMachining force and surface roughnessThe negative rake angle is the most important parameter in terms of the output responsesCCD and TOPSIS (Technique for Order Preference by Similarity to Ideal Solutions)
Azizi et al. [60]Cutting speed, feed rate, and depth of cutSurface roughness and cutting forcesThe feed rate affects the surface roughness the most. The depth of cut, workpiece hardness, and feed rate affect the cutting forces.Taguchi method
Sivaiah et al. [61]Cutting speed, feed rate, depth of cut, and type of toolSurface roughness and tool flank wearAs the cutting speed increases, the surface roughness decreases. The feed rate has effects on both the tool flank wear and surface roughness.Taguchi method
Guddat et al. [62]Cutting parameters (cutting speed, feed rate) and geometries (tool nose radius, edge radius chamfer angle, insert type)Cutting forces and surface roughnessThe insert type has more influence on the surface roughness and cutting forces3D Topography based on FEM
Sankar [63]Tool nose radius, depth of cut, speed, and feedCutting forceThe tool nose radius is the parameter that affects the cutting force the most.Taguchi method
Keblouti et al. [64]Feed rate, cutting depth, and cutting speedSurface quality and cutting forcesThe feed rate has the most effect on the surface quality, while the depth of cut has the most effect on the cutting force.RSM
Serra et al. [65]Cutting speed, depth of cut, and feed rateSurface roughness, cutting time, consumed power, forceThe feed rate is the parameter that affects the surface roughness and power the most. The power consumed is more affected by the interactions of the cutting speed and feed rate.Multiple linear regression analysis (MLR) and genetic algorithm (GA)
Paturi et al. [66]Cutting speed, feed rate, depth of cutSurface roughness and tool flank wearThe feed rate affects the surface roughness the most.RSM
Tzotzis et al. [67]Cutting speed feed, depth of cut, and tool nose radiusCutting forceThe depth of cut is the parameter that affects the cutting force the most.3D-FEM and CCD
Rafighi et al. [68]Workpiece hardness, cutting speed, feed, and depth of cutCutting force, surface roughness, and sound intensityThe surface roughness is most affected by the feed, the cutting force is affected by cutting speed, and the sound intensity is most affected by depth of cut.Taguchi method and TOPSIS
Umamaheswarrao et al. [69]Cutting speed, feed, depth of cut, tool nose radius, and negative rake angleMachining force, surface roughness, and workpiece surface temperatureThe negative rake angle is the parameter that affects the output responses the most.CCD and TOPSIS
Mane and Kumar [70] Cutting speed, feed, and depth of cut Cutting temperatureThe cutting speed and feed are important parameters that affect the cutting temperature.CCD
Bhandarkar [71]Feed rate, cutting speed, depth of cut, and tool typeCutting forces, surface roughness, and tool wearThe tool type for the cutting force and feed rate parameters for the surface roughness have important effects.RSM
Table 3. The chemical composition of AISI 52100 bearing steel.
ElementCSiMnPSCrMoAlFe
%0.9730.270.330.0160.0011.410.020.025Balance
Table 4. The mechanical and thermal properties of the AISI 52100 steel [73].
PropertiesWorkpiece Material (AISI 52100 Steel)
Young’s modulus (GPa)210
Density (kg/m3)7.83
Poisson’s ratio0.3
Specific heat (J/kg °C)476.975
Thermal conductivity coefficient (W/(m °C))46.6
Thermal expansion (µm/(m °C))1.19
Table 5. The cutting parameters and levels affecting the turning of AISI 52100 bearing steel.
Parameters Levels
SymbolLow
−1
Center
0
High
+1
Cutting Speed (m/min)V150175200
Depth of cut (mm)d0.511.5
Feed rate (mm/rev)f0.10.20.3
Table 6. The mesh setup.
Initial Tool Mesh
Min element size0.025 mm
Max element size1.8 mm
Curvature safety1.5
Mesh grading0.2
Segments per edge2
Initial Workpiece Mesh
Size20 × 20 × 10 mm3
Min element size0.03 mm
Max element size5 mm
Curvature safety3
Mesh grading0.3
Radius of refined region0.15 mm
Segments per edge2.5
Min. element edge length
           Chip bulk0.03866 mm
           Cutter edge0.02913 mm
Table 7. The JC parameters of AISI 52100 bearing steel [77].
AISI 52100 Steel
A (MPa)2482.4
B (MPa)1498.5
N0.19
C0.027
M0.66
Tmelt (°C)1487
Table 8. The Box-Behnken design and FEM analysis responses.
Run No.Actual and Coded Level of VariablesFEM Analysis Response
Cutting Speed (m/min)Depth of Cut (mm)Feed Rate (mm/rev)Temperature
(T, °C)
Power Consumption (P, W)
1−1 (150)0 (1)1 (0.3)310.5642.24
21 (200)0 (1)1 (0.3)434.642115.19
31 (200)0 (1)−1 (0.1)295.25750.86
4−1 (150)−1 (0.5)0 (0.2)288.7846.08
51 (200)1 (1.5)0 (0.2)401.02101.2
60 (175)0 (1)0 (0.2)341.76976.65
7−1 (150)0 (1)−1 (0.1)271.26640.77
80 (175)1 (1.5)1 (0.3)442.699129
90 (175)0 (1)0 (0.2)367.18376.26
100 (175)−1 (0.5)−1 (0.1)245.30930.59
110 (175)−1 (0.5)1 (0.3)364.01669.139
120 (175)0 (1)0 (0.2)359.21576.87
131 (200)−1 (0.5)0 (0.2)311.75560
140 (175)1 (1.5)−1 (0.1)300.14358.11
15−1 (150)1 (1.5)0 (0.2)363.77583.27
Table 9. The ANOVA table for temperature.
SourceSum of
Squares
dfMean
Square
F-Valuep-Value
Model44,776.3794975.1510.940.0085significant
V5423.2515423.2511.930.0182significant
d11,083.89111,083.8924.380.0043significant
f24,193.62124,193.6253.210.0008significant
Vd50.91150.910.11200.7515
Vf2504.5512504.555.510.0658
df142.191142.190.31270.6001
V2569.271569.271.250.3140
d219.64119.640.04320.8436
f2911.001911.002.000.2161
Residual2273.335454.67
Lack of Fit1935.423645.143.820.2145
Pure Error337.912168.95
Cor Total47,049.7114
R2 = 0.9517, R2 (adjusted) = 0.8647.
Table 10. The ANOVA table for power consumption.
SourceSum of
Squares
dfMean
Square
F-Valuep-Value
Model10,583.5791175.9510.210.0099significant
V1649.9611649.9614.330.0128significant
d3435.0013435.0029.820.0028significant
f3838.5913838.5933.330.0022significant
Vd4.0214.020.03490.8591
Vf987.841987.848.580.0327significant
df261.491261.492.270.1922
V2165.761165.761.440.2840
d227.81127.810.24150.6440
f2214.841214.841.870.2302
Residual575.895115.18
Lack of Fit575.703191.902010.840.0005significant
Pure Error0.190920.0954
Cor Total11,159.4714
R2 = 0.9484, R2 (adjusted) = 0.8555.
Table 11. Optimum cutting parameters and output responses.
Optimal Cutting ParametersOutput Response
Cutting Speed (m/min)Depth of Cut (mm)Feed Rate (mm/rev)Temperature
(°C)
Power Consumption
(W)
162.4271.390.2472382.09688.788
Table 12. A comparison of the temperature and power consumption values for the optimum cutting parameters.
Output ResponseError Rate by RSM Result
TemperaturePower
Consumption
TemperaturePower
Consumption
Second-order regression model predictions384.1493.7450.5%5.5%
Confirmation experiment with FEM analysis400.9298.664.9%11.0%
Validation experiment in real experimental environment394.7394.663.3%6.6%
Disclaimer/Publisher’s Note: The statements, opinions and data contained in all publications are solely those of the individual author(s) and contributor(s) and not of MDPI and/or the editor(s). MDPI and/or the editor(s) disclaim responsibility for any injury to people or property resulting from any ideas, methods, instructions or products referred to in the content.

