Article

Experiments and Fluent–Engineering Discrete Element Method-Based Numerical Analysis of Block Motion in Underwater Rock-Plug Blasting

1
Engineering Technology Research Center in Intelligent Blasting of Hubei Province, College of Science, Wuhan University of Science and Technology, Wuhan 430065, China
2
State Key Laboratory of Water Resources and Hydropower Engineering Science, Wuhan University, Wuhan 430072, China
*
Author to whom correspondence should be addressed.
Appl. Sci. 2023, 13(1), 348; https://doi.org/10.3390/app13010348
Submission received: 17 November 2022 / Revised: 23 December 2022 / Accepted: 24 December 2022 / Published: 27 December 2022
(This article belongs to the Special Issue Advances in Rock Blasting and Mining)

Abstract

:

Featured Application

(1) reproducing motion of broken blocks in underwater rock-plug blasting via a laboratory model experiment using concrete blocks; (2) numerically simulating model experiments using Fluent–EDEM with the UDF interface; (3) revealing the penetration mechanism in underwater rock-plug blasting; (4) discussing the influences of the water head and the opening angle of the rock-plug on block motion during underwater blasting.

Abstract

Underwater rock-plug blasting is a special blasting technique for excavating underwater inlets. In the process of rock-plug blasting excavation, the blasting-block movement from the difference in water pressure inside and outside the tunnel is one of the key factors for successful construction. Laboratory underwater rock-plug blasting experiments were conducted using small explosive charges, and a high-speed camera was adopted to observe and study block motion. Then, numerical simulations were conducted for the model experiment based on the Fluent and Engineering Discrete Element Method (EDEM) coupling program developed using the user-defined function (UDF) interface to reveal the mechanism underpinning the penetration of underwater rock-plug blasting. The results showed that the process of block motion in underwater rock-plug blasting can be divided into two stages. In the first stage, broken blocks move to two sides along the axis of the rock plug under the blast load. A blasting crater is formed on the downstream end face of the rock plug under the effects of the free face, while the upstream end face is loosened, or blocks are ejected under the influence of the water pressure. In the second stage, blocks flow to the broken-rock pit under the effects of water scouring and gravity, and, finally, the rock plug is penetrated. The larger the head of water and the opening angle of the rock plug are, the better the penetration effect for the rock plug is. The Fluent–EDEM coupling algorithm was in good agreement with the experimental results in terms of the rock-plug blasting effect and the velocity curve of the blocks, indicating that the coupling method had a favorable effect in simulating the interaction of blocks and water during underwater rock-plug blasting. The findings are expected to promote the application and popularization of the rock-plug blasting technique and can provide a reference for rock-plug blasting in water-intake and water-diversion projects.

1. Introduction

Underwater rock-plug blasting is an important construction technique for resource development, flood control, and disaster reduction projects in the water conservancy and hydropower fields and is mainly applied when forming reservoirs or in lakes. Under conditions where it is not possible to empty reservoirs or build cofferdams, rock-plug blasting is a technique that can economically and safely allow construction of all kinds of tunnel inlets and outlets (Figure 1). The disposal of broken rocks is one of the key techniques for the success of rock-plug blasting. Generally, broken rocks produced in blasting are disposed by pre-setting a stone pit to avoid wearing down and causing damage to hydraulic facilities, including the downstream tunnel lining, valves, and downstream structures [1]. Therefore, studying the motion of broken rocks under blasting impacts and water scouring is important for the design of underwater rock-plug blasting.
Many scholars have studied how to control fragmentation and harmful effects in underwater rock-plug blasting. From the perspective of blasting stress fields, Hu et al. [2] expounded the penetration mechanism of rock-plug blasting under conditions involving single and double free faces. They found that the difference between the two conditions mainly resulted from the joint action of the clamping effect of the rock mass at the bottom of the rock plug and the reflected tensile stress waves at the free face. Based on one-dimensional transient flow theory and the thermodynamic characteristics of gas flows, Chen et al. [3] established a numerical simulation model for the hydraulic transition process during air-cushion underwater rock-plug blasting. On this basis, they explored the hydraulic characteristics and influences of the blasting parameters in the blasting transition process under the action of the huge air mass and impact force after rock-plug blasting. Feng et al. [4,5] studied air-cushion underwater rock-plug blasting and conducted simulation experiments for field rock-plug blasting at the Xianghongdian pumped-storage power station. By using full-row borehole blasting and millisecond-delay blasting, Liang et al. [6] were able to exert control over the harmful effects of rock-plug blasting, and they reduced the air shock pressure, shock pressure in water, and dynamic water pressure of plugs by combining the method with a water-filled air-cushion stone pit. Zhao et al. [7] carried out hydraulic model experiments on the motion forms of broken rocks during rock-plug blasting with different water pressures in the reservoir and inside and outside the tunnel. They also applied the experiment to the rock-plug blasting in the Changdian hydropower station expansion project.
As is well-known, rock-plug blasting methods mainly employ concentrated charge blasting, the drilling blasting method, or combinations of the two. Before rock-plug blasting, it is generally necessary to conduct full-scale or half-scale prototype simulation tests near the location of the actual rock-plug blasting operations, which not only involves significant costs and difficulties in construction but also significant risks. Therefore, with the development of and improvements in software, researchers have used numerical methods to solve the problems in blasting engineering. Of course, numerical simulation also has limitations. For example, some calculation parameters need to use the results from model experiments; otherwise, simulation work cannot be carried out.
In the 1980s, Shi [8,9] first proposed the numerical discontinuous deformation analysis (DDA) method for simulating the dynamic behaviors of discontinuous and blocky systems. DDA can simulate the discontinuous deformation of rocks with large deformation and displacement in the blasting and throwing process. Based on the DDA algorithm, Li et al. [10] simulated the mechanical failure of a three-dimensional (3D) masonry structure under impact. Zhao et al. [11] verified the feasibility and high efficiency of the DDA method in the modeling of blasting. Using the DDA method, Mortazavi and Katsabanis [12] studied the influences of the blasting parameters, the joint characteristics of rocks, and the pressure on the blast-hole walls on the throwing process for blasted blocks.
In terms of the simulation of the fracturing and fragmentation of rock masses, the mesh-free method, known as smoothed particle hydrodynamics (SPH), has also been widely used. Liu et al. [13] took the lead in applying the SPH method to underwater blasting. Then, Zong et al. [14] simulated blast waves and bubble motion by coupling the SPH method and the boundary element method (BEM). Fourey et al. [15] investigated the coupling of SPH and the finite element method (FEM) and evaluated the stability and efficiency of the model under different coupling parameters. Based on SPH–FEM coupling, Ming et al. [16] explored the structural dynamic responses caused by underwater contact blasting. Wang et al. [17] studied water inrush in the blasting excavation of tunnels based on SPH–FEM coupling. Liu and Zhang [18] summarized new SPH-based algorithms and methods coupling SPH with other mesh or particle methods that have been developed for solving fluid–structure interaction (FSI) problems since the advent of SPH.
The discrete element method (DEM) is also used to study the breakage and throwing of rocks in blasting. Su et al. [19] used PFC2D to simulate the relationship between the bench blasting parameters and the accumulated shape of blasted blocks. Based on the DEM, Zhang et al. [20] established a blasting model for limestone using FPC numerical software and applied the particle expansion loading algorithm to blasted particles to simulate the explosion process of explosives. Leng et al. [21] built a 3D bench blasting model in which the rock strength follows the Weibull distribution using the discrete element software 3DEC. Using the model, they simulated the dynamic breakage and throwing process for rocks in bench blasting with different initiating positions. Yan et al. [22] proposed a bench blasting model based on 3DEC by appropriately considering the size of blasted blocks and introduced the equivalent load, consisting of the pressure of stress waves and detonation gas, into the 3DEC model.
In recent years, the CFD–EDM method has been widely used to solve FSI problems in engineering, including for aerodynamic particle motion [23,24], circulating fluidized beds [25], filter-cleaning devices for air conditioners [26], and solid–liquid mixed fluid in deep-sea mining pipelines [27]. Based on the coupling of Fluent and the Engineering Discrete Element Method (EDEM), Duan et al. [28] simulated the pipeline plugging process and preliminarily studied the plugging mechanism for hydrates by considering the continuous fluid phases and discrete particle phases. Using Fluent–EDEM, He et al. [29] introduced a dynamic mesh and found that the model could simultaneously analyze the flow fields and motion of small particles caused by the free movement of a large solid model. Fu et al. [30] simulated the interaction between the seepage force and particles in a tunnel face using the CFD–DEM method. Yan et al. [31] adopted the CFD–DEM coupling method to simulate the underwater casting process for concrete, concluding that the cement mortar at the top and margins is easily washed away by water.
In summary, the block motion during underwater blasting involves a fluid–solid multi-phase coupling process. At present, application of DDA and SPH algorithms to underwater blasting still has some limitations [32]. To be specific, the DDA algorithm lacks an FSI module for fluid media and lumpiness, while the SPH algorithm, despite its ability to trace the material interface, has three shortcomings; namely, penetration of boundary particles, unstable tension, and structural anisotropy [33]. Therefore, the block motion during underwater blasting was studied here using a Fluent–EDEM method developed based on the user-defined function (UDF) interface. The research findings are expected to promote the application and generalization of underwater rock-plug blasting technology.

2. Underwater Rock-Plug Blasting Experiments

2.1. Experimental Principle

The breakage process of rocks during blasting can be divided into two stages: the action of blast waves and the quasi-static expansion of residual gas in the cavity. The first stage is the rock breakage stage, in which fractures appear in and then run through the rock mass under the action of blast waves, stress waves, and the expansion pressure of the detonation gas. The second stage involves the fracturing of bulges and the accelerated throwing of rocks. The initial conditions involve the rocks being fractured and forming a loose body and the existence of a certain degree of residual pressure in the cavity formed by the explosives; the motion velocity and acceleration of the rocks are thus dependent on the gas pressure in the cavities and the burden, and they bear little relation to the mechanical parameters of the rock (including its strength). Therefore, it was assumed that the underwater rock-plug body was fractured by the blasting impact, facilitating the study of block motion under the coupled effects of detonation gas and water flow.

2.2. Preparation of the Experimental Model and Experimental Set-Up

The rock-plug model—a polyvinyl chloride cylinder with a diameter of 100 mm to be filled by the block particles—was prefabricated. The reserved space was neatly filled with cubic blocks of cement mortar with a side length of 10 mm. The block particles were prepared according to a (C30) cement–sand–water ratio of 2:1:0.65. The prepared rock-plug model and blocks are shown in Figure 2. Furthermore, standard cylindrical samples were prepared for uniaxial compression testing (Table 1).
The most important characteristic of rock-plug blasting is that it aims to penetrate a rock plug and form a tunnel through blasting under conditions in which there is water on one side of the rock plug and no water on the other. This research aimed to investigate the motion of block particles in the rock plug subjected to the same charge with different heads of water and opening angles. To this end, the experimental set-up was designed with three parts (Figure 2): an upstream water storage tank measuring 250 mm × 260 mm × 460 mm, a rock-plug sample in the middle, and a downstream water tank for collecting broken blocks (hereinafter referred to as the downstream water tank) measuring 380 mm × 240 mm × 240 mm. The opening angle of the rock plug was denoted as β and the distance from the center of the upstream end face of the rock plug to the water surface was the head of water, denoted h. The main part of the experimental set-up was supported by an angle-iron frame and the opening angle of the rock plug could be changed by adjusting the positions of some of the angle irons.
Considering the safety of the experiment, black powder was used as the explosive. Figure 3 shows the cylindrical charge of 0.7 g, which had a length of 30 mm and diameter of 8 mm and was detonated by excitation with high-voltage pulses.
The outer shell of the rock-plug sample was a polyvinyl chloride cylinder with a diameter of 100 mm. According to engineering practice, the length–diameter ratio in the design of rock plugs generally needs to be larger than or equal to 1, so the block-filled area in the rock-plug sample was 100 mm long. As shown in Figure 2, a length of 25 mm was reserved on two sides of the polyvinyl chloride cylinder to ensure that the rock-plug sample could be firmly connected to the upstream and downstream water tanks, so the total length of the rock-plug sample was 150 mm. When filling the sample with block particles, the prepared cylindrical charge of 0.7 g of black powder (Figure 3) was also embedded in the sample. Considering the water pressure on the upstream end face of the rock plug, the center of the cylindrical charge of 0.7 g was positioned 40 mm from the upstream end face and 50 mm from the downstream end face of the rock-plug sample. To avoid the sliding and ensuing collapse of the block particles filling the rock plug before blasting, plaster was smeared on the outermost blocks on two ends of the rock-plug sample, such that the blocks did not drop down after the solidification of the plaster even if the rock-plug sample was placed vertically.
The experimental process, which was recorded using a GX-8 high-speed camera at a frame rate of 2000 FPS, a resolution of 832 × 600 pixels, and a shutter speed of 249.6 μs, is shown in Figure 4. The experimental cases for the underwater rock-plug blasting are listed in Table 2. A fabric background with orthogonal lines spaced at 100 mm intervals was pasted on the inner wall of the water tank.

2.3. Experimental Results and Analysis

2.3.1. Influence of the Head of Water

After detonation of the explosive, all block particles in the rock-plug sample were subjected to the blast load (Figure 5). Some block particles on both the upstream and downstream end faces of the rock plug moved outwards along the axis of the rock plug under the blast load. At 11 ms, the block group ejected from the downstream end face of the rock plug moved 100 mm along the axis of the rock plug. The average velocity of the block group flowing out from the downstream end face within 11 ms was calculated to be 11.364 m/s. As the block groups moved further, it was observed that the block group ejected from the upstream end face reached the gradation at 100 mm at 16.5 ms. It was calculated that the average velocity of these blocks within 16.5 ms was 7.576 m/s. At 105.5 ms, most of the block group driven by the blast load from the downstream end face accumulated on the bottom of the downstream water tank; the vertical velocity of the block group in the upstream water tank gradually decelerated to zero under frictional resistance from the water and gravity, and these blocks began to fall. After 105.5 ms, block particles flowing out from the downstream end face of the rock-plug sample moved to the downstream water tank under the actions of scouring and gravity. Within 1026.5 ms of the detonation, water in the upstream water tank descended slowly, indicating that the rock-plug blasting failed to effectively form a through-going channel (Figure 5d).
The water level in the upstream water tank increased to 205 mm, as shown in Figure 6. At 10.5 ms after the detonation, the block group flowing out from the downstream end face reached 100 mm, so the average motion velocity of the blocks differed only slightly from that under a head of water of 105 mm. At 24 ms, the block group thrown out from the upstream end face reached 100 mm. Compared to the conditions involving a head of water of 105 mm, the average velocity of these blocks decreased to 5.208 m/s with a head of water of 205 mm. Figure 6c shows that the number of blocks driven by water scouring was significantly reduced at 1026.5 ms. Compared to the conditions involving a head of water of 105 mm, significant flows of water could be observed in the downstream water tank with a head of 205 mm, which indicated that the increase in the applied head of water was conducive to improving the degree of penetration of the rock-plug blasting.
Figure 7 shows the condition involving a water level of 305 mm in the upstream water tank. The block group driven by the blast load from the upstream end face did not reach the 100 mm gradation until 34.5 ms, so its average velocity was 3.623 m/s. Under the effects of the water scouring, many blocks of particles flowed to the downstream water tank along the rock-plug sample. Comparing Figure 7 with Figure 6c, it can be seen that this took similar amounts of time under the two conditions, but there were more blocks driven by water scouring with a head of water of 305 mm. According to Figure 7c,d and compared to Figure 5d and Figure 7d, the largest water flow to the downstream water tank was found with a head of water of 305 mm. Within the same time period, the water level in the upstream water tank dropped the most rapidly with a head of water of 305 mm, suggesting that this had a better effect on the penetration of the rock-plug than other conditions.

2.3.2. Influences of the Opening Angle of the Rock Plug

The opening angle of the rock plug was changed to 40° while the distance from the center of the upstream end face of the rock plug to the water surface was kept the same as that under the condition where β = 30° and h = 305 mm (Figure 8). Figure 8a,b respectively display the lengths of time required by the block groups flowing out from the downstream and upstream end faces to reach the 100 mm gradation under the effects of the blast load, which were slightly different from those under the condition where β = 30° and h = 305 mm. Figure 8c,d demonstrate that some falling particles in the upstream water tank were sucked into the channel in the rock plug under the action of water flows and then flowed to the downstream water tank.

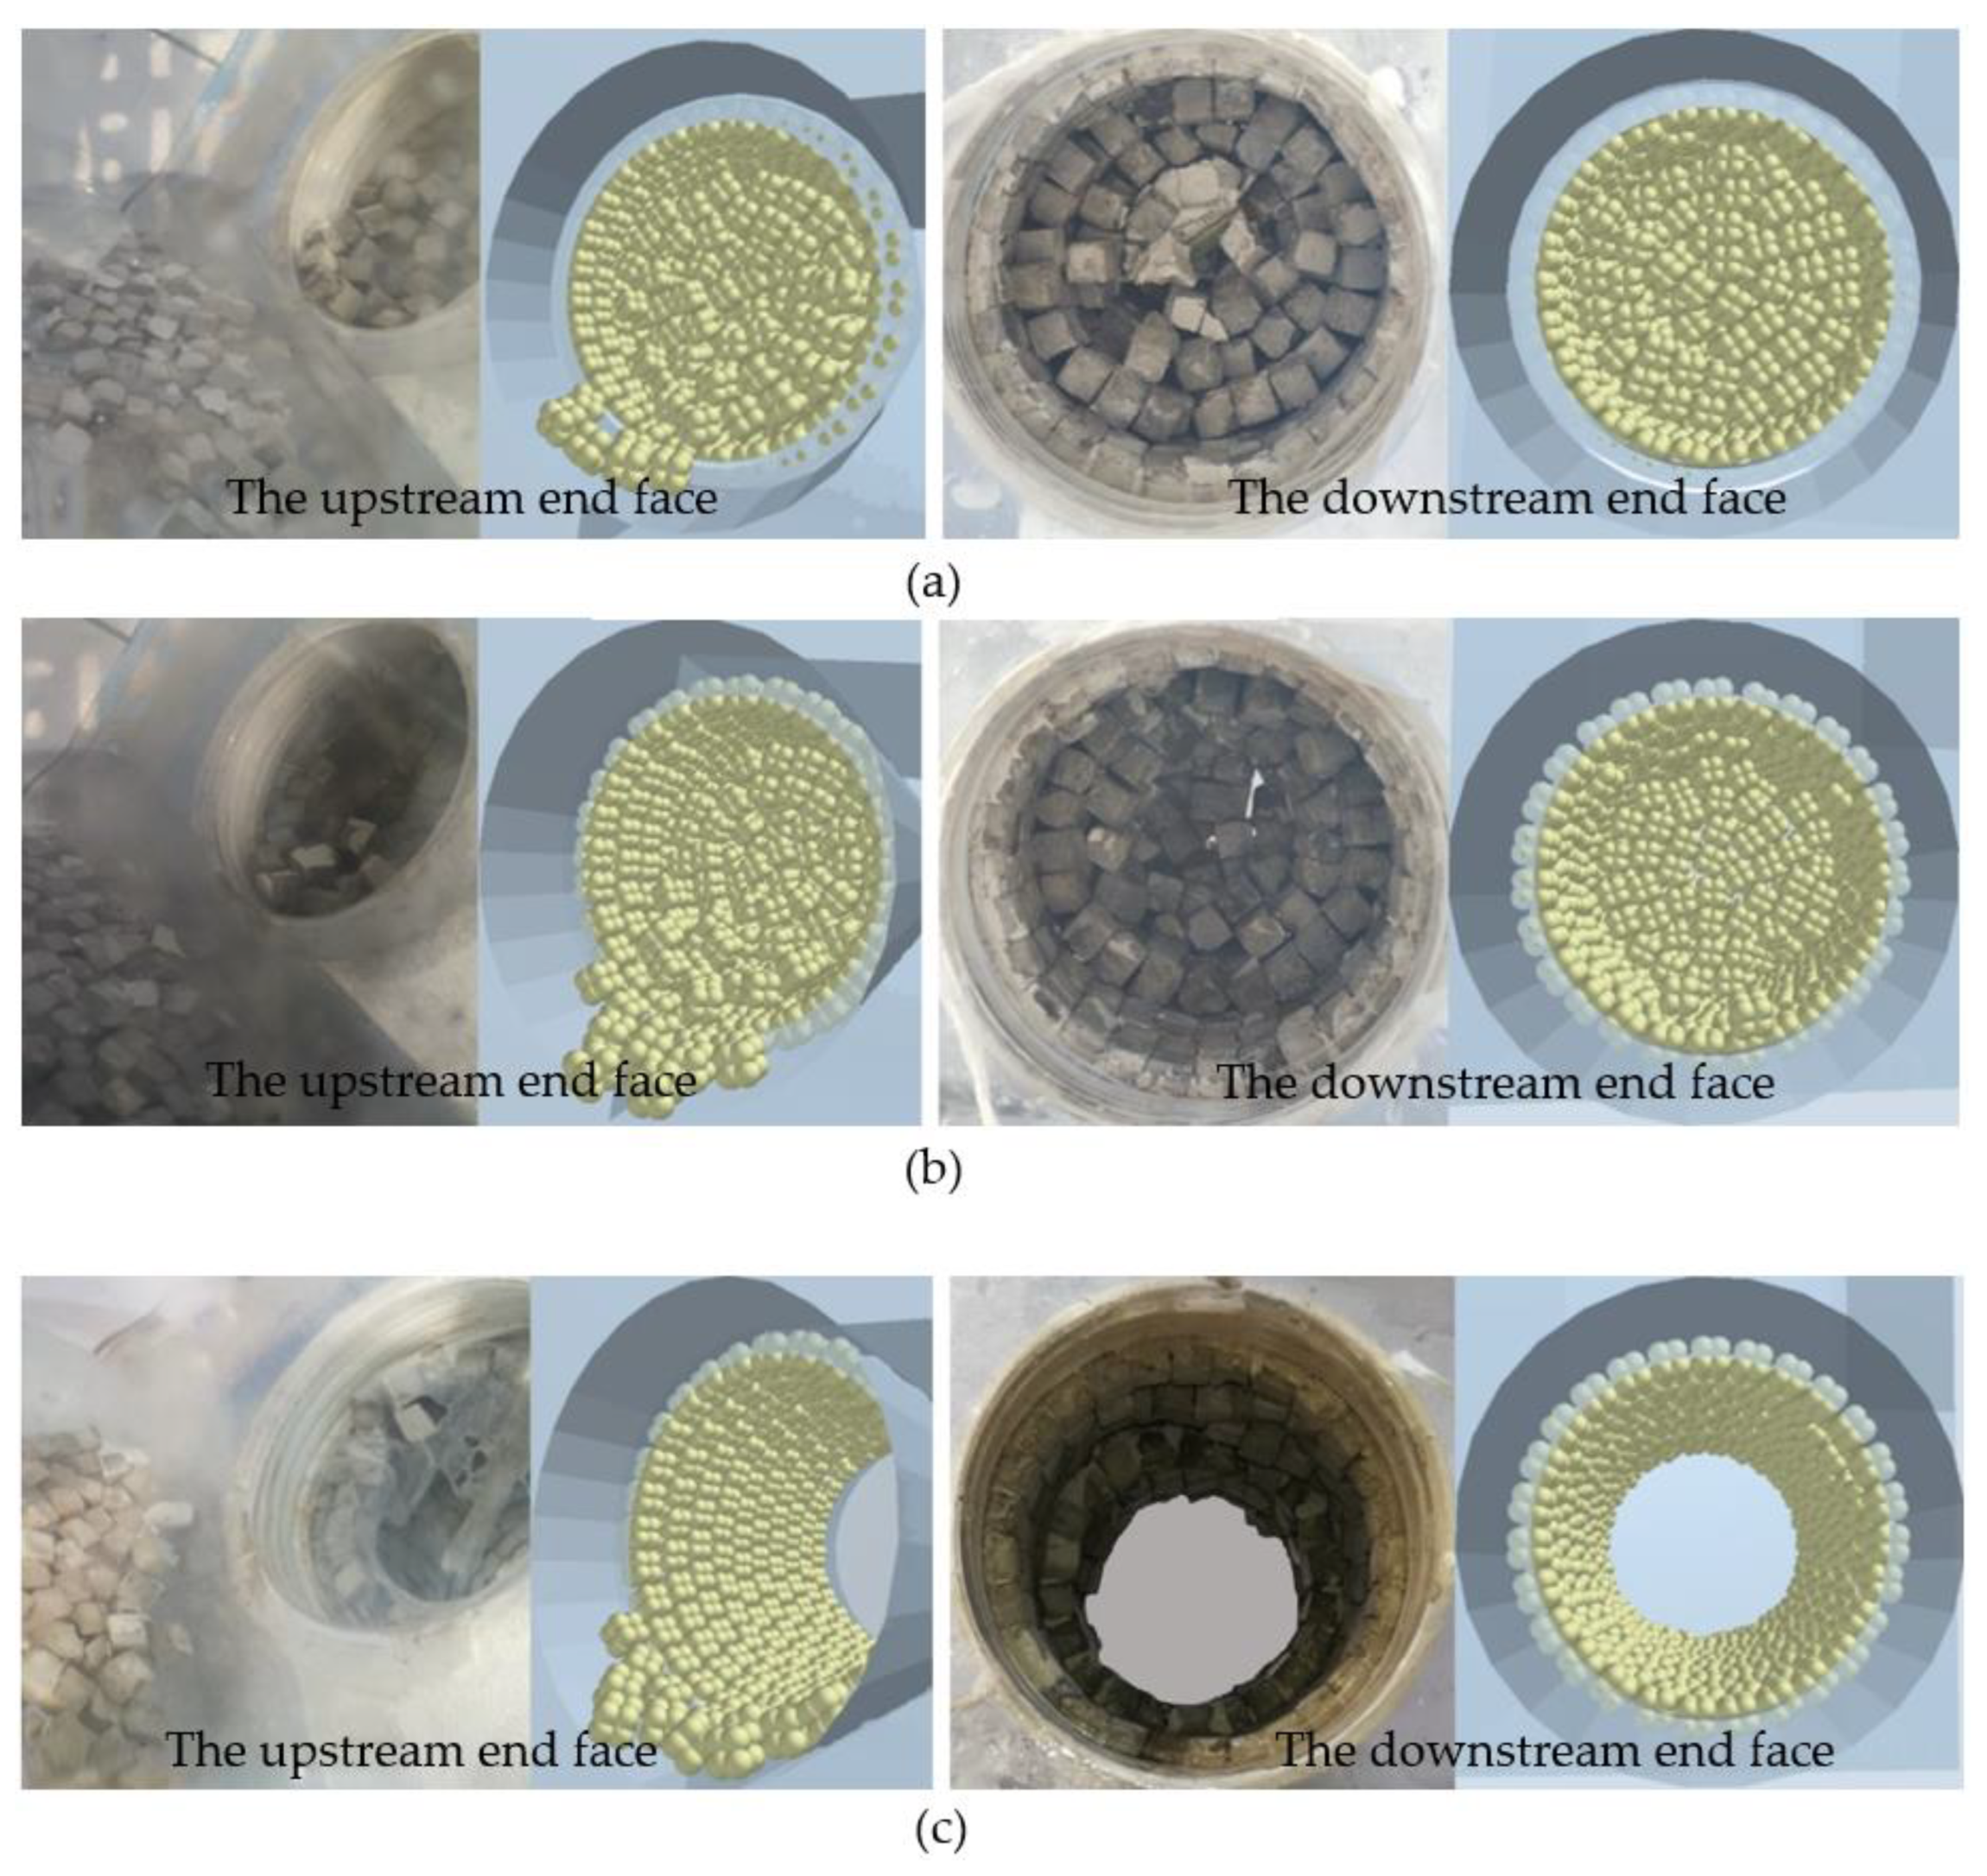
2.3.3. Comparison of Penetration Effects

Figure 9 displays the effects of rock-plug blasting with different opening angles and heads of water. Two experiments were conducted under each condition. The research provided highly representative results, and the images were taken from the downstream water tank to the upstream one. As shown by Figure 9a–c, a conical funnel was formed on the downstream end face after the outflow of the block group from the blasting action when the charge was 0.7 g and the opening angle was 30°. Whether the rock plug was penetrated or not was dependent on the motion of the block group at the upstream end face under the effects of water scouring. When β = 30° and h = 105 mm, it was observed in the experiment that most blocks from the upstream end face were accumulated in the rock plug and did not collapse under the effects of water scouring. With the opening angle β at 30° and h = 205 mm, the number of accumulated blocks at the upstream end face was found to be much lower than that under a head of water of 105 mm. When β = 30° and h = 305 mm, the rock plug could be penetrated and the minimum diameter of the channel was about 60 mm, with two rings of block particles remaining on the upstream end face and only one ring on the downstream end face. The rock-plug blasting effect when the head of water was kept unchanged and the opening angle was changed to 40° is shown in Figure 9d. After increasing the opening angle to 40°, the penetration effect for the rock plug was similar to that with β = 30° and h = 305 mm. Under these conditions, the minimum diameter of the through-going channel reached 80 mm, and only a ring of block particles was retained around the whole channel in the rock plug. It is worth noting that the rock-plug sample was connected to the upstream and downstream water tanks via screw-type connectors nested in reserved segments with lengths of 25 mm on two sides of the polyvinyl chloride cylinder. Therefore, block particles in the outermost ring of the rock plug were affected by a clamping force resulting from the squeezing of the screw-type connectors that connected the upstream and downstream water tanks with the rock plug.
In summary, the rock-plug blasting effect gradually improved with increasing heads of water in the upstream water tank when the charge remained unchanged.

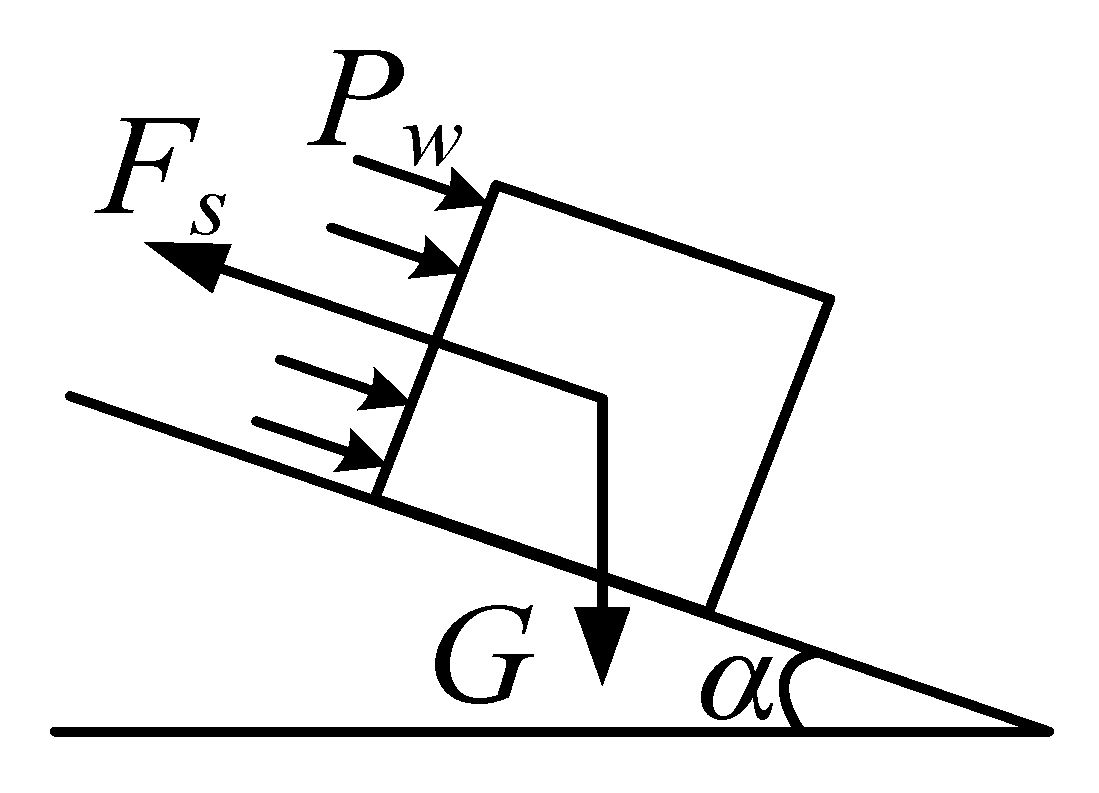
2.3.4. Discussion of Block Motion

The block motion in the rock-plug blasting experiment can be divided into two stages: in the first stage, the blocks moved out of the openings on the two sides along the axis of the rock plug under the effects of the blast load. The block group flowing out from the downstream end face accumulated at the bottom of the downstream water tank after colliding with the sides of the tank, while that from the upstream end face finally fell to the bottom of the upstream water tank after its vertical velocity decreased to zero under the effects of the frictional resistance imposed by the water and gravity. In the second stage, block particles flowed to the downstream water tank as a result of the scouring action of the water. In the first stage, blocks driven by the blast load were separately thrown out of the upstream and downstream end faces and their initial kinetic energy was related to the charge and the charge position. The same charges and charge positions were used in the experiment, so the above assumption was proved by the similar times taken for the block particles to reach the 100 mm gradation under the four conditions.
In the first stage, the four conditions mainly differed in terms of the motion process of the block particles flowing out from the upstream end face as a result of the driving action of the blast load. When the opening angle of the rock plug was 30°, the time taken by the block particles flowing out from the upstream end face under the effects of the blast load to reach the 100 mm gradation was also prolonged with increasing heads of water. This indicated that changes in the applied head of water altered the hydrostatic pressure on the upstream end face, and the head was directly proportional to the hydrostatic pressure. Therefore, the head exerted a significant inhibitory effect on the motion of the block particles flowing out from the upstream end face. After adjusting the opening angle to 40°, the angle of ejection of the block particles from the upstream end face was larger than with an opening angle of 30°, so some of these particles returned to the rock plug during their descent before flowing to the downstream water tank with the water.
In the second stage, the effect of scouring on the block particles remaining in the rock plug was the key to penetrating the rock plug. All the block particles remaining in the rock plug were treated as a whole (Figure 10). A blasting crater was formed on the downstream end face under the effects of the blast load, which was a free face, and the upstream end face was subjected to hydrostatic pressure Pw, its self-weight G, and friction force Fs. When the head of water increased, the water pressure on the upstream end face also increased; as the head increased to 305 mm, the water pressure on the upstream end face reached a level at which it overcame the frictional force, so the rock plug was obviously penetrated. More block particles were observed to flow to the downstream water tank under the effect of scouring with increasing heads of water, which further enhanced the penetration achieved during rock-plug blasting.

3. Calculation Methods

Computational fluid mechanics (CFD) is a method used to mathematically solve the governing equation in flow fields and to calculate series of nodes numerically in finite element meshes. For incompressible fluids, it is based on three basic laws: the law of conservation of mass, the law of conservation of momentum, and the law of conservation of energy, as shown in Equations (1) and (2). The energy conservation equation was not considered here because energy exchange was not involved in this scenario.
ρ t + · ( ρ u ) = 0
( ρ u ) t + · ( ρ u u ) = p + · ( τ ) + ρ g F
where ρ , t, and u represent the fluid density, time, and velocity vector of fluid media, respectively; subscripts x, y, and z denote the projection of the velocity vector in the x-, y-, and z-axes, respectively; ∇, p, and g represent the Hamiltonian operator, the pressure of fluid media, and the acceleration vector, respectively; F refers to the interaction force between particles and fluids; and τ is the stress tensor, which indicates the viscous force exerted by the fluids.
In the DEM, the particle motion follows Newton’s second law of motion and involves both rotary and translational motion. The motion equations of particles (momentum conservation equation) are shown in Equations (3) and (4).
m i v i t = j F i j + F g + F f
I i ω i t = j T i j + T f
where v , ω, and m represent the velocity, angular velocity, and mass of particles, respectively; subscripts i and j indicate two particles in contact with each other; F i j is the contact force between particles i and j; F g is the gravitational force between particles; F f represents the interaction force between fluids and particles; I denotes the rotational inertia of particles; T is the moment between particles; and T f indicates the torque induced by the fluids.
For the interaction force between particles in the DEM, the Hertz–Mindlin contact model, considering rolling friction, was used here (Figure 11). The forces between two particles in contact with each other can be expressed using Equations (5)–(8) [34].
F n = S n δ n
F t = S t δ t
F n d = 2 5 6 β S n m * v n r e l
F t d = 2 5 6 β S t m * v t r e l
where F n and F t denote the normal and tangential contact forces, respectively; δn and δt represent the normal and tangential overlaps, as shown in Figure 11; F n d   and   F t d represent the normal and tangential damping forces; v n and v t indicate the projection of the relative velocity in the normal and tangential directions; and m* represents the equivalent mass. The damping coefficient β, normal stiffness Sn, and tangential stiffness St can be calculated using Equations (9)–(11).
β = ln e ln 2 e + π 2
S n = 2 E * R * δ n
S t = 8 G * R * δ n
1 m * = 1 m i + 1 m j
1 E * = ( 1 μ i 2 ) E i + ( 1 μ j 2 ) E j
1 R * = 1 R i + 1 R j
where E*, R*, and G* represent the equivalent Young’s modulus, equivalent radius, and equivalent shear modulus, respectively, which are calculated using Equations (13) and (14); E, μ , m, and R denote the Young’s modulus, Poisson’s ratio, mass, and radius of particles, respectively; subscripts i and j denote two particles that are in contact with each other; and e represents the recovery coefficient of particles.

3.1. CFD–DEM Coupling Principle

The coupling between particles and fluids occurs through the exchange of interaction forces in Equations (2) and (3). The interaction forces between particles and fluids generally include drag, buoyancy, and lift forces. The drag force is generally considered as a function of the drag coefficient. According to Li [35] and Zhao [36],
F d = π d 2 8 C d ρ f ( v u ) | v u |
C d = ( 0.63 + 4.8 R e p ) 2
R e p = d ρ f | v u | μ f
where F d , C d , d , ρ f , v , u , Rep, and μ f represent the drag force, drag coefficient, particle diameter, fluid density, fluid velocity, particle velocity, Reynolds number of the particles, and dynamic viscosity of the fluids, respectively.
The buoyancy force can be calculated using Equation (18) [37]:
F b = 1 6 π ρ f d 3 g
where Fb represents the buoyancy force and g is the acceleration due to gravity.
The lift force is calculated using Equation (19):
F l = 1 8 π ρ f d 2 ( 1 2 v ω ) ( v u )
where ω denotes the angular velocity of particles.

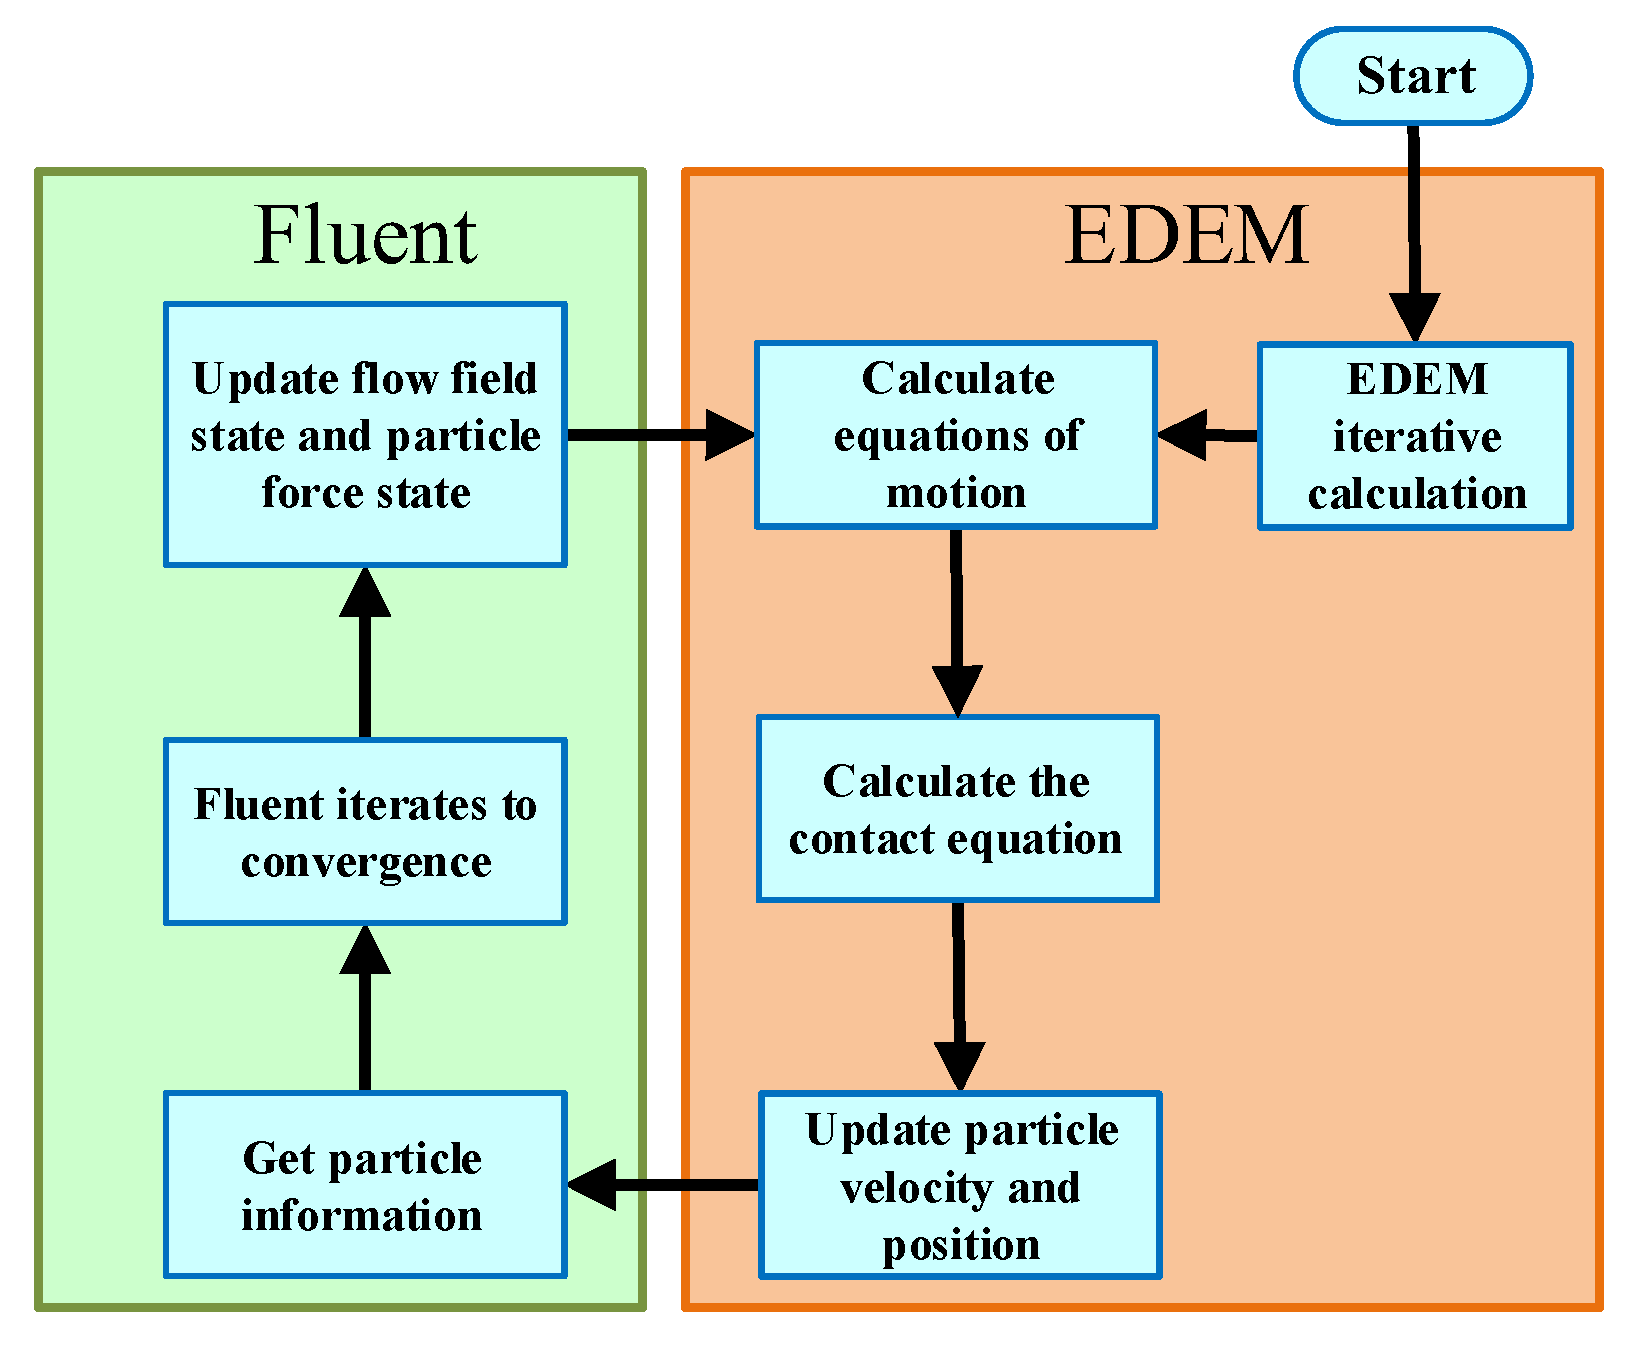
3.2. Fluent–EDEM Coupling Process

The momentum and energy are transferred between the DEM and the CFD by compiling an application programming interface (API). The program compiled by the API contains a CFD–DEM coupling scheme that takes into account fluid–particle interaction forces, including the drag, buoyancy, and lift forces. At the beginning of the computation, EDEM is run first, determining the contact force between particles by solving Equations (5)–(8) and the initial state of the particles by solving Equations (3) and (4). Fluent then updates the status information pertaining to the particle location and velocity, which is transferred to EDEM via the API. By solving the continuity equation (Equation (1)) and the momentum conservation equation (Equation (2)), Fluent updates the fluid grid state and attains the interactional forces (drag, buoyancy, and lift forces) between fluids and particles. Then, the interactional forces between fluids and particles are transferred to EDEM via the API to update the stress state of particles. Finally, a new cycle starts. A schematic representation of the process is shown in Figure 12.

4. Numerical Simulations of Underwater Rock-Plug Blasting

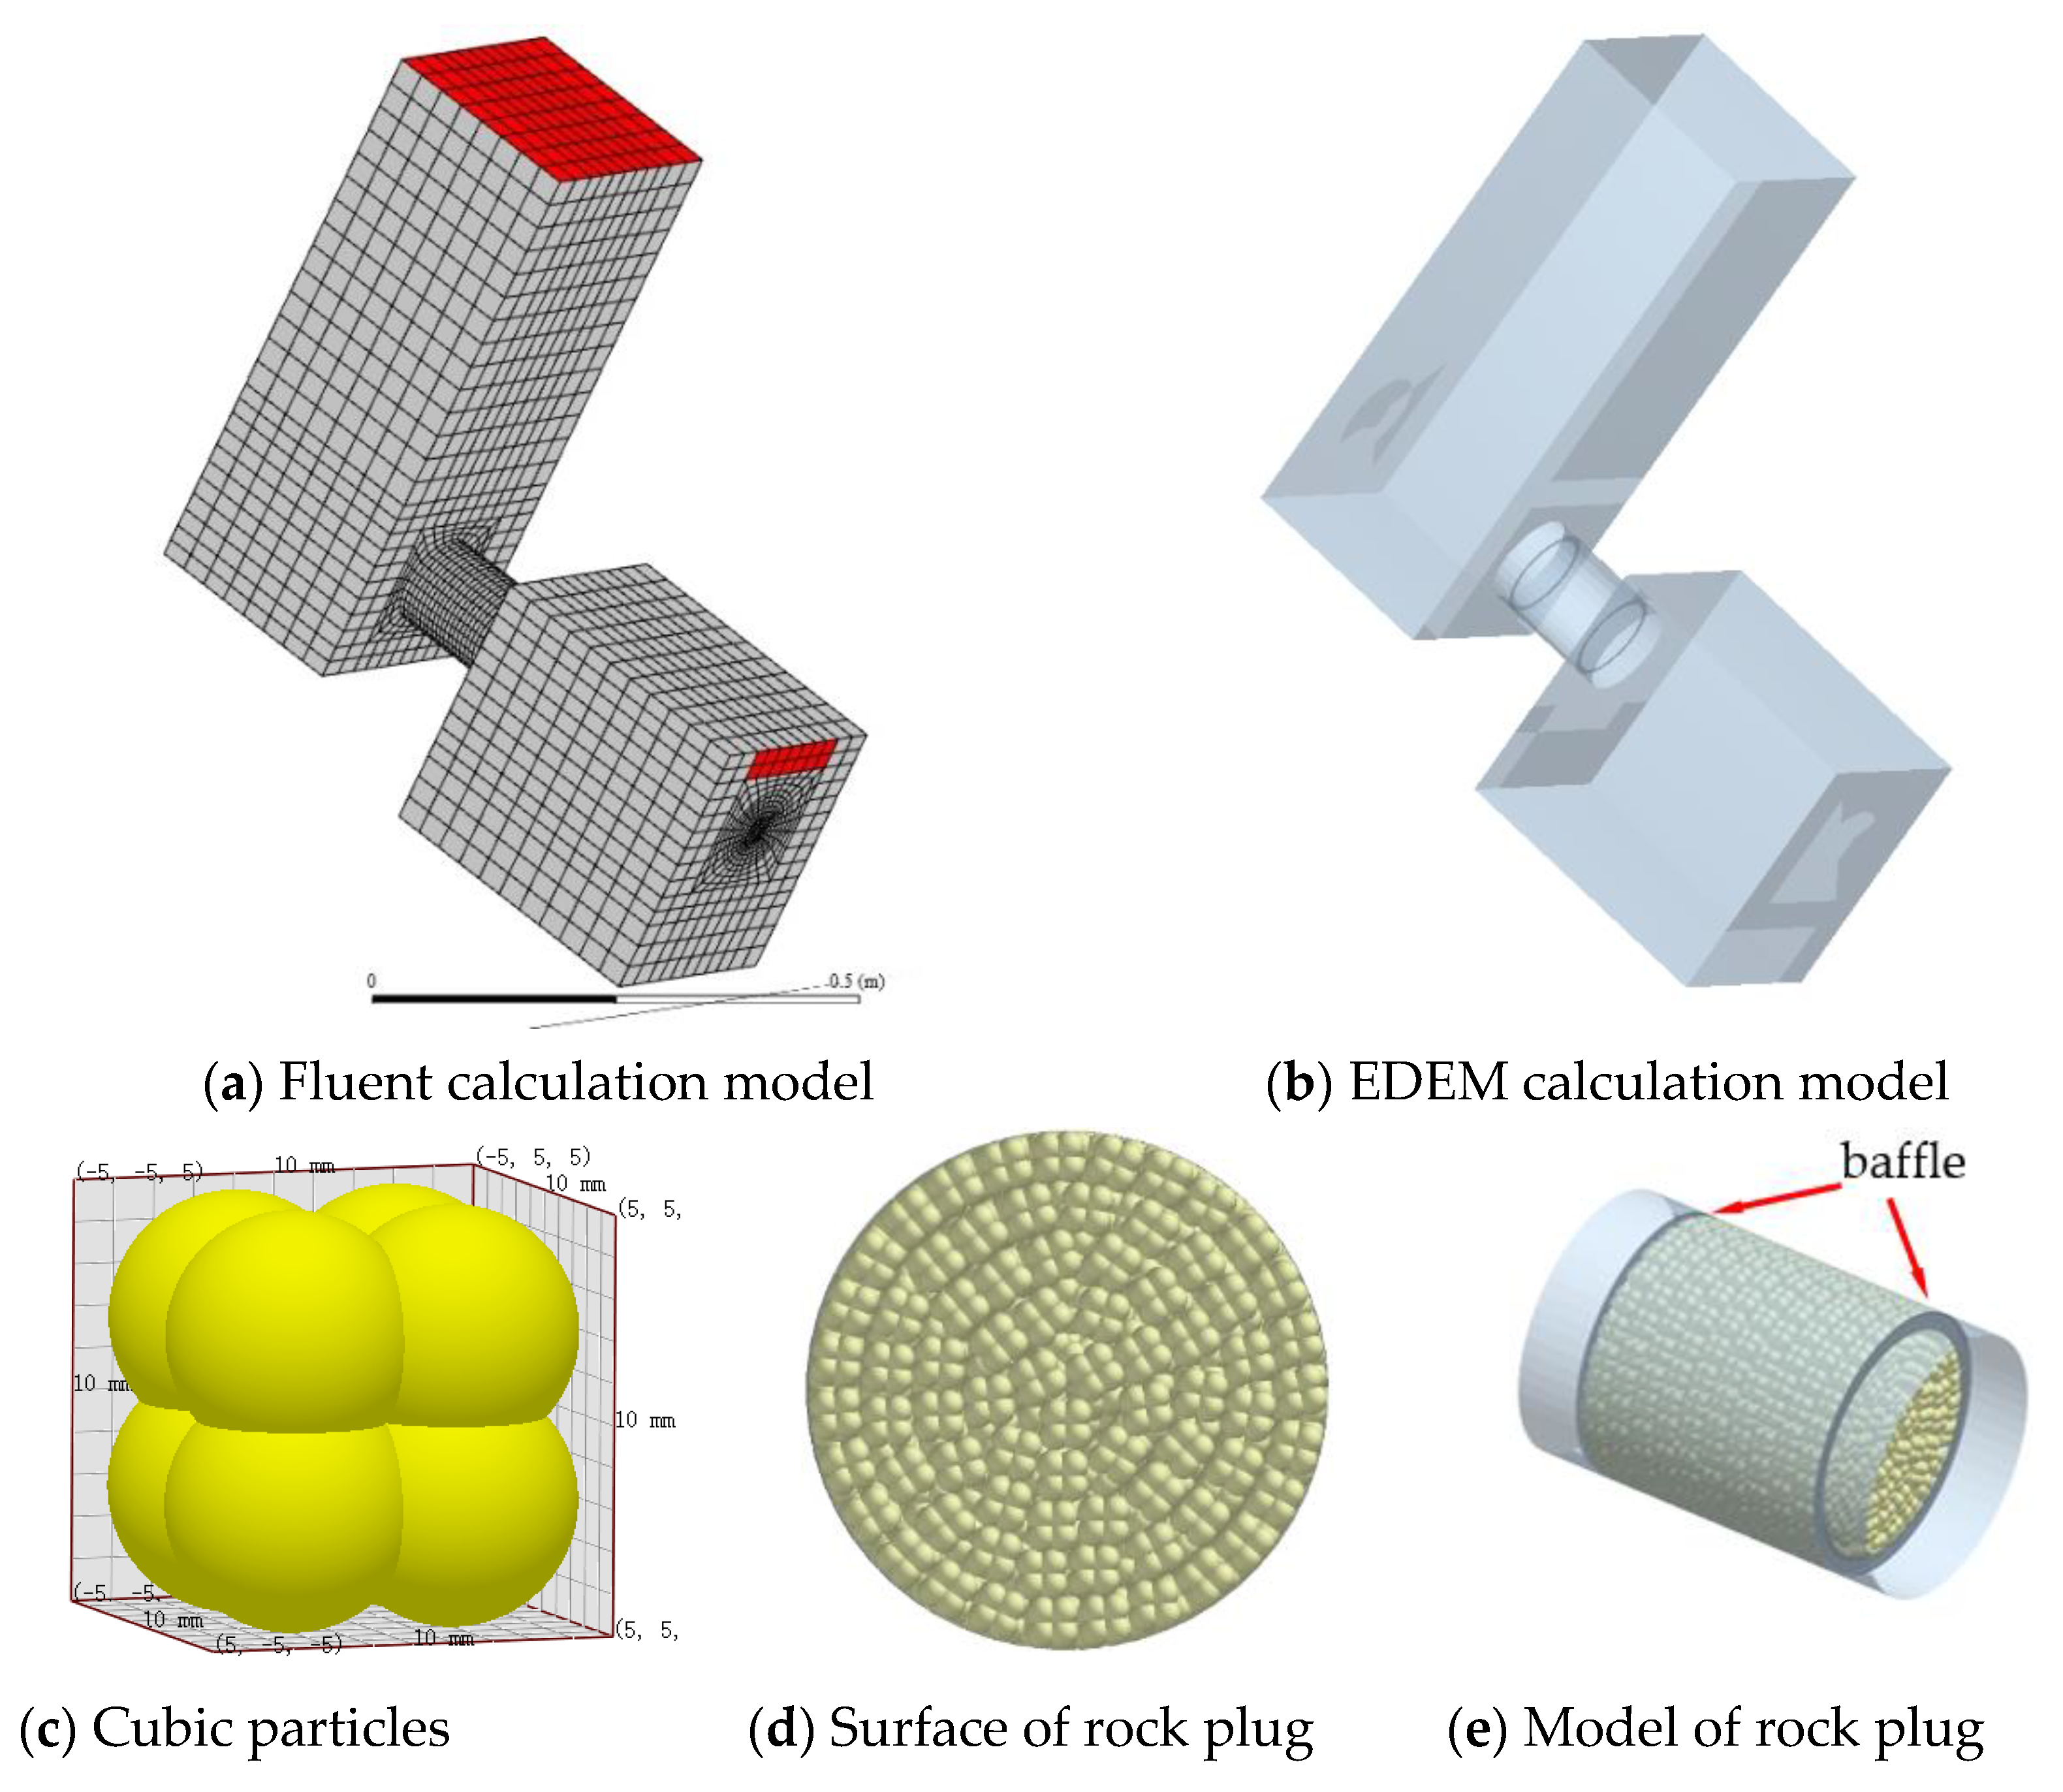
4.1. Simulation Model

The numerical model shown in Figure 13 was established in accordance with the characteristics of Fluent software and the size of the experimental set-up. Figure 13a shows the Fluent model, in which the dimensions of the rock plug and the downstream water tank are the same as those in the experiment, while the height of the upstream water tank is 4 mm higher. The red boundary face in the Fluent model represents a pressure outlet for which the gauge pressure is the atmospheric pressure and the operating density is 1.25 kg/m3, while the other boundaries are non-slip surfaces. The fluid region of the model was divided using elements with a side length of 20 mm. The block particles were modeled with a side length of 10 mm and composed of eight basic spherical particles. To comply with the filling in of the area of the rock-plug sample with the block particles in the experiment, the user-defined function (UDF) of EDEM was adopted to compile the particle factory program and enable the neat accumulation of particles in the numerical simulation model of the rock plug. As shown in Figure 13d, a total of 740 block particles were used for filling in the model. To simulate the constraint of the screw-type connectors used to connect the upstream and downstream water tanks on the outermost ring of the block particles in the experiment, a ring structure was established in the EDEM model (Figure 13e). Multi-phase flows were set in the Fluent model and water and air materials were activated. In accordance with the charge position in the field experiment, a high-pressure area was set at a position 40 mm from the upstream end face of the rock-plug model.

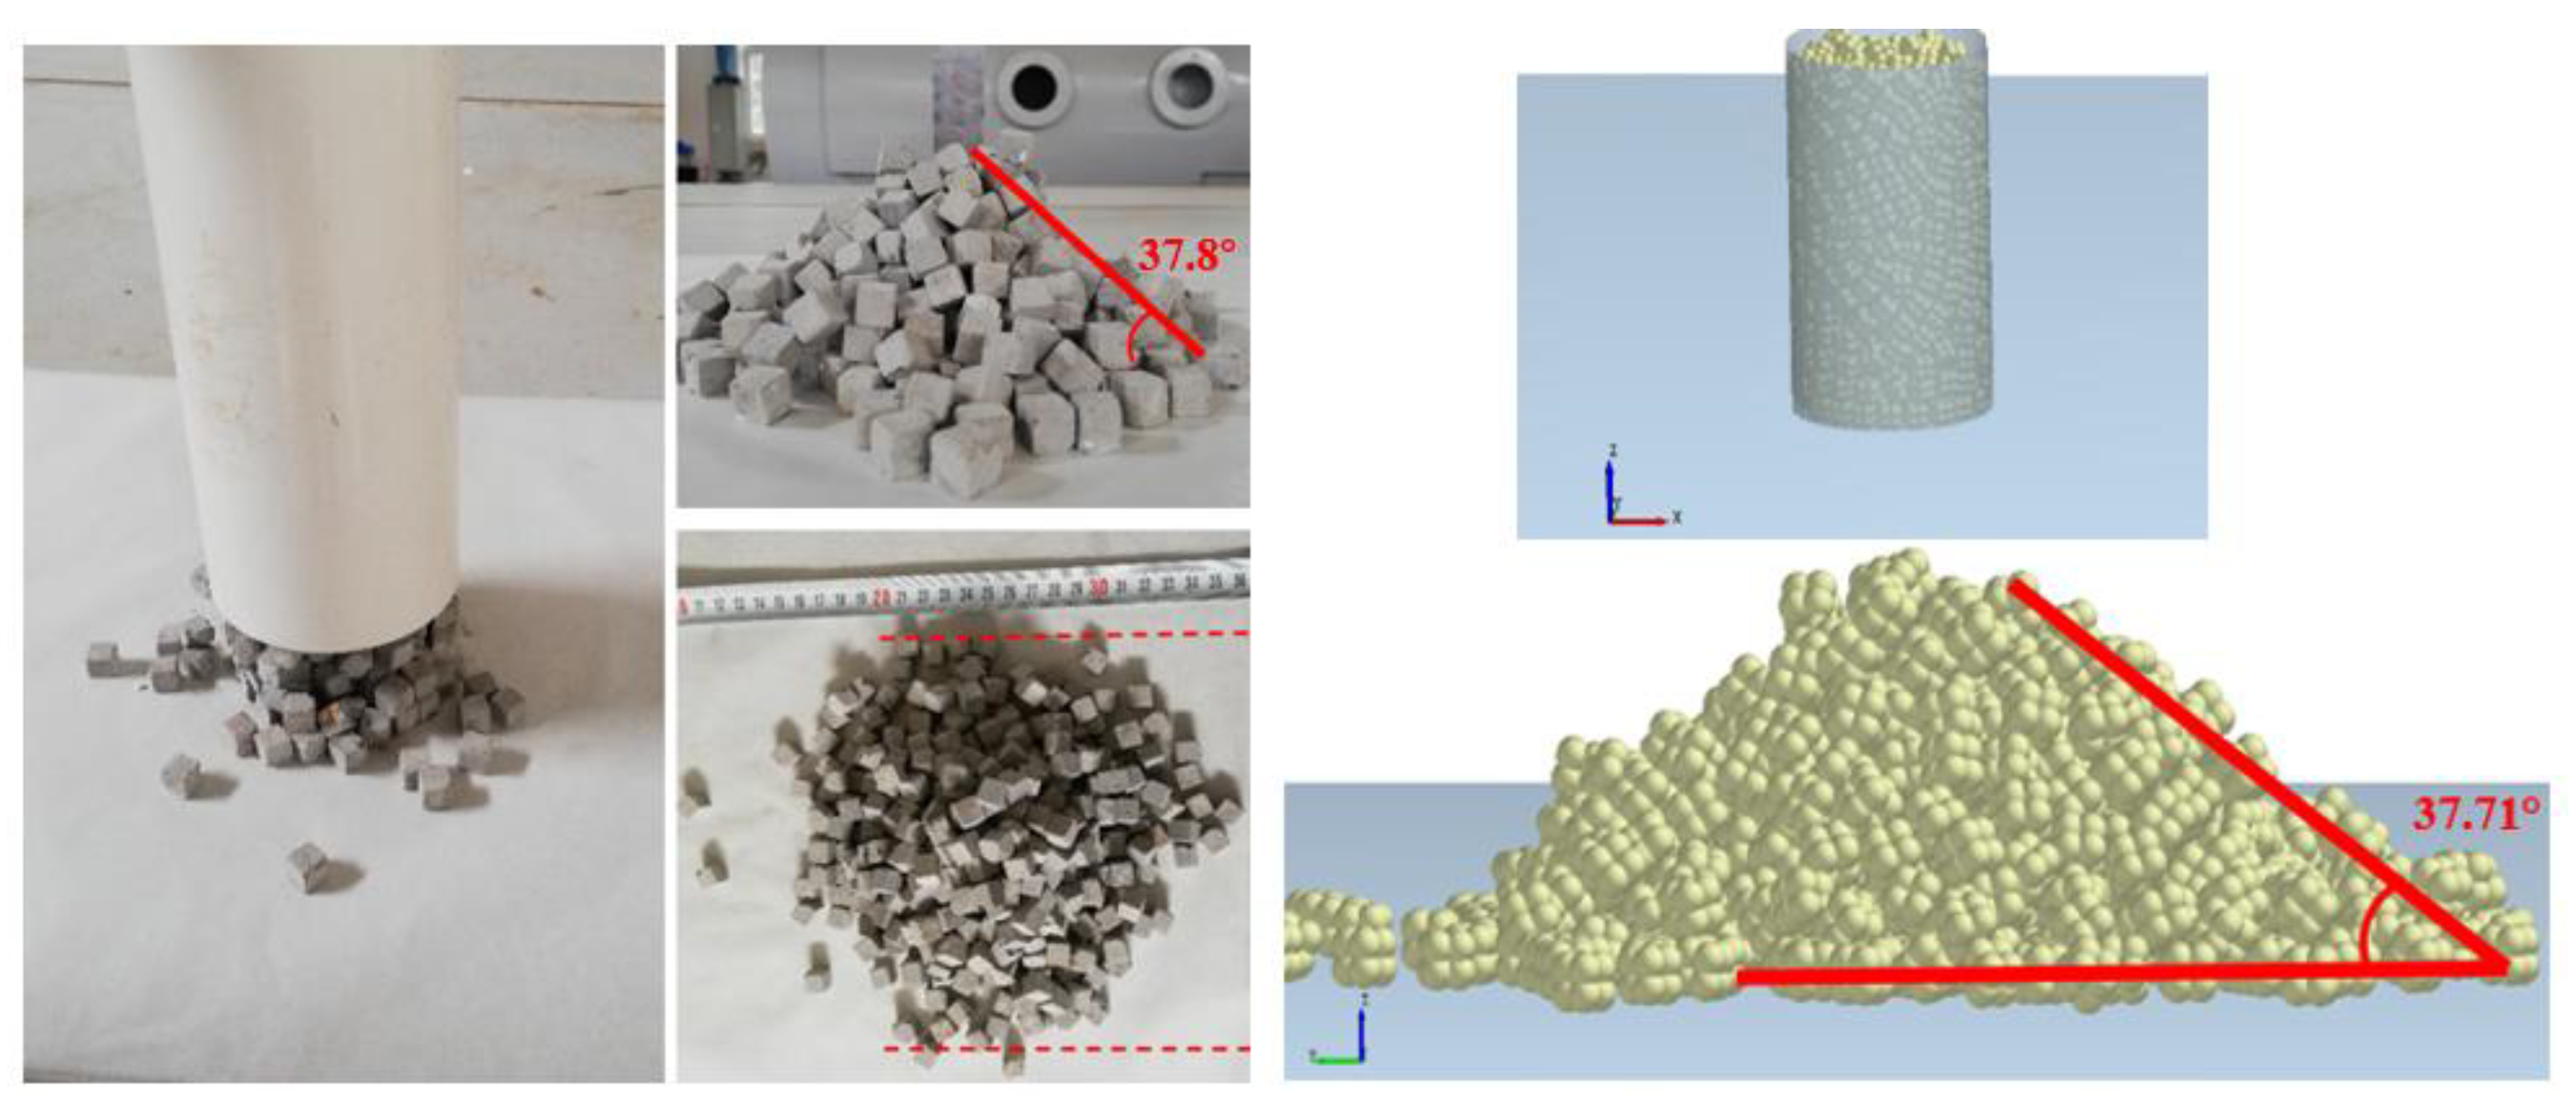
4.2. Parametric Calibration

The angle of repose test was conducted in accordance with the phenomenon whereby discrete particles accumulate to form stable slopes through their internal self-supporting ability. The natural angle of repose of a slope is mainly affected by the coefficient of friction between particles. Therefore, many researchers calibrate the coefficient of friction based on the angle of repose [38,39,40].
Figure 14 illustrates the process for the angle of repose test. A polyvinyl chloride cylinder with a diameter of 80 mm was placed vertically on a horizontal bench, and cubic particles were randomly selected and used to uniformly fill the cylinder to a height of 150 mm. Then, the cylinder was lifted vertically at a constant speed to allow the cubic particles to fall freely and form a pile, after which the angle of repose was measured and found to be about 38°. A cylindrical wall with a diameter of 80 mm and height of 150 mm was established in EDEM, and the particle model shown in Figure 14 was used to randomly fill the cylinder (621 particles were used). The cylinder was then lifted at a rate of 0.01 m/s. Finally, the particles formed an angle of repose of 37.7°, as displayed in Figure 14.
The parameters of the rock-plug model are listed in Table 3. In the EDEM model, the contact grids were set as three times the particle radius and the time step was 1 × 10⁻⁶ s, while the time step in the Fluent model was 5 × 10⁻⁵ s (i.e., about 50 times that in the EDEM model).

4.3. Simulation Results

4.3.1. Influences of the Head of Water

Figure 15 shows the simulation results under four conditions: β = 30° and h = 105, 205, and 305 mm, as well as β = 40° and h = 305 mm (isosurfaces of volume fractions of the water are also provided). At the instant of energy release under the excitation of the explosive, block particles are thrown out from the two end faces of the rock plug along the axis. The block group thrown out from the downstream end face slides to the bottom of the downstream water tank after colliding with the sides of the tank, while that from the upstream end face collides with the walls of the upstream water tank much later, and only the several blocks moving the fastest at the front end collide with the walls of the tank. In the falling and grounding of the block group in the upstream water tank, the water begins to flow to the downstream water tank along the loosened rock plug; the blocks falling to the downstream water tank no longer move along a straight trajectory but along a parabolic trajectory. This indicates that the driving mode of the block particles at this time is influenced by water scouring and gravity. In summary, the numerical simulation of underwater rock-plug blasting based on Fluent–EDEM coupling could simulate the two motion modes of the block particles in the model experiment of the rock-plug blasting: the motion driven by the blast load and the motion driven by water scouring and gravity.

4.3.2. Comparison of Penetration Effects

Figure 16 shows the experimental and simulation results under the three conditions with an opening angle of 30° to compare the distribution of block particles flowing out from the upstream and downstream end faces and the penetration effect after blasting. Whether considering the upstream or the downstream end faces, the numerical simulation results for the block distribution agreed with the experimental results, and the penetration effect in the rock-plug model was improved with the increase in the head of water in the upstream water tank. A few block particles remained on the downstream end face in the rock-plug model with different heads of water. This finding indicated that whether the rock plug was penetrated or not depended on whether the block particles from the upstream end face remaining in the rock plug after blasting could fall to the downstream water tank by overcoming the frictional resistance under the effects of water pressure, water scouring, and gravity. The blast load mainly played a role in two aspects of the underwater rock-plug blasting experiments: one was the formation of a blasting crater on the downstream end face of the rock plug, the other was the application of a loosening or weak throwing effect on block particles at the upstream end face.

4.3.3. Motion Velocity of Blocks

Figure 17 shows the time-history curves of the block velocities in the upstream water tank driven by the blast load under the two conditions with β = 30° and h = 205 mm and β = 40° and h = 305 mm. The experimental data shown in the figures were obtained with a high-speed camera, while the simulation results gave the average velocity curves of several block particles. Under the condition with the opening angle of 30° and an applied head of water of 205 mm, the numerically calculated peak block velocity was 7.61 m/s at 9 ms, and the peak block velocity in the experiment at 9.5 ms was 7.89 m/s. Under the condition with the opening angle of 40° and a head of water of 305 mm, the peak velocity at 10 ms obtained in the numerical simulation was 6.06 m/s, and that in the experiment at 12 ms was 6.25 m/s. The results suggest that the velocity curves for the blocks obtained in the numerical simulation and experiments were consistent, and the hydrostatic pressure exerted a direct influence on the initial velocity of the block particles.

4.3.4. Flow Field

The flow of the water medium in the upstream water tank was affected by the blast load and block motion. Taking the condition with β = 30° and h = 305 mm as an example, the distribution on the profile of streamlines that changed with time is shown in Figure 18. At the instant of energy release from the high-pressure area, the block particles began to move, and the streamlines on the two ends of the rock-plug model ran in the same directions as the motion of the block particles driven by the blast load. In addition, the closer they were to the two end faces of the rock-plug model, the higher the velocity of the fluid particles; the velocity of downstream airflow streamlines was much greater than that of the upstream water streamlines. Driven by the blast load, the block particles continued to move, and this was followed by the formation of two backflows arising as streamlines in both the upstream and downstream water tanks. Streamlines from the upstream and downstream end faces of the rock plug were reflected when they encountered the walls of the water tanks. As a result, backflow areas were separately formed above and below the axis of the rock plug, taking the axis as the boundary.
With the further dissipation of energy (Figure 18c), the overall peak velocity of the streamlines decreased at 52 ms. The water velocity of backflow streamlines in the upstream water tank decreased first, the large area of backflow above the axis of the rock plug disappeared, and the water streamlines pointed from the upper part to the bottom of the upstream water tank. This indicated that water in the upstream water tank began to flow into the rock plug. The water streamlines can be divided into two parts: some streamlines on the right, near to the end face of the rock plug, directly pointed to the inner side of the rock-plug model that had been loosened; the other water streamlines, distant from the end face of the rock plug, began to form a new, small backflow.
Figure 18d,e shows that the peak velocity across the whole flow field decreased further and the air backflow in the downstream water tank began to disappear. At 196 ms, all airflow streamlines in the downstream water tank pointed to the pressure outlet of the model, while the peak velocity of the water streamlines gradually increased, accompanied by a gradual increase in the area with the peak water velocity. The streamlines in the flow field of the water medium all pointed from the upstream water tank to the downstream water tank via the channel in the rock plug. As more water flowed to the downstream water tank along the channel (Figure 18f), backflowing airflow streamlines appeared near the pressure outlet in the upper right corner of the downstream water tank. This was because the velocity of water flowing to the downstream water tank was faster than that of the air medium, and the frictional force on the air–water interface caused the airflow streamlines near the flow to be larger than in other areas. Consequently, anticlockwise backflowing airflow streamlines appeared near the outlet in the upper right corner of the downstream water tank.

5. Conclusions

Underwater rock-plug blasting experiments were conducted with small explosive charges in this research. A high-speed camera was used to observe and study the motion of block particles under conditions involving different heads of water and different opening angles for the rock plug. Numerical simulations were also conducted in the experiment using the Fluent–EDEM fluid–structure interaction method, and the method was verified to be feasible and accurate. The key conclusions are as follows:
(1)
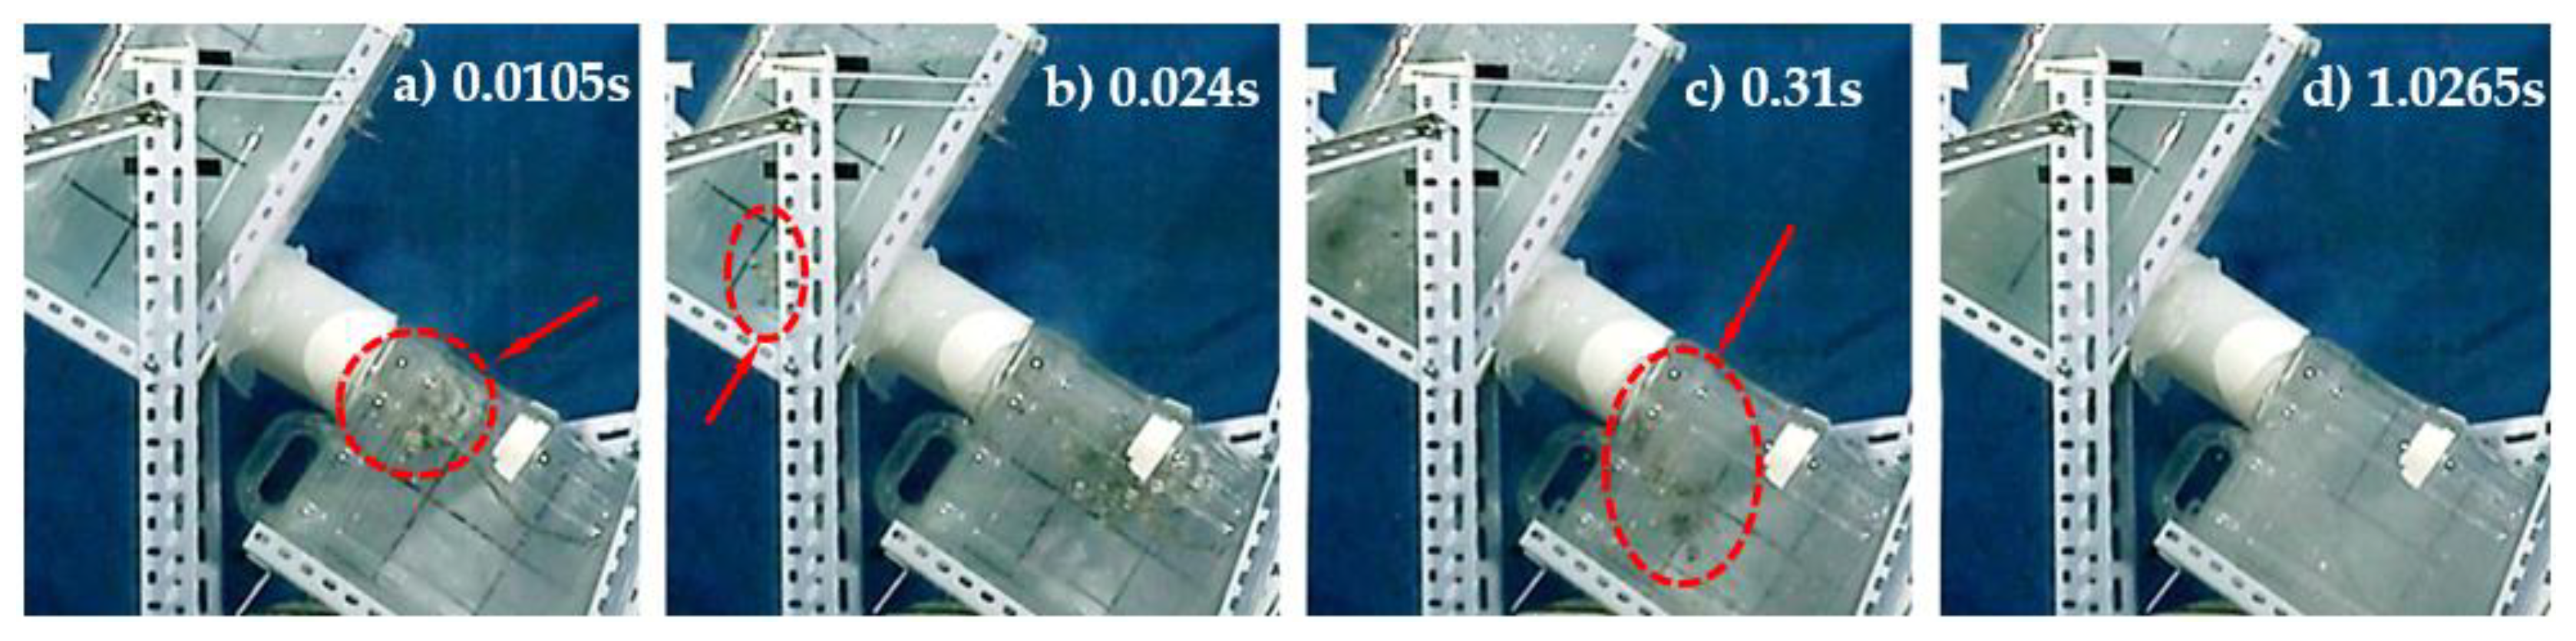
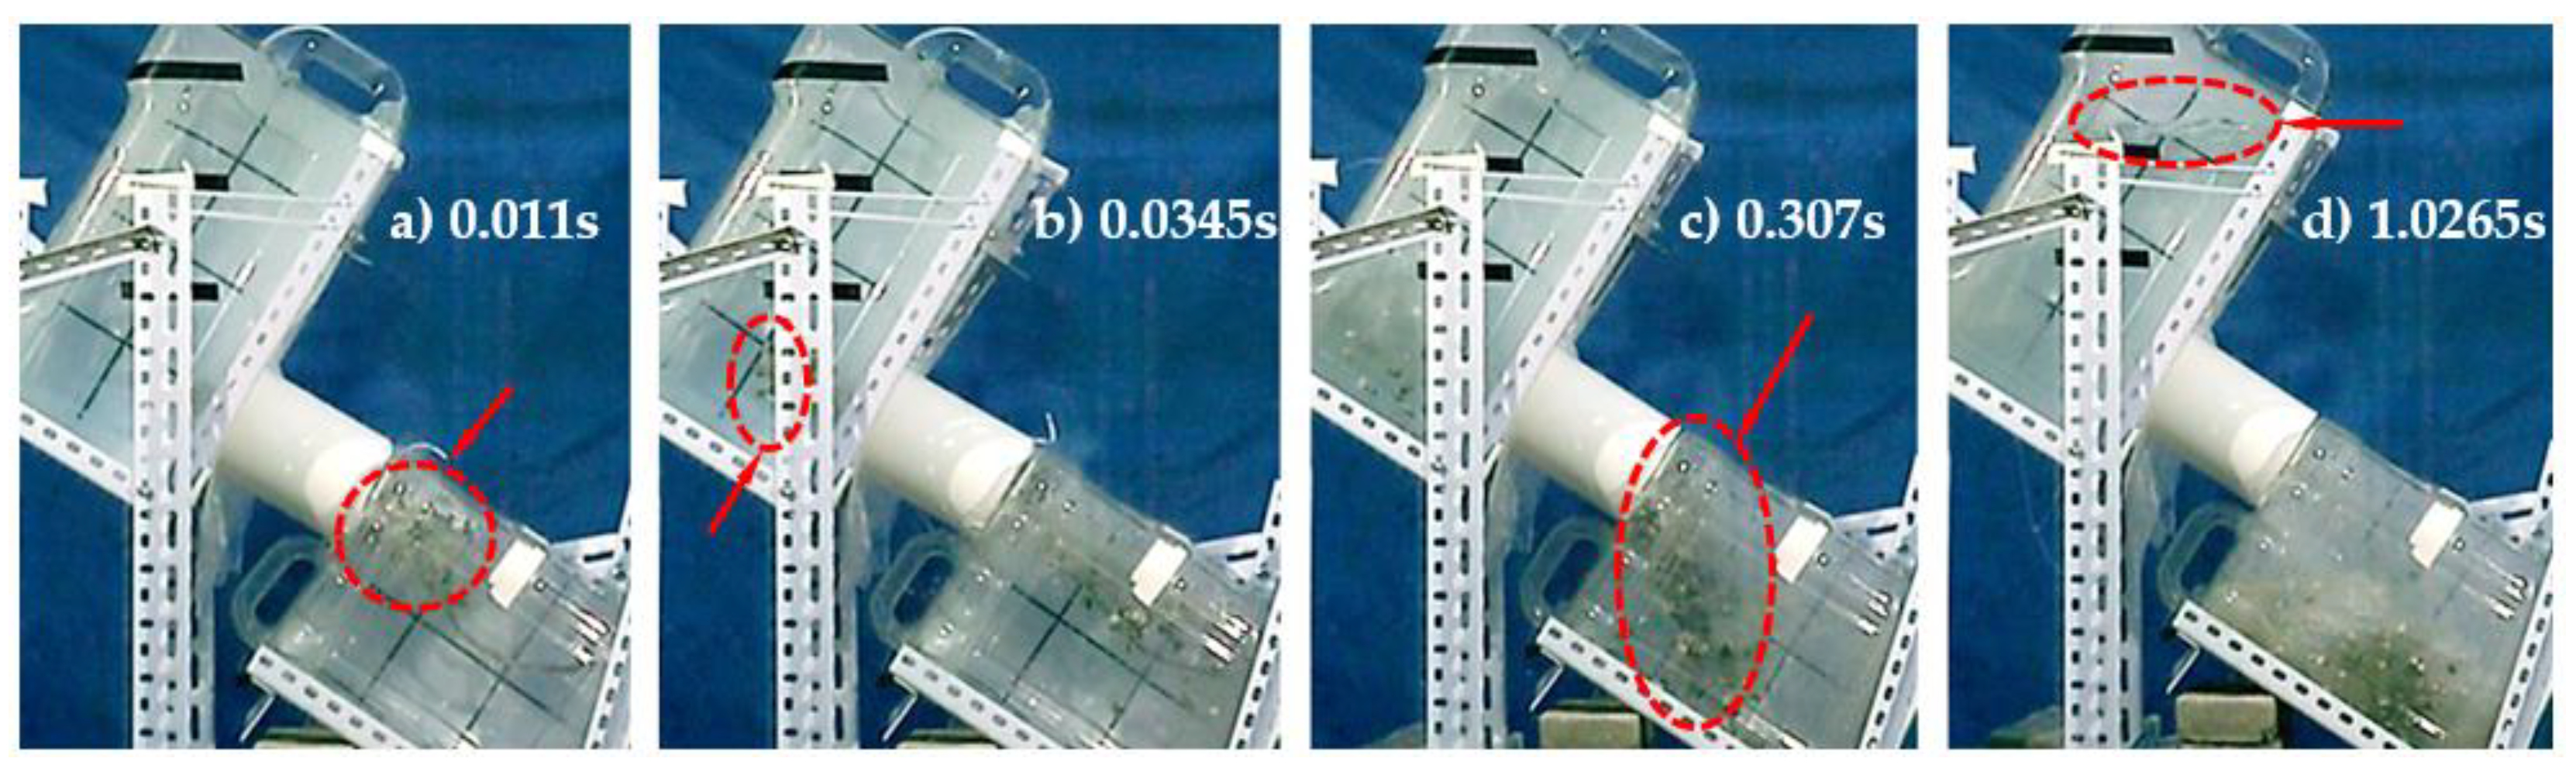
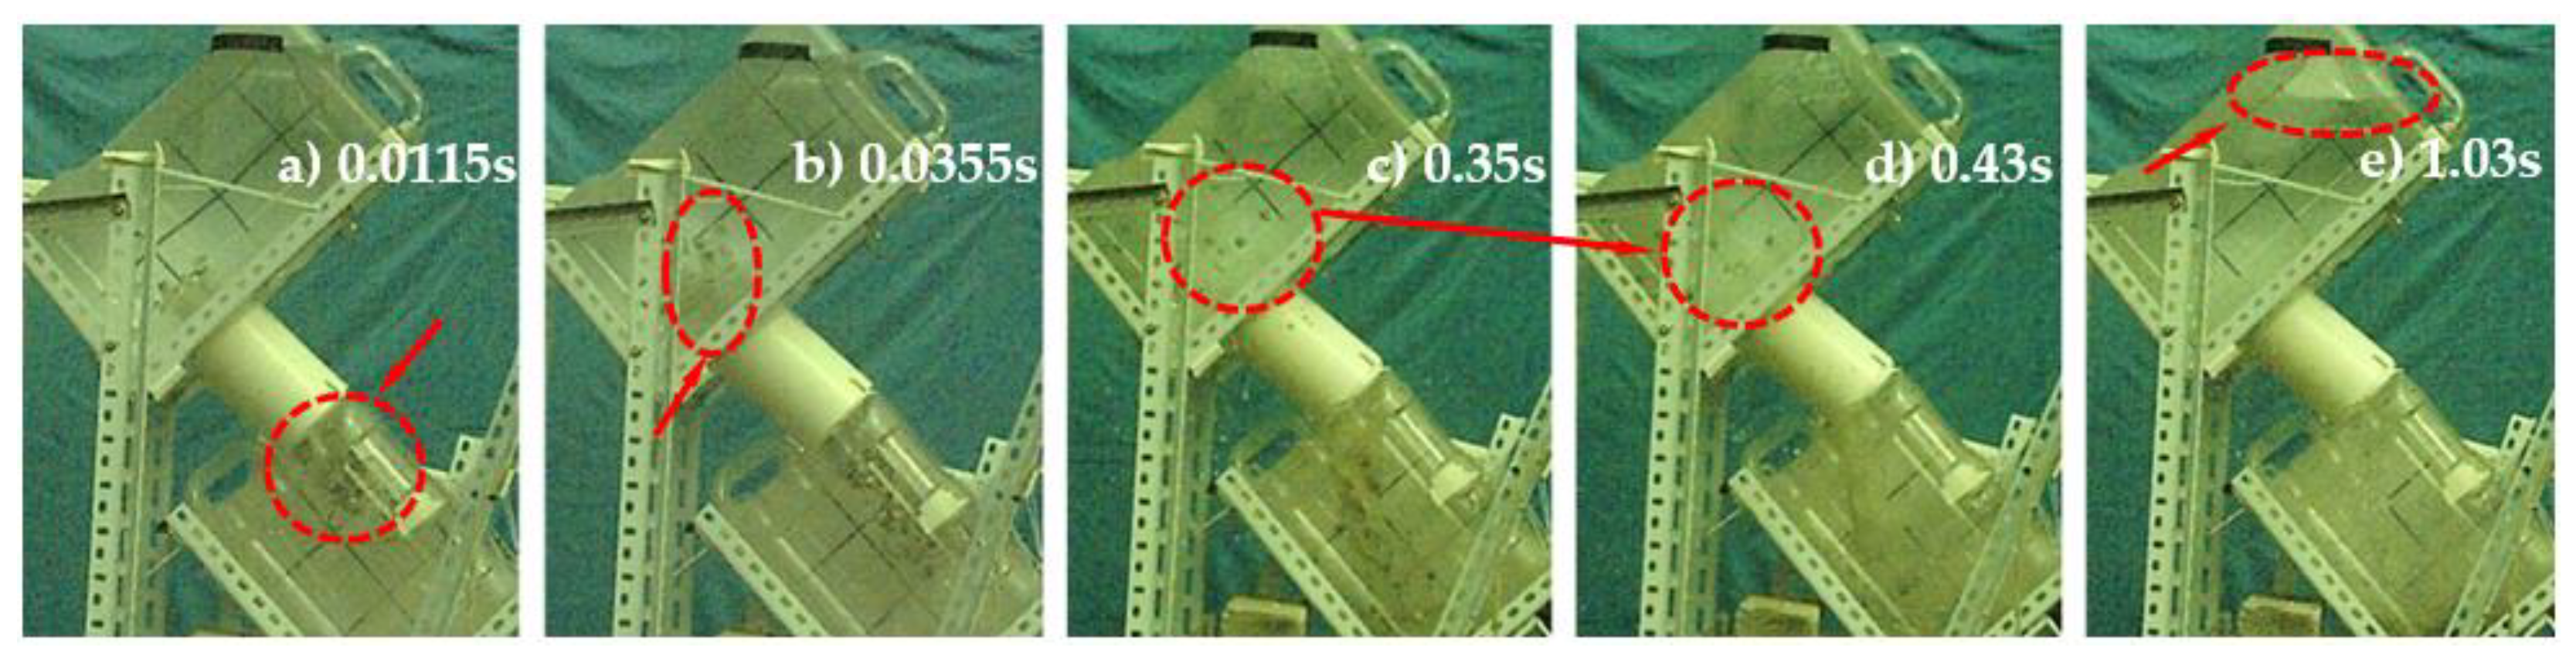
The motion of the block particles in the underwater rock-plug blasting experiments can be divided into two stages: in the first stage, the block particles were ejected from the two ends of the rock plug along its axis by the blast load; in the second stage, block particles flowed to the downstream water tank under the effect of upstream water scouring and gravity;
(2)
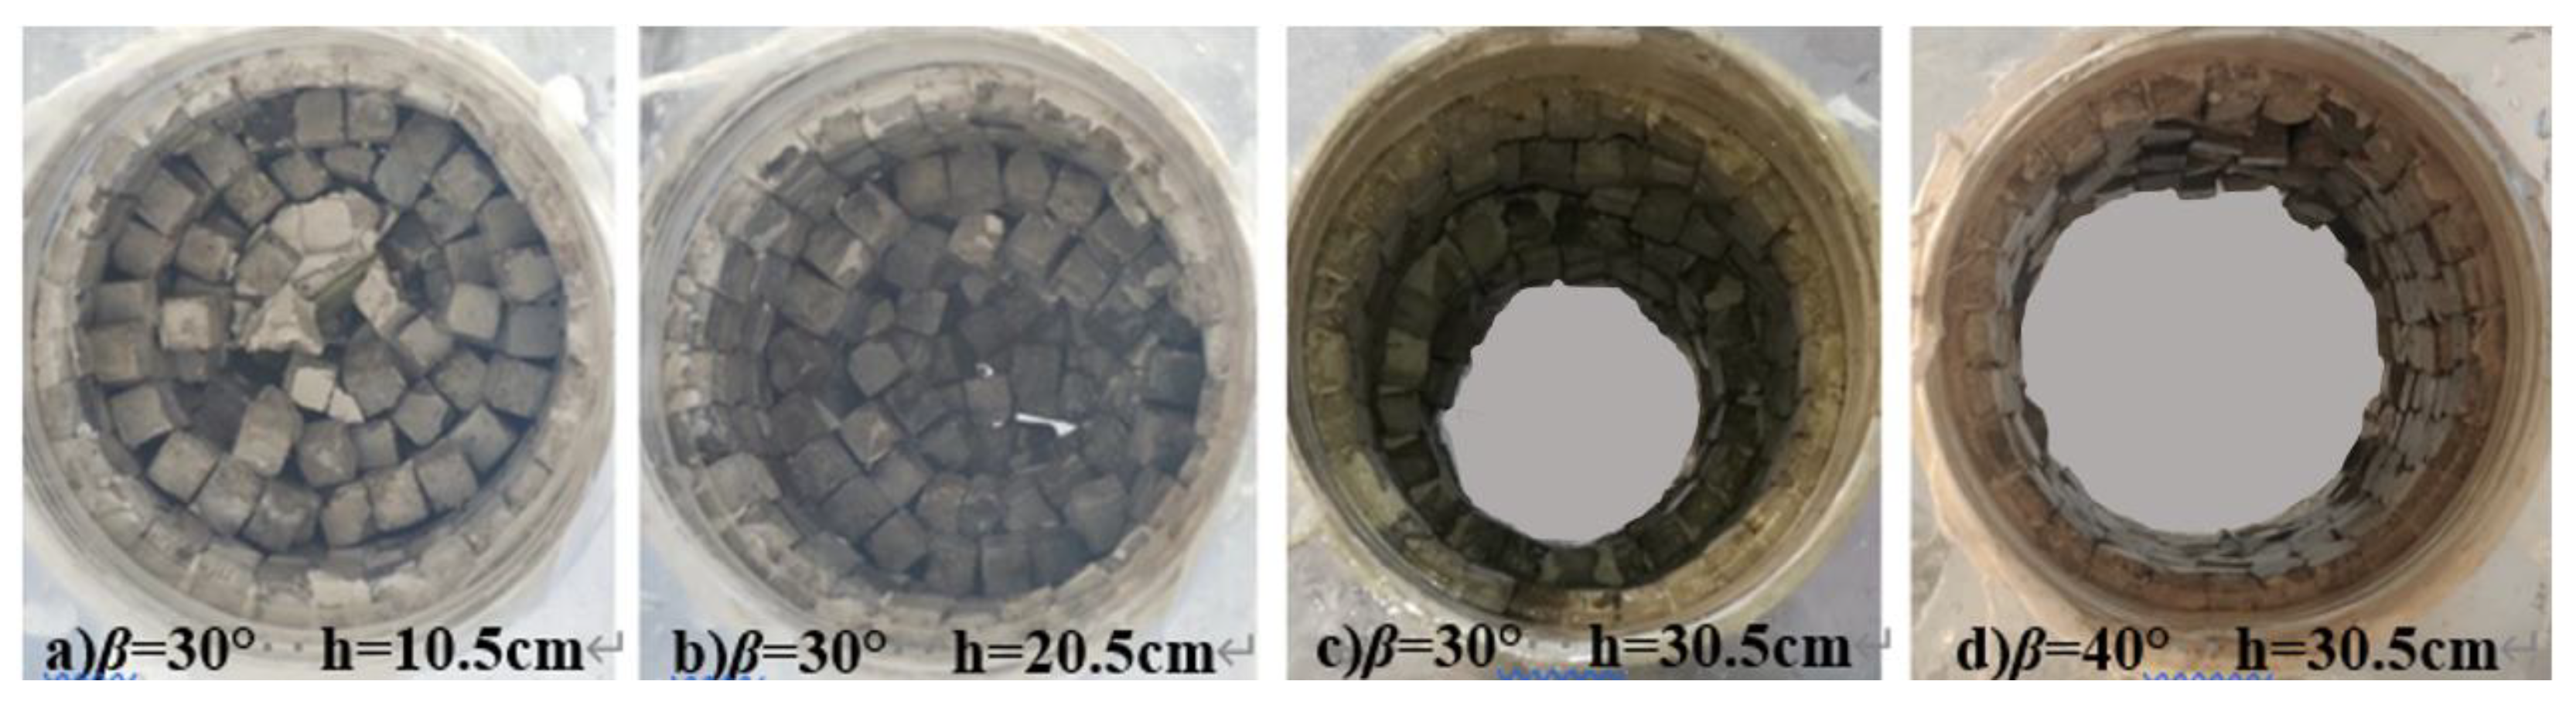
The penetration mechanism in the rock-plug blasting was obtained by combining experiments and numerical simulation. A blasting crater was formed on the downstream end face of the rock plug under the effects of the blast load due to the influences of the free face, while blocks on the upstream end face were loosened or weakly ejected under the influence of the water pressure. Finally, the blasted blocks flowed to the block pit under the effects of the scouring of the fluid flow and gravity, forming a through-going channel. With the increase in the head of water, a better penetration effect for the rock-plug sample was determined;
(3)
The numerical calculation results based on the Fluent–EDEM coupling method were consistent with the experimental results in terms of the blasting effect and the velocity curve of the block particles. The change in the numerically calculated bonding force followed a similar trend as the theoretical drag force, indicating that the coupling method is feasible and accurate for the simulation of the interaction between particles and water during underwater rock-plug blasting.

Author Contributions

Conceptualization, methodology, funding acquisition, project administration, formal analysis, L.W.; conceptualization, data curation, formal analysis, investigation, writing—original draft, Z.L.; funding acquisition, project administration, M.C.; investigation, writing—review and editing, J.Z. All authors have read and agreed to the published version of the manuscript.

Funding

This research was funded by Chinese National Natural Science Foundation, grant numbers 51909196 and 51979205.

Institutional Review Board Statement

Not applicable.

Informed Consent Statement

Not applicable.

Data Availability Statement

All data generated or analyzed during this study are included in the published article.

Acknowledgments

The authors wish to express their thanks to all supporters and especially to the laboratory “Engineering Technology Research Center in Intelligent Blasting of Hubei Province” for providing experimental equipment.

Conflicts of Interest

The authors declare no conflict of interest.

References

  1. Su, J.L. Technological development of underwater rock-plug blasting. Water Resour. Hydropower Eng. 2019, 50, 110–115. [Google Scholar]
  2. Hu, Y.G.; Wu, X.X.; Zhao, G.; Liu, M.; Zhou, X.; Li, W. Through mechanism and experimental study of rock-plug blasting with single and double free faces. Chin. J. Rock Mech. Eng. 2016, 35, 3716–3724. [Google Scholar]
  3. Chen, S.; Xu, M.J.; Sun, J.H.; Zhang, J. Hydraulic characteristics study on transient process of air cushion underwater rock plug blasting. J. Huazhong Univ. Sci. Tech. (Nat. Sci. Ed.) 2022, 50, 114–118. [Google Scholar]
  4. Feng, L.X. Technique of the Air-cushion Underwater Rock-plug Blasting and Its Application. Blasting 2006, 23, 66–77. [Google Scholar]
  5. Feng, L.X.; Tan, S.B. Field experiment study for rock-plug blasting of Xianghongdian Pumped-storage Project. J. Yangtze River Sci. Res. Inst. 2003, s1, 58–61. [Google Scholar]
  6. Liang, X.L. Control Measurement and Results Analysis of Harmful Effects of Underwater Rock Plug Blasting. Blasting 2019, 36, 98–103. [Google Scholar]
  7. Zhao, G.; Wu, X.X.; Zhou, X.P.; Li, W.C.; Hu, Y.G.; Wu, C.Q. Key technology and application of rock plug drilling blasting under deep water condition. Eng. Blasting 2016, 22, 13–17. [Google Scholar]
  8. Shi, G.H.; Goodman, R.E. Generalization of two dimensional discontinuous deformation analysis for forward modeling. Int. J. Numer. Anal. Meth. Geomech. 1989, 13, 359–380. [Google Scholar] [CrossRef]
  9. Shi, G.H.; Goodman, R.E. Two dimensional discontinuous deformation analysis. Int. J. Numer. Anal. Meth. Geomech. 1985, 9, 541–556. [Google Scholar] [CrossRef]
  10. Li, Z.; Liu, S.; Zhang, H.; Chen, G.; Wu, W.; Zhu, H.; Zhuang, X.; Wang, W. Simulating the damage extent of unreinforced brick masonry buildings under boulder impact using three-dimensional discontinuous deformation analysis (3-D DDA). Eng. Fail. Anal. 2018, 93, 122–143. [Google Scholar] [CrossRef]
  11. Zhao, Z.Y.; Zhang, Y.; Wei, X.Y. Discontinuous deformation analysis for parallel hole cut blasting in rock mass. Anal. Discontin. Deform. New Dev. Appl. 2009, 169–176. [Google Scholar] [CrossRef]
  12. Mortazavi, A.; Katsabanis, P.D. Modelling burden size and strata dip effects on the surface blasting process. Int. J. Rock Mech. Min. Sci. 2001, 38, 481–498. [Google Scholar] [CrossRef]
  13. Liu, M.B.; Liu, G.R.; Lam, K.Y.; Zong, Z. Smoothed particle hydrodynamics for numerical simulation of underwater explosion. Comput. Mech. 2003, 30, 106–118. [Google Scholar] [CrossRef]
  14. Zong, Z.; Zhao, Y.J.; Li, H.T. A numerical study of whole ship structural damage resulting from close-in underwater explosion shock. Mar. Struct. 2013, 31, 24–43. [Google Scholar] [CrossRef]
  15. Fourey, G.; Hermange, C.; Le, D.T.; Oger, G. An efficient FSI coupling strategy between Smoothed Particle Hydrodynamics and Finite Element methods. Comput. Phys. Commun. 2017, 217, 66–81. [Google Scholar] [CrossRef]
  16. Ming, F.R.; Zhang, A.M.; Xue, Y.Z.; Wang, S. Damage characteristics of ship structures subjected to shockwaves of underwater contact explosions. Ocean Eng. 2016, 117, 359–382. [Google Scholar] [CrossRef]
  17. Wang, J.; Zhang, Y.; Qin, Z.; Song, S.; Lin, P. Analysis method of water inrush for tunnels with damaged water-resisting rock mass based on finite element method-smooth particle hydrodynamics coupling. Comput. Geotech. 2020, 126, 103725. [Google Scholar] [CrossRef]
  18. Liu, M.B.; Zhang, Z.L. Smoothed particle hydrodynamics (SPH) for modeling fluid-structure interactions. Sci. China Phys. Mech. 2019, 62, 984701. [Google Scholar] [CrossRef]
  19. Su, D.D.; Yan, P.; Lu, W.B.; Chen, M. Prediction of Muckpile Profile for Open Bench Blasting with PFC. Blasting 2012, 29, 35–41. [Google Scholar]
  20. Zhang, Z.H.; Gao, W.L.; Li, K.P.; Li, B. Numerical simulation of rock mass blasting using particle flow code and particle expansion loading algorithm. Simul. Model Pract. Theory 2020, 104, 102119. [Google Scholar] [CrossRef]
  21. Leng, Z.D.; Liu, L.; Zhou, W.X.; Zhou, G.S.; Du, H.S. Numerical investigation of initiation points on muckpile profile in bench blasting. Blasting 2018, 35, 50–55+100. [Google Scholar]
  22. Yan, P.; Zhou, W.X.; Lu, W.B.; Chen, M.; Zhou, C. Simulation of bench blasting considering fragmentation size distribution. Int. J. Impact Eng. 2016, 90, 132–145. [Google Scholar] [CrossRef]
  23. Lei, X.L.; Liao, Y.T.; Li, Z.D.; Zhang, W.; Cao, X.; Li, S.; Liao, Q. Effects of seed layer thickness on seed filling performance of seed feeding device for rapeseed and wheat. Trans. Chin. Soc. Agric. Eng. 2016, 32, 11–19. [Google Scholar]
  24. Lei, X.L.; Liao, Y.T.; Liao, Q.X. Simulation of seed motion in seed feeding device with DEM-CFD coupling approach for rapeseed and wheat. Comput. Electron. Agr. 2016, 131, 29–39. [Google Scholar] [CrossRef]
  25. Salikov, V.; Antonyuk, S.; Heinrich, S.; Sutkar, V.S.; Deen, N.G.; Kuipers, J. Characterization and CFD-DEM modelling of a prismatic spouted bed. Powder Technol. 2015, 270, 622–636. [Google Scholar] [CrossRef] [Green Version]
  26. Li, H.C.; Li, Y.M.; Gao, F.; Zhao, Z.; Xu, L. CFD–DEM simulation of material motion in air-and-screen cleaning device. Comput. Electron. Agric. 2012, 88, 111–119. [Google Scholar] [CrossRef]
  27. Dai, Y.; Zhang, Y.; Li, X. Numerical and experimental investigations on pipeline internal solid-liquid mixed fluid for deep ocean mining. Ocean Eng. 2020, 220, 108411. [Google Scholar] [CrossRef]
  28. Duan, X.; Shi, B.H.; Wang, J.A.; Song, S.; Liu, H.; Li, X.; Chen, Y.; Liao, Q.; Gong, J.; Chen, S.; et al. Simulation of the hydrate blockage process in a water-dominated system via the CFD-DEM method. J. Nat. Gas Sci. Eng. 2021, 96, 104241. [Google Scholar] [CrossRef]
  29. He, Y.; Bayly, A.E.; Hassanpour, A. Coupling CFD-DEM with dynamic meshing: A new approach for fluid-structure interaction in particle-fluid flows. Powder Technol. 2018, 325, 620–631. [Google Scholar] [CrossRef]
  30. Fu, Y.B.; Zeng, D.Q.; Xiong, H.; Li, X.; Chen, Y. Seepage effect on failure mechanisms of the underwater tunnel face via CFD–DEM coupling. Comput. Geotech. 2022, 146, 104591. [Google Scholar] [CrossRef]
  31. Yan, W.S.; Cui, W.; Qi, L. Simulation of underwater concrete movement in flowing water using DEM-CFD coupling method. Constr. Build Mater. 2022, 319, 126134. [Google Scholar] [CrossRef]
  32. Peng, Y.X.; Zhang, A.M.; Ming, F.R. Numerical simulation of structural damage subjected to the near-field underwater explosion based on SPH and RKPM. Ocean Eng. 2021, 222, 108576. [Google Scholar] [CrossRef]
  33. Jacob, B.; Drawert, B.; Yi, T.M.; Petzold, L. An arbitrary Lagrangian Eulerian smoothed particle hydrodynamics (ALE-SPH) method with a boundary volume fraction formulation for fluid-structure interaction. Eng. Anal. Bound Elem. 2021, 128, 274–289. [Google Scholar] [CrossRef]
  34. Li, X.; Zhao, J. Dam-break of mixtures consisting of non-Newtonian liquids and granular particles. Powder Technol. 2018, 338, 493–505. [Google Scholar] [CrossRef]
  35. Li, X.; Zhao, J. A unified CFD-DEM approach for modeling of debris flow impacts on flexible barriers. Int. J. Numer. Anal. Methods Geomech. 2018, 42, 1643–1670. [Google Scholar]
  36. Zhao, T. Investigation of Landslide-induced Debris Flows by the DEM and CFD; University of Oxford: Oxford, UK, 2014. [Google Scholar]
  37. Zhao, J.; Shan, T. Coupled CFD–DEM simulation of fluid–particle interaction in geomechanics. Powder Technol. 2013, 239, 248–258. [Google Scholar] [CrossRef]
  38. Wang, Y.H.; Gu, S.L.; Zhang, Y.Y.; Yue, K.Z. Numerical Study on the Formation Process of Sandpile Particles in Different Density Granular Materials Based on DEM Method. Chin. Qtly. Mech. 2017, 38, 734–740. [Google Scholar]
  39. Song, S.L.; Tang, Z.H.; Zheng, X.; Liu, J.; Meng, X.; Liang, Y. Calibration of the discrete element parameters for the soil model of cotton field after plowing in Xinjiang of China. Trans. Chin. Soc. Agric. Eng. 2021, 37, 63–70. [Google Scholar]
  40. Wei, A.Q. Study on Force Transfer Characteristics of Granular Ballast of CWR on Ballasted Track; Southwest Jiaotong University: Chengdu, China, 2016. [Google Scholar]
Figure 1. Schematic diagram of rock-plug blasting.
Applsci 13 00348 g001
Figure 2. Experimental device and samples.
Applsci 13 00348 g002
Figure 3. Preparation of explosives.
Applsci 13 00348 g003
Figure 4. Test system.
Applsci 13 00348 g004
Figure 5. Process for experimental case 1 (β = 30°, h = 105 mm).
Applsci 13 00348 g005
Figure 6. Process for experimental case 2 (β = 30°, h = 205 mm).
Applsci 13 00348 g006
Figure 7. Process for experimental case 3 (β = 30°, h = 305 mm).
Applsci 13 00348 g007
Figure 8. Process for experimental case 4 (β = 40°, h = 305 mm).
Applsci 13 00348 g008
Figure 9. The effects of rock-plug blasting with different opening angles and heads of water.
Applsci 13 00348 g009
Figure 10. Stress diagram for the rock plug.
Applsci 13 00348 g010
Figure 11. Schematic diagram of the Hertz–Mindlin contact model.
Applsci 13 00348 g011
Figure 12. Fluent–EDEM coupling calculation process.
Applsci 13 00348 g012
Figure 13. Calculation models for the numerical simulation.
Applsci 13 00348 g013
Figure 14. The test and simulation of the angle of repose.
Applsci 13 00348 g014
Figure 15. The simulation results under four conditions: (a) β = 30°, h = 105 mm; (b) β = 30°, h = 205 mm; (c) β = 30°, h = 305 mm; (d) β = 40°, h = 305 mm.
Applsci 13 00348 g015
Figure 16. Comparison between simulation results and experimental results: (a) β = 30°, h = 105 mm; (b) β = 30°, h = 205 mm; (c) β = 30°, h = 305 mm.
Applsci 13 00348 g016
Figure 17. Time histories of particle velocity in the upstream water tank: (a) β = 30°, h = 205 mm; (b) β = 40°, h = 305 mm.
Applsci 13 00348 g017
Figure 18. Streamline distribution diagram (β = 30°, h = 305 mm).
Applsci 13 00348 g018
Table 1. Mechanical parameters of concrete.
Mass (kg)Density (kg/m3)Compressive Strength (MPa)Young’s Modulus (GPa)Poisson’s RatioLongitudinal Wave Velocity (m/s)
0.4138210732.3321.20.252234
Table 2. Experimental conditions for underwater rock-plug blasting.
Serial NumberThe Opening Angle of the Rock Plug β/°The Head of Water h/mm
Case 130105
Case 230205
Case 330305
Case 440305
Table 3. Parameters of the EDEM model.
Material ParametersThe Wall of the Water TankBlocks
Density (kg/m3)13802100
Young’s modulus (GPa)3.221.2
Poisson’s ratio0.250.25
Coefficient of recovery0.150.12
Coefficient of static friction0.10.5
Coefficient of rolling friction0.010.01
Disclaimer/Publisher’s Note: The statements, opinions and data contained in all publications are solely those of the individual author(s) and contributor(s) and not of MDPI and/or the editor(s). MDPI and/or the editor(s) disclaim responsibility for any injury to people or property resulting from any ideas, methods, instructions or products referred to in the content.

