Article

Impact of Dataset and Model Parameters on Machine Learning Performance for the Detection of GPS Spoofing Attacks on Unmanned Aerial Vehicles

by
Tala Talaei Khoei
1,*,
Shereen Ismail
1,
Khair Al Shamaileh
2,
Vijay Kumar Devabhaktuni
3 and
Naima Kaabouch
1
1
School of Electrical Engineering and Computer Science, University of North Dakota, Grand Forks, ND 58202, USA
2
Electrical and Computer Engineering Department, Purdue University Northwest, Hammond, IN 46323, USA
3
Electrical and Computer Engineering Department, The University of Maine, Orono, ME 04469, USA
*
Author to whom correspondence should be addressed.
Appl. Sci. 2023, 13(1), 383; https://doi.org/10.3390/app13010383
Submission received: 4 November 2022 / Revised: 5 December 2022 / Accepted: 13 December 2022 / Published: 28 December 2022

Abstract

:
GPS spoofing attacks are a severe threat to unmanned aerial vehicles. These attacks manipulate the true state of the unmanned aerial vehicles, potentially misleading the system without raising alarms. Several techniques, including machine learning, have been proposed to detect these attacks. Most of the studies applied machine learning models without identifying the best hyperparameters, using feature selection and importance techniques, and ensuring that the used dataset is unbiased and balanced. However, no current studies have discussed the impact of model parameters and dataset characteristics on the performance of machine learning models; therefore, this paper fills this gap by evaluating the impact of hyperparameters, regularization parameters, dataset size, correlated features, and imbalanced datasets on the performance of six most commonly known machine learning techniques. These models are Classification and Regression Decision Tree, Artificial Neural Network, Random Forest, Logistic Regression, Gaussian Naïve Bayes, and Support Vector Machine. Thirteen features extracted from legitimate and simulated GPS attack signals are used to perform this investigation. The evaluation was performed in terms of four metrics: accuracy, probability of misdetection, probability of false alarm, and probability of detection. The results indicate that hyperparameters, regularization parameters, correlated features, dataset size, and imbalanced datasets adversely affect a machine learning model’s performance. The results also show that the Classification and Regression Decision Tree classifier has an accuracy of 99.99%, a probability of detection of 99.98%, a probability of misdetection of 0.2%, and a probability of false alarm of 1.005%, after removing correlated features and using tuned parameters in a balanced dataset. Random Forest can achieve an accuracy of 99.94%, a probability of detection of 99.6%, a probability of misdetection of 0.4%, and a probability of false alarm of 1.01% in similar conditions.

1. Introduction

Unmanned Aerial Vehicles (UAVs) depend primarily on the Global Navigation Satellite System (GNSS) for precise navigation and positioning, which is necessary for guidance and control during flights. Technical improvements in UAV automation and control have largely increased in the last few decades; however, cybersecurity has received less attention despite many reported cyberattacks. One of the most dangerous threats is Global Positioning System (GPS) spoofing attacks [1]. This type of attack occurs when a malicious user broadcasts false GPS signals that are difficult to detect [2,3]. These attacks significantly affect the targeted UAV receiver, especially because the vehicle may remain unaware of the attack for a prolonged period of time since spoofing gives the attacker virtual control [4,5].
Numerous studies have been conducted to detect, identify, and mitigate attacks on UAVs. Table 1 compares existing machine learning techniques with respect to the dataset and model parameters. The authors of [6] proposed a technique for classifying GPS spoofing attacks using artificial neural networks (ANNs) with a benchmark that includes signal-to-noise ratio, pseudo-range, and Doppler shift. The authors of [7] proposed using Linear Regression and Long Short-Term Memory to detect GPS spoofing attacks and evaluated their proposed model using time steps and neurons. The authors of [8] used the least absolute shrinkage and selector operator to detect and classify GPS spoofing attacks on UAVs. The authors of [9] proposed a k-learning-based approach and evaluated its performance in terms of several k values. An algorithm based on Support Vector Machine (SVM) was proposed by the authors of [10], who evaluated its performance using the evaluation window and time width. The authors of [11] proposed a technique, Long Short-Term Memory, using a dataset of features such as flight speed, altitude, and range.
The authors of [12] also applied SVM to detect GPS spoofing attacks by conducting a correlation analysis and evaluating their model based on accuracy. The authors of [13] used a deep learning (DL)-based method, DeepSIM, to detect GPS spoofing attacks by employing a camera and comparing historical GPS images to incoming GPS images using image processing techniques. The authors of [14] proposed two dynamic selection approaches based on ten commonly used ML models. The authors of [2] compared several tree-based ML models, Extreme Gradient Boosting (XGBoost), Random Forest (RF), Gradient Boosting (GBM), and Light Gradient Boosting (LightGBM), to detect GPS spoofing attacks targeting UAVs. The authors performed a correlation analysis and used a benchmark with 13 features. The authors of [15] analyzed three types of ensemble models to detect GPS spoofing attacks targeting UAVs, including bagging, boosting, and stacking.
The authors of [16] also compared the performance of supervised and unsupervised ML models, namely Gaussian Naïve Bayes, Random Forest, Classification and Regression Decision Tree, Linear-Support Vector Machine, Logistic Regression, Principal Component Analysis, Artificial Neural Network, and Autoencoder, to detect GPS spoofing attacks. Another study [17] incorporated Support Vector Machine with K-fold cross-validation to detect GPS spoofing attacks on UAVs. The authors of [18] proposed a semantic-based detection technique, CONSDET, to support onboard GPS spoofing attack detection. The authors of [19] proposed a resilient state estimation framework that combines Kalman filter and Inertial Measurement Unit to address UAV sensor drift issues. The authors of [20] provided a strategy, 5G-assisted UAV position monitoring, and an anti-GPS spoofing system to detect live GPS spoofing attack detection. This strategy involves the uplink receiving signal strength measurements used to detect these attacks. The authors of [21] used a vision-based approach, combining UAV’s sensors, camera, and Inertial Measurement Unit to detect GPS spoofing attacks on small UAVs. Another study [22] used a vision-based approach, employing Visual Odometry methods to detect GPS spoofing attacks on UAVs. The authors compared the extracted images with the flight trajectory information to detect and classify spoofed signals.
Most research on this subject has focused on using specific ML and DL models without addressing the impact of dataset characteristics and model parameters on model performance (Table 1). Multiple issues can hinder the development of feasible models for the problem at hand. For instance, classification algorithms can perform poorly and have low generalization ability when trained on small or biased datasets. The classification problem becomes more challenging when working with unreliable and biased data, such as datasets containing correlated features. Data reflecting GPS spoofing attacks are challenging to acquire and are limited; therefore, it is essential to find solutions that improve the quality of the corresponding dataset instead of focusing solely on increasing model accuracy. Investigating the impact of these factors on GPS spoofing detection techniques is needed to provide a consensus on best practices and create a basis for future research directions.
In this work, we investigate the key factors that impact the performance of the most widely used AI models, including dataset characteristics and model parameters such as feature correlation, class imbalance, dataset size, hyperparameter tuning, and regularization (Figure 1). The investigated models in this study are SVM, ANN, RF, Gaussian Naïve Bayes (GNB), Classification, Regression Decision Tree (CART), and Logistic Regression (LR). We used a benchmark consisting of 13 features [15] for training and testing the models. The performance of the models are evaluated on the basis of accuracy (ACC), probability of false alarm (Pfa), probability of detection (PD), and probability of misdetection (Pmd).
The main contributions of this paper are:
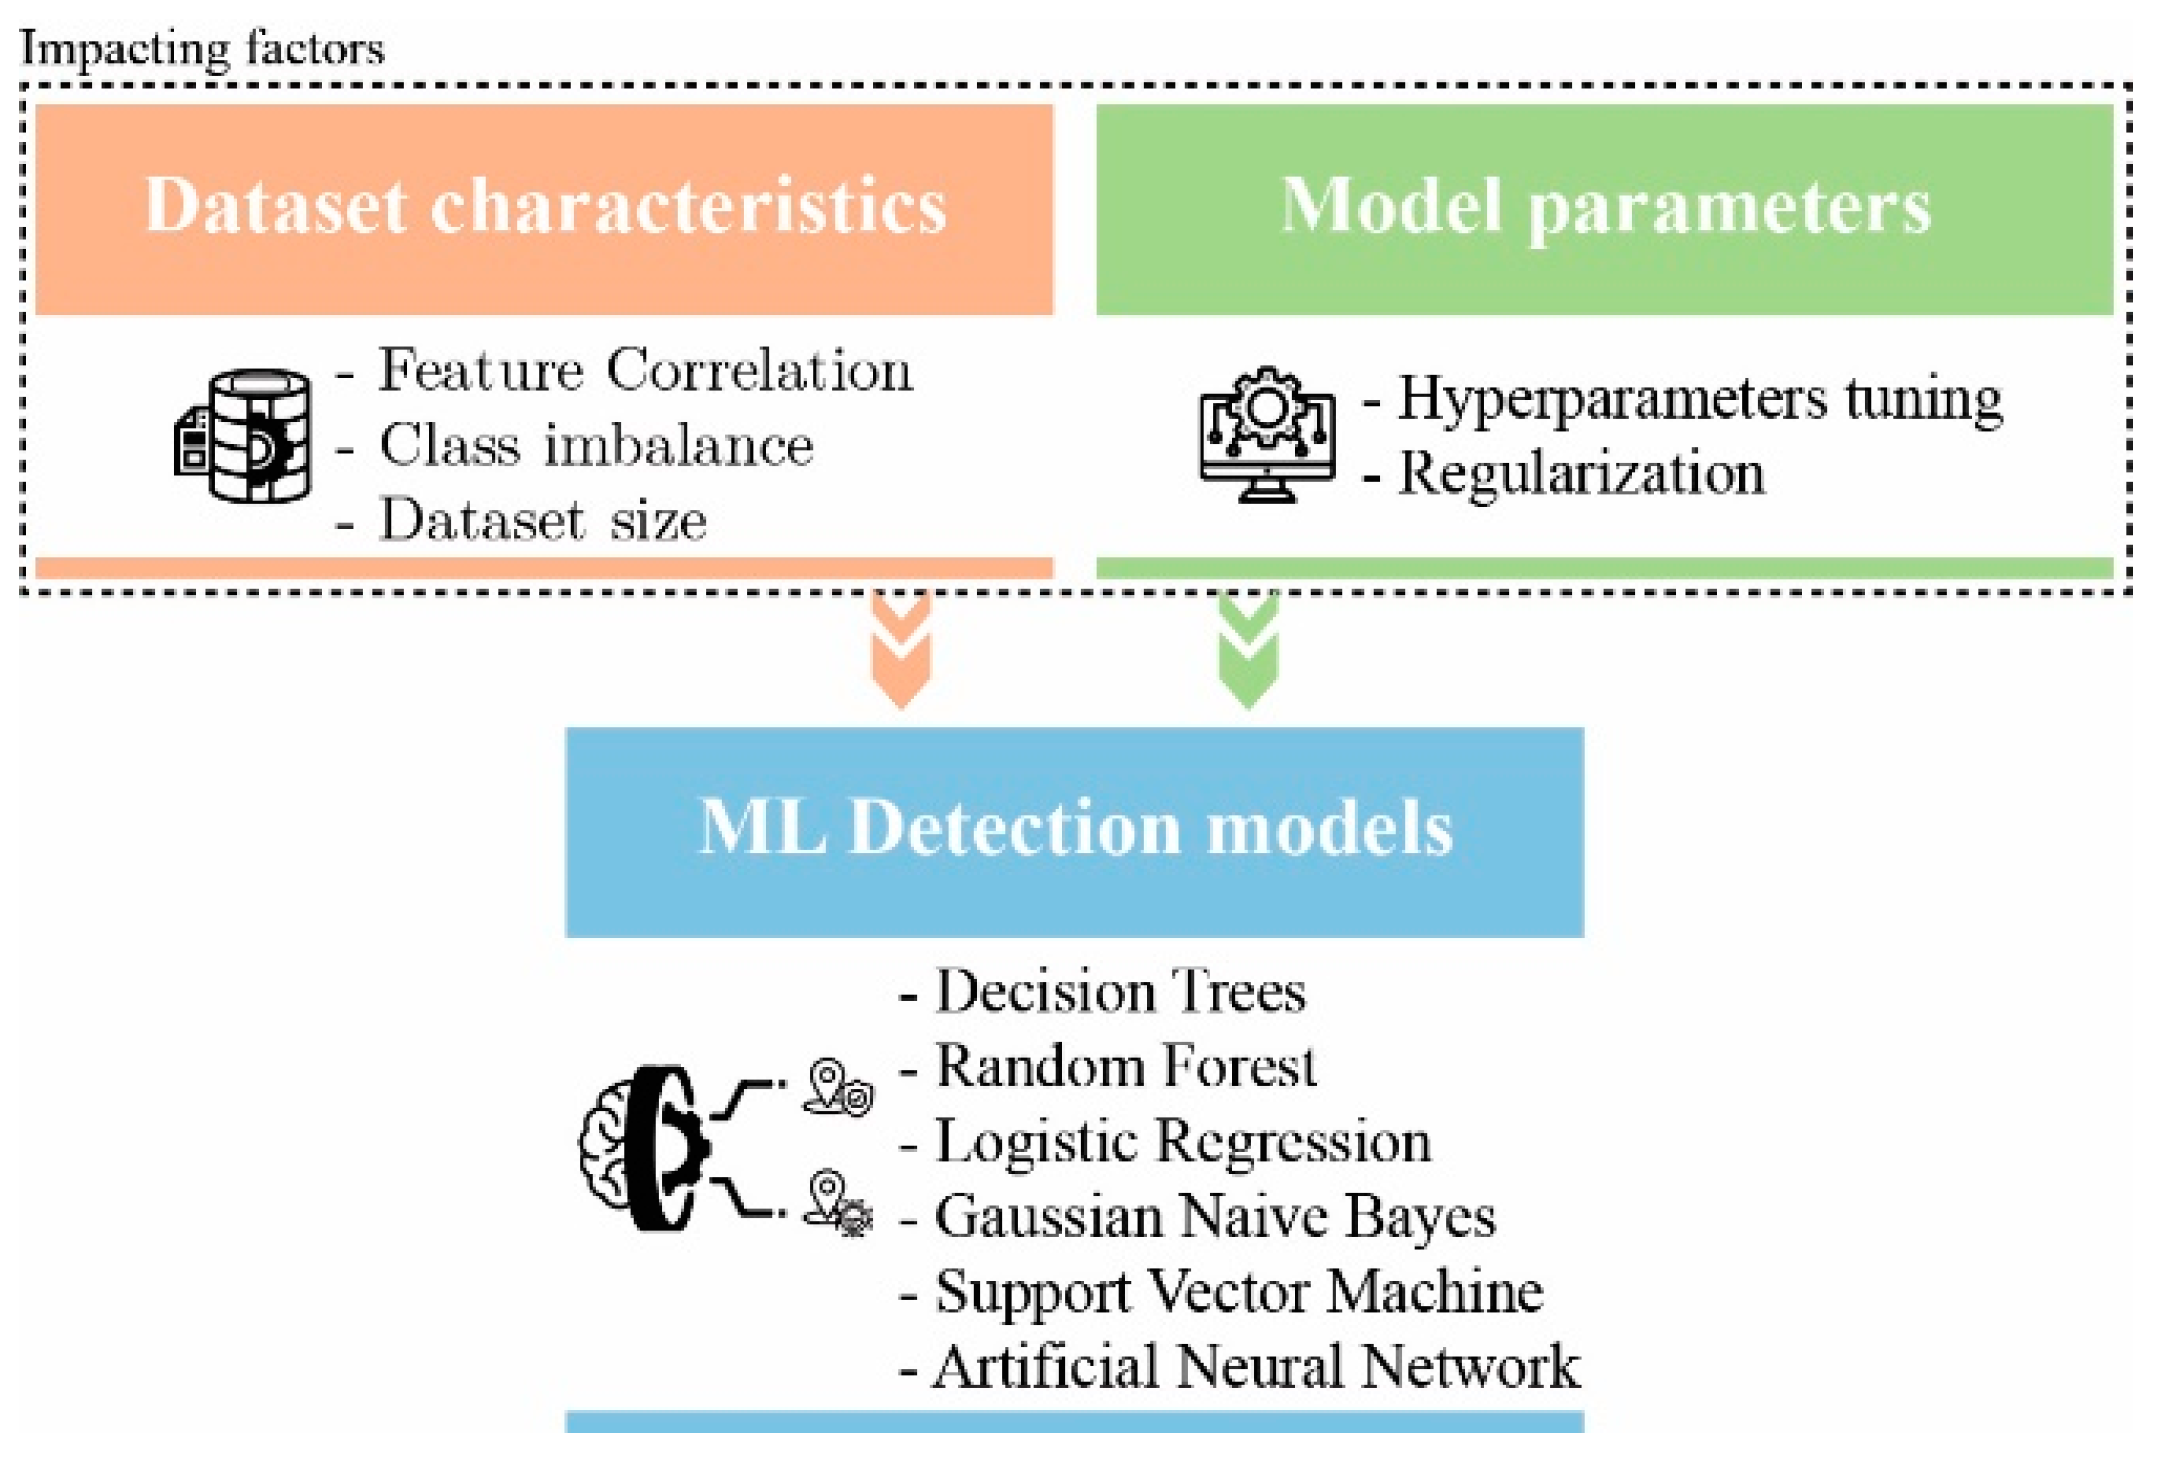
  • Evaluating the impact of hyperparameter tuning and regularization parameters on the performance of ML techniques to detect GPS spoofing attacks targeting UAVs,
  • Evaluating the impact of correlated and uncorrelated features on ML model performance,
  • Investigating the impact of correlated features on ML model performance with respect to dataset size,
  • Examining the impact of the percentage of malicious samples in the dataset on ML model performance.
The remainder of this paper is organized as follows: Section 2 indicates the used materials and methodology, Section 3 presents and discusses the simulation results, and the conclusion and future work recommendations are highlighted in Section 4.

2. Methodology

This section briefly discusses the study’s main components: the dataset, data preprocessing and feature selection techniques, classification techniques, and the hyperparameter tuning approach.
Figure 2 illustrates the process of the proposed approach. This process comprises several phases: dataset building, dataset assessment, model training, and model evaluation. Authentic signals were collected from real-time experiments and malicious signals generated by simulating 3 types of GPS spoofing attacks [2]. We performed two steps during data assessment: data preprocessing and feature selection, then applied several techniques to clean the input data, perform data transformation, and encode the input data. We used a feature correlation technique, Pearson’s Correlation Coefficient, and a feature importance technique known as the Chi-Squared Test.
These techniques led to the identification of correlated features of low importance and their removal from the dataset. Bayesian Optimization was used during the hyperparameter tuning phase to determine each model’s best parameters for training, guaranteeing optimal performance. This study targeted six well-known and frequently used classification algorithms: SVM, ANN, RF, GNB, CART, and LR. We evaluated the selected models in terms of ACC, PD, Pfa, and Pmd in the last phase.

2.1. Dataset Assessment

The dataset used in this study was previously developed and described in [2]. This dataset contains legitimate and spoofed GPS samples from three GPS spoofing attacks: simplistic, intermediate, and sophisticated. These attacks can affect features such as Carrier Doppler and Carrier to Noise. The corresponding dataset consists of 14,000 samples; 50% normal signals and 50% spoofed. It includes 13 features (Table 2).

2.1.1. Data Pre-Processing

The dataset used in this study is balanced and does not contain any noisy or missing values. We used two preprocessing methods: normalization and standardization. The normalization process rescales the values to fall between zero and one [23]. We applied a power transformer scalar using the Yeo–Johnson transformation technique [24]. This approach transforms the data to fit a Gaussian distribution and handles zero, positive, and negative data values. Other power transformation methods, such as the Box–Cox transform, are applicable only for positive values. The standardization process rescales the sample data’s feature values to provide a mean of zero and a standard deviation of one.

2.1.2. Feature Selection

Identifying correlated features during the data preprocessing process is essential since they indicate a strong relationship between two dependents. This study used a correlation technique, Pearson’s Correlation [24,25], to predict how well the variables are correlated. This technique calculates a score that quantifies the strength of a linear relationship between x and y. A positive score represents a positive linear correlation, while a negative score indicates a negative correlation. This coefficient, P, is calculated using the following:
P = i = 1 n ( x i   x ¯ ) ( y i   y ¯ ) i = 1 n ( x i   x ¯   ) 2   ( y i   y ¯ ) 2  
where P is the correlation coefficient, x i   is the value of the x-variable for sample i, x ¯ is the mean of the values of the x-variable for sample i, y i   is the value of the y-variable for sample i, y ¯ is the mean of the values of the y-variable for sample i, n is the number of samples in the dataset, and i is the index of a sample. If P is less than 0.39, it is considered a weak correlation between the two given variables; however, it is a moderate correlation if P is between 0.40 and 0.89. If P is greater than 0.9, then the those two variables are highly correlated.
A feature importance approach, the Chi-Squared Test [25], was used to estimate each feature significance. This technique is widely used to test the independence of two variables: O and E. It computes how the expected and observed variables deviate from each other. The Chi-Squared Test score is given by:
X c   2 = ( O i E i ) 2 E i
where c is the degree of freedom, O i denotes the observed value, and E i is the expected value. The degree of freedom is a statistical measure that indicates the number of samples, or the number of control points, that can be used in the computation. This value can guarantee the test’s validity when comparing the observed and expected values to determine whether a particular hypothesis is correct. Higher parameter values indicate a more reliable classification decision, which also strongly affects the related ACC.

2.2. Classification Techniques

The machine learning process begins by feeding a training set to an algorithm so it can learn to categorize data into a given number of classes or labels. The six ML models are as follows.
RF: a tree-based algorithm commonly used as a supervised machine learning technique for regression and classification problems. This model generates several decision trees on various samples. Every decision tree in the forest can be applied for a majority vote of the class output. The class with the highest votes becomes the model’s predicted class. One of the most important aspects of this classifier is its ability to handle continuous and categorical variables for regression or classification problems [26].
ANN: a supervised neural network consisting of three layers: input, hidden, and output. This neural network uses backpropagation as a learning technique for training, testing, and validating data. This function, the gradient of the loss function, can be computed using the weights of every node, one layer at a time, iterating backward from the last layer to prevent redundant computations in the chain rule. An ANN can employ non-linear activation functions, distinguishing it from linear perceptron. This model is sensitive to feature scaling and is a non-convex function with different random weight initializations [27]. Figure 2 provides a schematic overview of this model.
SVM: a technique that can find a hyperplane in N-dimensional space, where N is the number of input features that can divide the data points into several classes. It is a complex algorithm that can achieve high ACC while preventing over-fitting. The training instances used for the prediction process are selected using a kernel function. Linear SVM, which employs a linear kernel, is faster than non-linear SVM for multi-class data [28].
GNB: a machine learning technique based on the Bayesian Theorem that classifies data observations into one of the pre-defined sets of classes using the information provided by attribute variables. GNB classification suffers from conditional independence. This classifier assumes that attribute values have a Gaussian distribution given the class label [29]. For example, suppose that attribute I is continuous with a mean μ c , i , a variance σ i , c 2 , and belongs to the class label c. The probability of observing the value x i in attribute i given the class c is computed using Equation (3):
p ( x i | c ) 1 2 π σ i , c 2 e ( x i μ c , i ) 2 2 σ i , c 2
LR: another powerful supervised machine learning algorithm employed for binary classification and linear regression. This algorithm works based on a logistic function (LF), defined in Equation (4), to model the probabilities for classification problems with binary outputs. This model takes a linear combination of features for the input variable X and applies a non-linear sigmoidal function as given by [30]:
L F = 1 1 + e x
CART: a nonparametric algorithm that can identify a population’s mutually exclusive and exhaustive subgroups. These subgroups consist of members that can share similar features. These features can impact the dependent variable of interest. This algorithm is one of the oldest and most basic decision tree algorithms. It generates a multi-level structure that resembles tree branches as a visual output. The class label has two options: (1) categorical, such as a classification tree, and (2) continuous, such as a regression tree [31].

2.3. Hyperparameter Tuning

ML model construction requires the careful consideration of several parameters. Hyperparameter tuning techniques allow the selection of optimal hyperparameters for a given ML algorithm. The best combination of hyperparameters can improve the learning process and achieve maximum performance. These techniques can be categorized into manual and automatic search tuning [32]. Key features are identified and set manually in the manual tuning technique; however, this does not guarantee optimal results. Automatic search tuning is a more effective solution for addressing this issue. Examples of automatic search models include random search, Bayesian Optimization, and grid search [33].
Grid and random search techniques have some limitations that do not assure the most optimal parameter combinations, such as the curse of dimensionality and unreliability when training complicated models [32,33]. Genetic algorithms suffer from other issues, such as repetitive fitness functions and insufficiency for dynamic datasets; therefore, we used the Bayesian Optimization algorithm, which is a global optimization technique for noisy black-box functions intended to achieve the best results [34]. A probabilistic function model can map the hyperparameter values to the objective, which is evaluated on a validation set [35]. This technique is based on Bayes’ Theorem, performing a search process that aims to find the maximum or minimum for the objective function [36]. Bayesian optimization is widely used for complex, noisy, and expensive objective functions in applied machine learning [37].
Hyperparameter tuning can also help mitigate model learning issues, such as overfitting. This issue can occur when a model can barely capture noise in the given dataset. A solution is to regularize the model’s parameters, which significantly decreases model variance without substantial improvement in its bias; therefore, hyperparameter tuning can effectively control the effects of bias and variance. All critical data features are preserved during this process until a specific tuning parameter is reached, at which point the model begins to lose important features, increasing its bias and likely causing underfitting [38]; therefore, the regularized parameter values must be carefully chosen. We have determined each model’s most important regularized learning parameters and investigated their performance based on selected values ranging from 0.001 to 10 to avoid these issues. The regularized learning parameters, ranges, and values were obtained from [39,40].

3. Results

Four metrics were used to evaluate model performance: ACC, PD, Pfa, and Pmd. These metrics are defined as:
ACC = T P + T N T P + T N + F P + F N   100
P D = T p T p + F N 100
P f a = F p T F + F N 100
P m d = F N T N + F P 100
where T P   defines the number of accurately predicted malicious samples, T N denotes the number of predicted normal samples, F P   is the number of falsely predicted malicious samples, and F N   is the number of falsely predicted normal samples. This work applied a 10-fold cross-validation method to train 80% of the given data and test 20% of the remaining data.
Table 3 summarizes the hyperparameter settings for the evaluated models with the best parameter values according to the Bayesian optimization technique. The regularized learning parameters determine the level of bias each model can tolerate with respect to an optimal value. We selected the degree of a correct classification parameter, such as C in SVM; a penalty parameter, alpha, in ANN; a complexity parameter, such as ccp_alpha, in RF and CART; a stable value of var_smothing in GNB; and a regularization strength parameter, C, in LR as the regularized learning parameters that play significant roles in model learning.
The results are illustrated in Figure 3, Figure 4, Figure 5, Figure 6, Figure 7 and Figure 8. Figure 3 depicts the detection model’s performance using the different values of the regularized learning parameter, r. A significant improvement for each model can be observed when using specific values. For instance, SVM reaches the highest performance at r = 8 with an ACC of 96.2%, a PD of 96.2%, a Pmd of 4.9%, and a Pfa of 6.2%. For r values higher than 8, this classifier’s performance stagnates. The ANN classifier reaches its maximum performance at r = 5 with an ACC of 99.34%, a PD of 99.4%, a Pmd of 0.6%, and a Pfa of 1.7%. This classifier also stagnates at values higher than r = 5. Other classifiers performe similarly in terms of the regularized learning parameters, excluding the GNB classifier.
The GNB classifier reaches its highest performance at r = 5 with an ACC of 91.2%, a PD of 86.16%, a Pmd of 13.84%, and a Pfa of 2.23%. The ACC of this classifier decreases slightly in the range of 0 to 0.1; however, it reaches a constant value of 84.9%. Other metrics, including PD, Pfa, and Pmd, follow similar trends. The RF classifier reaches a maximum ACC of 99.43% at r = 5 and a maximum PD of 99.6% at r = 0. This classifier also reaches a minimum Pmd of 1.8% at r = 5 and a minimum Pfa of 1.01% at r = 0.9. This classifier’s performance remains constant with higher r values. The CART classifier also reaches its maximum with an ACC of 99.9% at r = 10, a maximum PD of 99.98% at r = 0.9, a minimum with a Pmd of 0.02% at r = 10, and a Pfa of 1.005 at r = 0.9. This classifier’s performance remains constant at higher r values. The LR classifier reaches a maximum ACC of 91.2% at r = 10 and a maximum PD of 86.19% at r = 5, while reaching a minimum Pmd of 13.84% and a Pfa of 3% at r = 8. The performance of the six selected models slightly increase as the regulated parameters gradually increased; therefore, optimizing these hyperparameters can drastically improve the ML model’s performance.
Figure 4 illustrates the simulation results of the selected ML models with default and tuned parameters in terms of the four evaluation metrics. There is a modest improvement in the performance of all models after using the hyperparameters identified by the Bayesian optimization tuning technique. For instance, under the default hyperparameter values, the ANN classifier scores an ACC of 93%, a PD of 93.4%, a Pmd of 6.6%, and a Pfa of 3.37%. This classifier achieves an ACC of 99.3%, a PD of 99.4%, a Pfa of 2.01%, and a Pmd of 0.6% with the tuned values. Similarly, when the RF classifier used the default parameters, it achieves an ACC of 95.23%, a PD of 96%, a Pfa of 3.2%, and a Pmd of 4%. The model achieves an ACC of 99.89%, a PD of 99.87%, a Pfa of 1.8%, and a Pmd of 1.3% when using the tuned hyperparameters.
The GNB classifier yields an ACC of 88%, a PD of 84.44%, a Pmd of 15.56%, and a Pfa of 5.8%. The same classifier yields an ACC of 91%, a PD of 86.16%, a Pmd of 13.84%, and a Pfa of 5.8% with tuned parameters. The CART classifier has an ACC of 97%, a PD of 98.1%, a Pfa of 4.6%, and a Pmd of 1.9% with the default parameters, while the same classifier using the tuned parameters yields an ACC of 99.99%, a PD of 99.98%, a Pfa of 1.1%, and a Pmd of 0.02%. The same observations hold true for the LR classifier. This classifier yields an ACC of 89.6%, a PD of 84.4%, a Pmd of 15.6%, and a Pfa of 3.3% with the default parameters, and an ACC of 91%, a PD of 86.19%, a Pmd of 13.81%, and a Pfa of 3% with tuned parameters.
Figure 5 depicts the heatmap for the Pearson’s Correlation Coefficient and Chi-squared feature importance results. Figure 5a indicates that five pairs of features, DO and TCD, TOW and RX, PC and LC, PC and EC, and EC and LC, are highly correlated with coefficient values greater than 0.9. Figure 5b illustrates that the importance of TCD is greater than DO, RX is greater than TOW, LC is greater than PC, EC is greater than PC, and LC is greater than EC; therefore, we can keep the features with higher importance scores and remove those with lower scores. We discarded TOW, PC, and DO from the given dataset and conducted the training, testing, and validation of all models with the remaining nine features: PRN, PD, RX, PIP, PQP, TCD, C/N0, CP, and LC.
Figure 6 depicts the simulation results of the models’ performance with and without correlated features. All models with correlated features yield better results in terms of the four metrics. For instance, the models have lower ACC with the three correlated features than those without correlation. The LR classifier yields the highest difference between correlations and without correlations. This classifier has a 5.23% lower ACC without correlated features. The SVM model also achieves a 2.39% lower ACC without correlation. Other models, such as ANN, RF, GNB, and CART, have a lower ACC without correlations. The CART model exhibits the lowest difference between model ACC in terms of with and without correlation, with a 0.05% lower accuracy, while the ANN, RF, and GNB has approximately the same difference, 0.6%, after removing correlations from the given dataset.
The PD exhibits the same trends. The highest reduction in correlated feature removal is exhibited by the LR classifier, with 2.31%, whereas the CART classifier has the lowest reduction of 0.01% in the PD. The GNB classifier has a 0.09% lower PD after removing the correlated features. Other models, ANN and RF, also slightly have reduced PD by 0.5% and 0.27%, respectively. The classifiers have a higher Pmd after removing correlations. The highest Pmd with correlations is exhibited by the LR classifier, at 3.1%, while the CART classifier has slightly higher results after removing correlations, with a 0.2% lower Pmd. GNB and AN, have an approximately 2% higher Pmd without correlations, while ANN and RF have an increase of Pmd by 1% after removing correlations.
Removing correlations also impacts the probability of false alarm. The SVM classifier has the highest reduction in Pfa, at 1.3%, after discarding the correlated features. The CART classifier has a higher Pfa, 0.02%, after removing correlated features. The RF classifier has a slightly higher Pfa after removing the correlated features of 0.01%. Other models, such as GNB, have an approximately 1% higher Pfa without correlations. Using a dataset with correlated features increases model ACC and PD and decreases the Pfa and Pmd. Eliminating correlated features will ensure more optimal learning and accurate performance for the final ML models.
Figure 7 illustrates the impact of dataset size on model performance for 1000, 2000, 4000, 6000, 8000, 10,000, 12,000, and 14,000 samples. All created datasets were balanced, that is, we used equal numbers of both spoofed and normal GPS signal samples from the original dataset. This investigation evaluates two scenarios: one with correlated features and the other after removing the correlated features.
Figure 7A illustrates the performance of the six models with correlations in terms of the four metrics. As it can be observed, all the models exhibit an increase in ACC and PD and a decrease in the probabilities of false alarm and misdetection ranging from 2% to 10% as the dataset size increases.
Figure 7B illustrates the results without correlation. Like in the previous case (Figure 7A), the accuracy and probability of detection increase as the dataset size increases for all models, while the probabilities of false alarm and misdetection decrease.
Therefore, with and without correlations, the performance of machine learning models improves when more training data are used.
We also evaluated the effect of dataset imbalance on ML model performance by examining different percentages of normal and malicious data samples in the dataset size of 14,000 samples (without correlation) by using the following ratios: 10% malicious signals to 90% normal signals, 20% malicious signals to 80% normal signals, 30% malicious signals to 70% normal signals, and 40% malicious signals to 60% normal signals. The results of these four scenarios were compared with those of the original balanced dataset (50% normal samples and 50% malicious samples). Figure 8 presents the performance of the six models for different percentages of malicious signals. As it can be seen, the accuracy and probability increase with the rate of malicious signals and reach their best values at a rate of 50%. In addition. the probability of misdetection and false alarm decrease as functions of malicious signals rate and reach their best values at 50% rate. Therefore, an imbalance dataset causes degradation in classifiers’ performance.
In summary, we can conclude that:
  • Tuned hyperparameters and regularized learning parameters improve models’ performance in terms of the selected metrics.
  • The presence of correlated features in a dataset degrades models’ performance. Identifying and removing redundant features from the dataset improves significantly this performance.
  • Dataset size plays an important role in models’ performance which increases as the size increases.
  • Class imbalance leads to biased models with degrading performance.

4. Conclusions

This study aims to investigate the impact of hyperparameters, regularization parameters, correlated features, dataset sizes, and imbalanced datasets on the performance of six machine learning models in detecting GPS spoofing attacks: ANN, SVM, RF, GNB, CART, and LR. The evaluation was performed using four metrics: probability of detection, probability of false alarm, probability of misdetection, and accuracy. The simulation results indicate that using inappropriate of hyperparameters, dataset size, features, and imbalanced datasets adversely affect the models’ performance. Although this study was performed on GPS spoofing attacks, the results apply to any applications that use machine learning models. AS future work, we plan to extend this investigation to evaluate the effectiveness of other widely used approaches, such as deep learning and deep convolutional models, considering additional evaluation metrics, such as computational complexity, memory usage, and detection time.

Author Contributions

Conceptualization, T.T.K. and S.I.; software, T.T.K.; data curation, T.T.K.; formal analysis, T.T.K. and S.I.; investigation, T.T.K.; methodology, T.T.K. and S.I.; visualization, T.T.K. and S.I.; writing—original draft, T.T.K., S.I. and N.K.; writing—review and editing, T.T.K., S.I. and N.K.; project administration, K.A.S. and V.K.D.; validation, K.A.S. and V.K.D.; supervision, N.K.; funding acquisition, N.K. All authors have read and agreed to the published version of the manuscript.

Funding

This work has the support of the National Science Foundation (NSF), Award Number: 2006674.

Institutional Review Board Statement

Not applicable.

Informed Consent Statement

Not applicable.

Data Availability Statement

Dataset will be available in GitHub and other sites.

Acknowledgments

The authors acknowledge the support of the National Science Foundation (NSF), Award Number: 2006674.

Conflicts of Interest

The authors declare no conflict of interest.

References

  1. Manesh, M.R.; Kaabouch, N. Cyber-Attacks on Unmanned Aerial System Networks: Detection, Countermeasure, and Future Research Directions. Comput. Secur. 2019, 85, 386–401. [Google Scholar] [CrossRef]
  2. Aissou, G.; Slimane, H.O.; Benouadah, S.; Kaabouch, N. Tree-Based Supervised Machine Learning Models for Detecting GPS Spoofing Attacks on UAS. In Proceedings of the 2021 IEEE 12th Annual Ubiquitous Computing, Electronics & Mobile Communication Conference (UEMCON), New York, NY, USA, 1–4 December 2021; pp. 649–653. [Google Scholar]
  3. Wesson, K.; Shepard, D.; Humphreys, T. Straight Talk on Anti-Spoofing: Securing the Future of PNT. GPS World 2012, 23, 32–39. [Google Scholar]
  4. Kwon, K.C.; Shim, D.S. Performance Analysis of Direct GPS Spoofing Detection Method With AHRS/Accelerometer. Sensors 2020, 20, 954. [Google Scholar] [CrossRef] [Green Version]
  5. Alrefaei, F.; Alzahrani, A.; Song, H.; Alrefaei, S. A Survey on the Jamming and Spoofing attacks on the Unmanned Aerial Vehicle Networks. In Proceedings of the 2022 IEEE International IOT, Electronics and Mechatronics Conference (IEMTRONICS), Toronto, ON, Canada, 1–4 June 2022; pp. 1–7. [Google Scholar] [CrossRef]
  6. Manesh, M.R.; Kenney, J.; Hu, W.C.; Devabhaktuni, V.K.; Kaabouch, N. Detection of GPS Spoofing Attacks on Unmanned Aerial Systems. In Proceedings of the 2019 16th IEEE Annual Consumer Communications and Networking Conference, CCNC 2019, Las Vegas, NV, USA, 11–14 January 2019. [Google Scholar] [CrossRef]
  7. Meng, L.; Yang, L.; Ren, S.; Tang, G.; Zhang, L.; Yang, F.; Yang, W. An Approach of Linear Regression-Based UAV GPS Spoofing Detection. Wirel. Commun. Mob. Comput. 2021, 2021, 5517500. [Google Scholar] [CrossRef]
  8. Schmidt, E.; Gatsis, N.; Akopian, D. A GPS Spoofing Detection and Classification Correlator-Based Technique Using the LASSO. IEEE Trans. Aerosp. Electron. Syst. 2020, 56, 4224–4237. [Google Scholar] [CrossRef]
  9. Shafique, A.; Mehmood, A.; Elhadef, M. Detecting Signal Spoofing Attack in UAVs Using Machine Learning Models. IEEE Access 2021, 9, 93803–93815. [Google Scholar] [CrossRef]
  10. Panice, G.; Luongo, S.; Gigante, G.; Pascarella, D.; di Benedetto, C.; Vozella, A.; Pescapè, A. An SVM-Based Detection Approach for GPS Spoofing Attacks to UAV. In Proceedings of the 2017 23rd International Conference on Automation and Computing (ICAC), Huddersfield, UK, 7–8 September 2017; pp. 1–11. [Google Scholar]
  11. Wang, S.; Wang, J.; Su, C.; Ma, X. Intelligent Detection Algorithm Against UAVs’ GPS Spoofing Attack. In Proceedings of the International Conference on Parallel and Distributed Systems—ICPADS, Hong Kong, China, 2–4 December 2020; pp. 382–389. [Google Scholar] [CrossRef]
  12. Semanjski, S.; Semanjski, I.; de Wilde, W.; Muls, A. Use of Supervised Machine Learning for GNSS Signal Spoofing Detection With Validation on Real-World Meaconing and Spoofing Data—Part I. Sensors 2020, 20, 1171. [Google Scholar] [CrossRef] [Green Version]
  13. Xue, N.; Niu, L.; Hong, L.X.; Li, Z.; Hoffaeller, L.; Pöpper, C. DeepSIM: GPS Spoofing Detection on UAVs Using Satellite Imagery Matching. In Proceedings of the Annual Computer Security Applications Conference 2020, Austin, TX, USA, 7–11 December 2020; pp. 304–319. [Google Scholar]
  14. Khoei, T.T.; Ismail, S.; Kaabouch, N. Dynamic Selection Techniques for Detecting GPS Spoofing Attacks on UAVs. Sensors 2022, 22, 662. [Google Scholar] [CrossRef]
  15. Gasimova, A.; Khoei, T.T.; Kaabouch, N. A Comparative Analysis of the Ensemble Models for Detecting GPS Spoofing attacks on UAVs. In Proceedings of the 2022 IEEE 12th Annual Computing and Communication Workshop and Conference (CCWC), Las Vegas, NV, USA, 26–29 January 2022; pp. 310–315. [Google Scholar]
  16. Khoei, T.T.; Gasimova, A.; Ahajjam, M.A.; Shamaileh, K.A.; Devabhaktuni, V.; Kaabouch, N. A Comparative Analysis of Supervised and Unsupervised Models for Detecting GPS Spoofing Attack on UAVs. In Proceedings of the 2022 IEEE International Conference on Electro Information Technology (eIT), Mankato, MN, USA, 19–21 May 2022; pp. 279–284. [Google Scholar] [CrossRef]
  17. Wei, X.; Sun, C.; Lyu, M.; Song, Q.; Li, Y. ConstDet: Control Semantics-Based Detection for GPS Spoofing Attacks on UAVs. Remote Sens. 2022, 14, 5587. [Google Scholar] [CrossRef]
  18. Yoon, H.J.; Wan, W.; Kim, H.; Hovakimyan, N.; Sha, L.; Voulgaris, P.G. Towards Resilient UAV: Escape Time in GPS Denied Environment with Sensor Drift. IFAC-PapersOnLine 2019, 52, 423–428. [Google Scholar] [CrossRef]
  19. Dang, Y.; Benzaïd, C.; Shen, Y.; Taleb, T. GPS Spoofing Detector with Adaptive Trustable Residence Area for Cellular based-UAVs. In Proceedings of the GLOBECOM 2020–2020 IEEE Global Communications Conference, Taipei, Taiwan, 7–11 December 2020; pp. 1–6. [Google Scholar]
  20. Qiao, Y.; Zhang, Y.; Du, X. A Vision-Based GPS-Spoofing Detection Method for Small UAVs. In Proceedings of the 13th International Conference on Computational Intelligence and Security, CIS 2017, Hong Kong, China, 15–18 December 2017; pp. 312–316. [Google Scholar]
  21. Varshosaz, M.; Afary, A.; Mojaradi, B.; Saadatseresht, M.; Parmehr, E.G. Spoofing detection of civilian UAVs using visual odometry. ISPRS Int. J. Geo-Inf. 2019, 9, 6. [Google Scholar] [CrossRef] [Green Version]
  22. Wu, J.; Chen, X.Y.; Zhang, H.; Xiong, L.D.; Lei, H.; Deng, S.H. Hyperparameter Optimization for Machine Learning Models Based on Bayesian Optimization. J. Electron. Sci. Technol. 2019, 17, 26–40. [Google Scholar] [CrossRef]
  23. Yeo, I.-K.; Johnson, R.A. A New Family of Power Transformations to Improve Normality or Symmetry. Biometrika 2000, 87, 954–959. [Google Scholar] [CrossRef]
  24. Friedrichs, F.; Igel, C. Evolutionary Tuning of Multiple SVM Parameters. Neurocomputing 2005, 64, 107–117. [Google Scholar] [CrossRef]
  25. McHugh, L. The Chi-Square Test of Independence. Biochem. Med. 2013, 23, 143–149. [Google Scholar] [CrossRef] [Green Version]
  26. Breiman, L. Random Forests. Mach. Learn. 2001, 45, 5–32. [Google Scholar] [CrossRef] [Green Version]
  27. Fitch, F.B.; McCulloch, W.S.; Pitts, W. A Logical Calculus of the Ideas Immanent in Nervous Activity. Bull. Math. Biophys. 1943, 5, 115–133. [Google Scholar]
  28. Cortes, C.; Vapnik, V. Support-Vector Networks. Mach. Learn. 1995, 20, 273–297. [Google Scholar] [CrossRef]
  29. Murphy, K.P. Naive Bayes Classifiers; University of British Columbia: Vancouver, BC, Canada, 2006; Volume 18, pp. 1–8. [Google Scholar]
  30. Crawford, S.L. Extensions to the CART Algorithm. Int. J. Man-Mach. Stud. 1989, 31, 197–217. [Google Scholar] [CrossRef]
  31. Menard, S. Applied Logistic Regression Analysis; Sage: Thousand Oaks, CA, USA, 2002; Volume 106. [Google Scholar]
  32. Liu, R.; Liu, E.; Yang, J.; Li, M.; Wang, F. Optimizing the Hyper-Parameters for SVM by Combining Evolution Strategies with a Grid Search. Intell. Control. Autom. 2006, 344, 712–721. [Google Scholar]
  33. Bergstra, J.; Bengio, Y. Random Search for Hyper-Parameter Optimization. J. Mach. Learn. Res. 2012, 13, 281–305. [Google Scholar]
  34. Xiang, W.; Zhining, Y. Neural Network Hyperparameter Tuning Based on Improved Genetic Algorithm. ACM Int. Conf. Proc. Ser. 2019, 17–24. [Google Scholar] [CrossRef]
  35. Shahriari, B.; Swersky, K.; Wang, Z.; Adams, R.P.; de Freitas, N. Taking the Human Out of the Loop: A Review of Bayesian Optimization. Proc. IEEE 2016, 104, 148–175. [Google Scholar] [CrossRef] [Green Version]
  36. Nguyen, V. Bayesian Optimization for Accelerating Hyper-Parameter Tuning. In Proceedings of the 2019 IEEE Second International Conference on Artificial Intelligence and Knowledge Engineering (AIKE), Sardinia, Italy, 3–5 June 2019; pp. 302–305. [Google Scholar] [CrossRef]
  37. Khoei, T.T.; Kaabouch, N. Densely Connected Neural Networks for Detecting Denial of Service Attacks on Smart Grid Network. In Proceedings of the 2022 IEEE 13th Annual Ubiquitous Computing, Electronics & Mobile Communication Conference (UEMCON), New York, NY, USA, 26–29 October 2022; pp. 207–211. [Google Scholar] [CrossRef]
  38. Ismail, S.; Reza, H. Evaluation of Naïve Bayesian Algorithms for Cyber-Attacks Detection in Wireless Sensor Networks. In Proceedings of the 2022 IEEE 509 World AI IoT Congress (AIIoT), Seattle, WA, USA, 6–9 June 2022; pp. 283–289. [Google Scholar] [CrossRef]
  39. Pedregosa, F.; Varoquaux, G.; Gramfort, A.; Michel, V.; Thirion, B.; Grisel, O.; Blondel, M.; Prettenhofer, P.; Weiss, R.; Dubourg, V.; et al. Scikit-Learn: Machine learning in Python. J. Mach. Learn. Res. 2011, 12, 2825–2830. [Google Scholar]
  40. Jafari, F.; Dorafshan, S. Bridge Inspection and Defect Recognition with Using Impact Echo Data, Probability, and Naive Bayes Classifiers. Infrastructures 2021, 6, 132. [Google Scholar] [CrossRef]
Figure 1. Overview of dataset characteristics and model parameters for detecting GPS spoofing attacks targeting UAVs.
Applsci 13 00383 g001
Figure 2. Process to study the impact of dataset characteristics and model parameters on GPS spoofing detection systems.
Applsci 13 00383 g002
Figure 3. Impact of regularization learning parameters on model performance.
Applsci 13 00383 g003
Figure 4. Impact of hyperparameter fine-tuning on model performance.
Applsci 13 00383 g004
Figure 5. Results of feature correlation and feature importance. (a) Heatmap of Pearson’s Correlation Coefficient technique; (b) Chi-Square Feature Importance.
Applsci 13 00383 g005
Figure 6. Impact of data correlation on model performance.
Applsci 13 00383 g006
Figure 7. Impact of training set size on model performance. (A) Without correlation; (B) With correlation.
Applsci 13 00383 g007
Figure 8. Impact of class imbalance on model performance.
Applsci 13 00383 g008
Table 1. Comparison of existing machine learning techniques with respect to dataset characteristics and model parameters.
Detection ModelDataset CharacteristicsModel Parameters
Correlation TechniqueClass ImbalanceDataset SizeHyperparameter TuningRegularization
Artificial Neural Network [6]-Balanced3000 Samples--
Linear Regression-Based and Long Short-Term Memory [7]--40,000 Samples--
Selection Operator, Least Absolute Shrinkage [8]Two-Phase Correlator--Selection Operator and Least Absolute Shrinkage-
K-Learning-Based [9]-----
Support Vector Machine [10]-----
Long Short-Term Memory [11]-Balanced---
Support Vector Machine [12]Pearson’s Correlation Coefficient----
DeepSIM [13]--7740 Images--
Metric Optimized Dynamic and Weighted Metric Optimized Dynamic [14]Spearman’s Correlation CoefficientBalanced10,055 SamplesBayesian Optimization-
Random Forest, Gradient Boost, XGBoost, and LightGBM [2]Spearman’s Correlation CoefficientBalanced10,055 Samples--
Bagging, Boosting, and Stacking [15]Pearson’s Correlation CoefficientBalanced10,055 SamplesGrid Search-
Gaussian Naïve Bayes, Random Forest, Classification and Regression Decision Tree, Linear-Support Vector Machine, Logistic Regression, Principal Component Analysis, Artificial Neural Network, and Autoencoder [16]Pearson’s Correlation CoefficientBalanced10,055 SamplesGrid Search and Adadelta optimizer-
Support Vector Machine and K-fold [17]---K-fold cross validation-
CONSDET [18]Simple CorrelationBalanced10,296 Samples--
Resilient State Estimation [19]-----
5G-assisted UAV [20]-----
Vision Inertial Measurement Unit [21]-----
Visual Odometry [22]-----
Table 2. List of features with their abbreviations.
FeatureAbbreviation
Pseudorandom Number PRN
Carrier Doppler DO
Carrier Phase Shift CP
Pseudo Range PD
Prompt In-phase Component PIP
Receiver TimeRX
Prompt Quadrature Component PQP
Time of Week TOW
Prompt Correlator PC
Early Correlator EC
Tracking Carrier DopplerTCD
Carrier to Noise C/N0
Late Correlator LC
Table 3. Hyperparameter settings.
ClassifierRegularized Learning ParameterOptimal Hyperparameters Values
SVMCC = 8, degree = 1, gamma = 1.717, kernel = ‘poly’
ANNalphaactivation = ‘identity’, solver = ‘lbfgs’, alpha = 0.173
RFccp_alphan_estimators = 738, max_depth = 112, min_samples_split = 5, ccp_alpha = 10
GNBvar_smoothingvar_smoothing = 5
CARTccp_alphamax_depth = 32.0, Criterion = ‘gini’, splitter = ‘best’, ccp_alpha = 5, max_features = ‘log2’
LRCmax_iter = 10, penalty = ‘l2’, C = 10
Disclaimer/Publisher’s Note: The statements, opinions and data contained in all publications are solely those of the individual author(s) and contributor(s) and not of MDPI and/or the editor(s). MDPI and/or the editor(s) disclaim responsibility for any injury to people or property resulting from any ideas, methods, instructions or products referred to in the content.

