Article

Experimental Study on a Supercritical CO2 Centrifugal Compressor Used in a MWe Scale Power Cycle

1
Institute of Engineering Thermophysics, Chinese Academy of Sciences, 11 Beisihuanxi Rd, Beijing 100190, China
2
School of Engineering Science, University of Chinese Academy of Sciences, No.19(A) Yuquan Road, Beijing 100049, China
*
Author to whom correspondence should be addressed.
Appl. Sci. 2023, 13(1), 385; https://doi.org/10.3390/app13010385
Submission received: 22 November 2022 / Revised: 13 December 2022 / Accepted: 22 December 2022 / Published: 28 December 2022

Abstract

:
The centrifugal compressor is the core component of supercritical CO2 power cycle, and its performance and operation stability are research hotspots. However, there are few experimental studies, especially for compressors used in Mwe-scale power cycles. In this paper, based on a 1 MWe supercritical CO2 power cycle, a single-stage centrifugal supercritical CO2 compressor is designed with speed of 40,000 RPM, a pressure ratio of 2.5 and a mass flow of 16.3 kg/s. In order to carry out the compressor test, a general experimental platform for MWe sCO2 compressors is built. In the test, the mass flow range is 13.5~18 kg/s and the maximum experimental pressure ratio is close to 2.0. The performance curve of the compressor of 31,000 ± 1000 RPM is obtained, and the historical curve of the experiment is given. Then, the experimental curve is compared with the design curve using a dimensionless method. The isentropic head coefficient of the experimental curve is lower than the design value, and the experimental curves shift towards the boundary of small flow coefficient. Finally, the influence of compressor inlet condensation on compressor performance and the change of operating boundary is preliminarily explained.

1. Introduction

The sCO2(supercritical carbon dioxide) Brayton power cycle has the characteristics of small size, compact structure and strong environmental adaptability. Compared with the commonly used Rankine cycle, it has the advantage of high efficiency in the medium and high temperature zone [1]. Compressors are the “heart” of various power cycles. sCO2 compressors are also the key to improving cycle efficiency and operational stability in sCO2 Brayton cycle generation systems. A sCO2 Brayton power cycle less than 100 Mwe can choose a single-stage or a multi-stage centrifugal compressor as the main compressor [2]. It can be expected that for a long time to come, centrifugal compressors will be the main form of sCO2 compressors.
The sCO2 centrifugal compressors in 100 kWe scale have accumulated lots of experimental test results. The experimental cycle of Sandia laboratory in the United States includes the main compressor and the recompression compressor; the main compressor inlet condition is near the critical point, and the recompression compressor inlet temperature is much higher than the critical point. Therefore, the main compressor is mainly tested and the maximum experimental speed is 65,000 RPM, which is 92.8% of the design speed; the highest pressure ratio reached 1.65, reaching 90% of the design pressure ratio. The efficiency is 60~70% [3,4]. The TIT (Tokyo Institute of Technology) centrifugal compressor uses a closed impeller, but the maximum experimental speed only reaches 70% of the design speed, and the efficiency of the compressor is only 48% [5]. The experimental speed of SCIEL (the Supercritical CO2 Integral Experimental Loop) shunt back-to-back compressor is only 50% of the design speed, and the compressor efficiency (including external losses) is 25% [6,7,8].
The above-mentioned sCO2 centrifugal compressors show that the influence of rotor windage loss cannot be ignored, and should be treated carefully to improve the efficiency of the compressor.
In this study, a single-stage centrifugal compressor with labyrinth seal and oil lubrication is designed, and a low-speed motor is connected through a high-speed gearbox as the power to effectively avoid high wind resistance losses caused by high-pressure density fluid in the high-speed shaft. Based on the above design, the single-stage compressor is expected to have better performance than the existing sCO2 compressor.

2. The Design of Single-Stage Centrifugal Compressor

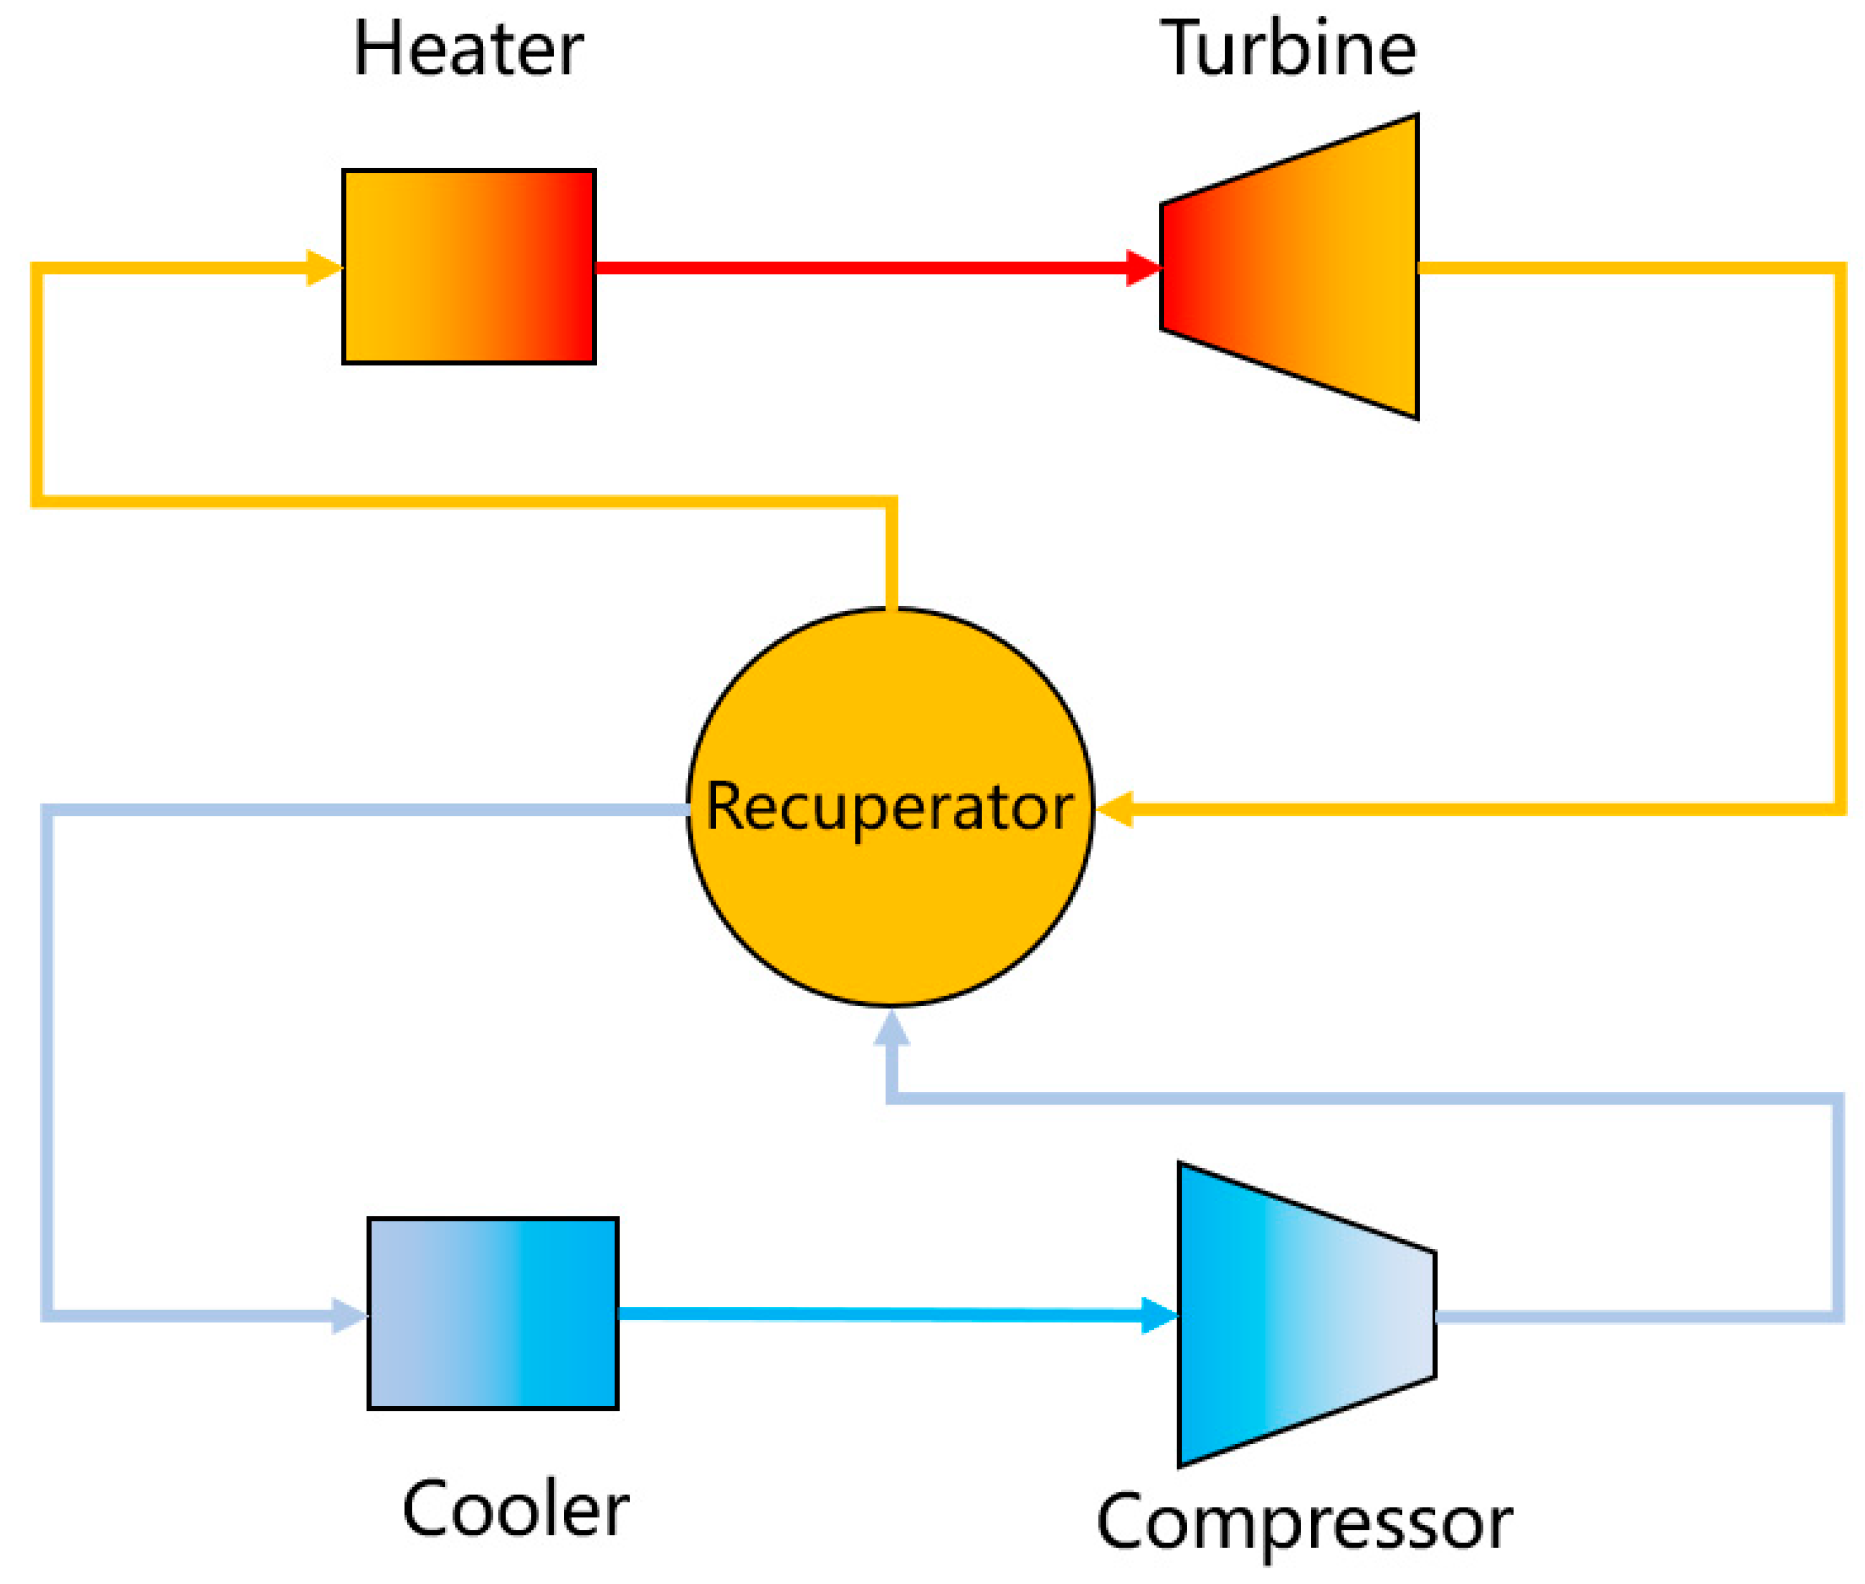
2.1. The 1 MWe sCO2 Power Cycle

The compressor is designed based on a MWe scale sCO2 Brayton power cycle, as is shown in Figure 1. In order to minimize the construction difficulty, instead of pursuing high efficiency, the cycle is configured as a simple reheat cycle rather than a recompression cycle which may have higher efficiency [9,10]. The compressor is driven by an independent inverter motor, the turbine output power is absorbed by a hydraulic dynamometer, and a gas-fired boiler is deployed as the heater.
Cycle parameters are shown in Table 1. The heat source power is over 5 MWth, the turbine inlet temperature is 550 °C and the turbine inlet pressure is 20 MPa. The compressor inlet parameters depart slightly from the critical point but are near the pseudo-critical line, and the pressure ratio is above 2.5, ensuring that the cycle has an efficiency of at least 21% after accounting for all sorts of losses.

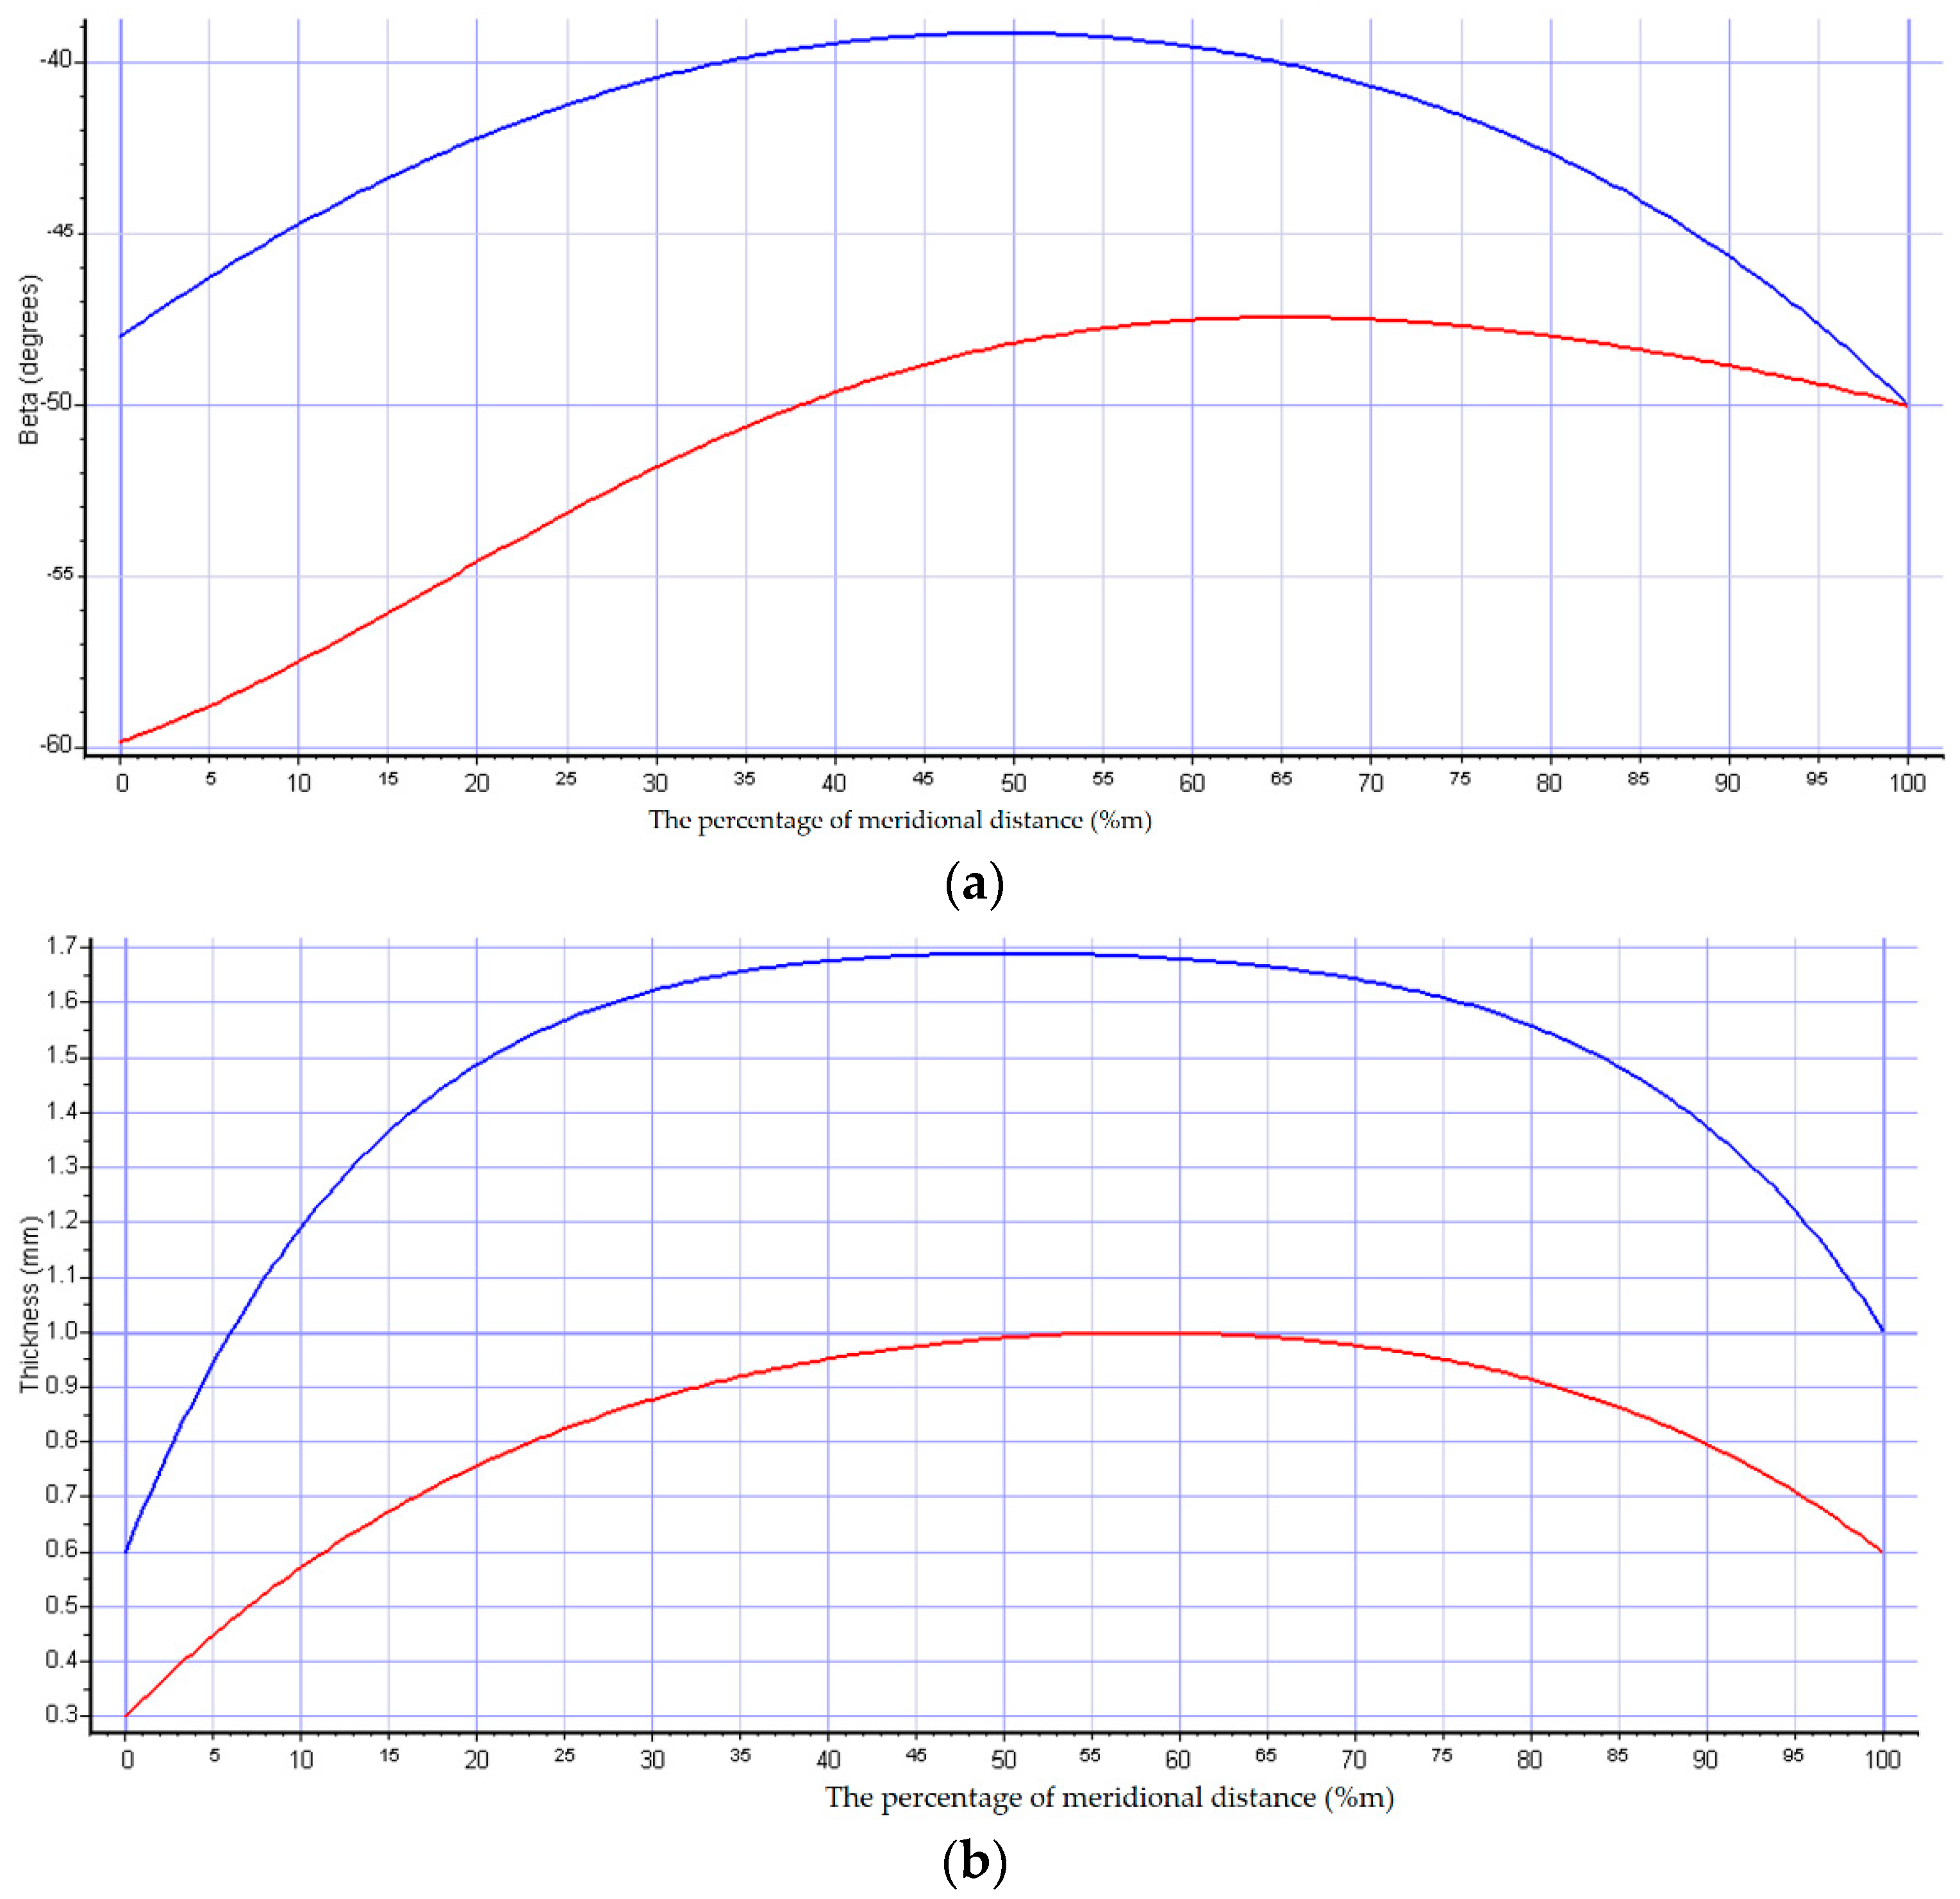
2.2. Throughflow Design of Compressor

The main design parameters of the single-stage centrifugal compressor for the 1 MWe sCO2 power cycle are shown in Table 2. The pseudo-critical temperature corresponding to the total inlet pressure of 8 MPa is 34.6 °C, while the total inlet temperature of the compressor is 35 °C, which is slightly higher than the pseudo-critical temperature and belongs to the supercritical gas-like phase. The estimated isentropic efficiency of the single-stage compressor is not less than 80%, under which the compressor input power is about 500 kW.
Under the design parameters given in Table 2, the optimal working speed corresponding to the single-stage centrifugal compressor is about 49000 RPM (Ns = 0.6) [11]. However, in the actual design process, it is necessary to comprehensively consider factors such as bearings, compressor rotor dynamics design and assembly process. Referring to the operation experience of sandia, IST and TIT compressors, the compressor speed should not be too high, and the tip clearance should not be too large. The working speed of the compressor is set at 40,000 RPM and tip clearance is 0.25 mm.
The small volume flow rate and the high-pressure ratio of the single-stage compressor lead to a small impeller blade height of 3.5 mm; the tip clearance is close to 10%. The main structural parameters of the semi-open impeller are shown in Table 3.
Considering that the single-stage centrifugal compressor is mainly for experimental testing and variable inlet conditions, a vaneless diffuser is used and the radius ratio of the diffuser section is set at 1.7, which is constrained by the surge boundary and diffuser efficiency.
Figure 2 further gives the beta and thickness distribution of the semi-open impeller, in which the blue line represents the hub and the red line represent the shroud, which is designed using an authorized commercial software (@ Concepts NREC). It is convenient to rebuild the impeller using the curve in Figure 2.
Figure 3 shows the numerical simulation performance curve of the single compressor. The yellow point in the figure represents the compressor design point. As this numerical simulation calculation only includes the impeller and vaneless diffuser, and does not include the volute; the numerical simulation calculation results may be higher than the experimental performance.

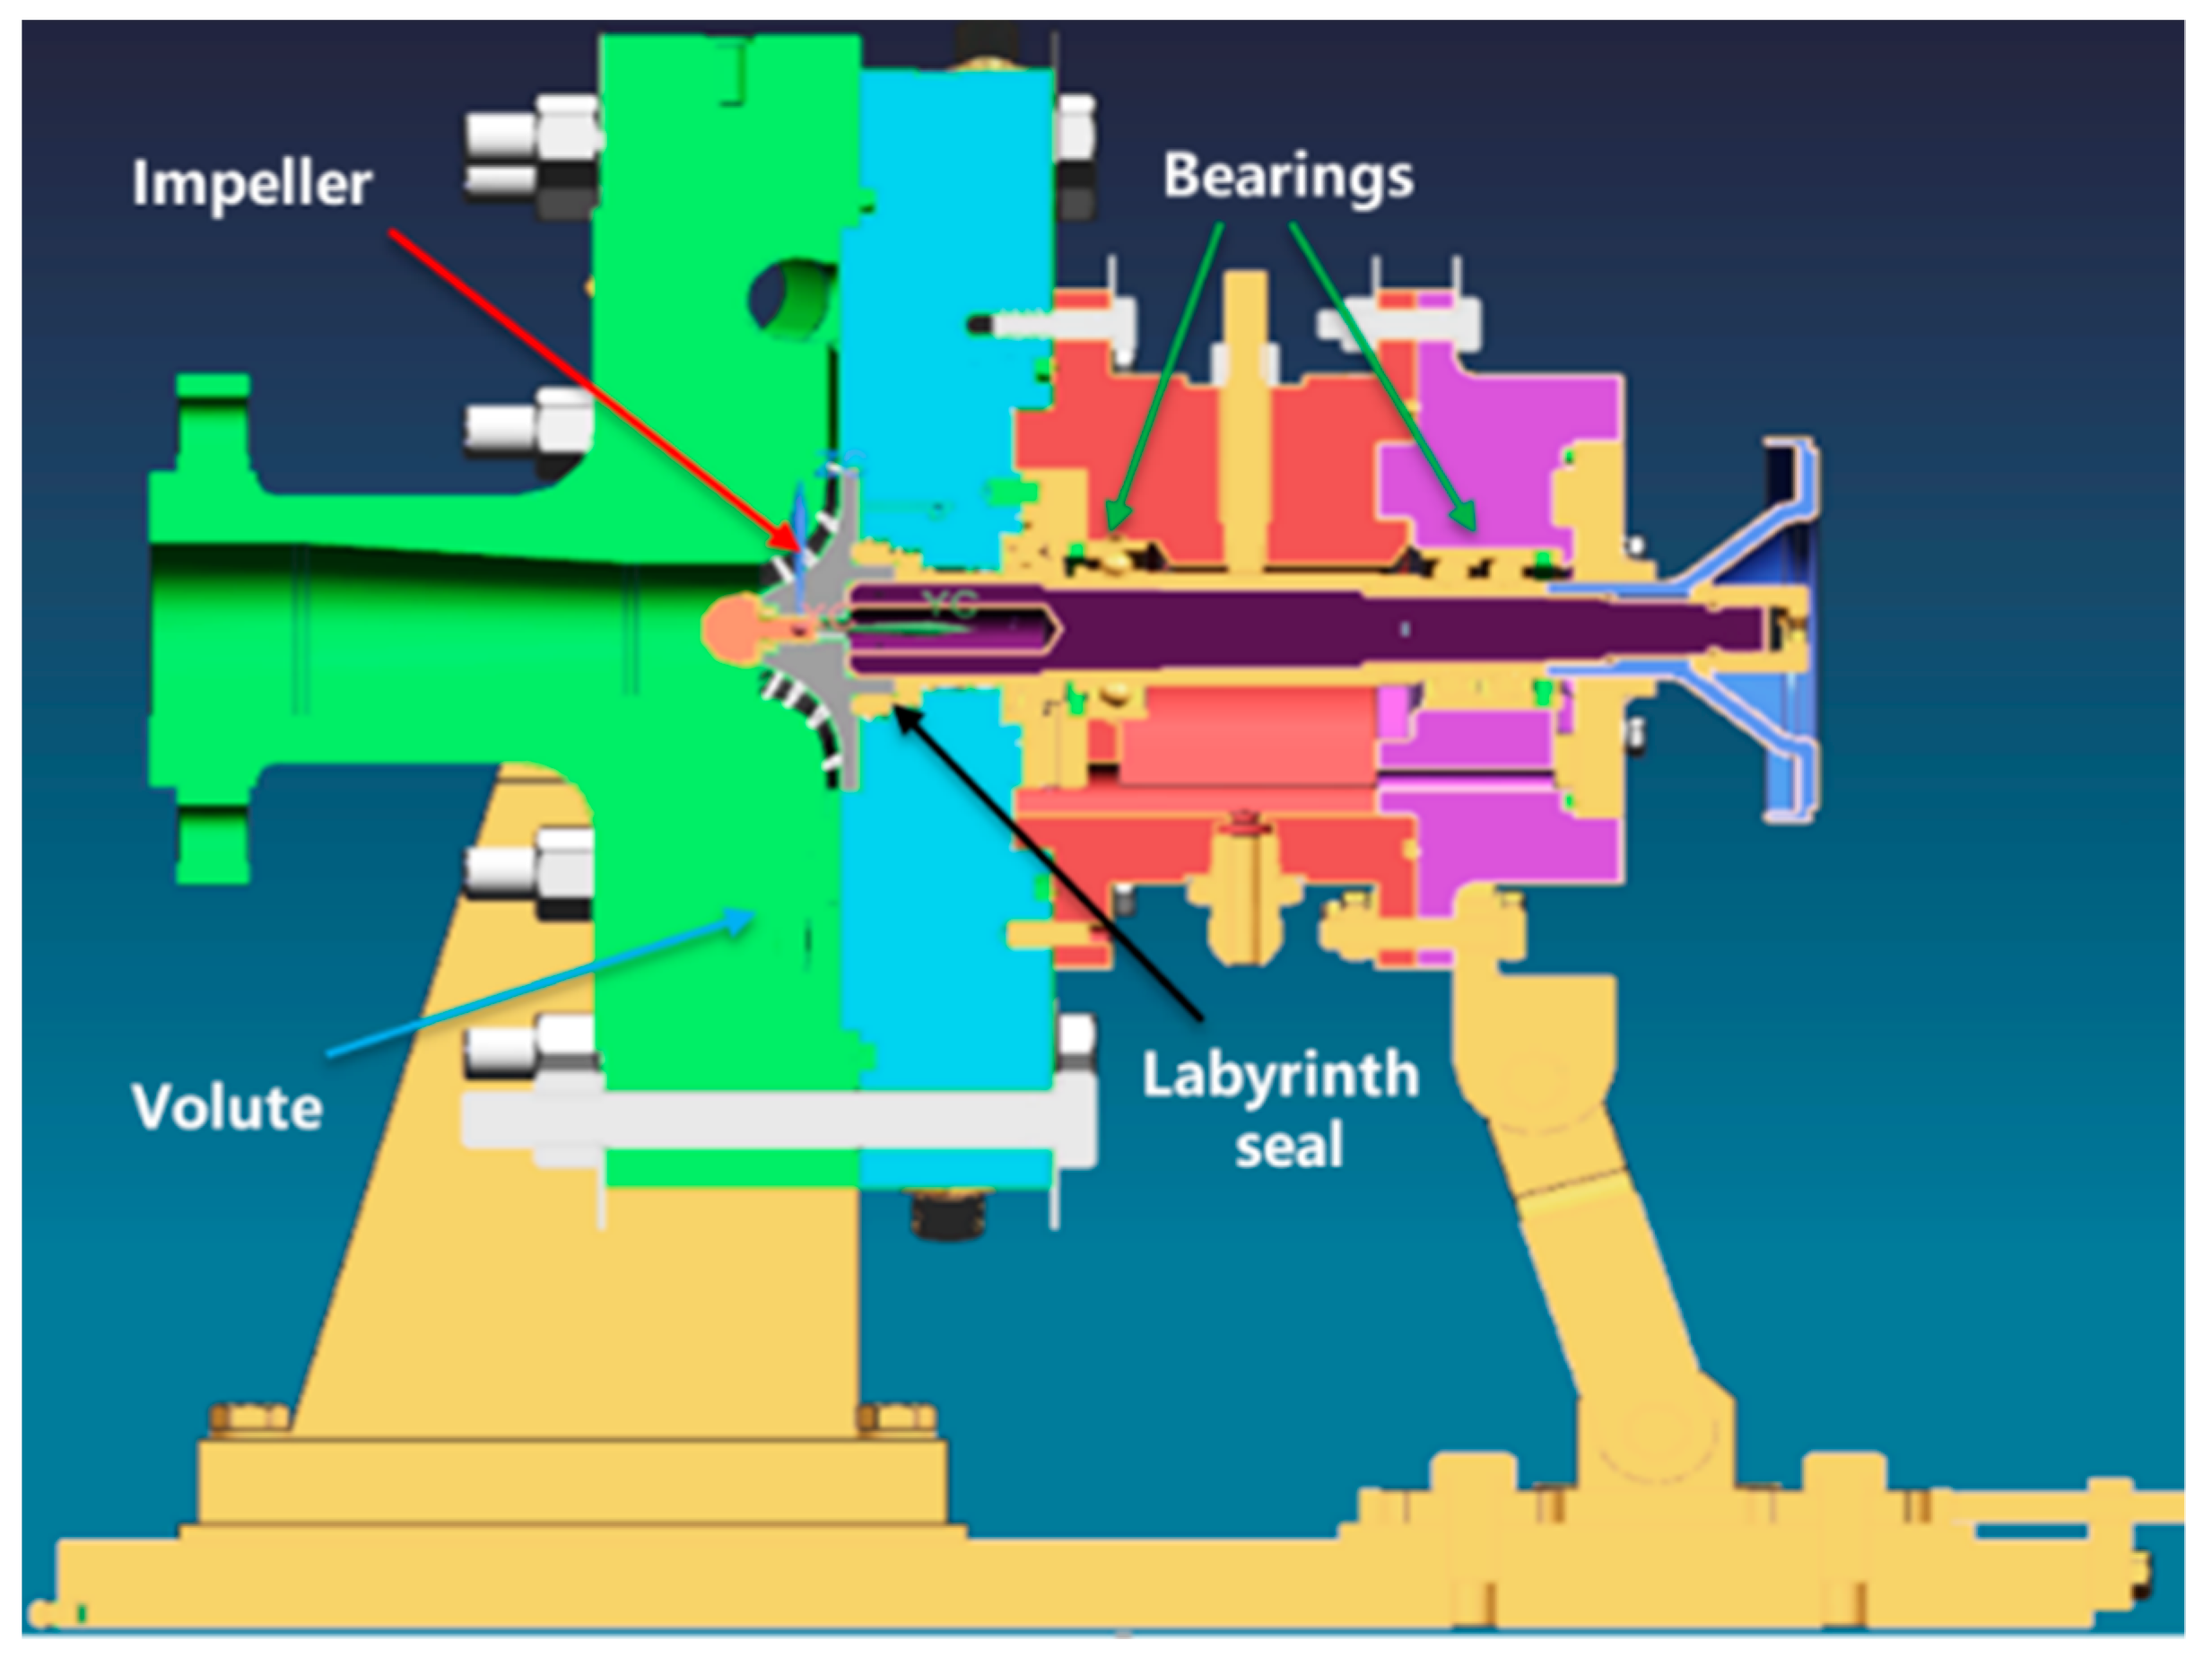
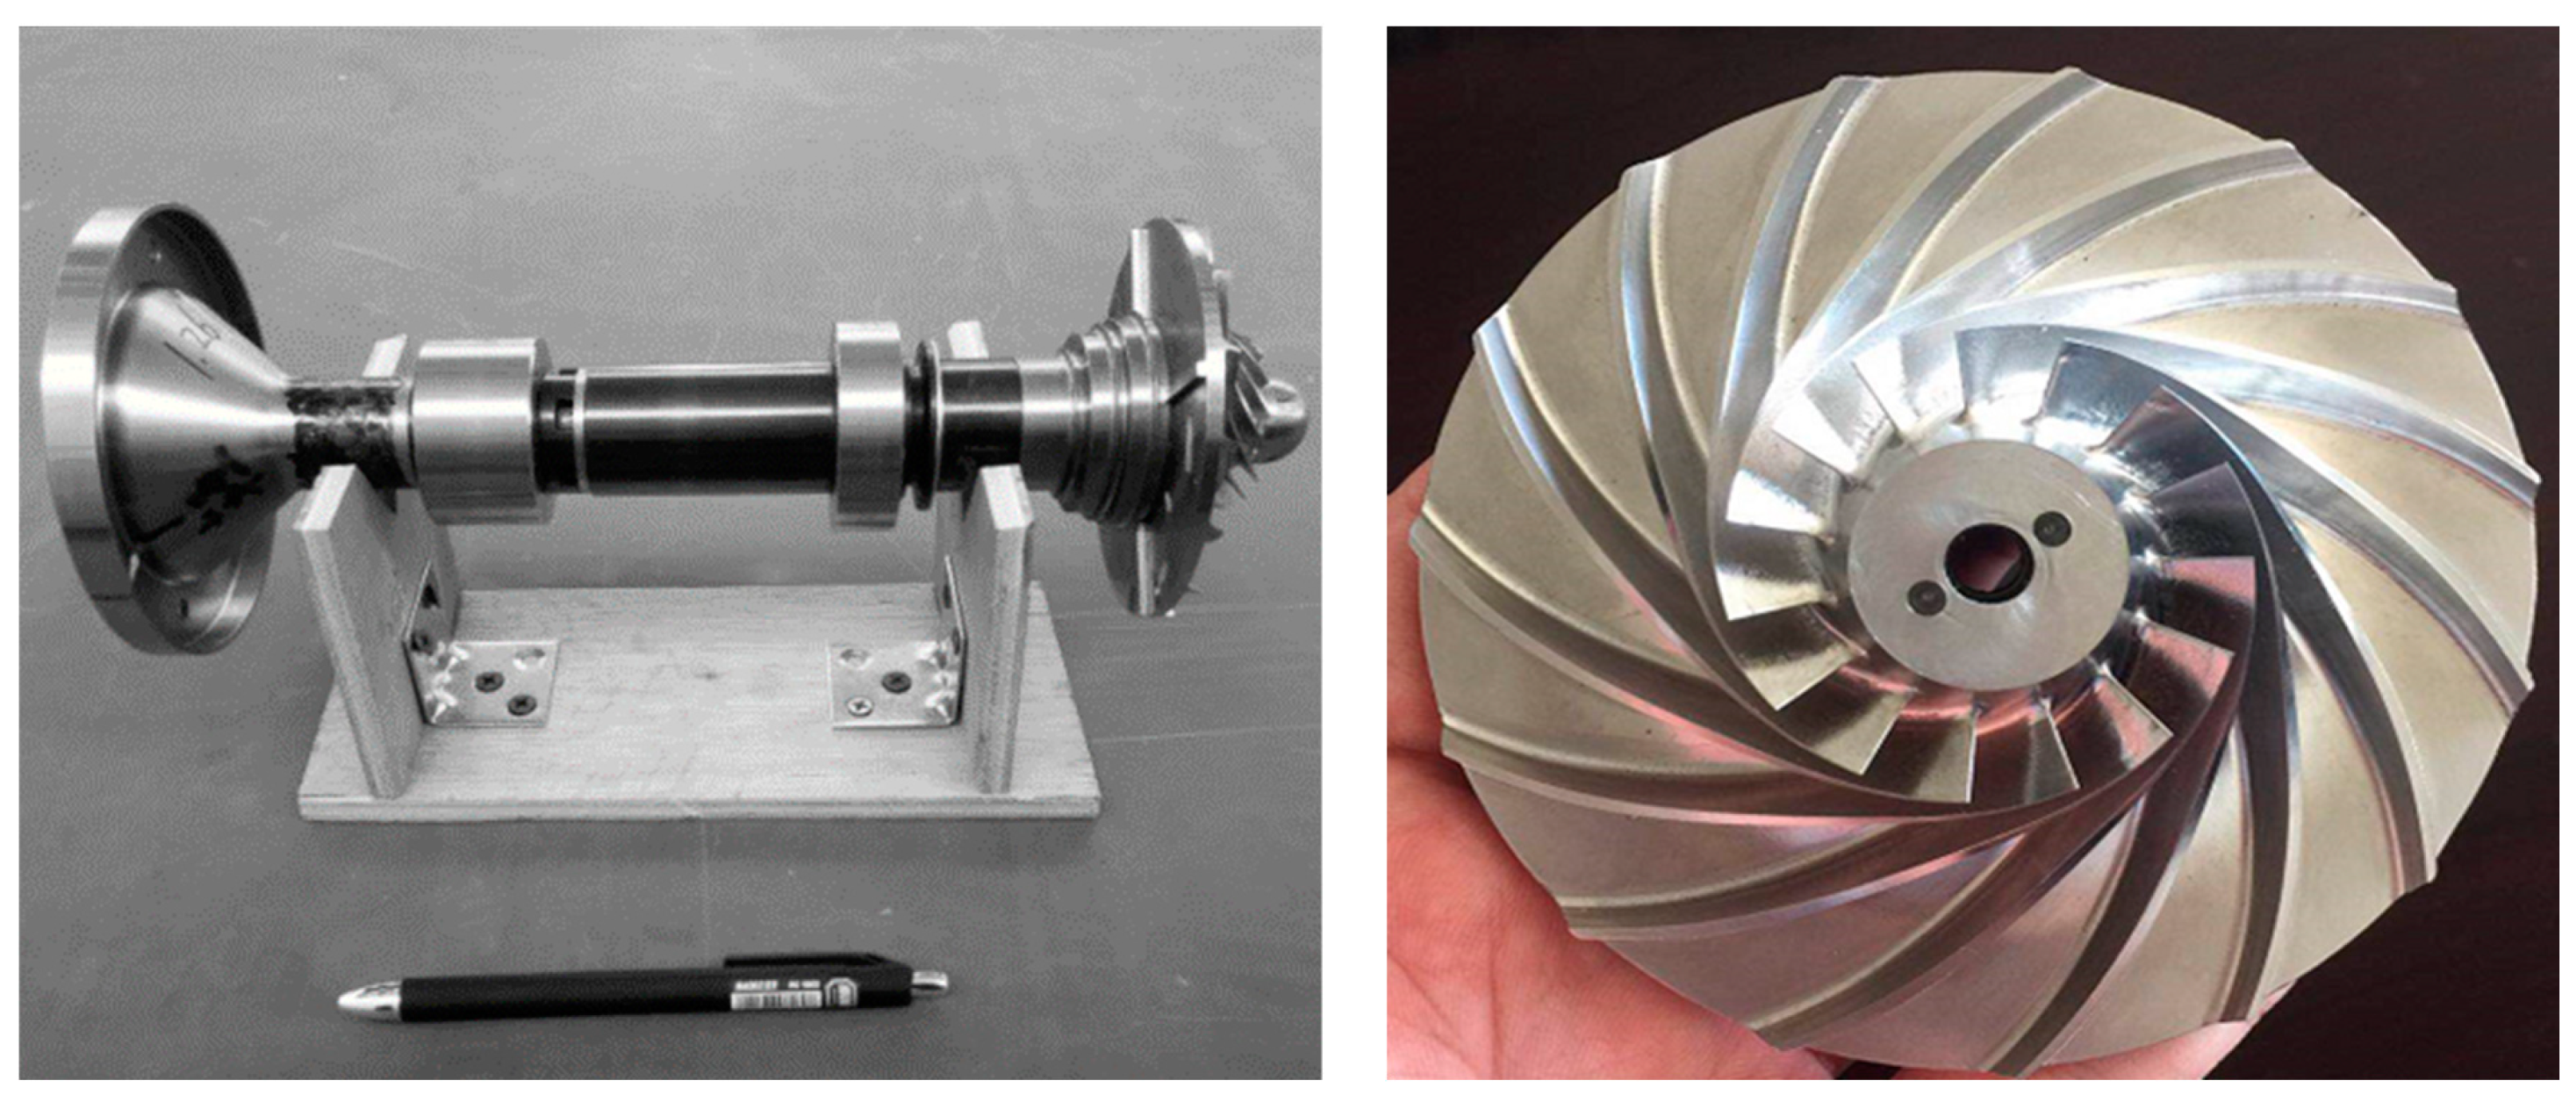
2.3. Mechanical Design of Compressor

Figure 4 shows the schematic layout of the single-stage compressor. Pump-out vane and suitable starting setup have been used to balance the axial force and the angular contact ball bearings have been used to withstand the residual axial force. To seal high pressure up to 20 MPa, a stepped staggered labyrinth is used as the shaft end seal of the compressor.
The schematic figure of the rotor and impeller are shown in Figure 5. Incredibly, for a sCO2 single-stage compressor used in a MWe power cycle, the entire rotor is only as long as two pens and the impeller is only palm-sized. In addition, the rotor of the single-stage compressor is rigid and has a first bend-rigid critical speed in excess of 40,000 RPM.

3. Experimental System

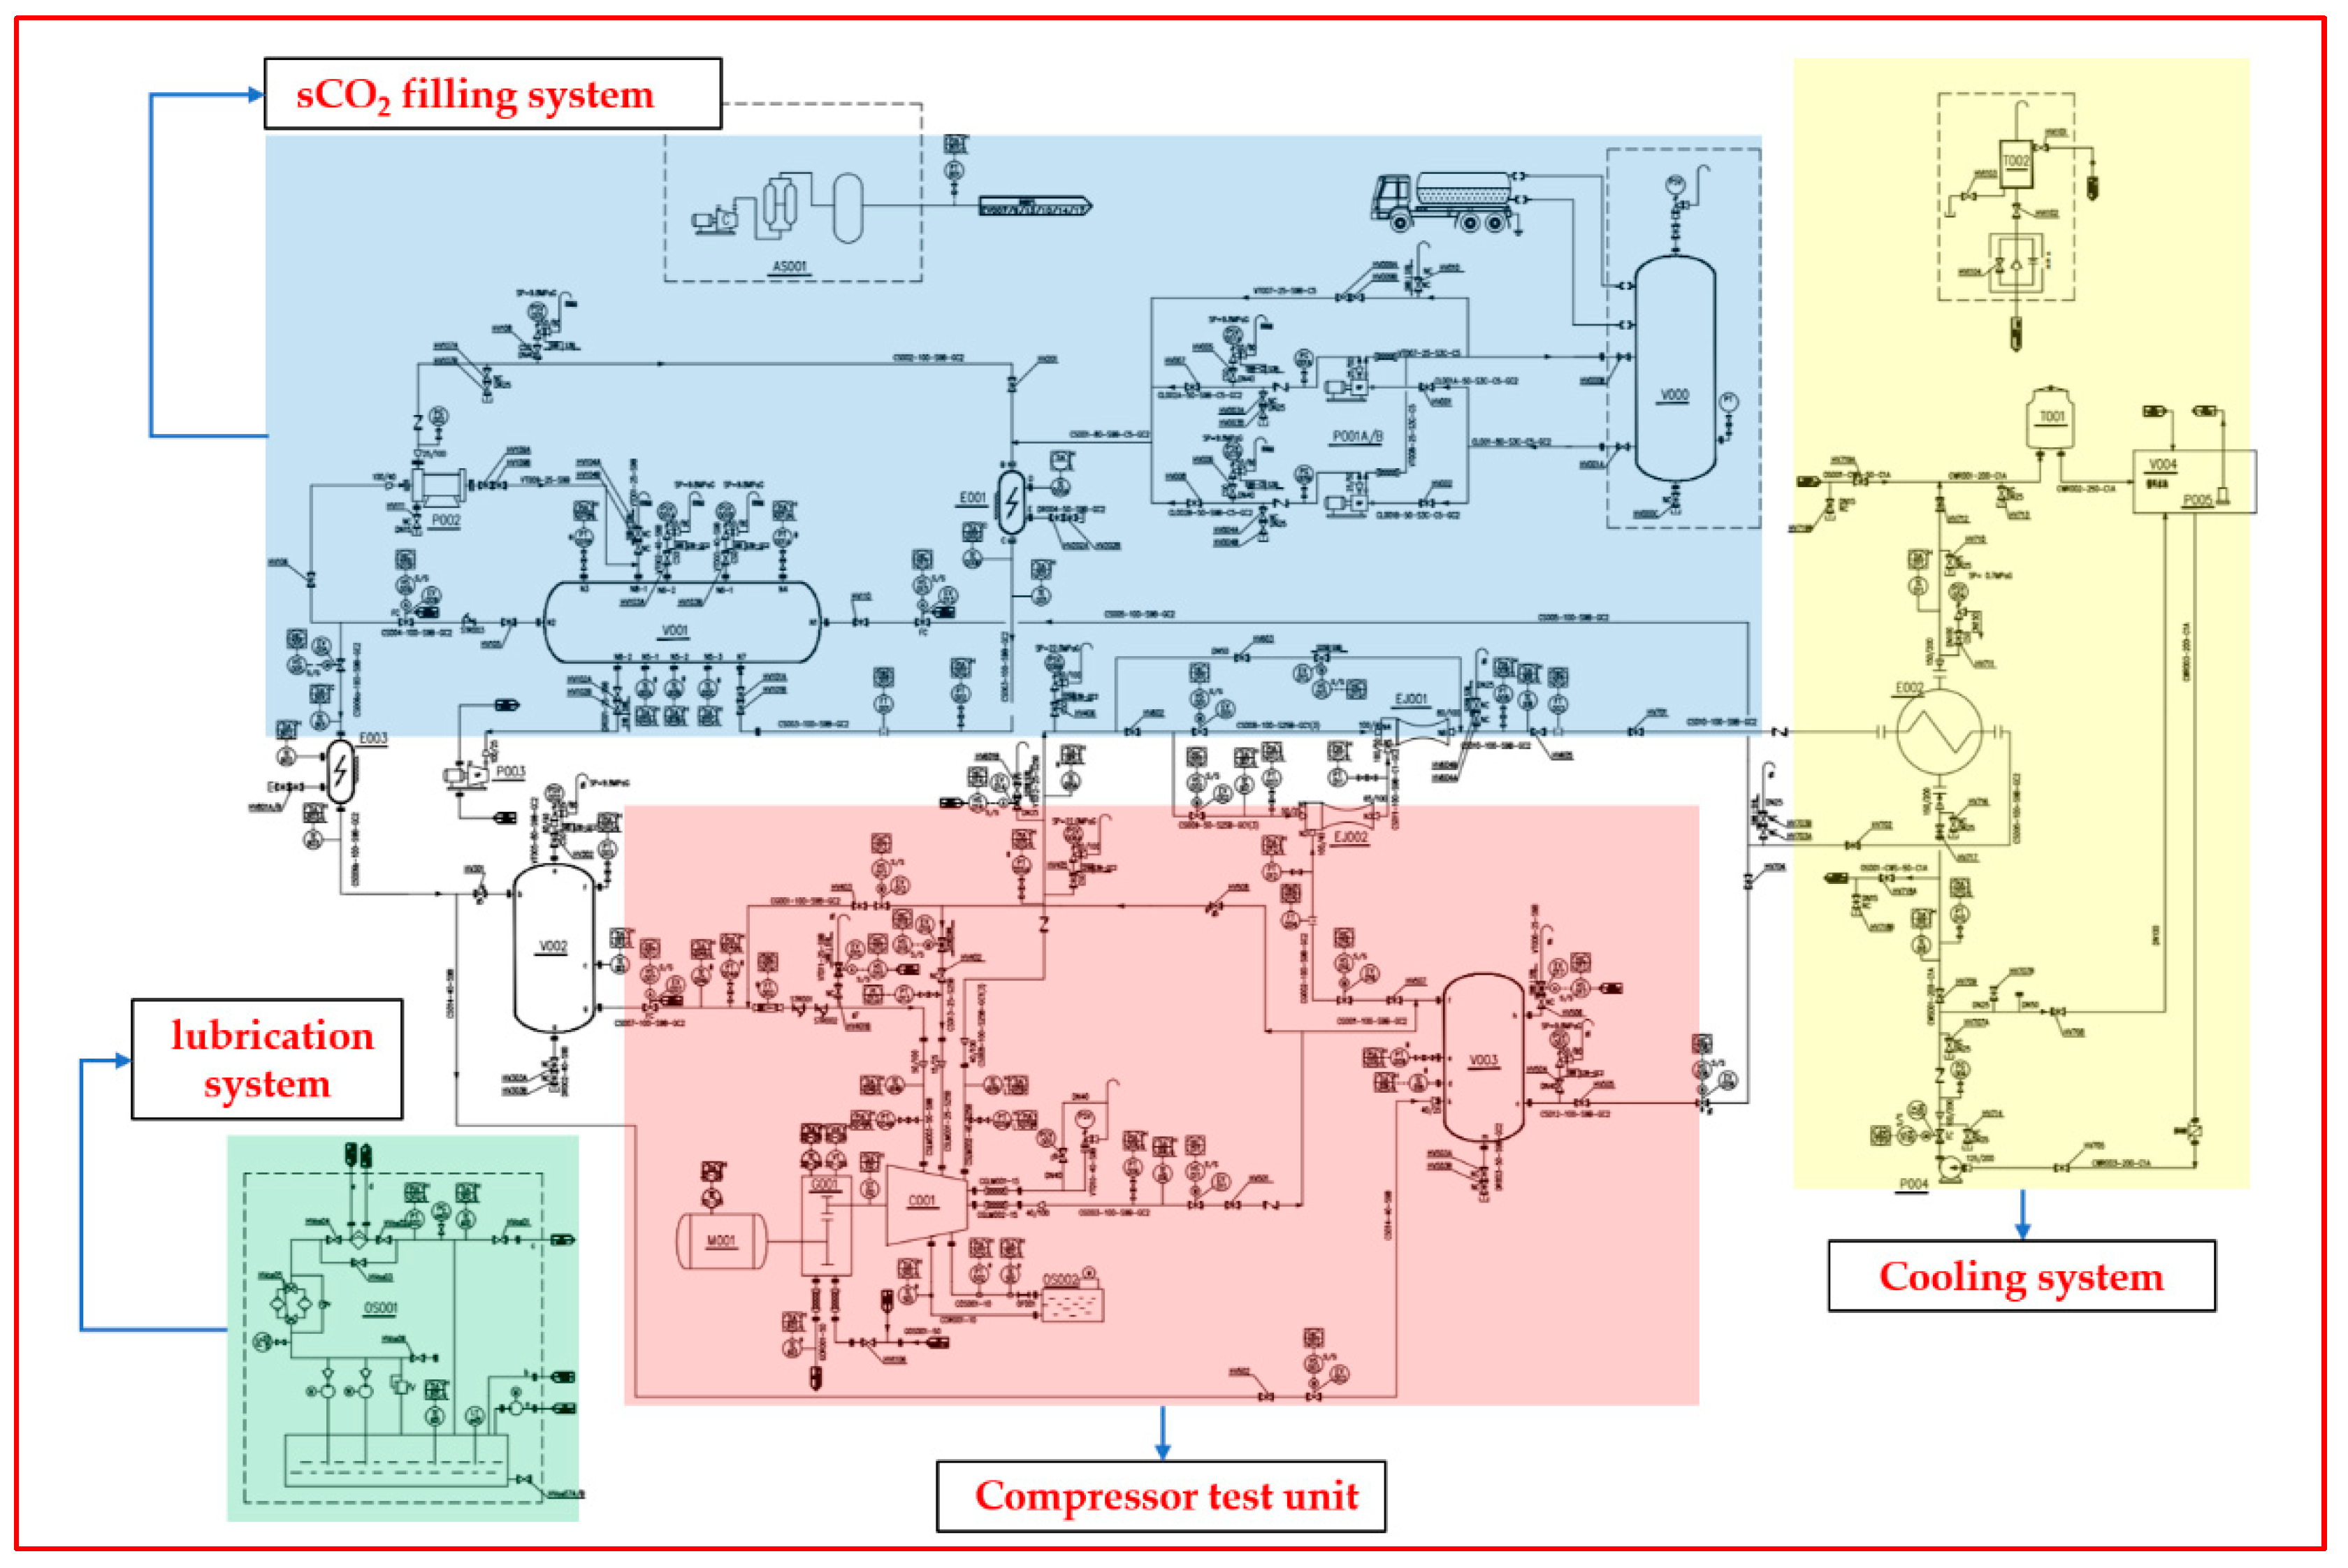
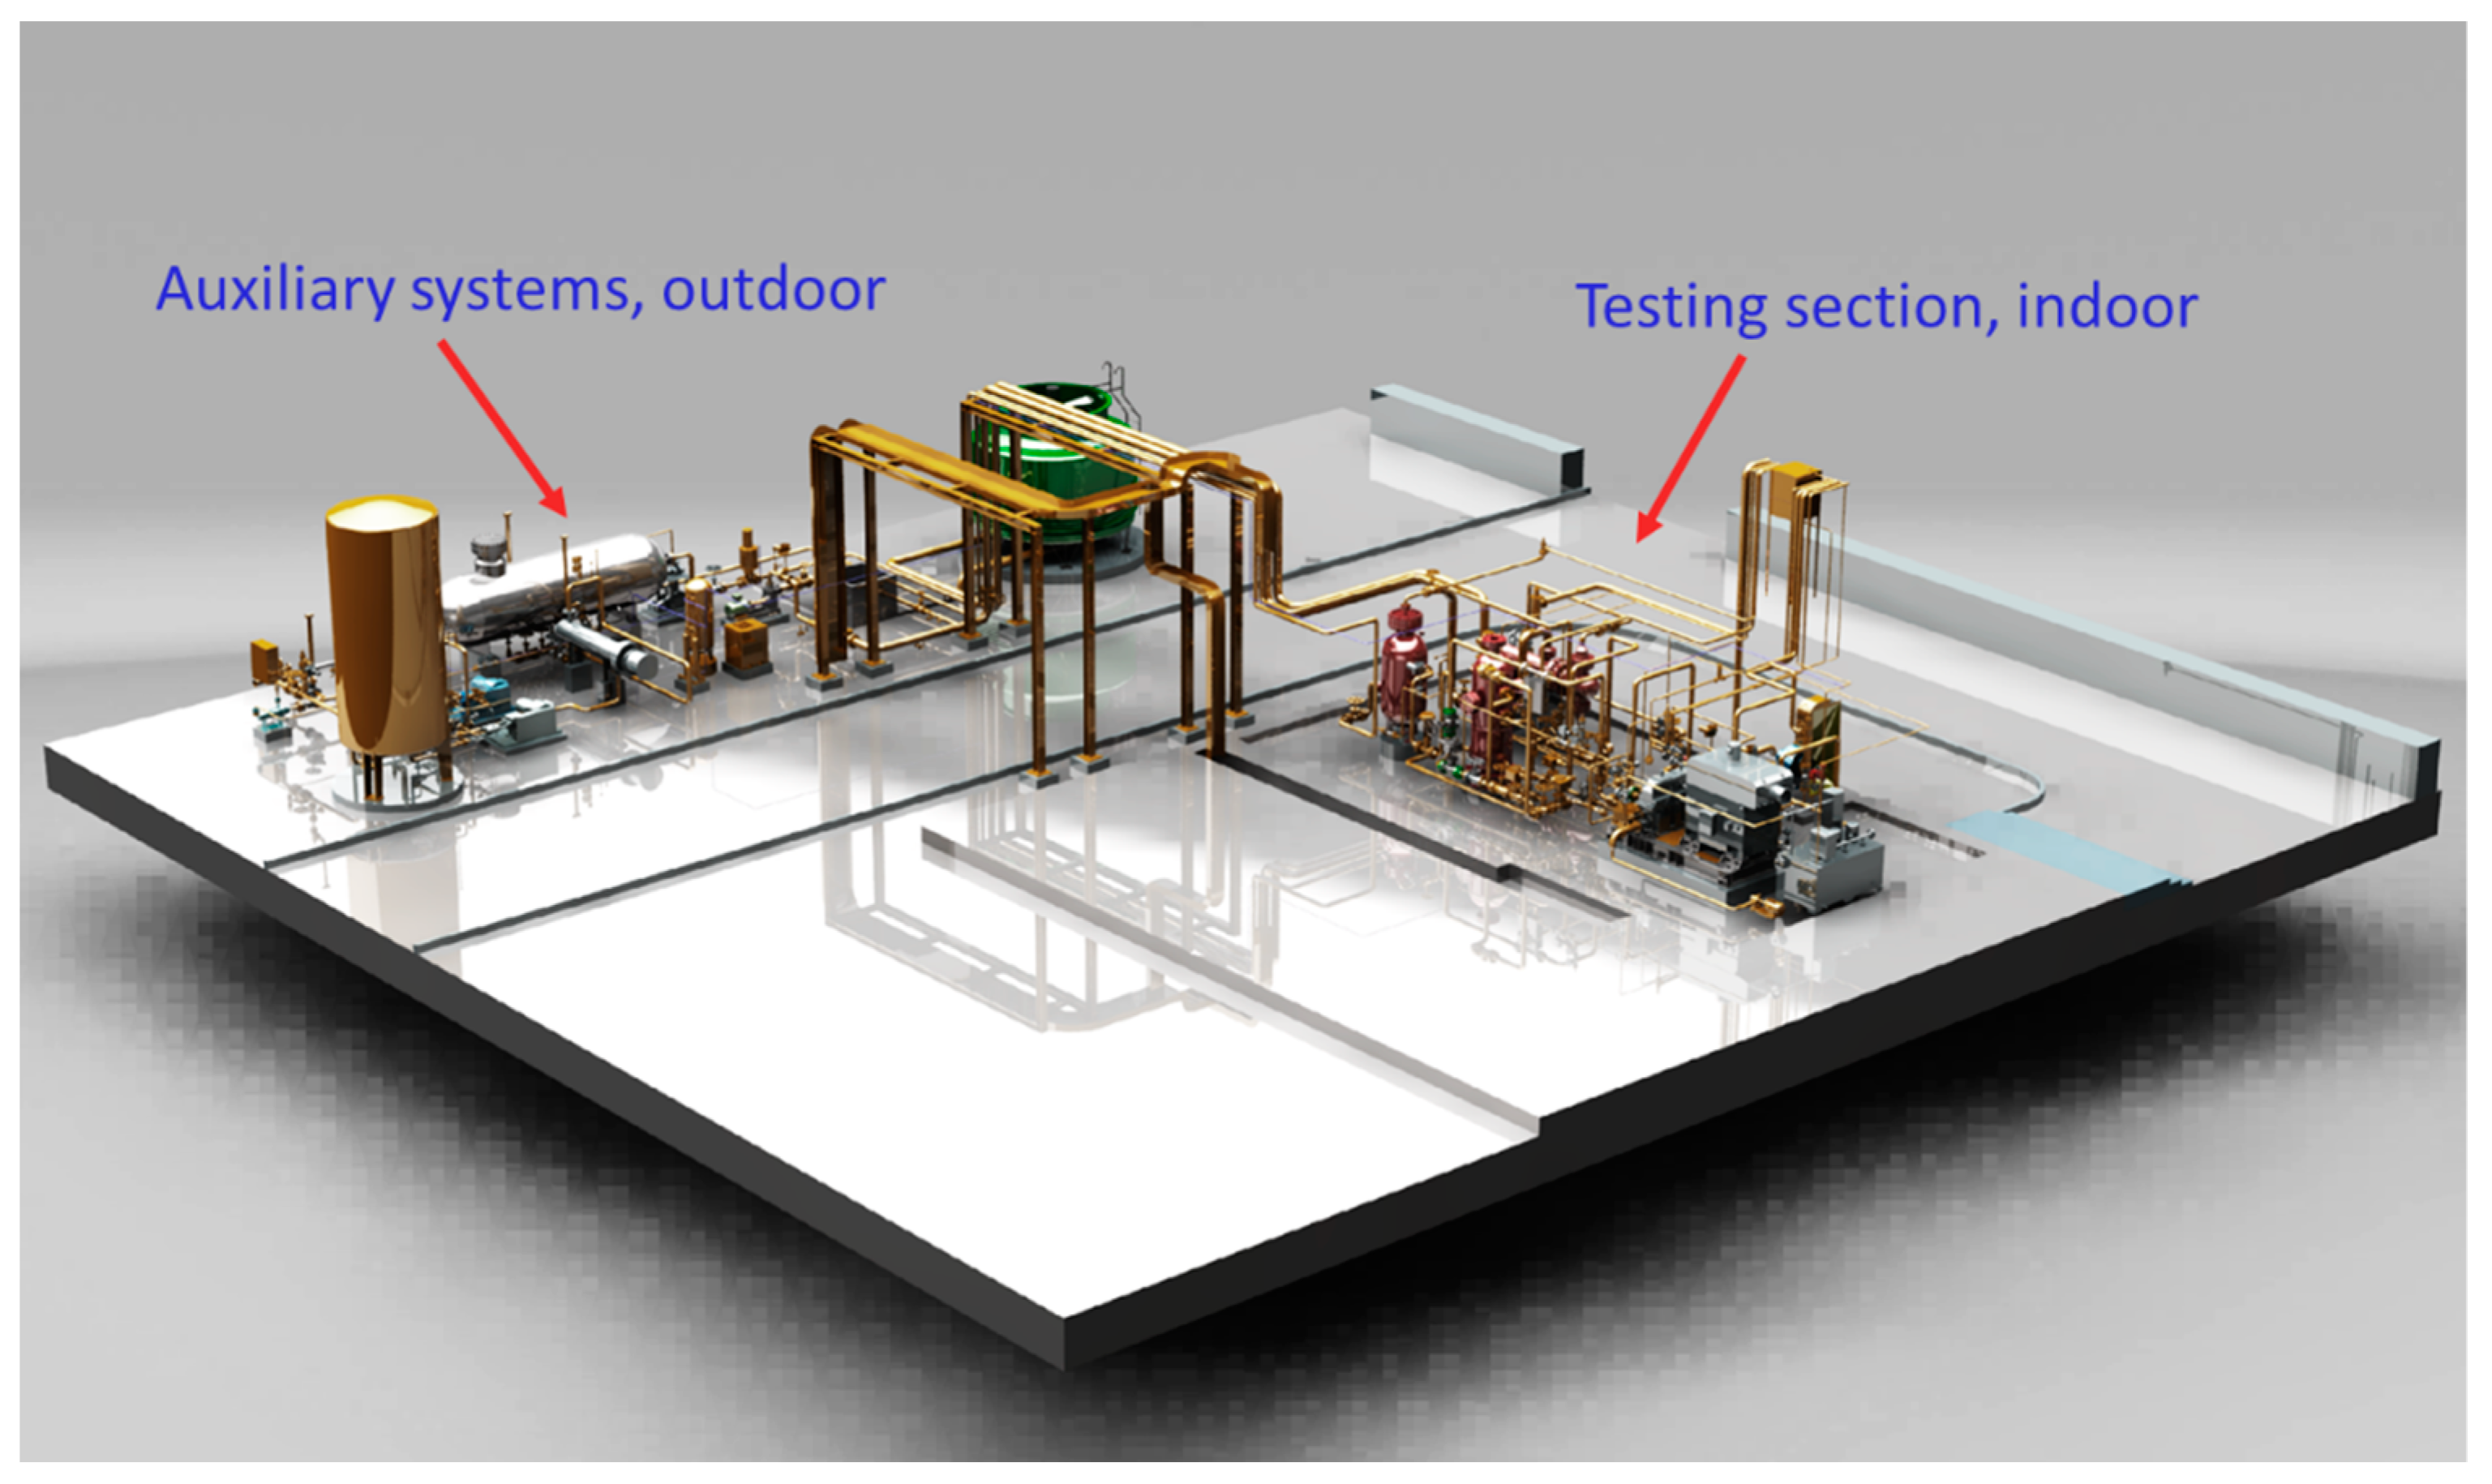
3.1. The MWe Scale sCO2 Compressor Test Loop

A general experimental platform for the MWe sCO2 compressor was built by CAS (Chinese Academy of Sciences). The main performance indexes of the experimental platform are shown in Table 4. Its power system has a capacity of 40,000 RPM and 800 kW maximum power. Its test system allows a maximum of 25 kg/s flow, and the inlet experimental condition in the range of 0~50 °C and 0~10 MPa covers the test environments of different inlet states, such as the supercritical phase, critical phase, gas phase and liquid phase.
The general experimental platform for the MWe sCO2 compressor, as shown in Figure 6, includes the compressor test unit, sCO2 filling system, measurement and lubrication system and cooling system.
The compressor test unit is the core of the general experimental platform, including compressor and gearbox, rotor, pipe heater and buffer tank. The sCO2 filling system prepares, stores and replenishes sCO2 for compressor experiments. The lubricating system provides suitable lubrication oil for high-speed equipment (compressor and high-speed gear box). The cooling unit provides cooling water for the equipment in the experimental platform.
Figure 7 shows the 3-D graphic model of the experimental platform. The outdoor area of the experimental platform is the auxiliary system which mainly includes the sCO2 filling system and part of the cooling system. The indoor area is the testing section which is mainly used for placing the compressor test system and lubricating oil system.
As shown in Figure 8, the compressor test system is sketched, including the compressor, sCO2 tank, electric heater, buffer tank, water cooler, surge tank, inlet pressure relief valve (EV007), outlet regulating valve (EV015), system vent valve (EV017), compressor inlet vent valve (EV010) and compressor outlet surge prevention valve (EV014).

3.2. Measuring Instruments

The experimental platform mainly measures the compressor mass flow, temperature and pressure. The parameters of the temperature and pressure sensors are shown in Table 5. Particularly, mineral insulated resistance thermometer detectors (RTDs) were used, which can withstand high pressure (0~25 MPa).
As the sCO2 compressor operates near the critical point, the physical properties change dramatically; using traditional orifice plate or vortex flowmeter to measure the compressor inlet flow will result in significant measurement errors, while the Coriolis force mass flowmeter is not sensitive to the changes of physical properties [12]. This test loop therefore makes use of a Coriolis force mass flowmeter with a density measurement precision of better than 0.002 g/cm3, and a mass flow measurement accuracy of better than 0.2% FS, as is shown in Table 6.
The total pressure ratio and isentropic efficiency are the key parameters in the sCO2 compressor test, and their equations are given in Equations (1) and (2); however, both are indirectly parameters whose accuracy is affected by the accuracy of relevant directly measured parameters. Lee et al. investigated the experimental uncertainty of sCO2 centrifugal compressors, and the uncertainties of the experimental total pressure ratio and isentropic efficiency will be estimated on this basis [13].
P r = P 02 P 01
η = h 02 s h 01 h 02 h 01 × 100 %

4. Results

4.1. Historical Curves

The experimental parameters for the compressor’s inlet mass flow, speed, inlet temperature, inlet pressure, outlet temperature and outlet pressure will be presented in detail. To enable the creation of uniform experimental historical curves, these experimental parameters are dimensionless, and the suitable dimensionless parameters are defined in Table 7. Tref is set as the critical temperature (304.13 K), Pref is set as the critical pressure (7.38 MPa), Nref is set as the design speed (40,000 RPM), Mref is set as the design mass-flow (16 kg/s).
Figure 9 shows the experimental history of a single-stage compressor from start-up to shut-down. In this experiment, the target speed is 31,000 RPM, which is limited by compressor shaft vibration. The compressor begins with a low temperature, low pressure and gas inlet condition. With increased speed, the inlet temperature, pressure and mass flow rise; then, the inlet condition transitions from a gaseous to a supercritical state. The experimental results demonstrate that the single-stage compressor can run steadily under various inlet conditions. In order to obtain the experimental performance curve, the back pressure valve of the compressor opens to the maximum at 30,000 RPM experimental condition, and gradually decreases the opening aperture until it approaches the surge point of the compressor at 32,000 RPM. During this process, the mass flow of the compressor decreases gradually, and the outlet pressure of the compressor increases significantly.

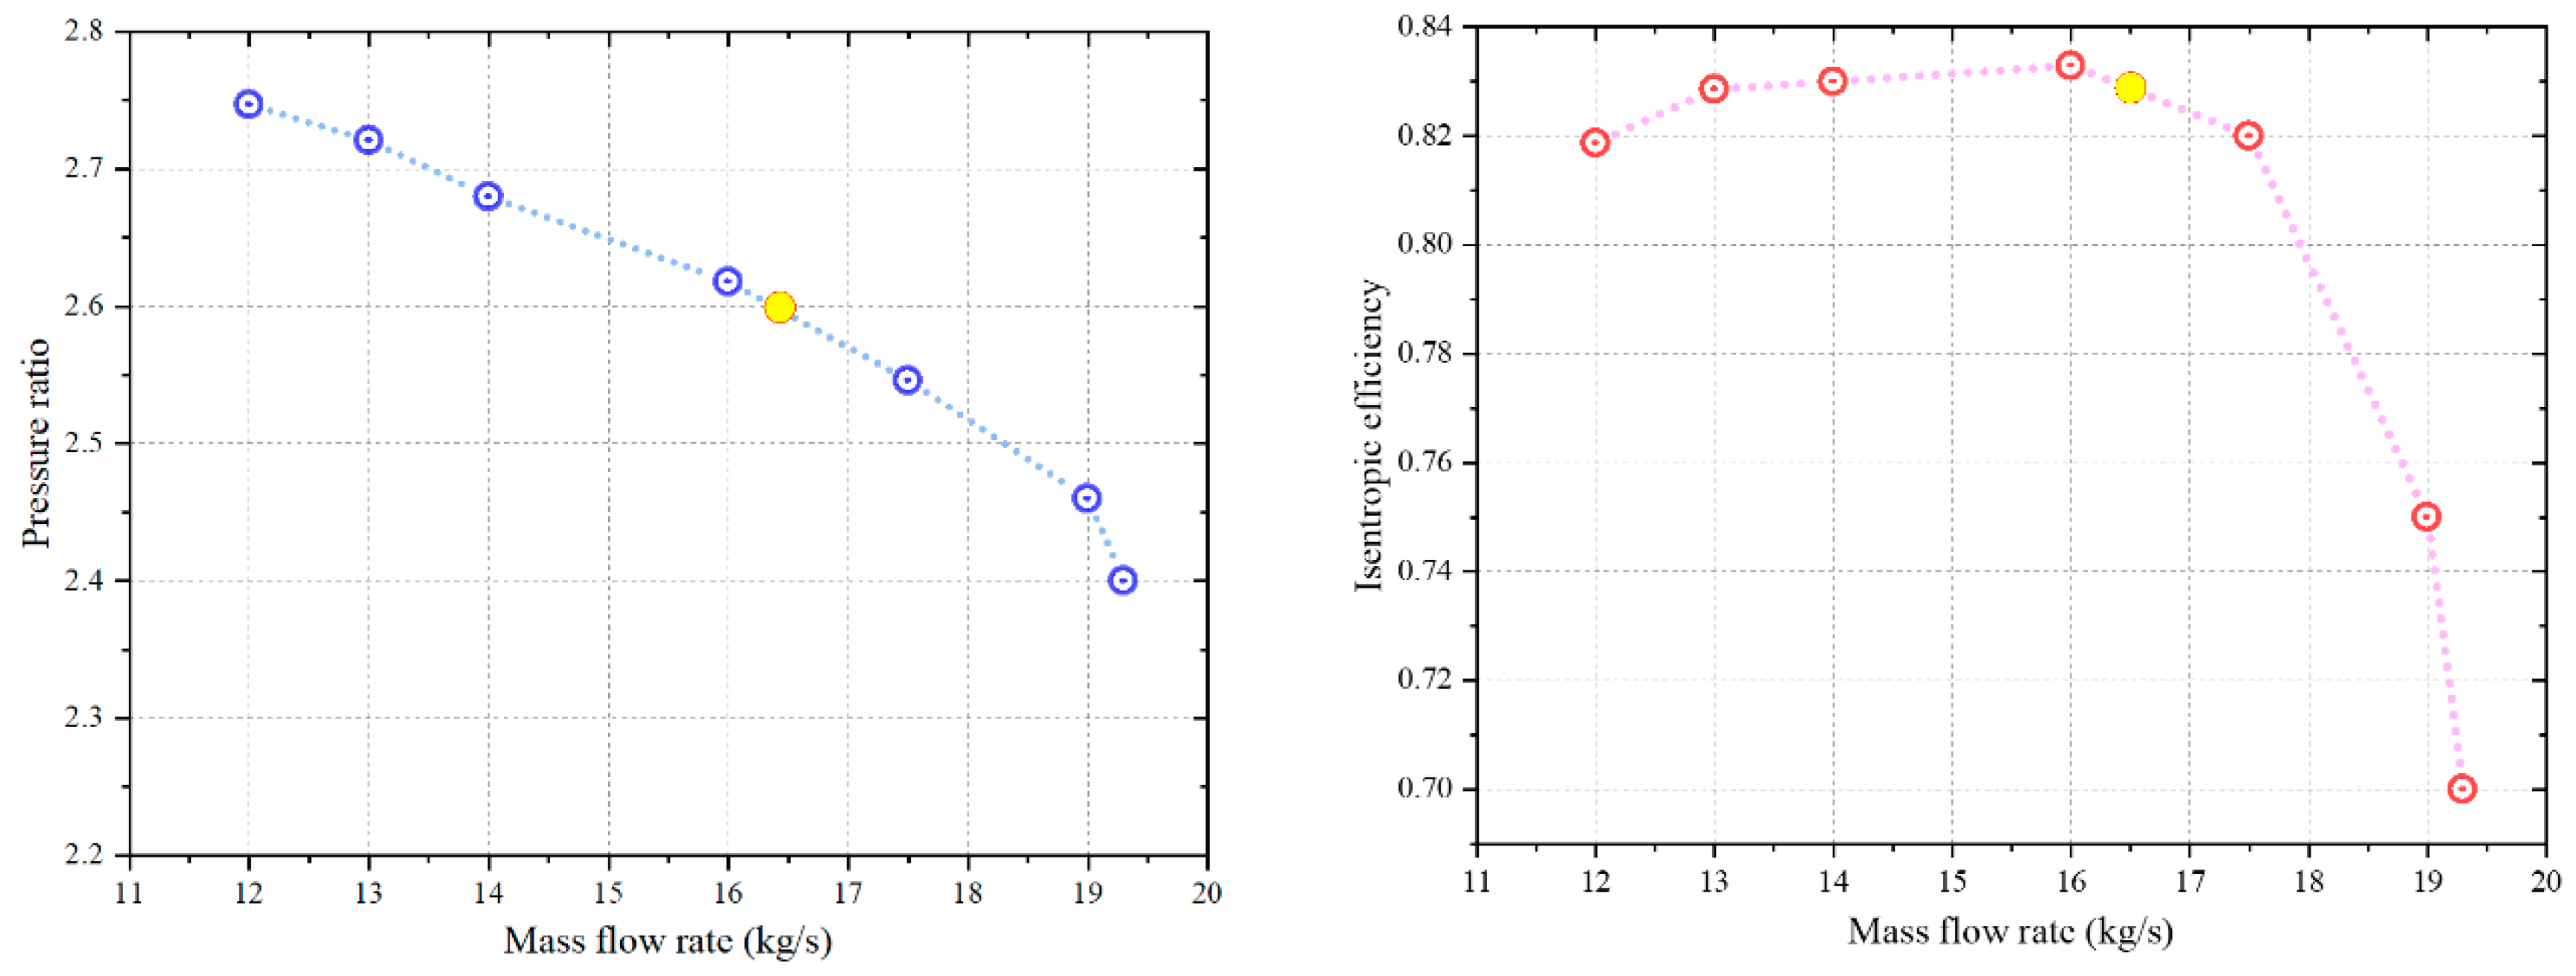
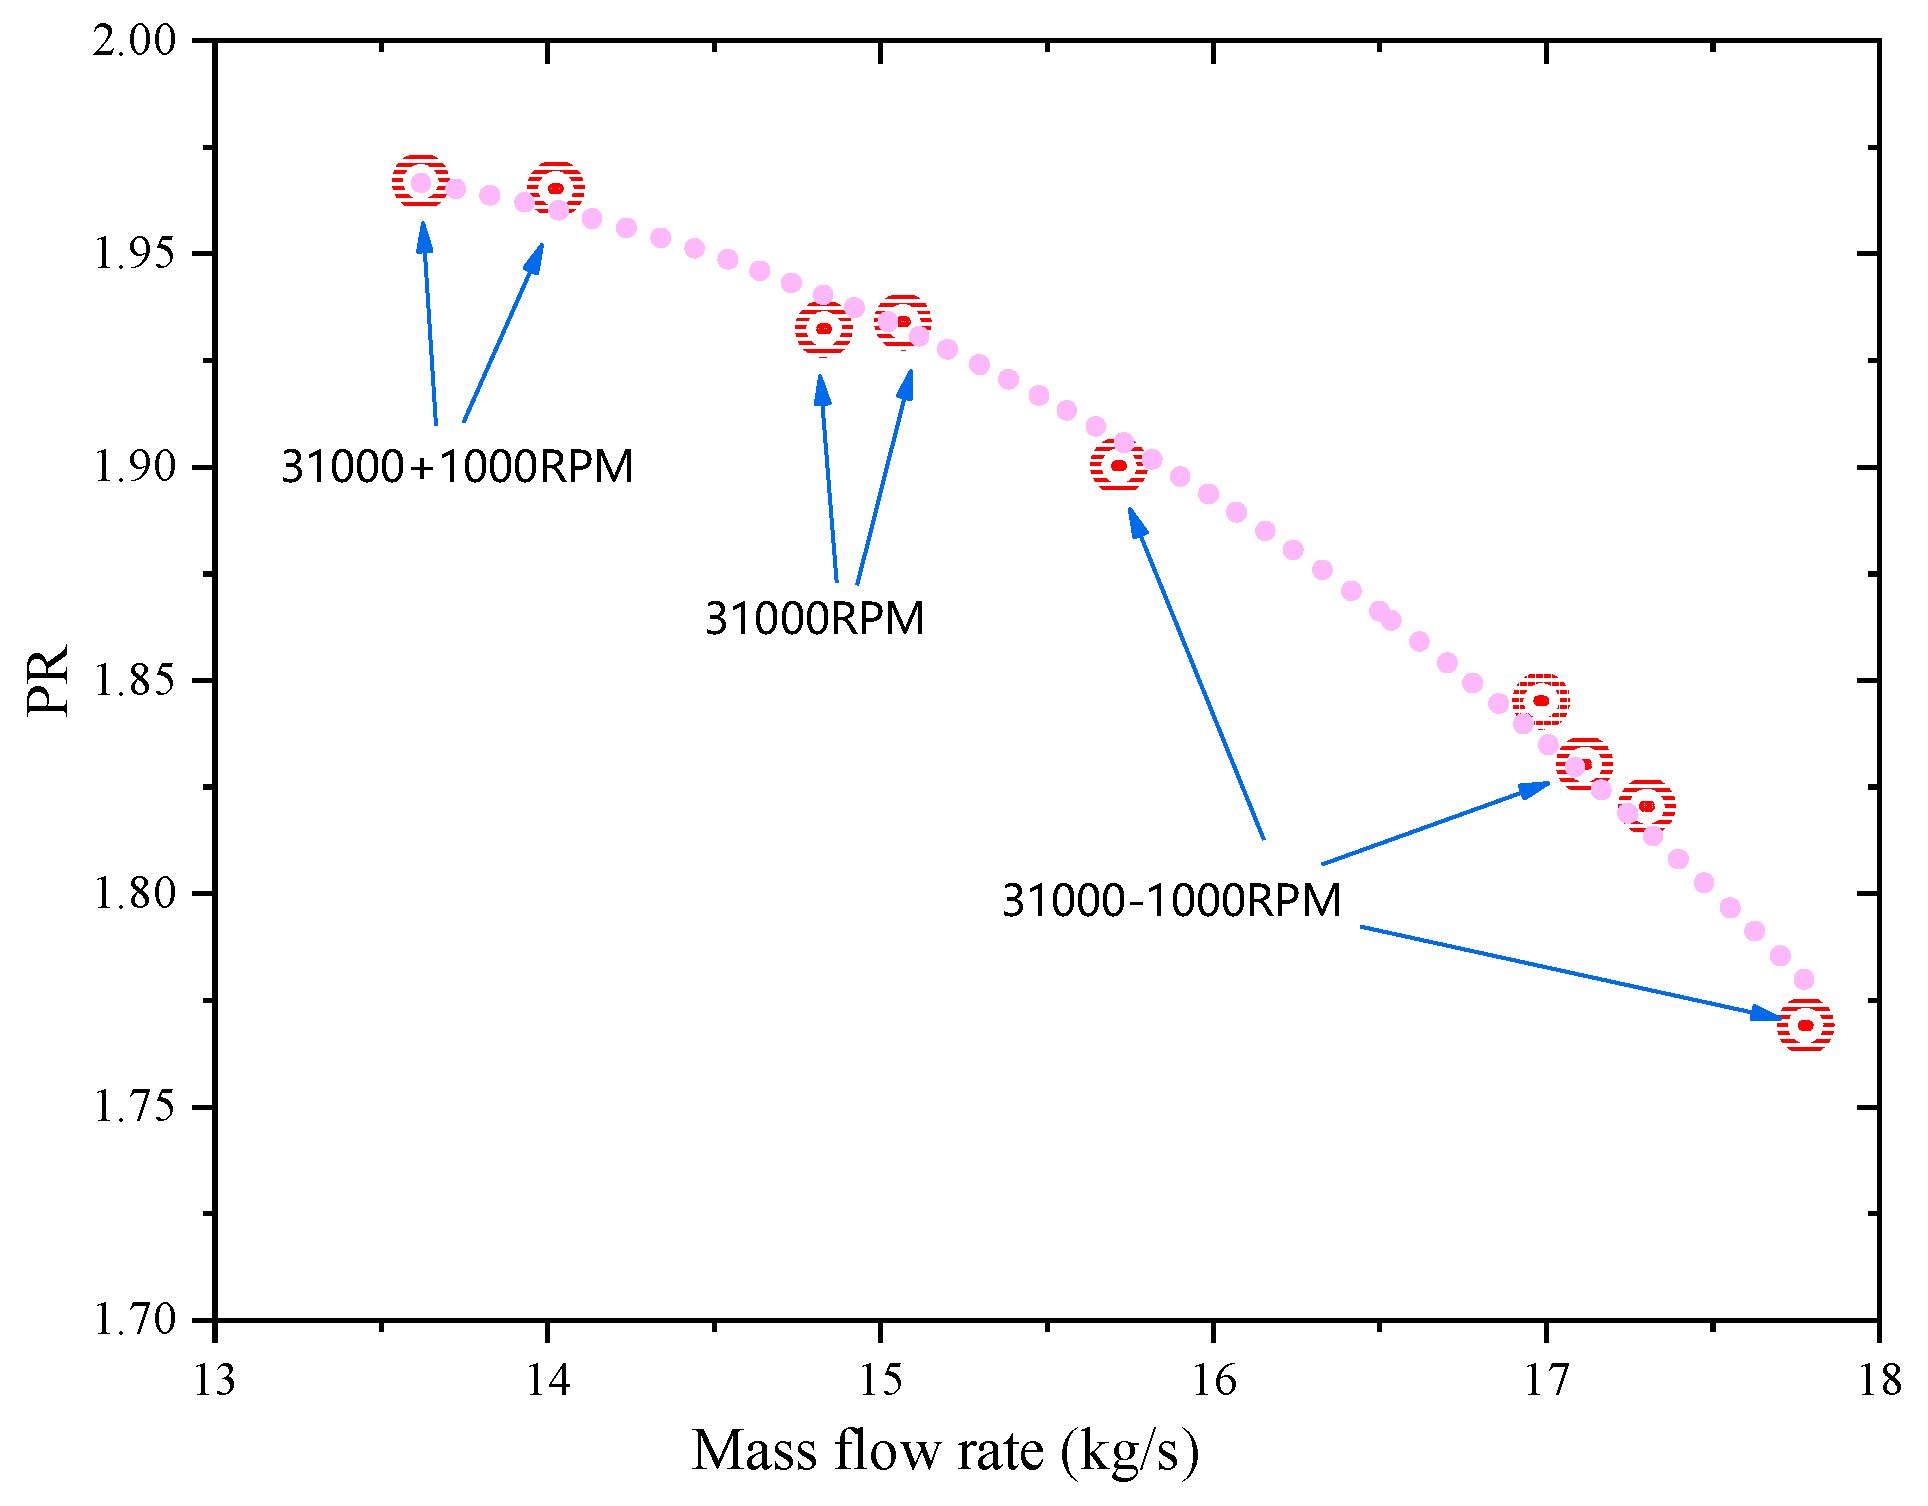
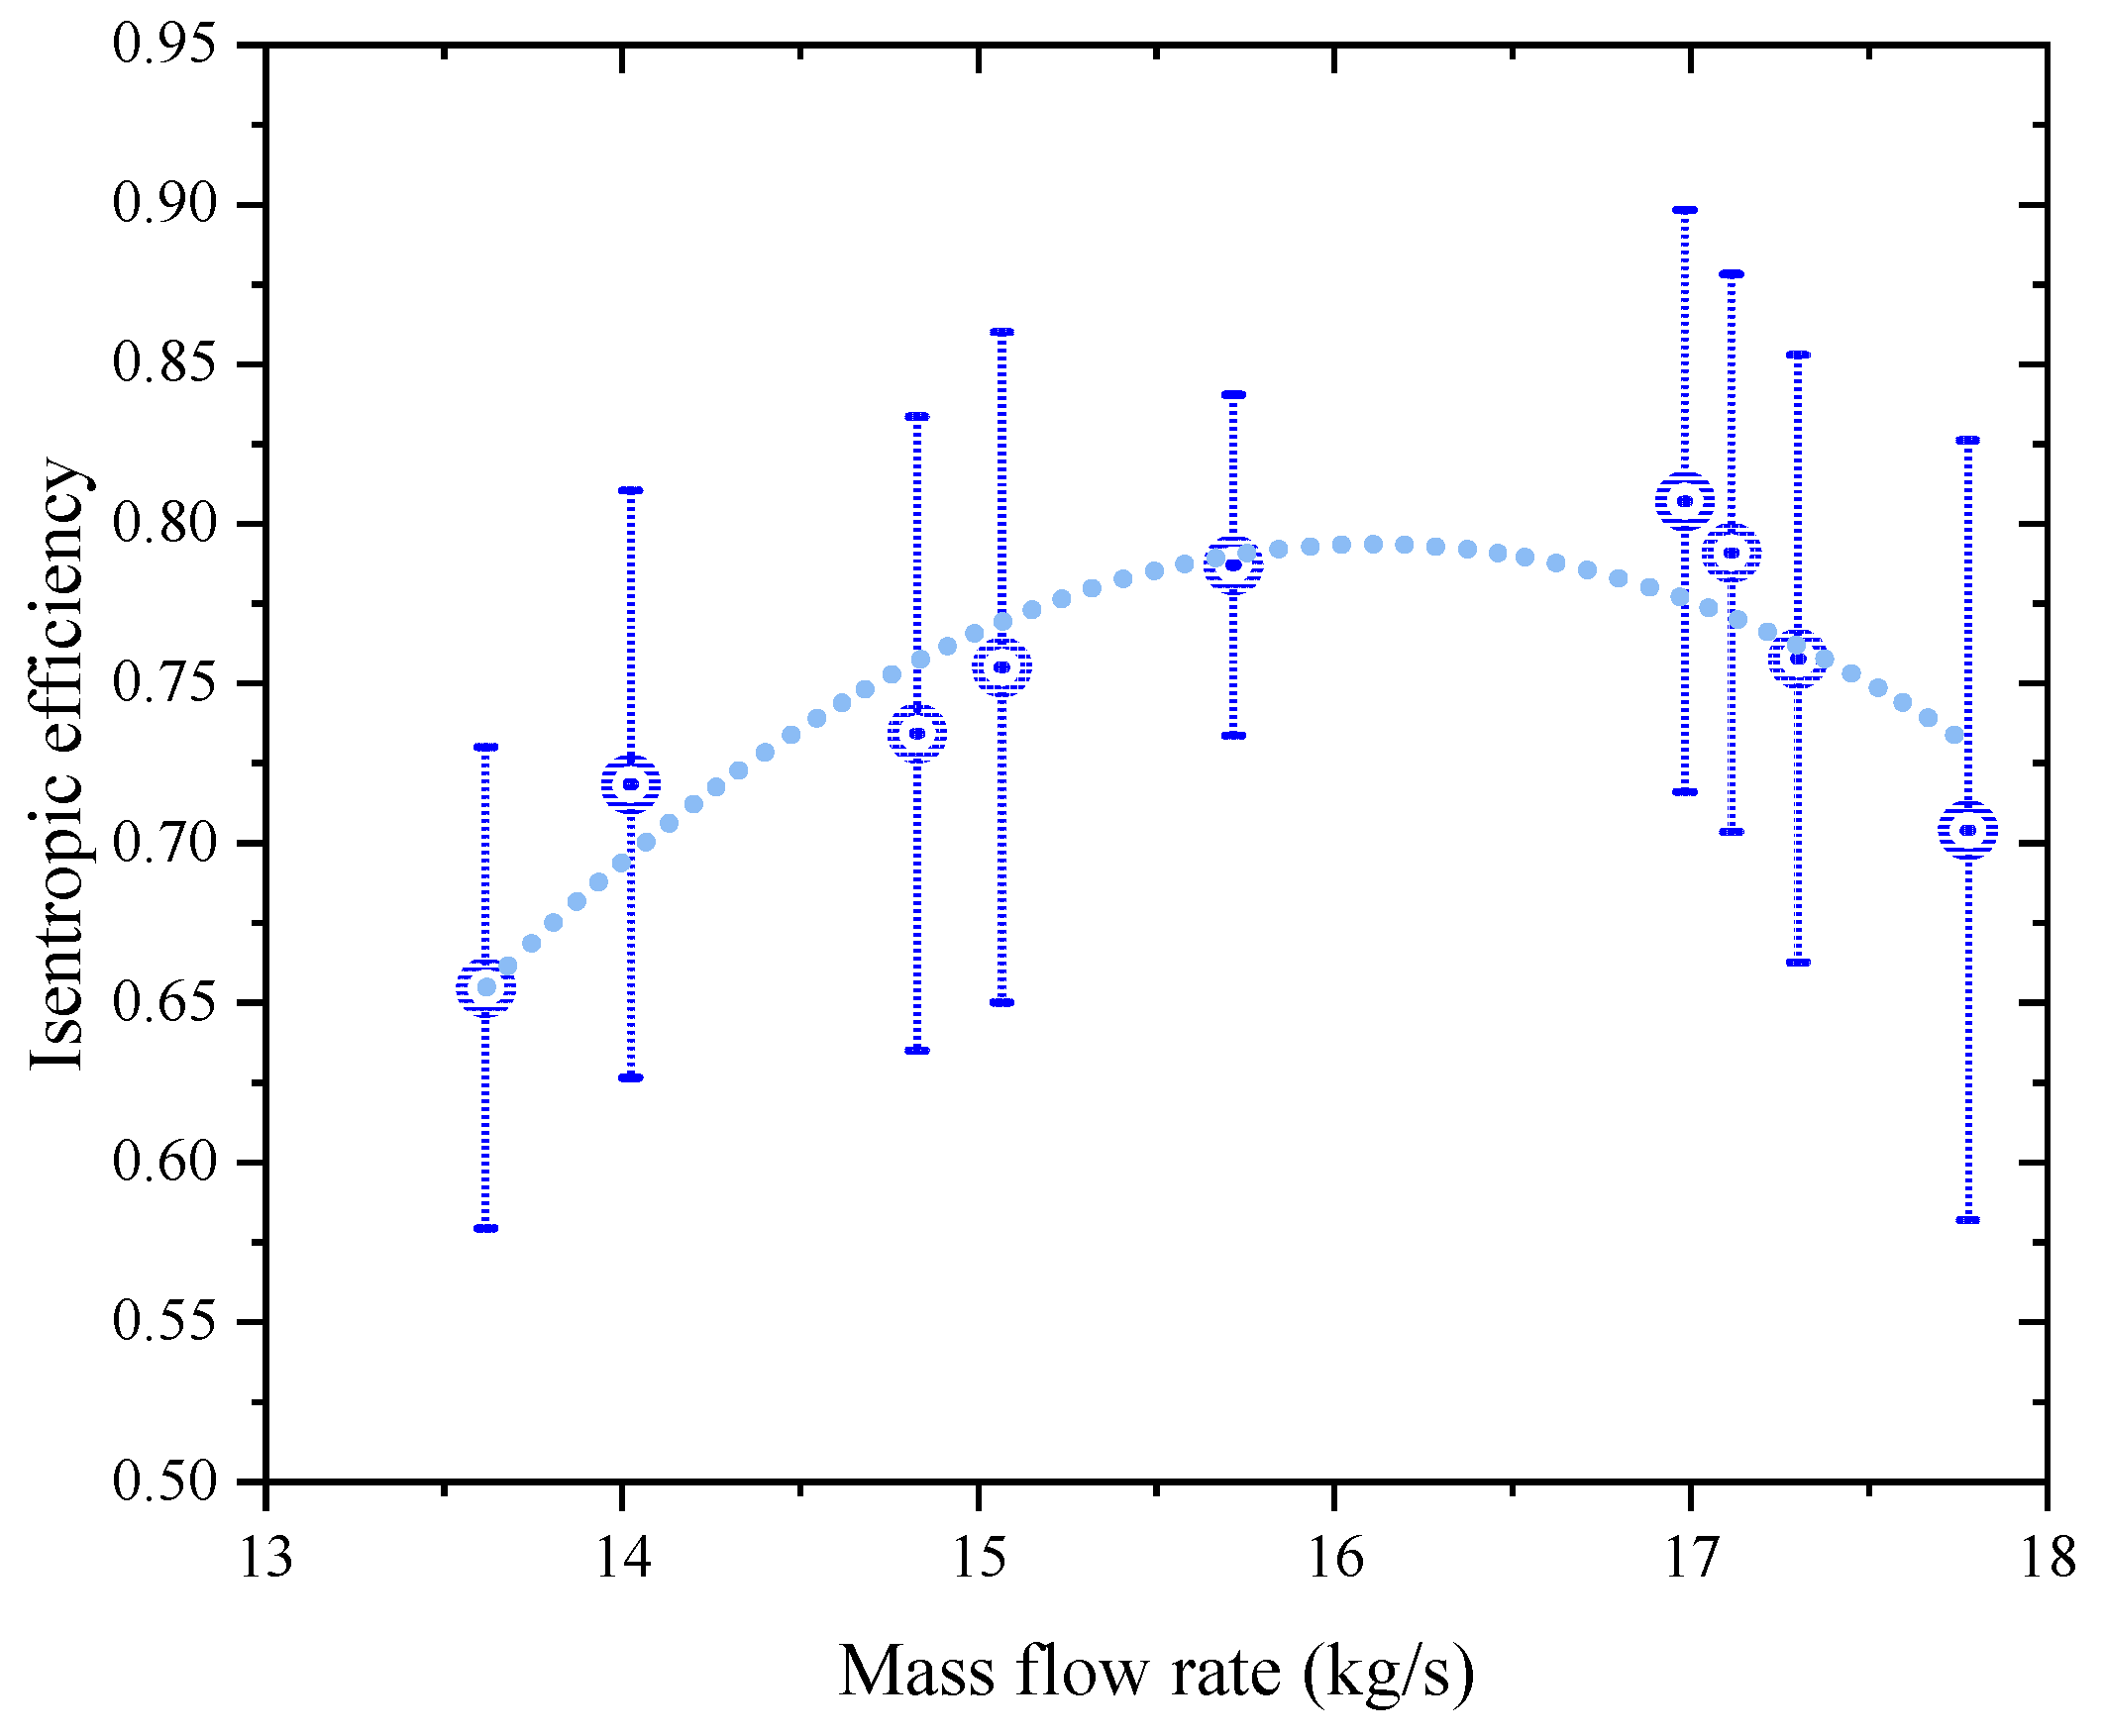
4.2. Performance Curves

Based on the experimental data near 31,000 RPM given in Figure 9, the pressure ratio and isentropic efficiency performance curve of the sCO2 single-stage centrifugal compressor are plotted in Figure 10 and Figure 11. The single-stage centrifugal compressor achieves a maximum pressure ratio close to 2.0, and the mass flow of the compressor t is maintained at about 13.5 kg/s, which is close to the surge boundary of the compressor. The maximum experimental flow rate is about 18 kg/s, at which the pressure ratio is 1.75, close to the choke boundary.
Figure 11 shows the isotropic efficiency performance curve of 31,000 ± 1000 RPM. It can be seen that the isentropic efficiency of the compressor near the surge boundary is as low as 0.65, the isentropic efficiency near the choke boundary is 0.70, and the compressor reaches the maximum isotropic efficiency of 0.8 at about 16–17 kg/s. It should be noted that inlet and outlet parameters, particularly temperature, have significant influence on the calculation accuracy of isentropic efficiency. According to Equation (2) and Lee’s uncertainty calculation method [13], Figure 11 shows the isentropic efficiency’s uncertainty at 31,000 ± 1000 RPM. As can be seen in Figure 11, the uncertainty of isentropic efficiency is approximately ±0.1, which may be unsuitable for quantitative analysis.

5. Analysis and Discussion

5.1. Inlet Condition

In the test shown in Figure 9, the compressor goes through the gas, gas–liquid mixture, and supercritical state processes. The supercritical inlet state will be investigated further in this section for experimental data approaching 31,000 RPM. Despite the fact that there is no recognizable phase change process at 31,000 RPM, the supercritical state fluctuates according to its physical properties. It can be further classified as supercritical-liquid-like (Sc-liquid-like) phase and supercritical-gas-like (Sc-gas-like) phase according to the pseudo-critical line.
In Figure 12, the yellow dot represents the design point, the green line the pseudo-critical line, and the pink line the critical line. The design point can be seen to be on the pseudo-critical line. The inlet condition of this experiment, on the other hand, deviates slightly from the design point; all fall in the supercritical-liquid-like region, meaning that if condensation takes place, the liquid phase will have a high mass fraction and the gas phase will occupy the space of the liquid phase. The detailed condensation phenomenon will be analyzed in Section 5.4.

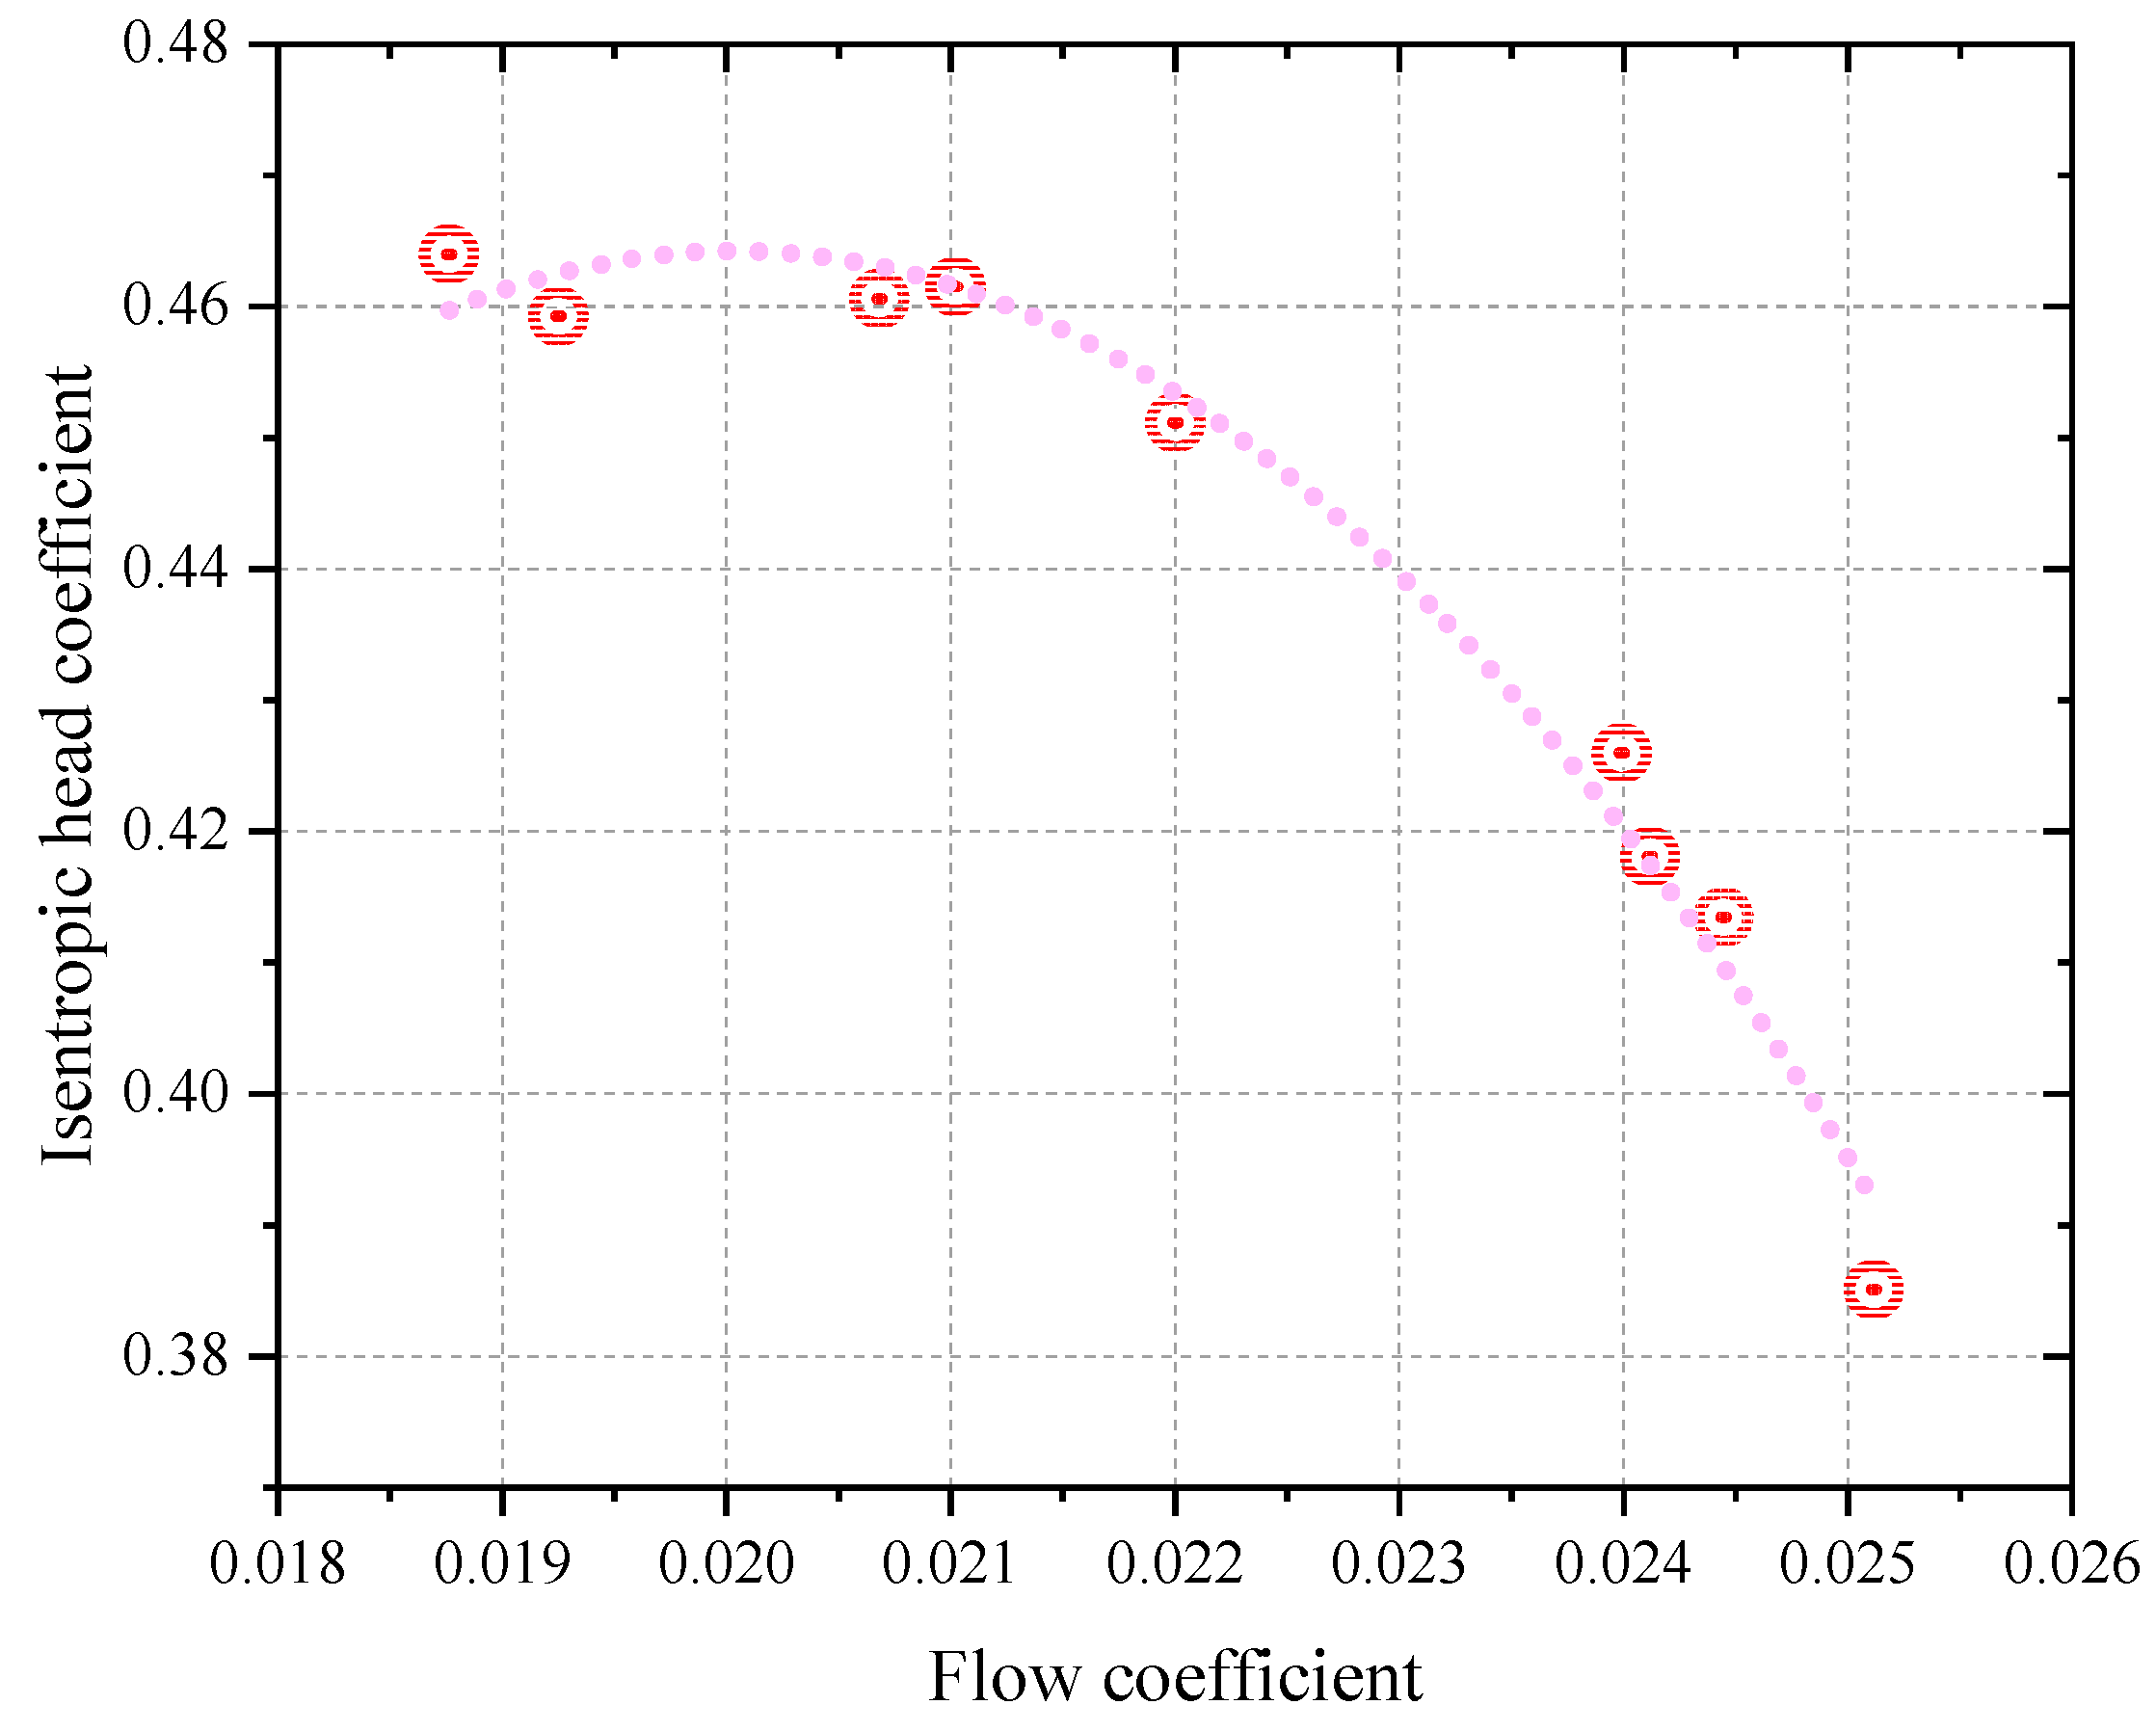
5.2. The Dimensionlessness of Experimental Results

Even though the CO2 is in the supercritical-liquid-like region at speed around 31,000 RPM, as is shown in Figure 12, the inlet condition is still different. Additionally, it mainly causes the change of inlet density, thus affecting the internal flow of compressor. In order to eliminate the influence of the inlet condition on the experimental analysis of compressor, a dimensionless parameter reflecting the internal flow characteristics of compressor is attempted, which includes the change of inlet density of the compressor, instead of the mass flow highly related to the inlet density. The dimensionless parameter is the flow coefficient commonly used in the field of turbomachinery. The pressure ratio is replaced by the dimensionless parameter isentropic head coefficient reflecting the compressor’s work capacity [14].
Flow coefficient:
φ = Q i n 1 4 π D 2 2 U 2
Isentropic head coefficient:
ψ s = Δ h s U 2 2
Replacing the pressure ratio and mass flow with the dimensionless parameters mentioned above, the dimensionless performance curves are shown in Figure 13 and Figure 14. The obtained dimensionless performance curves are more valuable for analysis when the inlet conditions and small speed differences are normalized compared with the original curves.
From Figure 13, it can be seen that the flow coefficient ranges from 0.019 to 0.025, which belongs to the small flow coefficient condition [15,16]. The maximum isentropic head coefficient is 0.46 close to the surge boundary, and the minimum is 0.38 close to the choke boundary. The flow coefficient reaches its peak efficiency near φ = 0.022~0.023. Given the uncertainty in Figure 11, the maximum isentropic efficiency is no less than 0.72. The determination of these three representative dimensionless experimental points (maximum efficiency point, near surge point and near choke point) is extremely useful for sCO2 compressor performance analysis and model optimization. Furthermore, the location of these three points can be compared with the design performance curve, which may provide guidance and evidence for the study of operation boundary, and is preliminarily discussed in Section 5.3 and Section 5.4.

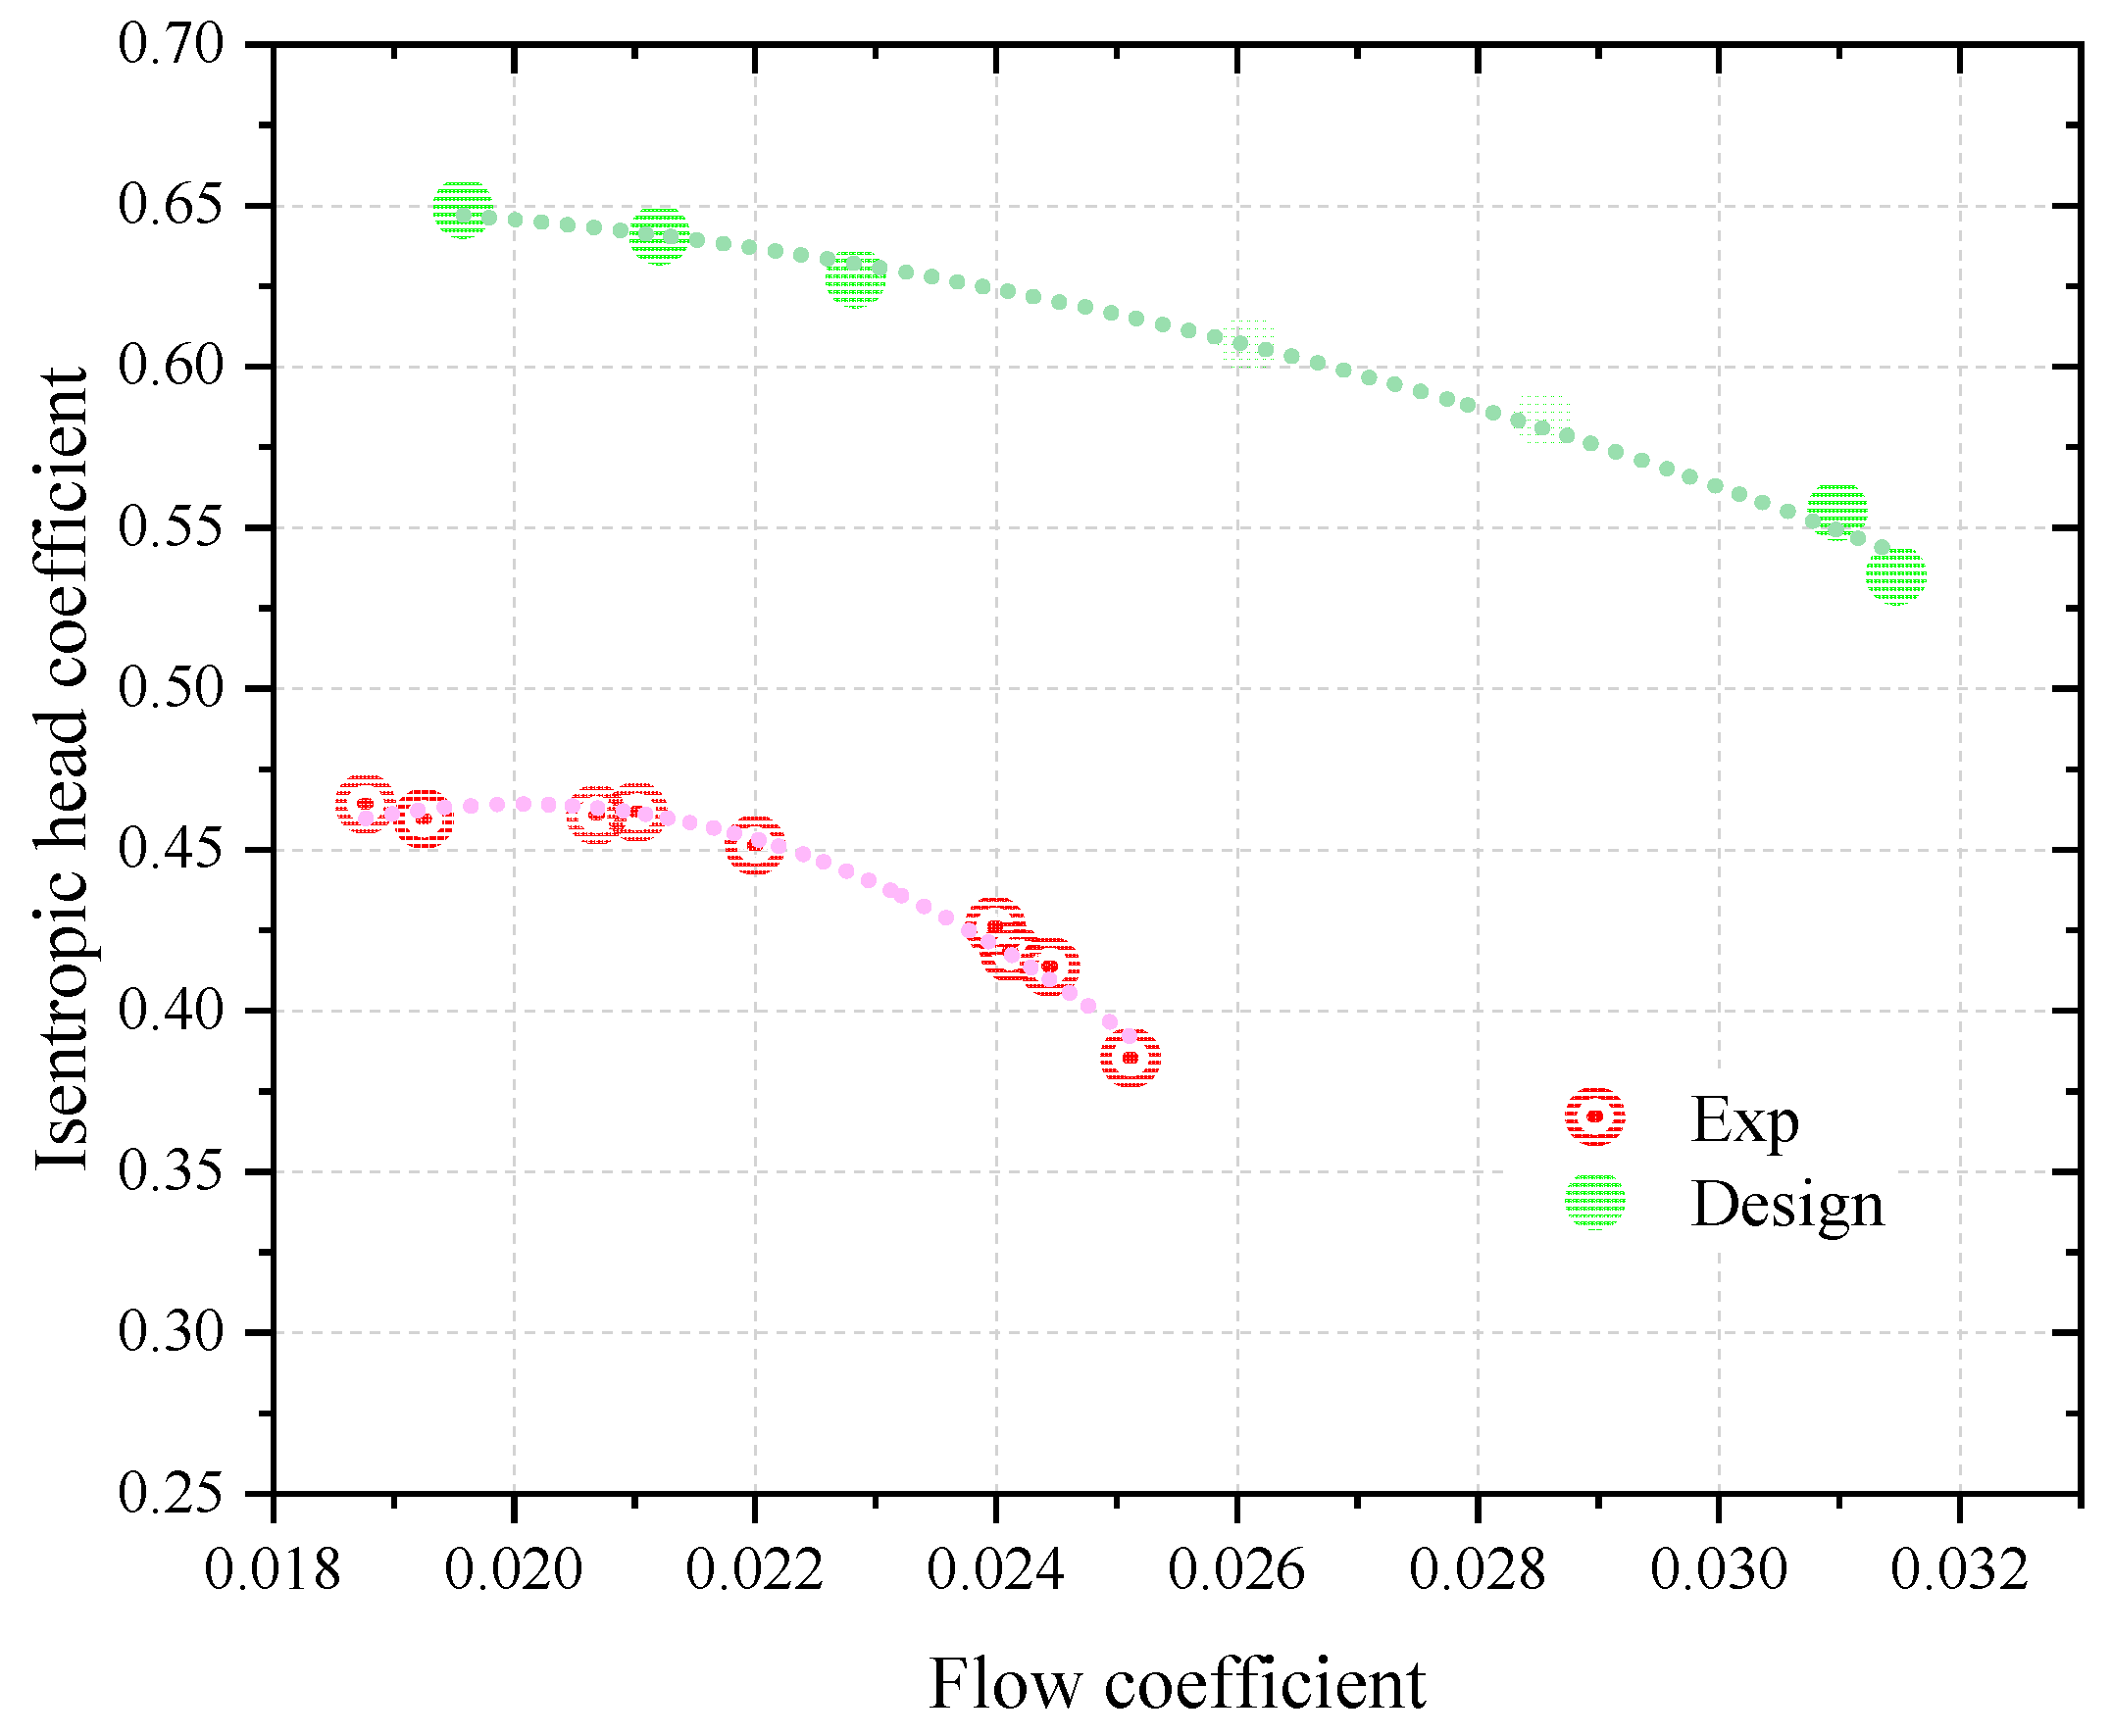
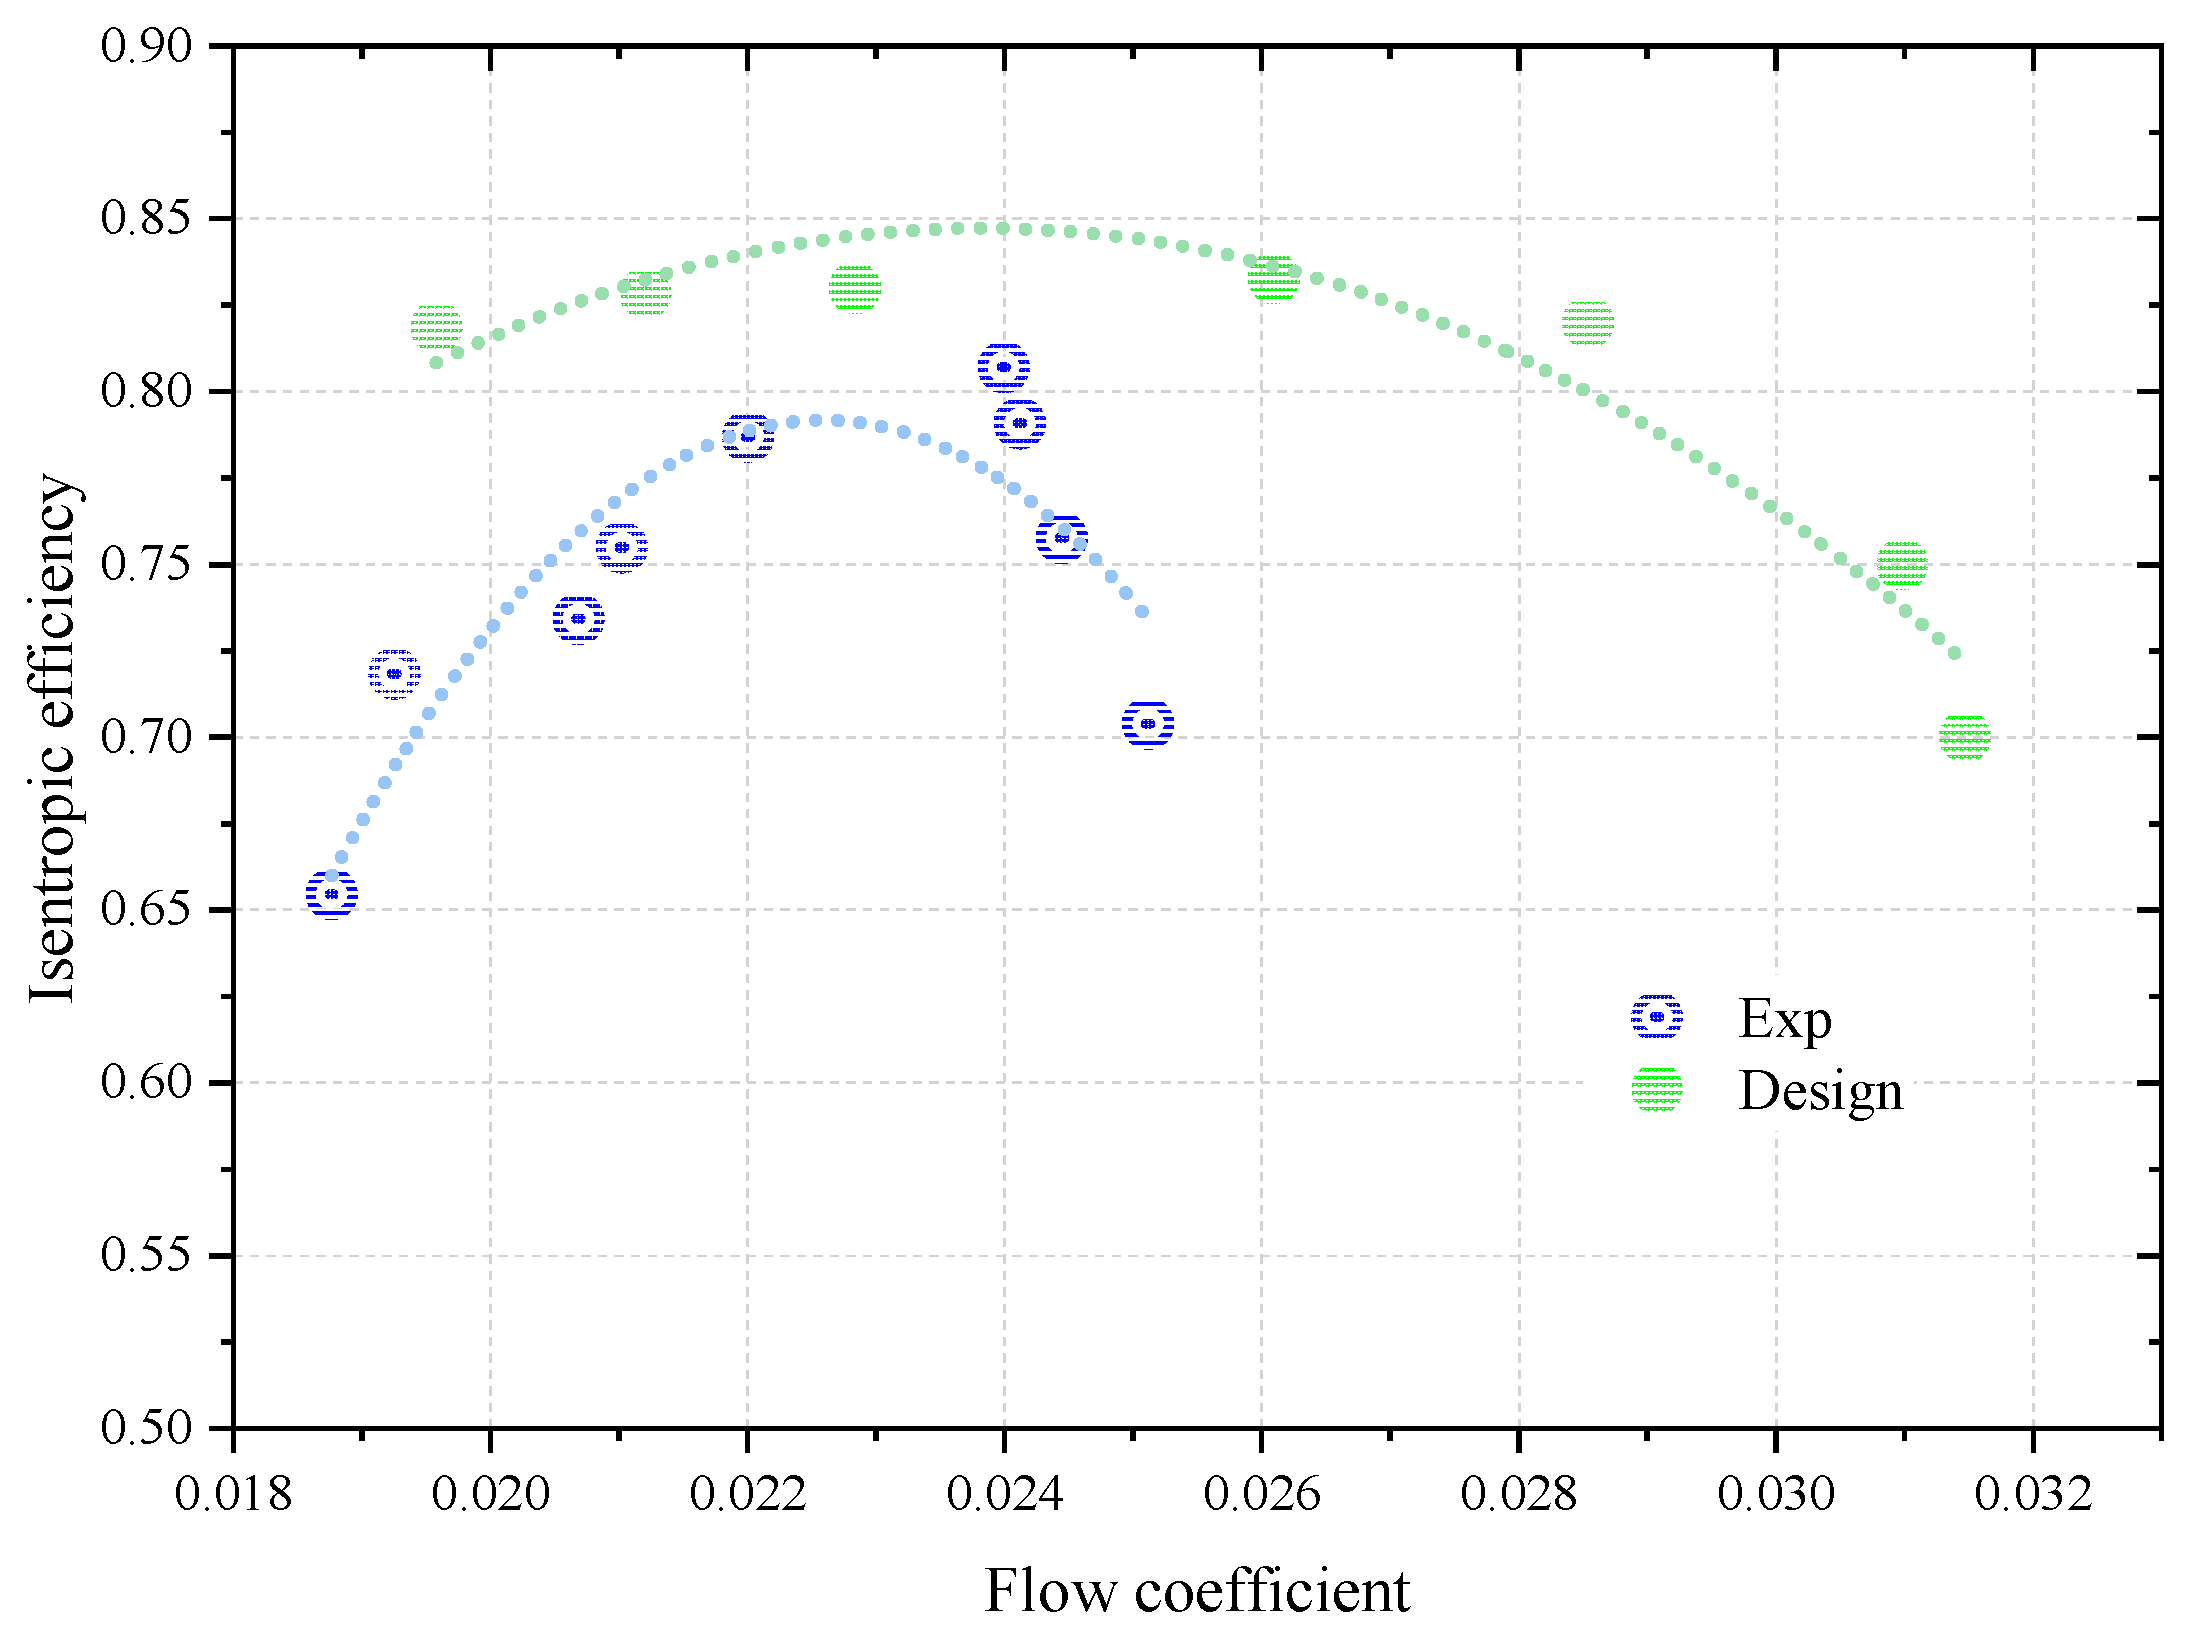
5.3. Comparison of the Experimental and Design Performance Curves

The main differences between the experimental and design conditions are as follows:
  • The experimental inlet condition, located in the supercritical-liquid-like region rather than the critical line.
  • The tip clearance of the experimental impeller is 0.43–0.45 mm, which is larger than the design value (0.25 mm) caused by the abrasion of the metallic coating at shroud, as is shown in Table 8.
In order to explore the influence of tip clearance and inlet condition on the performance, Figure 15 and Figure 16 give the comparison of the experimental and design curves of the single-stage centrifugal compressor. Obviously, due to the larger tip clearance, the leakage loss of inner clearance of impeller increases, and the isentropic head coefficient and isentropic efficiency of the experimental results are significantly reduced compared with the design value [17,18,19]. Specifically, the isentropic head coefficient of the experimental curve is 0.2~0.25 lower than the design curve as a whole; the isentropic efficiency is 0.15~0.2 lower than the design efficiency in the blockage and stall boundary zone, and 0.05~0.01 lower near the design point.

5.4. Condensation Analysis

Blade leading-edge condensation is a unique phenomenon of sCO2 centrifugal compressors operating near critical point, which may have an impact on a compressor’s operation boundary and the fatigue life of blades. Generally, it is necessary to avoid leading-edge condensation as much as possible.
For the condensation of the blade leading-edge, Monge proposes the acceleration margin to condensation (AMC) Mach number, which calculates the isentropic static point where the saturation conditions would be met by modelling an isentropic expansion of the flow down to the saturation pressure/temperature [20]. However, due to the sudden change in the calculation of sound velocity in the two-phase region, the criterion of AMC Mach number may be distorted near pseudo-critical line. In this paper, the speed of condensation acceleration velocity (Vlimit) is used as shown in Equation (5), where hlimit is the enthalpy value corresponding to isentropic expansion to saturation state starting from inlet condition.
V l i m i t = h 01 h l i m i t
Figure 17 shows the condensation acceleration velocity (Vlimit) near the critical region. In the supercritical-gas-like region, the condensation acceleration velocity (Vlimit) is mainly influenced by both inlet temperature and inlet pressure; meanwhile, in the supercritical-gas-like region, condensation acceleration velocity (Vlimit) is mainly affected by inlet pressure, the influence of inlet temperature becomes negligible, and the condensation acceleration velocity (Vlimit) is the lowest near the critical point. Under certain inlet temperatures near critical temperature, the increase in condensation acceleration velocity (Vlimit) in the supercritical-liquid-like region is much lower than the decrease in condensation acceleration velocity (Vlimit) in supercritical-gas-like region, as is the increase in inlet pressure.
Next, condensation at the experimental inlet is analyzed using Figure 17. The inlet pressure near the choke boundary (@ 29,000 RPM) is lower than that near surge boundary (@ 31,000 RPM) and all inlet conditions are located at supercritical-liquid-like region; therefore, the condensation acceleration velocity (Vlimit) near the choke boundary (@ 29,000 RPM) is lower, and only 50 m/s. In addition, near the choke boundary, the relative speed of sCO2 in the inner flow channel increases, which further aggravates the condensation phenomenon.
Figure 18 shows the dryness distribution of test point near the choke boundary (@ 29,000 RPM) and of the test point near the surge boundary (@ 31,000 RPM), which is obtained using a numerical simulation method [21,22,23]. It can be seen that a large area of condensation appears, extending from the leading-edge of the blade top to 50% of the downstream section for the condition near the choke boundary (@ 29,000 RPM), because of the suction effect of the blade tip clearance; meanwhile, the figure only shows a small area of condensation at the blade leading-edge for the condition near the surge boundary.
Zhu at.al analyzed the condensation process of sCO2, where the inlet pressure is set to 10 MPa. As is shown in Figure 19, the density drop rate of supercritical-liquid-like condition is significantly higher than that of the supercritical-gas-like condition [24]. Therefore, the condensation of supercritical-liquid-like condition will lead to a sudden increase in volume flow in the inner flow channel, and a rapid increase in relative velocity, which may aggravate the throat blockage. The phenomenon in Section 5.3, that the surge boundary of the experimental performance curve is much lower than that of the design performance curve, can be explained appropriately.
Figure 20 shows the impeller of the single-stage compressor after tests. It can be seen that the surface of the impeller blade is smooth and without corrosion. Up to now, the influence of inlet condensation on blade life has not been found. Much more experimentation, especially long-time testing, is needed to further validate this conclusion.

6. Conclusions

Based on a 1 MW sCO2 power generation cycle, a sCO2 single-stage centrifugal compressor with a speed of 40,000 RPM and a pressure ratio of 2.5 was designed. Detailed parameters and the structural design of the compressor were also given. In order to carry out compressor test, a test platform was built, and its test ability and precision could meet the requirements of the experiment. An experiment of 30,000 ± 1000 RPM was analyzed, and the following conclusions were obtained:
(a) The single-stage compressor completes about 30,000 RPM upon performance curve testing, including near the surge point and close to the choke point. The mass flow range is 13.5~18 kg/s and the maximum experimental pressure ratio is close to 2.0.
(b) The inlet of the compressor is supercritical-liquid like, slightly deviating from the design point, and the tip clearance of the compressor is larger than the design value in order to ensure the safety of the experiment. In order to minimize the influence of the inlet condition as much as possible, the experimental results are made dimensionless by using a flow coefficient and isentropic head coefficient. The flow coefficient ranges from 0.019 to 0.025, which belongs to the small flow coefficient condition, and the maximum isentropic head coefficient is 0.46.
(c) Comparing the dimensionless experimental curve with the design curve, it was found that the isentropic head coefficient of the experimental curve is lower than the design value, which may be caused by the increase in the tip clearance. In addition, the experimental curves shift towards the boundary of small flow coefficient, and the choke boundary becomes obviously narrower.
(d) Condensation phenomena at the leading edge of impeller inlet were analyzed. It was found that the isentropic acceleration boundary velocity at the inlet of impeller is only 50 m/s under the experimental inlet condition, and the condensation area near the blocked boundary condition extends from the leading edge of inlet to 50% arc length. A wide-ranging condensation area occurs, and the sound velocity of two-phase fluid decreases. In addition, the condensation process was analyzed, and it was found that the average density of the liquid-like condensation process decreased, resulting in an increase in the volume flow rate and an increase in the relative speed of condensation section. Increasing relative velocity and decreasing sound velocity all aggravate local blockage of the impeller and narrow the blockage boundary of experimental curve.

Author Contributions

Conceptualization, Y.Z.; methodology, Y.Z.; software, Y.Z.; validation, Y.Z.; formal analysis, Y.Z.; investigation, Y.Z.; resources, X.G.; data curation, X.G.; writing—original draft preparation, Y.Z.; writing—review and editing, S.L., C.G.,Y.G. and Z.L.; visualization, Y.Z.; supervision, Y.J. and C.G.; project administration, Y.G.; funding acquisition, S.L. All authors have read and agreed to the published version of the manuscript.

Funding

This research was funded by National Natural Science Foundation of China (Young Scientistic Program) (52106279) and the Strategic Priority Research Program of the Chinese Academy of Sciences (Grant No. XDA21010201).

Institutional Review Board Statement

Not applicable.

Informed Consent Statement

Not applicable.

Data Availability Statement

Not applicable.

Conflicts of Interest

The authors declare no conflict of interest.

Nomenclature

units
3Dthree-dimensional
AMCAcceleration Margin to Condensation
CFDcomputational fluid dynamics
sCO2Supercritical CO2
Prpressure ratio
Ppressure, MPa
Ttemperature, K
Nrotor speed, RPM
Mmass flow rate, kg/s
Vvelocity, m/s
Qflow rate, m3/s
Henthalpy, kJ/kg
sentropy, kJ/(kg·K)
Greek symbol
ρdensity, kg/m3
ηcompressor efficiency
φflow coefficient
Ψhead coefficient
Subscription
P01inlet pressure, MPa
P02outlet pressure, MPa
T01inlet temperature, K
T02outlet temperature, K
h01inlet enthalpy, kJ/kg
h02outlet total enthalpy, kJ/kg
Vlimitcondensation acceleration Velocity, m/s

References

  1. Persichilli, M.; Kacludis, A.; Zdankiewicz, E.; Held, T. Supercritical CO2 power cycle developments and commercialization: Why sCO2 can displace steam. Power-Gen India Cent. Asia 2012, 2012, 19–21. [Google Scholar]
  2. Fleming, D.; Holschuh, T.; Conboy, T.; Rochau, G.; Fuller, R. Scaling considerations for a multi-megawatt class supercritical CO2 Brayton cycle and path forward for commercialization. In Proceedings of the ASME Turbo Expo 2012: Turbine Technical Conference and Exposition, Copenhagen, Denmark, 11–15 June 2012; American Society of Mechanical Engineers Digital Collection: Copenhagen, Denmark, 2012; pp. 953–960. [Google Scholar]
  3. Kimball, K.J.; Clementoni, E.M. Supercritical carbon dioxide Brayton power cycle development overview. In Proceedings of the ASME Turbo Expo 2012: Turbine Technical Conference and Exposition, Copenhagen, Denmark, 11–15 June 2012; American Society of Mechanical Engineers Digital Collection: Copenhagen, Denmark, 2012; pp. 931–940. [Google Scholar]
  4. Brun, K.; Friedman, P.; Dennis, R. Fundamentals and Applications of SCO2 (sCO2) Based Power Cycles; Woodhead Publishing: Cambridge, UK, 2017. [Google Scholar]
  5. Utamura, M.; Hasuike, H.; Ogawa, K.; Yamamoto, T.; Fukushima, T.; Watanabe, T.; Himeno, T. Demonstration of supercritical CO2 closed regenerative Brayton Cycle in a Bench Scale Experiment. In Proceedings of the ASME Turbo Expo 2012: Turbine Technical Conference and Exposition, Copenhagen, Denmark, 11–15 June 2012; American Society of Mechanical Engineers Digital Collection: Copenhagen, Denmark, 2012; pp. 155–164. [Google Scholar]
  6. Park, J.H.; Bae, S.W.; Park, H.S.; Cha, J.E.; Kim, M.H. Transient analysis and validation with experimental data of supercritical CO2 integral experiment loop by using MARS. Energy 2018, 147, 1030–1043. [Google Scholar] [CrossRef]
  7. Kima, S.G.; Choa, S.K.; Leea, J.I.; Leeb, J.; Leeb, S.W.; Addadc, Y.; Chad, J.E. External loss analysis of a supercritical CO2 radial compressor. In Proceedings of the Transactions of the Korean Nuclear Society Spring Meeting, Jeju, Korea, 18–19 May 2017. [Google Scholar]
  8. Ahn, Y.; Lee, J.; Kim, S.G.; Lee, J.I.; Cha, J.E.; Lee, S.W. Design consideration of supercritical CO2 power cycle integral experiment loop. Energy 2015, 86, 115–127. [Google Scholar] [CrossRef]
  9. Bai, W.; Li, H.; Zhang, L.; Zhang, Y.; Yang, Y.; Zhang, C.; Yao, M. Energy and exergy analyses of an improved recompression supercritical CO2 cycle for coal-fired power plant. Energy 2021, 222, 119976. [Google Scholar] [CrossRef]
  10. Jin, Q.; Xia, S.; Chen, L. A modified recompression S–CO2 Brayton cycle and its thermodynamic optimization. Energy 2022, 263, 126015. [Google Scholar] [CrossRef]
  11. Krain, H.; Hoffman, W. Verification of an impeller design by laser measurements and 3D-viscous flow calculations. In Turbo Expo: Power for Land, Sea, and Air; American Society of Mechanical Engineers: New York, NY, USA, 1989; p. V001T01A064. [Google Scholar]
  12. Wright, S.A.; Radel, R.F.; Vernon, M.E.; Pickard, P.S.; Rochau, G.E. Operation and Analysis of a Supercritical CO2 Brayton Cycle; Sandia Report SAND2010-0171; 2010; pp. 1–101. Available online: https://www.osti.gov/biblio/984129 (accessed on 21 November 2022).
  13. Son, S.; Cho, S.K.; Lee, J.I. Experimental investigation on performance degradation of a supercritical CO2 radial compressor by foreign object damage. Appl. Therm. Eng. 2021, 183, 116229. [Google Scholar] [CrossRef]
  14. Pecnik, R.; Rinaldi, E.; Colonna, P. Computational Fluid Dynamics of a Radial Compressor Operating With Supercritical CO2. ASME J. Eng. Gas Turbines Power 2012, 134, 122301. [Google Scholar] [CrossRef]
  15. Lettieri, C.; Baltadjiev, N.; Casey, M.; Spakovszky, Z.S. Low-Flow-Coefficient Centrifugal Compressor Design for Supercritical CO2. J. Turbomach. 2014, 136, 081008. [Google Scholar] [CrossRef]
  16. Ivanov, V.; Kozhukhov, Y.; Danilishin, A.; Yablokov, A.; Sokolov, M. Verification and Validation of CFD Modeling for Low-Flow-Coefficient Centrifugal Compressor Stages. Energies 2022, 15, 181. [Google Scholar] [CrossRef]
  17. Zhao, H.; Deng, Q.; Zhang, H.; Feng, Z. The Influence of tip clearance on supercritical CO2 centrifugal compressor performance. In Turbo Expo: Power for Land, Sea, and Air; American Society of Mechanical Engineers: New York, NY, USA, 2015; Volume 56802, p. V009T36A008. [Google Scholar]
  18. Uusitalo, A.; Turunen-Saaresti, T.; Grönman, A. Design and loss analysis of radial turbines for supercritical CO2 Brayton cycles. Energy 2021, 230, 120878. [Google Scholar] [CrossRef]
  19. Pei, J.; Zhao, Y.; Zhao, M.; Liu, G.; Yang, Q.; Li, L. Effects of leading edge profiles on flow behavior and performance of supercritical CO2 centrifugal compressor. Int. J. Mech. Sci. 2022, 229, 107520. [Google Scholar] [CrossRef]
  20. Monge Brenes, B. Design of Supercritical Carbon Dioxide Centrifugal Compressors. Ph.D. Thesis, Universidad de Sevilla, Sevilla, Spain, 2014. [Google Scholar]
  21. Rinaldi, E.; Pecnik, R.; Colonna, P. Numerical computation of the performance map of a supercritical CO2 radial compressor by means of three-dimensional CFD simulations. In Turbo Expo: Power for Land, Sea, and Air; American Society of Mechanical Engineers: New York, NY, USA, 2014; p. V03BT36A017. [Google Scholar]
  22. Rinaldi, E.; Pecnik, R.; Colonna, P. Exact Jacobians for implicit Navier–Stokes simulations of equilibrium real gas flows. J. Comput. Phys. 2014, 270, 459–477. [Google Scholar] [CrossRef]
  23. Shao, W.; Yang, J.; Wang, X.; Ma, Z. Accuracy study and stability control of a property-table-based CFD strategy for modeling SCO2 compressors working near the critical point of the fluid. Appl. Therm. Eng. 2021, 183, 116222. [Google Scholar] [CrossRef]
  24. Zhu, Y.; Jiang, Y.; Liang, S.; Guo, C.; Guo, Y.; Cai, H. One-dimensional computation method of supercritical CO2 labyrinth seal. Appl. Sci. 2020, 10, 5771. [Google Scholar] [CrossRef]
Figure 1. The simple reheat cycle.
Applsci 13 00385 g001
Figure 2. Distribution of the semi-open impeller. (a) Beta distribution, (b) Thickness distribution.
Applsci 13 00385 g002
Figure 3. Performance curve of the single-stage compressor (@ 40,000 RPM).
Applsci 13 00385 g003
Figure 4. Schematic layout of the single-stage compressor.
Applsci 13 00385 g004
Figure 5. Schematic figure of the rotor (left) and impeller (right).
Applsci 13 00385 g005
Figure 6. General experimental platform for the MWe sCO2 compressor.
Applsci 13 00385 g006
Figure 7. 3-D graphic model of the general experimental platform.
Applsci 13 00385 g007
Figure 8. Circle diagram of the general experimental platform.
Applsci 13 00385 g008
Figure 9. Original experimental data and historical curves.
Applsci 13 00385 g009
Figure 10. Pressure ratio performance curve (@ 31,000 ± 1000 RPM).
Applsci 13 00385 g010
Figure 11. Isentropic efficiency performance curve (@ 31,000 ± 1000 RPM).
Applsci 13 00385 g011
Figure 12. The compressor inlet conditions in the test (@ 31,000 ± 1000 RPM).
Applsci 13 00385 g012
Figure 13. Dimensionless isentropic head coefficient performance curve (@ 31,000 ± 1000 RPM).
Applsci 13 00385 g013
Figure 14. Dimensionless isentropic efficiency performance curve (@ 31,000 ± 1000 RPM).
Applsci 13 00385 g014
Figure 15. Comparison of dimensionless isentropic head coefficient performance curve.
Applsci 13 00385 g015
Figure 16. Comparison of dimensionless isentropic efficiency performance curve.
Applsci 13 00385 g016
Figure 17. The condensation acceleration velocity of inlet condition (@ 31,000 ± 1000 RPM).
Applsci 13 00385 g017
Figure 18. Dryness distribution of test point near the choke boundary and surge boundary.
Applsci 13 00385 g018
Figure 19. Curve of density with change of outlet pressure and inlet temperature.
Applsci 13 00385 g019
Figure 20. The impeller of single-stage compressor after tests.
Applsci 13 00385 g020
Table 1. The main parameters of MWe sCO2 power cycle.
ParameterValue
Boiler thermal power>5 MWth
Cycle efficiency>21%
Turbine inlet pressure20 MPa
Turbine inlet temperature550 °C
Compressor inlet pressure8 MPa
Compressor inlet temperature35 °C
Table 2. Main design parameters of the single-stage centrifugal compressor.
Inlet
Pressure
Inlet
Temperature
Mass Flow RatePressure RatioPowerIsentropic Efficiency
8 MPa35 °C16.3 kg/s2.5~500 kW>80%
Table 3. Main structural parameters of the semi-open impeller.
ParameterValueParameterValue
Hub radius/mm10 mmBlade angle (leading-edge)60°/54°/48°
Impler radius/mm48 mmBlade angle (training-edge)55°
Blade number15Blade height (leading-edge)7.5 mm
Tip clearance0.25 mmBlade height (training-edge)3.5 mm
Blade inclination angle60°Thickness (leading-edge)0.3–0.6 mm
Table 4. Main performance of experimental platform for MWe sCO2 compressor.
Performance IndexTest Capability
Experimental speed0~40,000RPM
Experimental mass flow0~25kg/s
Experimental power0~800kW
Compressor inlet pressure0~10MPa
Compressor outlet pressure0~22MPa
Compressor inlet temperature0~50°C
Compressor outlet temperature0~100°C
Table 5. The parameters of temperature and pressure sensor.
RangeUncertaintyType
Inlet pressure0–10 MPa<±0.075% FSMonocrystalline Silicon
Outlet pressure0–25 MPa<±0.075% FSMonocrystalline Silicon
Inlet temperature0–50 °C<±0.15 °CPT100
oulet temperature0–100 °C<±0.15 °CPT100
Table 6. The parameters of Coriolis force mass flowmeter.
PositionMass Flow
Range
Density
Range
Mass Flow UncertaintyDensity
Uncertainty
-kg/sg/cm3%FSg/cm3
Upstream2.5~25 400~1000<±0.2<±0.002
Table 7. Dimensionless experimental performance parameters of compressor.
Dimensionless ParametersFormula
M*M/Mref
N*N/Nref
T01*(T01-273.13)/(Tref -273.13)
T02*(T02-273.13)/(Tref -273.13)
P01*P01/Pref
P02*P02/Pref
Table 8. The tip clearance of the experimental impeller.
DesignLeading Edge (Exp)Training Edge (Exp)
Tip clearance0.25 mm0.43 mm0.45 mm
Disclaimer/Publisher’s Note: The statements, opinions and data contained in all publications are solely those of the individual author(s) and contributor(s) and not of MDPI and/or the editor(s). MDPI and/or the editor(s) disclaim responsibility for any injury to people or property resulting from any ideas, methods, instructions or products referred to in the content.

