Article

An Approach for Predicting the Apparent Color of Carpets under Different Illuminants

Department of Design and Merchandising, Oklahoma State University, Stillwater, OK 74078-5061, USA
*
Author to whom correspondence should be addressed.
Appl. Sci. 2023, 13(1), 500; https://doi.org/10.3390/app13010500
Submission received: 2 December 2022 / Revised: 24 December 2022 / Accepted: 27 December 2022 / Published: 30 December 2022

Abstract

:
The color appearance of residential carpets under different illuminants can influence the purchase decisions of consumers, visual merchandisers, and interior designers. This study was designed to investigate and characterize the color appearance of residential carpets under average Noon Daylight (D65), Incandescent (A), and Cool White Fluorescent (F02) illuminants commonly used in retail and household settings. The objective of this study was to identify the key features significantly affecting the apparent color of the carpets under those three illuminants. Four different carpets were dyed with light, medium, and dark shades of red and green colors to identify the difference in color perception when illuminated by different lighting arrangements. A spectrophotometer was used to measure the lightness, chroma, and hue of the carpets via the CIELAB scale developed by Commission Internationale de l’Eclairage (CIE). Statistically significant differences among the L*, a*, and b* values of the carpets were evaluated using Analysis of Variance (ANOVA). Regression analyses were carried out to identify key parameters affecting the L*, a* and b* values. Multiple linear regression (MLR) was applied to generate equations to predict L*, a* and b* values under different illuminant for different carpet features. A decreasing trend in the L*, a*, and b* values have been observed from lighter to darker shades under the illuminants for all the carpets. The deposition of dye molecules over the carpet surface had significant effects on the CIELAB values, and the distribution of dye molecules over the carpet surface was influenced by the constructional parameters of the carpets. The study provides an overview of the effects of carpet structures on color perception under different illuminants, which could help the researcher to determine the apparent color of different carpets under various illuminants.

1. Introduction

The perceived color of interior furnishing and apparel products is a very important component of interior design and visual merchandising [1,2]. Color may positively influence consumers’ attention and draw them toward products. A possible effect of increased attention due to color can positively influence consumers’ purchasing decisions and increase the sale of textile products. Notably, the color of a textile product largely depends upon the illuminants used in the retail stores, illuminants available to the consumers while using the product, and features of the product, such as its constructional structures and surface attributes (pile height, gauge, stitch rate, carpet density) [2,3,4].
Prior research has found that a few illuminants, namely Cool White Fluorescent (CWF) and Incandescent (A), were predominantly used by visual merchandisers and/or interior designers in retail stores and homes [5,6,7]. However, the recent need to reduce operating costs (lighting is one of the biggest expenses in the U.S. retail stores) and energy consumption (lighting accounts for 50% of the total energy used in U.S. retail buildings) in retail stores have also led to the use of other illuminants such as simulated Daylight Fluorescent (D65), by interior designers and visual merchandisers [5,6,8]. Additionally, after purchasing textile products from retail stores, consumers may view the products under incandescent (A), CWF (F02), and noon daylight (D65) illuminants, while traveling, shopping, at home, at work, or outside [9,10,11]. Altogether, it is obvious that the color appearance of textile products would vary at different times of the day depending upon the types of illuminants to which products are exposed [11,12].
Considering the above situations, textile researchers and manufacturers should measure the color appearance of textile products under different illuminants commonly used by interior designers and visual merchandisers in retail stores as well as under illuminants to which products are exposed during routine use after installation. However, many textile researchers and manufacturers only measure the color appearance of products in laboratory conditions under a D65 illuminant potentially due to their limited access to different illuminants or shortages of time and money for lab testing [13,14,15]. The measurement of the color appearance of textile products by the manufacturers under only one illuminant could lead to misleading information for interior designers and visual merchandisers, as well as ultimate dissatisfaction of consumers when viewing color variations in the textile products under other illuminants [16,17,18]. Consumers’ dissatisfaction may eventually lead to both loss of sales and patronage for retailers. Hence, there is an immediate need to scientifically study the color appearance of textile products under different illuminants and to provide a time- and cost-efficient mechanism (i.e., a model) to predict the apparent color. This research agenda could help manufacturers, interior designers, and merchandisers to accurately and conveniently predict the color appearance of textile products and to provide detailed color information for products under varied illuminants prior to consumer evaluation and purchases.
Fairly recently, Yaoyuneyong and Moore [9] scientifically studied the color appearance of textile products under three different illuminants—I, D65, and CWF. They used experimental and statistical techniques to characterize the textile products and found that perceived color appearance significantly varies with the type of illuminants. However, Yaoyuneyong and Moore’s research focused on apparel textile products only. They did not explore interior furnishing textile products and the effects of textile product features on the color appearance. Additionally, they only statistically correlated the color appearance of textile products with different types of illuminants. In turn, no statistical model was developed to predict the color appearance of textile products accurately and conveniently. Luo et al. [19] investigated the effects of fabric surface structure over color attributes such as lightness, chroma and hue. They identified significant effect of fabric surface over the lightness values. They addressed several color measuring scales and developed models to effectively reduce the impact of fabric texture over color measurements [19,20]. Given that, a more varied and significant textural difference can be observed in carpets and other interior textiles. Hence, perceived color differences can be more discernable for carpets with same colored yarn. Moreover, the probability of color mismatches under different illuminants is significantly higher while such textiles are in question.
To date, no published research has scientifically characterized and modeled the color appearance of interior furnishing textile products under different illuminants. Carpet is one of the most widely used interior furnishing textile products, and wool fiber-based carpets mainly cater to the luxury consumer markets. In fact, Lasauskaite Schüpbach et al. [21] found that luxury consumers prefer to view their carpets under a particular illuminant. Therefore, one of the most important concerns of carpet manufacturers, interior designers, and visual merchandisers of retail stores is the color appearance of carpets because it significantly influences the purchasing decisions of consumers. Thus, there is a critical need to characterize, and develop color predictive model for the perceived appearance of carpets under different illuminants in consideration of key carpet features scientifically and computationally.
Several researchers have tried to characterize the carpet appearance. Based on digital image analysis, Wood [22] has created a method to address the carpet appearance via constructional parameters. In the study addressed carpet constructional parameters were pile height, pile type, gauge, stitch rate, carpet density. Here, carpet pile height refers to the length of the fiber tufts that are visible in the carpet. Gauge is the distance from one needle to the subsequent needle, whereas stitch rate is the number of stitches that occur within one inch. Pile density is the weight of the pile yarn per unit volume of carpet. The spectrophotometric and colorimetric properties of yarn and carpets have been compared by Shams-Nateri et al. [23]. They discovered that the carpet’s reflectance is always inferior to those of the yarn, regardless of the concentration of the dye used. Abdullayeva and Kazim-Zada [24] have developed a method to identify the carpet through the decomposition of the complex image of the carpet using the components of patterns, pixels of color, and contours. Pourdeyhimi [25] looked into how mechanical wear on carpet pile affects the carpet’s apparent color. However, these studies did not consider the variations in illumination as well as the varied formation of carpet structures [22,23,24,25].
Therefore, the goal of this study is to develop statistical models that can be successfully utilized in color prediction of carpets under different illuminants. The overall objective in this research is to propose a Multiple Linear Regression (MLR) model for identifying the significant parameters affecting the apparent color of carpets. In order to fulfill the above-mentioned critical need, the MLR model will be developed by considering the features of the carpets. The researcher plans to attain the overall objective by pursuing the following two specific aims—(1) characterizing the color appearance of carpets: The working hypothesis of the study is that, by statistically characterizing residential carpets, it will be possible to identify the key features affecting the color appearance of carpets under different illuminant; (2) statistical modeling the color appearance of carpets: the working hypothesis is that, by employing the key carpet features in the MLR modeling technique, the variations in the apparent color under different illuminants can be better realized. The rationale and the intellectual significance of this project are that its successful completion would make an original contribution by developing methods to accurately predict the color appearance of carpets using the user-friendly (time- and cost-efficient) statistical model.

2. Materials and Methods

2.1. Carpet Selection

To fulfill the above-stated research aims, four commercially available undyed loop-piled wool carpets with different structural configurations (e.g., yarn weight, gauge, stitch rate, and pile height) were purchased. Manufacturers and interior designers commonly use these structural configurations to define the structure of a carpet [26]. The carpet samples were procured by Unique Carpets, Ltd., Riverside, CA 92504, USA. The specification of the purchased carpets is presented in Table 1. From each carpet type, eight samples were prepared for further processing. A total of 8 × 4 (32) samples were prepared by cutting the carpets into 6.5″ × 6.5″ samples for the subsequent processes of bleaching and dyeing. The average weight of the carpet samples was determined for each of the four carpet types.

2.2. Carpet Dyeing Process

2.2.1. Scouring and Bleaching

All the dye and bleaching chemicals have been procured from ProTM Chemical & Dye, Fall River, MA, USA. A 5% white vinegar solution has been procured from Kraft Heinz Food Company, Mendota Heights, MN, USA. Scouring and subsequent dyeing processes were carried out in the Textile and Apparel Science Laboratory (TASL) at Oklahoma State University. Commercial wool bleaching and dyeing processes were adopted for the methodology, as described by ProTM Chemical & Dye wool bleaching and acid dyeing guidelines [27,28]. The dye batches were formed by taking four samples from four different carpet types. The amounts of chemicals necessary were determined based on the sample weights of a single batch. In the first stage of dyeing, the batches were scoured and bleached to remove any inherent natural colors. At first, the carpet samples were scoured in a water bath for 30 min at a temperature of 60 °C (140 °F). Sodium Carbonate and ethoxylated alcohol as liquid detergent were used as scouring agents. After the scouring, the samples were rinsed thoroughly with water. Table 2 charts the required amounts of scouring agents for scouring.
For preparing the bleaching solution, water, Sodium Carbonate, detergent, and 35% Hydrogen Peroxide were mixed together in an unchipped enamel pot. The required quantities are shown in Table 2. The solution was first heated to 55 °C (130 °F). The batches were immersed into the solution and kept at room temperature for 24 hrs. Later, the batches were rinsed and neutralized with a 5% white vinegar solution. After neutralizing for 10 min, the samples were squeezed to remove the excess liquid.

2.2.2. Dyeing

In order to dye the carpet samples, the batches were first wetted with a water detergent solution for 30 min at 43 °C (110 °F). 2.5 mL detergent was mixed in 10 L of water for each pound (453.6 g) of carpet samples. For three different shades, the dye solutions were prepared according to Table 3. For immersion dyeing of the woolen carpet samples, two acid dyes (hue: red and green) were considered in three different shades (saturation): light, medium, and dark. Corresponding dye Color Indices (C.I.) are Acid Red 151 (26,900) and Acid Green 3 (42,085). The dyes belong to “Nylomine” group. Red and green dyes have been considered as they are commonly used colors.
Water, white vinegar, common salt, and the prepared dye solution were mixed together to prepare the dye bath. Required amounts are shown in Table 4. The resultant dye concentration in the dye bath has been charted in Table 5 for gradual shading from light to darker shades. The previously wetted batches were immersed in the dye bath. The temperature of the dye bath was raised to the boiling point and stirred from time to time for 60 min. Additional white vinegar (Table 4) was applied to improve the dye take-up of the batches. After 60 min., the dye bath was cooled to room temperature. The samples were removed from the dye bath, rinsed with water, and air dried.
A total of 24 colored samples resulted from the dyeing process. Each carpet type was dyed in two hues for three different saturations, yielding 2 × 3 (6) dyed samples. As four different carpet qualities were considered, 4 × 2 × 3 (24) colored samples were evaluated in the following steps. Figure 1 depicts the carpets images for dyed and undyed conditions taken under CWF illuminant.

2.3. Evaluation of Carpet Color Appearance under Different Illuminants

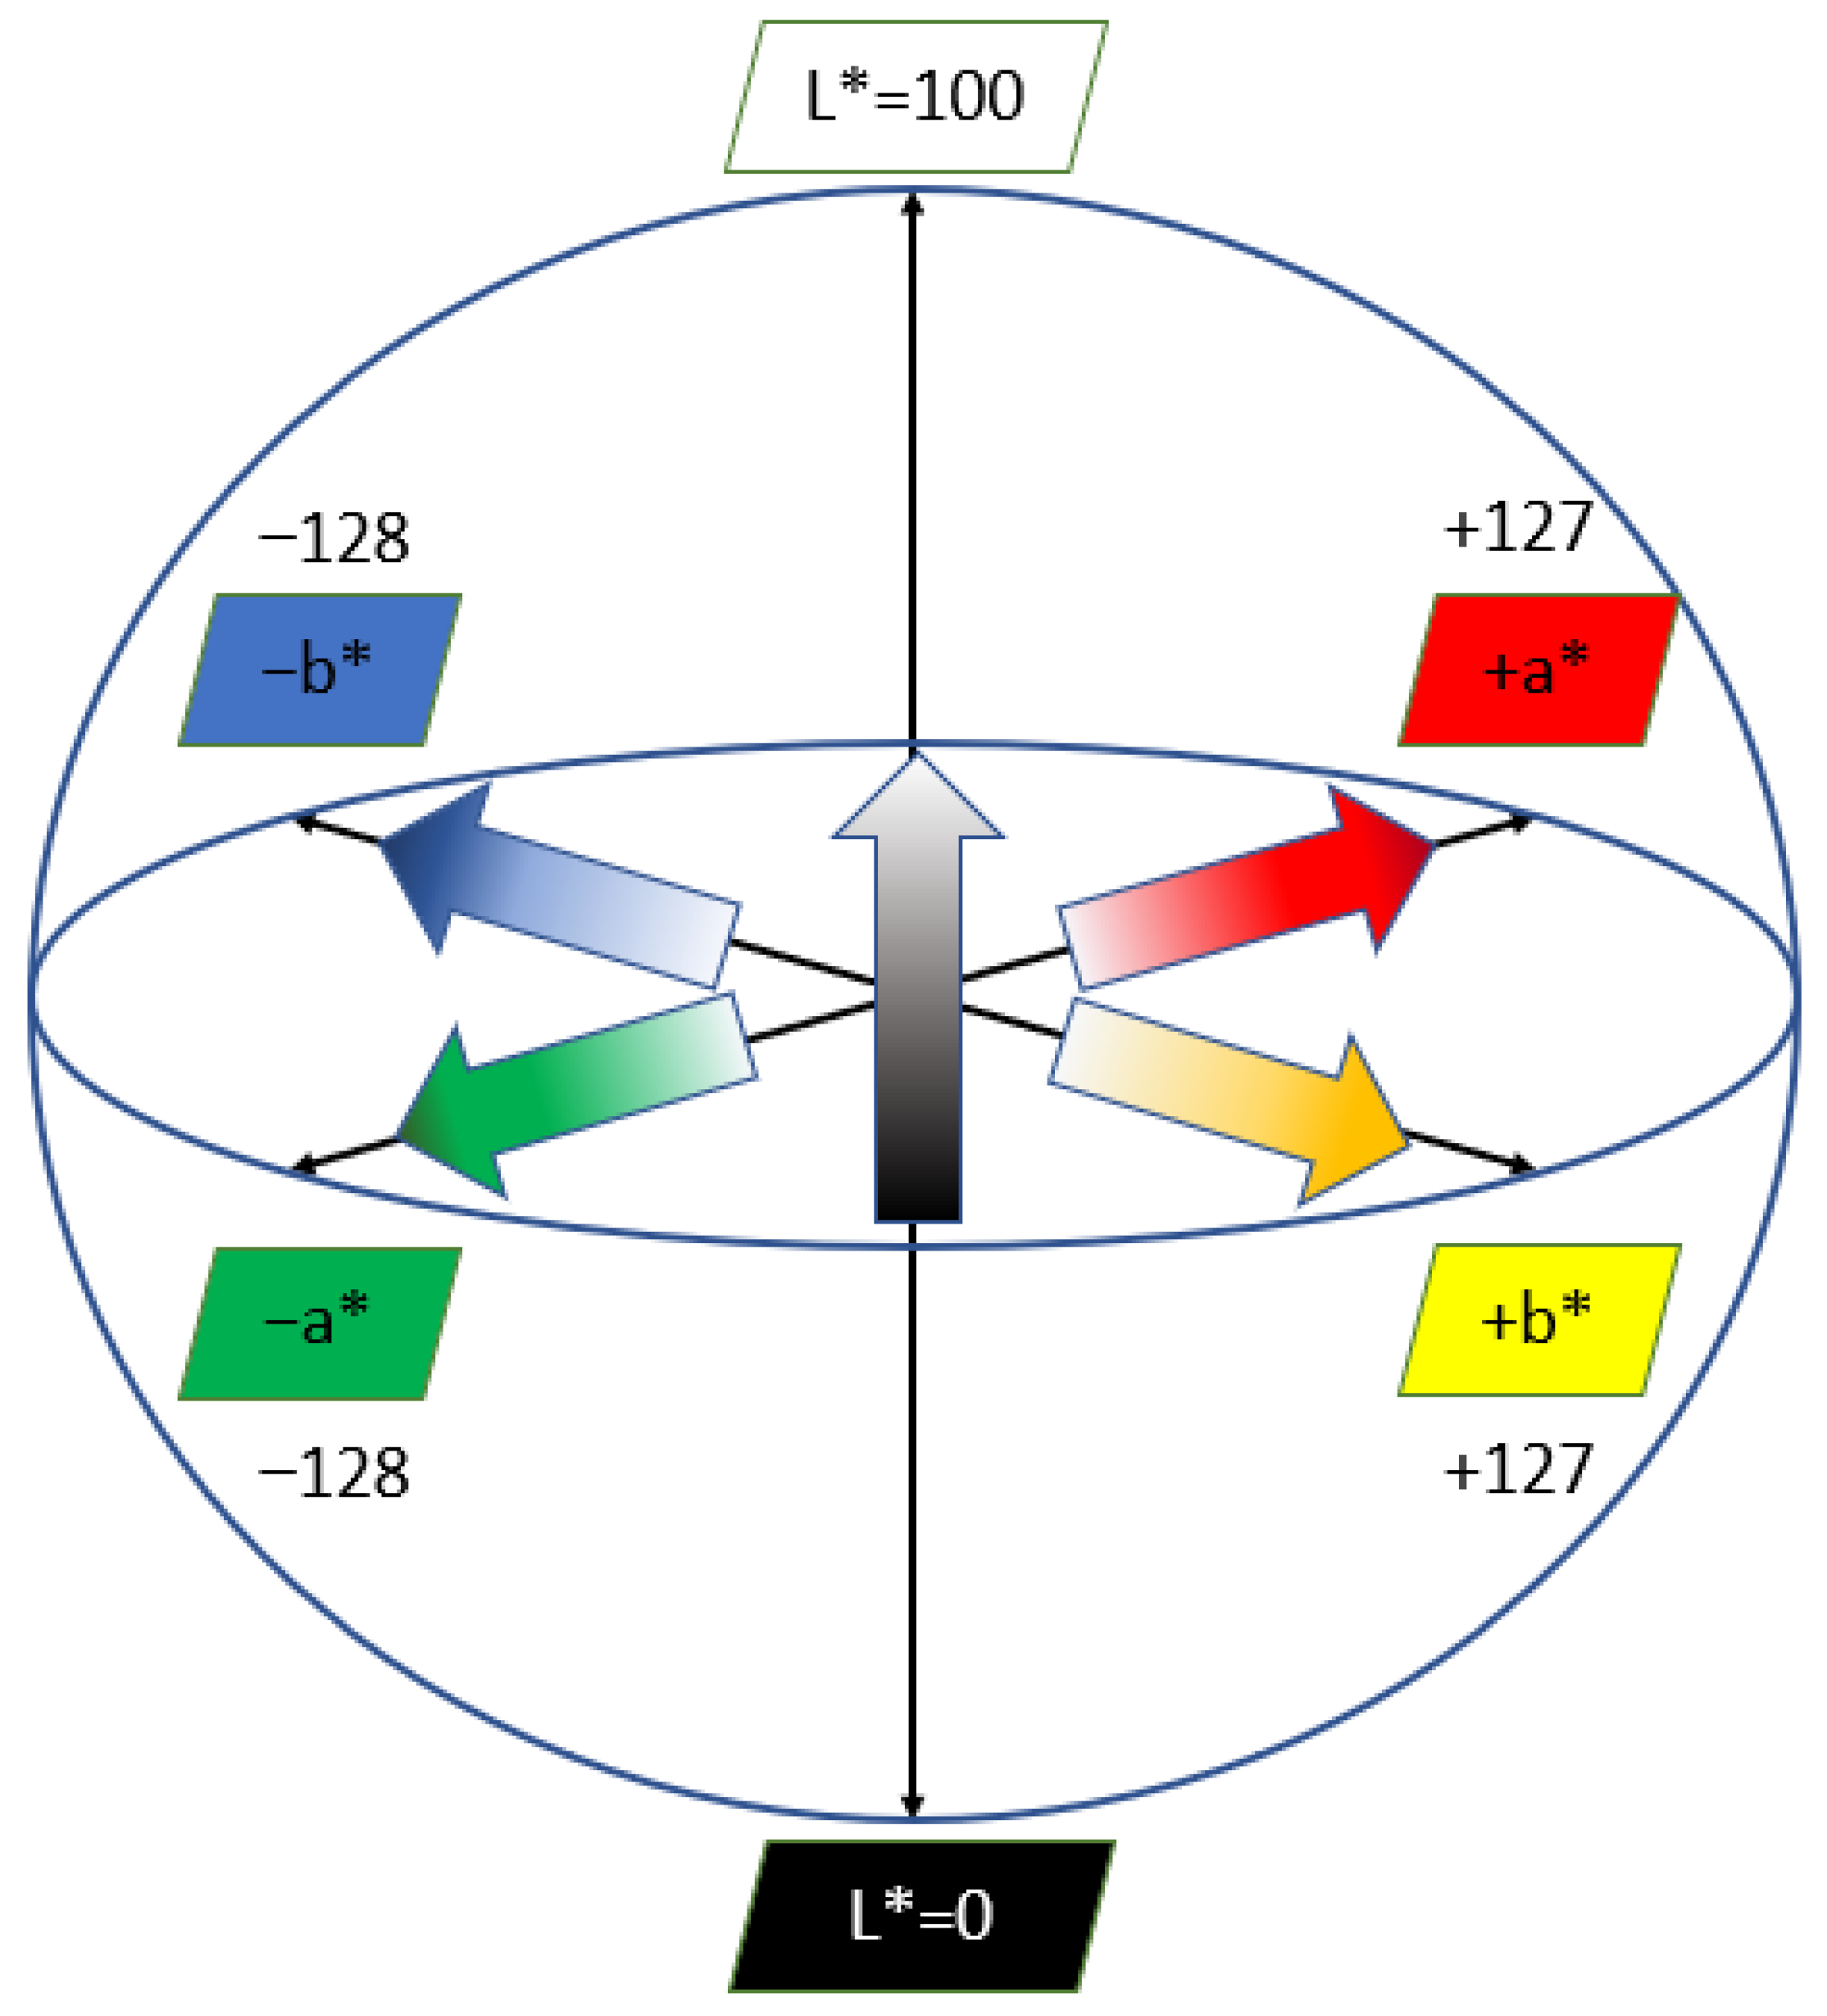
In order to objectively evaluate the carpet color appearance, Datacolor® Check 3 Spectrophotometer, Lawrenceville, NJ, USA was used to measure the color parameters of the dyed carpets. Color parameters were addressed via the CIELAB scale. According to the CIELAB scale, three color dimensions were selected: Lightness/Darkness (L*), Redness-to-Greenness (a*), and Yellowness-to-Blueness (b*), to quantify the color appearance. CIELAB color space is a three-dimensional scale (Figure 2) addressing the unique colors of human perception: red, green, blue, and yellow. L* values range from 0 to 100, referring to black towards diffusive white. a* and b* values do not have any theoretical limit. However, for computational purposes, they are limited to −128 to 127. Positive a* values refer to red, while negative ones are assigned to green. Positive b* values are assigned to yellow and negative ones are assigned to blue. According to the International Commission on Illumination (Commission Internationale de l’éclairage, CIE), a change in this color system will result in a similar change of perceived color. The CIELAB scale is specially designed to address human color perception by efficiently addressing the slight changes in color hues. CIELAB space can address a wider color range than RGB or other color spaces. Hence, this scale is more effective in addressing human color perception than the RGB scale commonly used in computer graphics [29,30].
For measuring the color appearance, samples were preconditioned at 21 ± 1 °C (70 ± 2 °F) and 65 ± 2% RH for 24 hrs. After the preconditioning, the spectrophotometer was used to measure the CIE L*, a*, and b* values for a specific illuminant. Three color measurements were taken in three different places, diagonally aligned across the specimen. The three measurements were averaged for each of the L*, a*, and b* values. To realize the research agenda, the CIE L*, a*, and b* values were measured and averaged for three different illuminants. The illuminants are A (incandescent), D65 (noon daylight), and F02 (cool white fluorescent). For every illuminant, 10° observer systems were considered. Corresponding correlated color temperatures (CCT) and color render index (CRI) are charted in Table 6. Color rendering index refers to the illuminant’s ability to depict the actual color of an object compared to a reference illuminant, while Color temperature uses numerical values to determine the color characteristics of a illuminant across a spectrum from warm to cool hues measured in degrees Kelvin (K) [31,32]. A higher value corresponds to a cooler color, i.e., blue. A lower value corresponds to a warmer color, such as yellow. For a total of 24 specimens, CIE L*, a*, and b* values were measured 24 × 3 (72) times for each of the three illuminants. A total of 72 × 3 (216) sets of CIE L*, a*, and b* readings were taken.

2.4. Procedure of Data Analysis

The ANOVA and Multiple Linear Regression were carried out using SPSS 26 software (developed by IBM, Armonk, NY, USA) to analyze the data of CIE L*, a*, and b* values of the carpets. The descriptive analysis of the L*, a*, and b* values of carpets was approached via bar graph to explain the overall trends of the data.The statistical significance was determined based on the significance level, α = 0.05. The p-values for the 95% confidence interval (upper and lower limit) were obtained from the ANOVA. For p  <  0.05, significant differences were identified in the values of L*, a*, and b* while addressing carpets, illuminants, and shades. For the mathematical modeling, stepwise MLR modeling was utilized that could forecast the L*, a*, and b* values of carpets under different interactions of the illuminants for the addressed colors and shades. MLR modeling was found to be efficiently addressing the lower variations (1–5 units of L*, a*, and b* values) of instrumental color measurement [33,34]. In the stepwise MLR, significance level α = 0.05 has been considered. For each successive stage of the MLR, the insignificant variables were eliminated from the models, until all the independent variables were found significant. Coefficients of determination (R2) of the L*, a*, and b* values were also calculated. An R2 value with proximity to 1 for a particular relationship was inferred as a strong association between the respective dependent and independent variables. The coefficients of the carpet features, dye concentration, and intercepts were determined to develop the equations through multiple linear regression. Finally, the L*, a*, and b* values depending on carpet features and dye concentrations, were statistically modeled.

3. Results and Discussion

The L*, a*, and b* values that were produced were distinct depending on the carpet and the illuminant used. This indicates that the visible color of carpets was affected by a variety of carpet characteristics and different types of illuminants. Explanations of how the color of the carpet appears to change depending on the illuminant are provided.

3.1. Characterizing the Color Appearance of Carpets under Different Illuminants

The L*, a*, and b* values of the carpet under Noon daylight (D65), Incandescent (A10), and Cool white fluorescent (F02/10) are measured to determine how the color perception of the carpet varies under different illuminants. The effects of carpets structures on the CIELAB scale have been investigated.

3.1.1. Illuminant 01: Noon Daylight (D65/10)

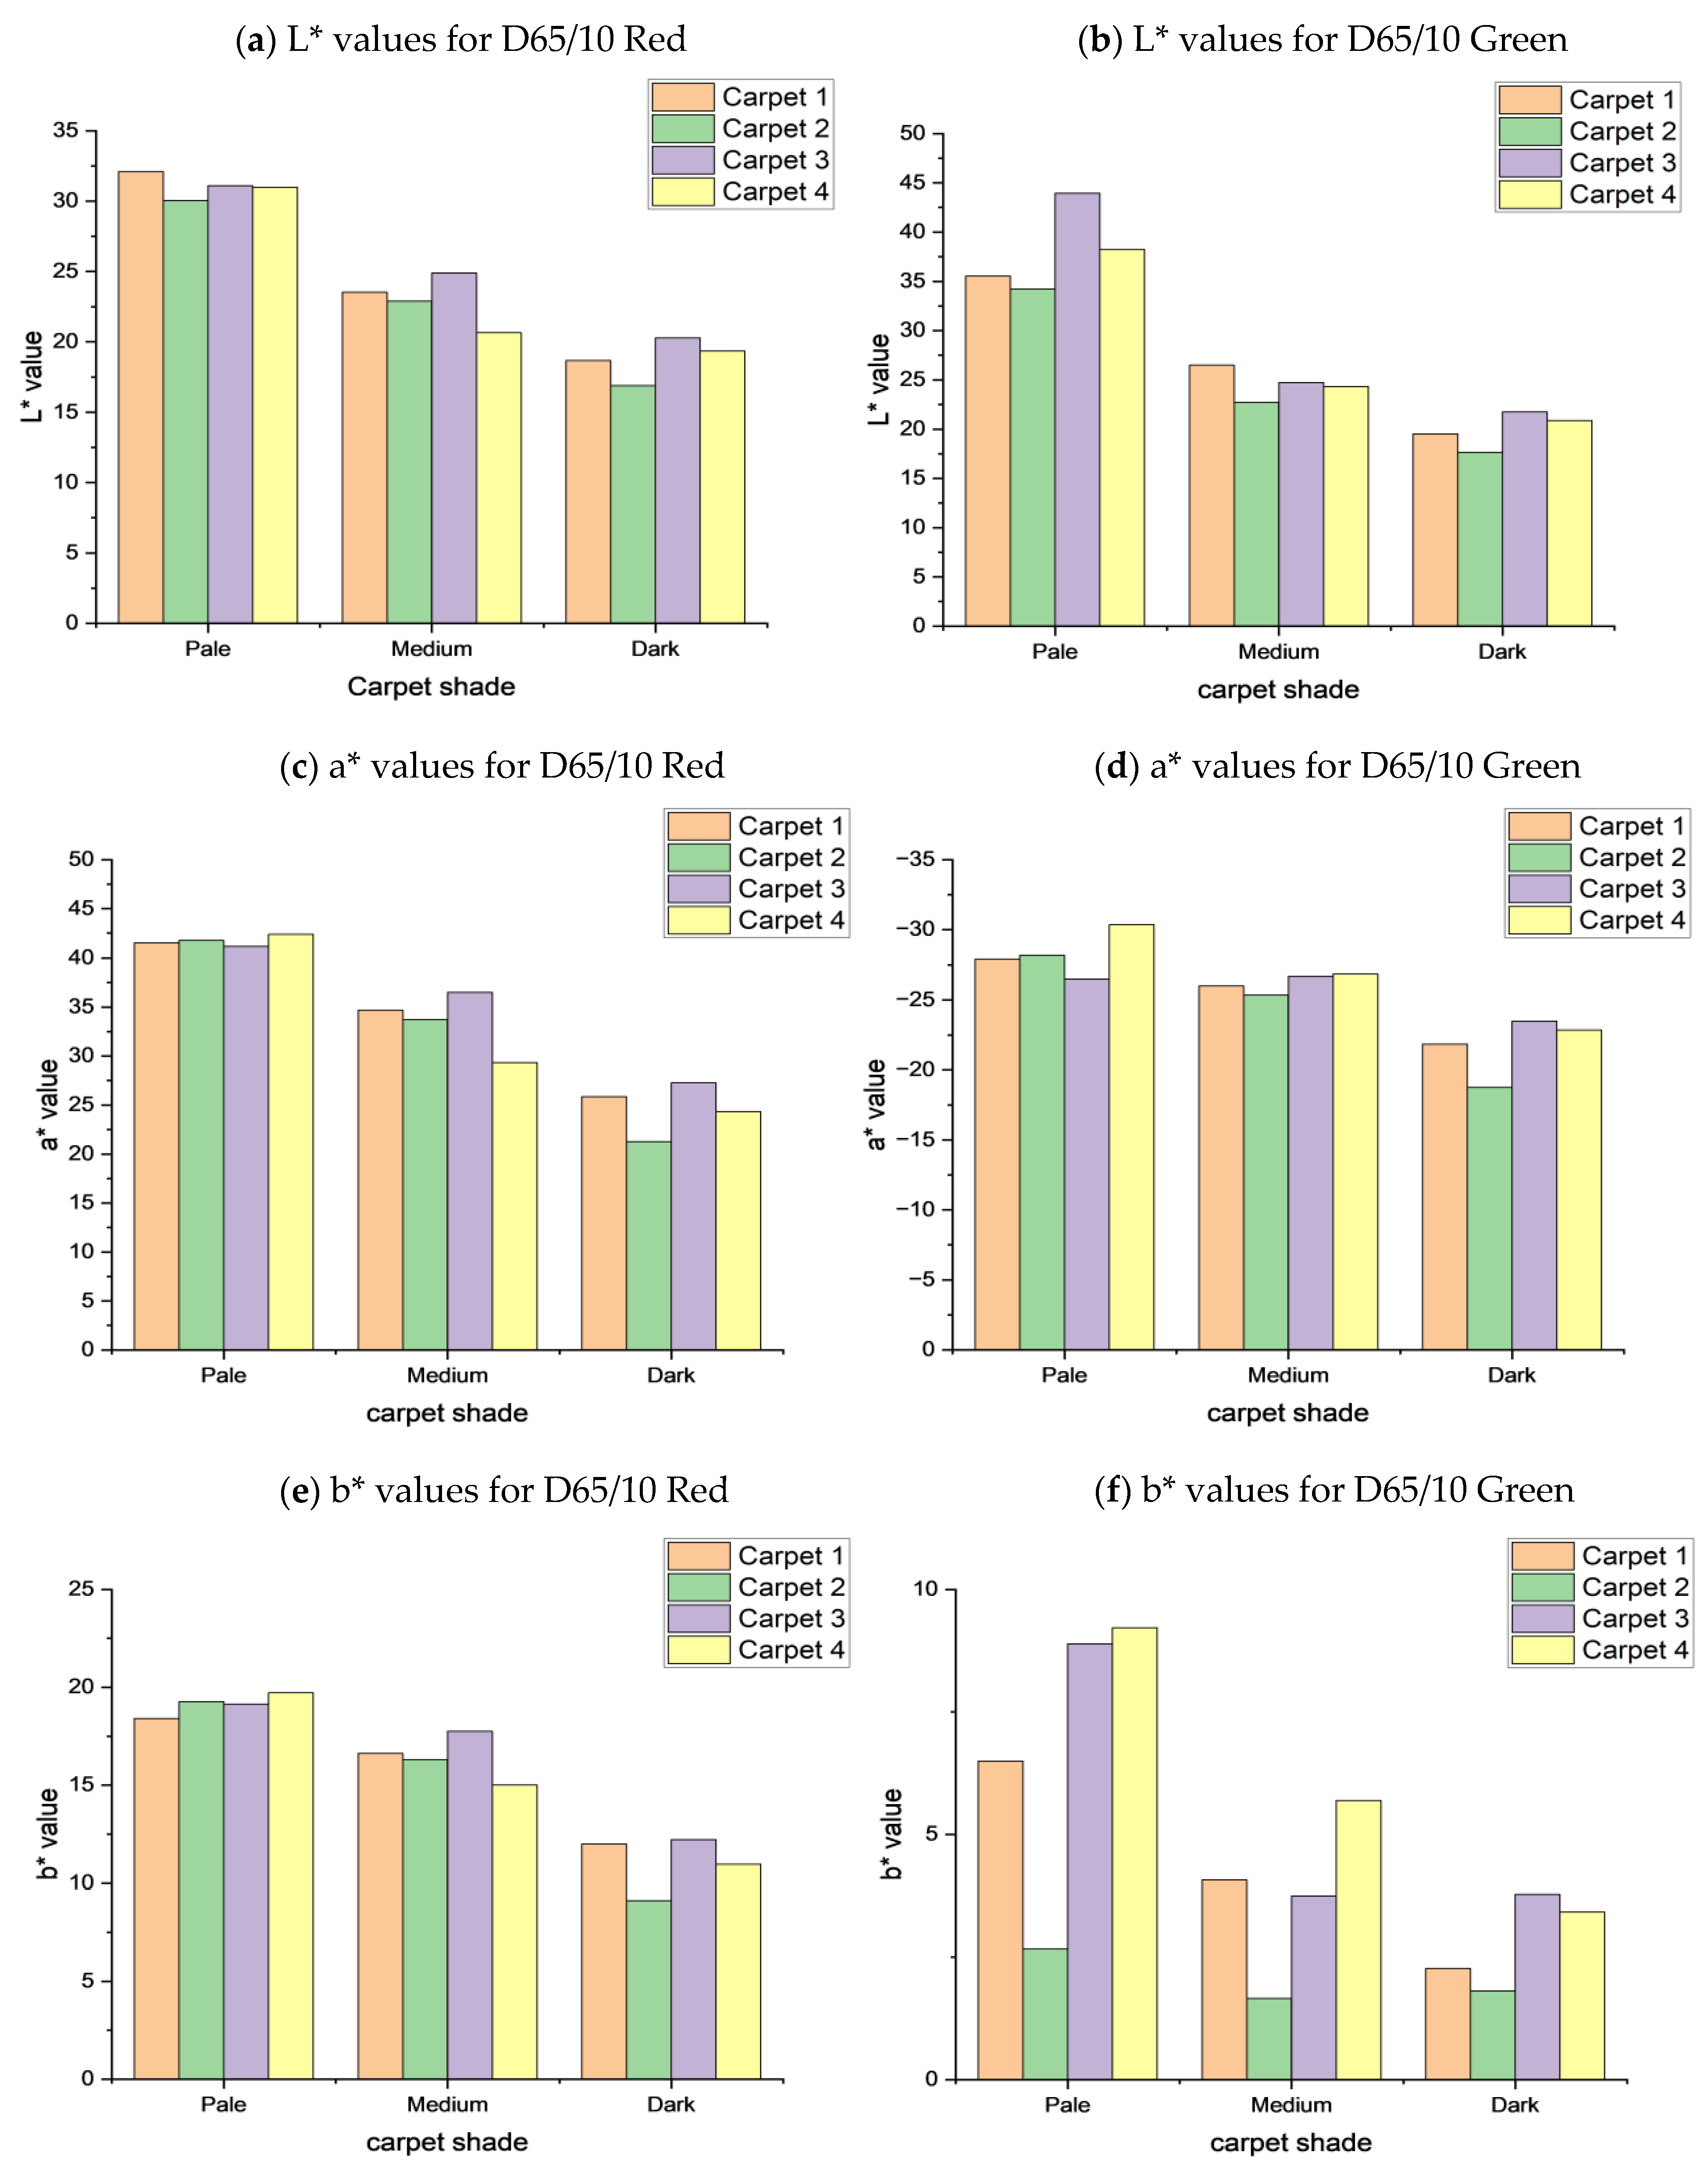
Figure 3 shows the resultant Lightness-darkness (L*), redness-greenness (a*), and yellowness-blueness (b*) values for four different carpets dyed with two different dyes (red and green) in three different shades (light, medium, and dark). As shown in Figure 3, the lightness values (L*) of the dyed carpet decreased from light to darker shades with increasing dye concentration. In the CIE L scale, lower L* values indicate a shift towards darkness, which refers to more light absorption in all the visible wavelength ranges.
In this case, the L* values can be addressed via the Kubelka-Monk equation’s K/S factor [35,36,37].
K S = ( 1 R ) 2 2 R
In Equation (1) K, S, and R refer to incident light absorption, scattering, and reflectance percentage, for a certain wavelength. According to the Kubelka-Monk theory, K/S ∝ C, where C is the concentration of colorant molecules. This equation refers to the proportional relationship between the C and K [38,39,40]. Therefore, a higher concentration of colorant molecules in the dyed substrate led to more light absorption and less reflection of all the visible wavelength ranges, resulting in a darker appearance and a lower L value. Hence, the L* value is inversely associated with the concentration of colorant molecules and the subsequent absorption of incident light. For these inverse relationships, the L* values of the dyed carpets decreased from light to dark shades with increasing dye concentration (Figure 3a,b).
Comparing Figure 3a,b, only the green-light shaded carpets showed significant differences (p = 0.00383 < 0.05) for various carpet features, while the rest were found to be insignificant (p > 0.05). As shown in Figure 3b, the L* values of green-light shaded carpets are the highest among all the shades of red and green colored carpets. This means that the green-light shaded carpets have more reflection of the incident rays in all the visible wavelength ranges, resulting in higher lightness values. Such higher L* values could be related to the specific absorption trend of the dye molecules used for the green hue [41,42]. Due to higher reflection of all the visible wavelength ranges, the difference between the L* values for the different carpet attributes becomes significantly different. On the contrary, the lower the L* values become, the less the effects of carpet attributes can be discerned on the lightness scale (CIE L), which explains the statistical insignificance found for red-colored carpets in all the three shades and green-colored carpets for medium and dark shade.
In the green-light shaded carpets (Figure 3b), carpet 3 has significantly higher L* values compared to other types. Carpet 3 has wider loops due to a comparatively higher gauge and lower stitch rate. This indicates more horizontal yarn availability compared to the other loop-piled carpets selected for the methodology. Such horizontal yarn availability in the loop formation works as a smooth reflective surface, giving more light reflection in all the wavelength regions for higher lightness (L*) values [23,25]. In the case of carpet 2, the L* values are the lowest. Carpet 2 has twisted yarn loops. The twisted structure on the horizontal portion of the loop causes more scattering and reduces the light reflection, resulting in lower lightness (L*) values. Figure 4 depicts the sketches of the corresponding carpets. Here, carpet 1 has small loops (Figure 4a), Carpets 2 and 3 have the same loop length, however, carpet 2 has more twists in the loops (Figure 4b,c). Carpet 4 has two variations (0.3125 and 0.375 in) in loop heights (Table 1) (Figure 4d).
For addressing the chroma and hue of the dyed carpet in terms of CIE a and CIE b scales, similar decreasing trends as L* values were observed from light to darker shades (Figure 3c–f). For the red and green-colored carpets, reflected light mainly contains red and green associated wavelengths (620–780 nm) in the visible wavelength region. As previously discussed, a higher concentration of colorant molecules will result in more absorption of incident light for a certain wavelength. Hence, from light to dark shades, more absorption of corresponding red and green wavelengths occurred, which resulted in less reflection of the red and green light spectra along with other color wavelengths, which reduces the chroma values of a* and b*.
Considering the variations in the a* values due to carpet features, the dark shades have identifiable variations (p < 0.05) for all of the shades in both colors (Figure 3c,d). This could be related to less light reflection in all of the wavelength regions with increased concentrations of colorant molecules. For the dark shades, all wavelengths’ light reflection decreased with colorant concentration. However, as the colorant molecules reflect the specific light wavelength associated with perceived color, the reduction in its reflection is less compared to the other light wavelengths. As the function of the colorant molecules is to reflect the light of the perceived color, this resulted in better hue distinction. Hence, the variation among the carpets in a* values become significant in the dark shade. For carpet 3 (Figure 3c,d), |±a| values are higher in the dark shade due to more colorants being present in the smooth reflective surface. Hence, more colorants in the horizontal yarn planes of the loops showed better chroma compared to the others. Carpet 2 has the lowest values for |±a|, which is due to its high scattering of the reflected red/green light spectra resulting from the comparatively high twisted yarns in the loops (Figure 3c,d).
Addressing the b* scale refers to the measurement of the secondary (non-dominant) hues from the reflected wavelength of light and their chroma as the carpets were dyed in red and green colors. For the red-colored carpets, significant (p < 0.05) variations in b* values have been observed in the dark shade (Figure 3e) due to the carpet features. In this case, the reason is the same as before. More concentration of colorant molecules in the carpets enhanced absorption of all light wavelengths. However, less absorption of the red color wavelengths (due to the colorants’ function), and consequently, better hue distinction of the reflected light, caused significant variations in b* values associated with different carpet features. Similar to the CIE a, the CIE b scale also documented higher values for carpet 3 and lowest for carpet 2 which was dyed in a red color with a dark shade (Figure 3e). As previously discussed, carpets’ loop structure can affect +b values.
Interestingly, in the case of green-colored carpets (Figure 3f), light and medium shades showed significant (p < 0.05) variations in the +b values, apparently due to the carpet features, while the dark ones did not. The significant variations among the carpets in the lighter shades could be the combined effect of correspondent dye particles’ absorption and reflection patterns of the visible light wavelengths and the carpet features. Following this, the dark shade is also expected to be significant as previously discussed. However, very low chroma of a yellow hue has been reported (|+b| < 4), indicating little to no reflection of the yellow/blue associated wavelengths. Hence, these substantially lower |+b| values cause the resultant insignificance in the dark shade among the carpet variations. Another verification of such an inference can be observed while comparing the insignificant variations (p > 0.05) in +b values of carpet 2 from light to darker shades.
For green-colored carpets, carpet 2 has distinctive lower +b values in all the shades due to the uneven horizontal loop surface from the twisted yarns (Figure 3f). Carpets 3 and 4 have higher b* values due to more availability of horizontal yarn in the loop as a reflective surface, minimizing the scattering. Additionally, carpet 4 also has wider loops but two different loop heights, indicating a less uneven reflective surface compared to carpet 3. If the spectrophotometer lens (due to the small diameter) considers both the loops of such uneven surface, scattering will lower the L*, a*, and b* values compared to carpet 3. If the lens considers a total loop in its measuring lens, then the more horizontal formation of yarn will have higher corresponding L*, a*, and b* values.

3.1.2. Illuminant 02: Incandescent (A/10)

To some extent, similar observations were recorded while measuring the lightness-darkness (L*), redness-greenness (a*), and yellowness-blueness (b*) values under incandescent (A) illuminant (Figure 5). From light to darker shades, decreasing trends were observed for L*, a*, and b* values (Figure 5a–e), with a slight exception in b* values for green-dyed carpets (Figure 5f). Both positive and negative values were observed for b* values, indicating a yellow or blue hue, respectively. As the green wavelength region is neighboring both the yellow and blue wavelength regions in reflectance spectra (Figure 6), such can be expected. However, the chroma values are much lower (|±b| ranges between 0–4) compared to other scenarios, indicating very little reflection of the yellow/blue associated wavelengths.
Similar to D65/10, for red-colored carpets, variation in L* values under A/10 illuminant was insignificant (p > 0.05) for all the shades due to the carpet features (Figure 5a). For green-colored carpets, light shades show significant (p ≤ 0.05) variations among the carpets (Figure 5b). The distinction between carpets becomes more prominent with high lightness values (L*) due to the surface characteristics (horizontal yarn availability in the loop arch) facilitating more reflection of incident light in all wavelength ranges, as previously discussed. Similarly, for red-colored carpets, redness-greenness (a*) and yellowness-blueness (b*) values showed significant (p < 0.05) variations for carpets in the dark shade (Figure 5c,e). For darker shades, more concentration of colorant molecules (Table 5) in the dye bath, which subsequently transferred in the loops’ reflective surface, will absorb more incident light and reflect corresponding hue light more efficiently. Hence, the hue distinction (variation in chroma) will become more evident for carpet features. For green-colored carpets, redness-greenness (a*) values showed significant (p < 0.05) variation from carpet to carpet in the dark shade (Figure 5d), while light and medium shades showed significant distinction (p < 0.05) between carpets in b* values (Figure 5f). As previously mentioned, a higher concentration of colorant molecules efficiently distributed in the carpet loops will result in facilitated hue distinction from a gradual increase of shading. However, for lower chroma values (0–10), such significant results will be disregarded due to the higher light absorption in all the wavelength regions. Aside from green-colored carpets on the CIE b scale, carpet 3 showed the highest lightness (L*), redness-greenness (a*), and yellowness-blueness (b*) values in significant cases (p < 0.05), while carpet 2 showed the lowest values. Such is related to the light scattering and reflections’ efficiency. Carpet structure facilitated less scattering (less twisted yarn in loops or less uneven loops) and more reflection (more smooth yarn in the loop’s horizontal surface) which resulted in higher correspondent values. However, with lower values of chroma for the nondominant color reflection |±b|, such effects will be convoluted due to very little reflection of the corresponding color-associated wavelengths.

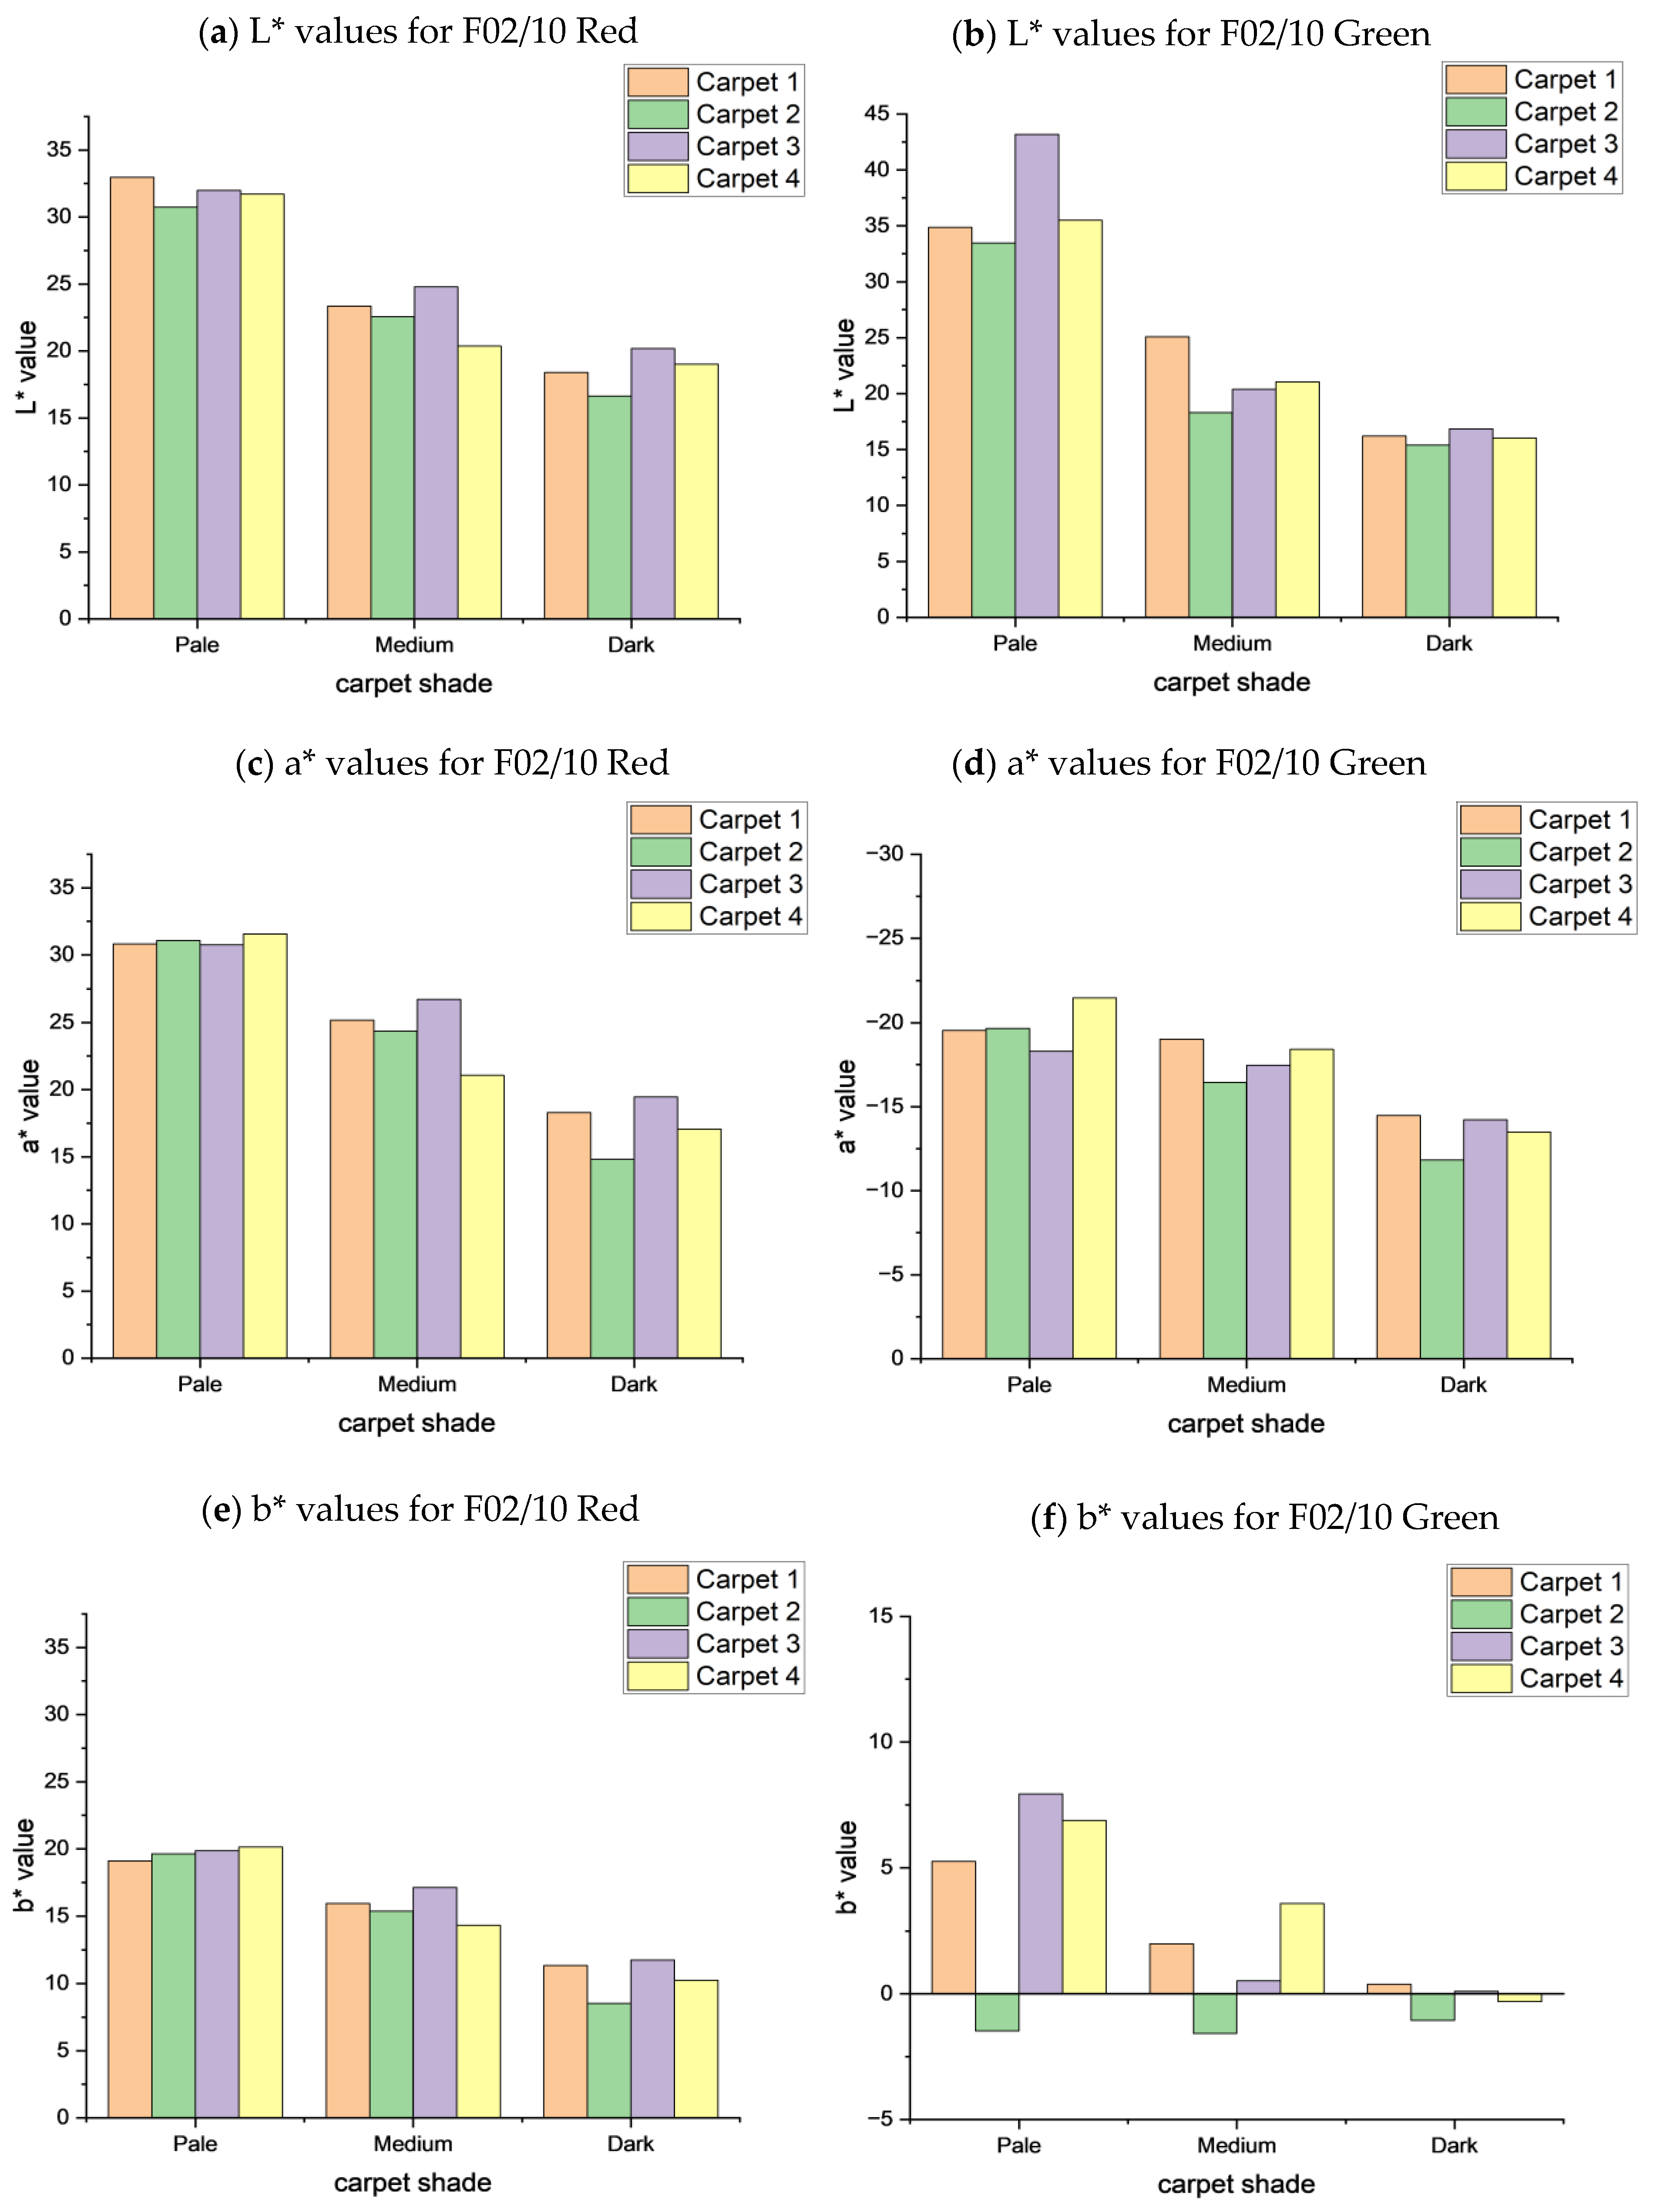
3.1.3. Illuminant 02: Cool White Fluorescent (F02/10)

Figure 7 charted the corresponding L*, a*, and b* values for different dyeing conditions considered in the methodology. Similar to the previous illuminants, recorded L*, a*, and b* values under F02/10 showed high conformity to the previous observations while addressing variations due to carpet features and gradual shading from light to darker shades. Hence, the inferences made in the previous sections are mostly applicable here while addressing the significant variances in L*, a*, and b* values caused by the carpet features and shade variations.
While comparing the resultant lightness-darkness (L*), redness-greenness (a*), and yellowness-blueness (b*) values for the same-colored carpet with the same shade under the three illuminants (D65/10 vs. A/10 vs. F02/10), significant variations have been observed. This is due to the energy level distribution (spectral power distribution) of the different color-associated wavelengths (spectral power distribution) of the incident and reflected light [44,45]. For every illuminant, such energy distribution is distinguished. The correspondent wavelength of a definite color varies in radiant energy in the spectral power distribution for definite illuminants. Based on such varied energy distributions, the reflection, scattering, and absorption of the incident light by the colorant molecules will have different patterns for different illuminant types. As the energy distribution of the color-associated wavelengths for the reflected light is different for different illuminants, this will result in changes for the L*, a*, and b* values. Hence, the color perception will be different under different illuminants. This phenomenon can be realized from the images provided in Figure 8.
From Figure 8 it can be seen that the images under A (incandescent) have darker appearance compared to the images under D65 (noon daylight) and F02 (cool white fluorescent). It is because the L values for A (incandescent) illuminant is lower than that of D65 (noon daylight) and F02 (cool white fluorescent). In addition, minor color differences can be perceived visually for dark shade whereas it is more evident in other two shades.

3.2. Modeling the Color Appearance of Carpets

Multiple linear regression analysis was performed to identify which test variables are affecting the CIE L*, a*, and b* values. The L*, a*, and b* values were assumed as individual dependent variables while using stepwise multiple linear regression under different illuminants for different colors. This is to address the change in every axis of the CIELAB scale. The independent variables for the regression analysis were the pile height, stitch rate, gauge of the carpet, and dye concentration. The consideration of dye concentration as an independent variable in the equations is due to addressing the shade variations. Illuminants and colors were addressed as test conditions rather than independent variables, as the interaction between dye/colorant molecules and illuminants’ wavelengths varies depending on the energy absorption pattern of the corresponding dye/colorants. Hence, a set of 18 (3 × 3 × 2) regression equations were developed for three dependent variables (L*, a*, and b*) while considering three different illuminants and two different colors.
For the regression analyses, p-values ≤ 0.05 were considered statistically significant. At each stage of the stepwise regression process, the independent variables that had the weakest correlation with the dependent variables were eliminated from the model. This could only happen if the variable satisfied the elimination criterion, which is p > 0.05. The process ended when there were no longer any variables in the model that met the criteria for elimination (all variables in the model had p-values ≤ 0.05). Several equations were derived by utilizing the significant parameters affecting the L*, a*, and b* values under different illuminants and colors, which are included in Table 7. In the equations, g = gauge of the carpet, s = stitch rate of the carpet, p = pile height of the carpet, and d = dye concentration. The summary of the regression analysis is presented in Table 7.
Table 7 revealed that the R square values for statistical models were between 0.60–0.92, which means nearly 60–92% of the L*, a*, and b* values can be explained by the carpet features and the dye concentration. Here, out of 18 equations, only 3 equations have R2 values less than 0.70. This is indicating a good amount of data variations can be explained by such equations especially considering the wide range color variability in lightness, chroma, and hue scales. These equations can be used for color-prediction model development. For lower R2 < 0.70 values, other parameters can be considered to develop better color-predicting statistical models. Variations in the R square values could be associated with the corresponding dye particle used to dye the carpets, as it determines the absorption and reflection of certain wavelengths of incident lights. The residual sum of squares (RSS) for the generated models is <40. However, for the larger RSS values, the squared mean of the dependent variables was also found to be significantly higher.
From the table, it is realized that dye concentration has the most significant impact on the L*, a*, and b* values. From the equations, it has been observed that increasing the dye/colorant molecules in the carpet structure will reduce the corresponding color scale values (|±L*|, |±a*|, and |±b*|), which actually causes the gradual shading from light to darker color of the same hue.
For carpet features, pile height has the most significant impact compared to stitch rate and gauge. For red-colored carpets, the effects of carpet feature over L*, a*, and b* values were more prominent. Pile height and stitch rate were found to be negatively affecting the values in all illuminants, where pile height has the most significant impact compared to stitch rate. Negative coefficients refer to the inverse relationship with the dependent variables. This means that the lower the pile height and stitch rate, higher the availability of yarn in the horizontal loop-arch plane, which in turn increases the values of L*, a* and b*. For green-colored carpets, only dye concentration was found to be significantly affecting the L* and a* values, except for the fluorescent illuminant. Carpet features become prominent in the F02 illuminant. This could be the higher relative power of the green wavelength in F02 illuminants’ spectra. The differences in MLR models for red and green colored carpets can again be associated with the corresponding dye/colorant molecules’ energy absorption/reflection pattern. The nondominant hue measured via the b* values were found to be affected by all the carpet features, positively by gauge and negatively by stitch rate and pile height. This again refers to the availability of more yarn in the horizontal loop-arch plane. In summary of the MLR modeling, it can be inferred that the apparent color of the loop-pile carpet is mostly affected by the colorant concentration on the loop-arch yarn. Moreover, pile height, stitch rate and gauge determine the availability of loop-arch yarn on the carpet pile surface, which could significantly affect the light reflection and subsequent color perception.

4. Summary and Conclusions

The influence of carpet structure and resultant texture on color perception has been investigated in this study. Different shades of two colors were considered under three different illuminants to analyze the subsequent variability caused by carpet features. Color values have been evaluated by the CIELAB scale, where it has been observed that the L*, a*, and b* values were reduced with the increasing concentration of dye/colorant molecules based on the incident light’s absorption, scattering, and reflection. Carpet features have been found to be affecting the L*, a*, and b* values either significantly or insignificantly, depending on the dye and shade conditions. In the case of gradual shading from light to dark light, significant variations in L*, a*, and b* values can be observed based on the presence of colorant molecules on the light-reflecting loop-arch planes. For a darker shade, more colorants being present in the loop-arch plane can minimize the difference in perceived lightness (L*) for different carpets dyed with the same condition. However, more colorants can also cause significant variations among different carpets on the chroma scale (a* and b* values) in the same dyed condition. However, such variations can again become insignificant if the corresponding values are very small, which indicates a shift to the grey scale (CIE L axis).
Different illumination sees similar trends in L*, a*, and b* values for different carpets, however, in varying degrees due to the different power distribution of the colored wavelengths of incident light. MLR analyses were performed to assess how the significant parameters affected the L*, a, and b* values. Regression equations were developed from the MLR analyses, which can estimate the L*, a*, and b* values under a definite illuminant with a definite color. From the MLR, it is noticeable that based on the absorption and reflection pattern of the corresponding dye/colorant molecules, pile height and stitch rate could significantly affect color perception. The effect of the dye/colorant concentration is significant in all of the causes due to the gradual shading process, significantly contributing to every prediction of the carpet in terms of chroma and lightness values.
This study implies that carpet structures can affect color perception either significantly or insignificantly based on color, shade, and illuminant types. While consumers buy carpets based on the primary perception of the color, it can be significantly affected by the interaction of carpet features and different illuminants of the interior settings, which could greatly affect customer satisfaction. Hence, to prevent the mismatch of the color appearance of carpets under different illuminants, it is necessary to accurately predict the color. This study is initiated with two different colors to investigate the effect of carpet structures and shades over color perception under different illuminants as a part of long-term project. Other colors and carpet properties could be included in future studies. This could provide holistic information of color variations in the predicting models. The equations of the regression model could be further utilized to develop an app which will be efficient in addressing the variety of color perceptions for different carpet structures, colors, shades, and illuminants. When the carpets will be scanned through the app, it will generate different images of the carpets for different illuminants that can facilitate the carpet selection of consumers.

Author Contributions

S.M.: conceptualization, designing experiments, writing, data analysis, supervision, funding acquisition, project administration. I.Z.C.: Literature review, conducting experiments, writing, and data analysis. P.R.H.: conceptualization, supervision, funding acquisition, project administration. A.P.: conceptualization, supervision, funding acquisition, project administration. S.I.T.: Literature review, conducting experiments, writing, and data analysis. M.M.I.: Literature review, writing, and data analysis. L.M.B.: funding acquisition. All authors have read and agreed to the published version of the manuscript.

Funding

Research Project Grants in Humanities-, Arts-, and Design-Based Disciplines (HAD Research Grants); and Equipment and Software Grant from Oklahoma State University, USA.

Institutional Review Board Statement

Not applicable.

Informed Consent Statement

Not applicable.

Data Availability Statement

The data presented in this study are available on request from the corresponding author.

Acknowledgments

S.M. would like to thank Oklahoma State University, USA, for providing him HAD Research Grant to conduct this research. I.Z.C., S.I.T., is grateful to the department of Design and Merchandising of Oklahoma State University, USA, for providing them with the research assistantship.

Conflicts of Interest

The authors declare no conflict of interest.

References

  1. Kerfoot, S.; Davies, B.; Ward, P. Visual merchandising and the creation of discernible retail brands. Int. J. Retail Distrib. Manag. 2003, 31. [Google Scholar] [CrossRef]
  2. Hinks, D.; Draper, S.; Che, Q.; Nakpathom, M.; El-Shafel, A.; Connelly, A. Assessment of the effect of lighting variability on color difference. AATCC Rev. 2000, 32, 16–20. [Google Scholar]
  3. Kadolph, S.J.; Marcketti, S.B. Textiles; Pearson: New York City, NY, USA, 2016. [Google Scholar]
  4. Kulappurath, S.K.; Shamey, R. The effect of luminance on the perception of small color differences. Color Res. Appl. 2021, 46, 929–942. [Google Scholar] [CrossRef]
  5. Hoover, K.D. The Demise of Cool White Fluorescent—An Opportunity to Reassess Illuminant Specification. Text. Chem. Color. 1997, 29, 23–27. [Google Scholar]
  6. Pegler, M.M.; Bliss, L.L. Visual Merchandising and Display; Fairchild Publications: New York, NY, USA, 2006. [Google Scholar]
  7. Chu, A.; Rahman, O.; Mandal, S. A cross-cultural study of the relationships between colours and products. In Proceedings of the International Colour Association (AIC) Conference, Zurich, Switzerland, 7–10 June 2011. [Google Scholar]
  8. Hinks, D.; Shamey, R. Review of retail store lighting: Implications for colour control of products. Color. Technol. 2011, 127, 121–128. [Google Scholar] [CrossRef]
  9. Yaoyuneyong, G.; Moore, M.A. The impact of lighting on textile color: Controlling quality from the supply chain to retail display. Text. Light Ind. Sci. Technol. 2016, 5, 16–28. [Google Scholar] [CrossRef]
  10. Petrova, A.; Hébert, P.R. Exploration of new light and color instruments for design education: Exploring the effect of light on color samples. In Proceedings of the Western Social Science Association (WSSA) Virtual Conference, Online, 4 April 2020. [Google Scholar]
  11. Hebert, P.R.; Mandal, S.; Chowdhury, I.; Petrova, A. Considering the Color of Carpets under Different Light Sources. In 7th Building Technology Alliance; WordPress: Khon Kaen, Thailand, 2022; pp. 82–86. [Google Scholar]
  12. Hébert, P.R.; Petrova, A.; Clare, G.; Pei, Y. Exploring New Light and Color Instrumentsfor Multidisciplinary Students’ Use: Empirical Properties of Existing Building Illumination and the Effects of Light on Color Samples. J. Build. Energy Environ. 2018, 1, 5–16. [Google Scholar]
  13. Öktem, T.; Gürel, A.; Akdemir, H. The Characteristic Attributes and Performance of Naturally Colored Cotton. AATCC Rev. 2003, 3, 24–27. [Google Scholar]
  14. Huang, Z.; Chen, W.; Liu, Q.; Wang, Y.; Pointer, M.R.; Liu, Y.; Liang, J. Towards an optimum colour preference metric for white light sources: A comprehensive investigation based on empirical data. Opt. Express 2021, 29, 6302–6319. [Google Scholar] [CrossRef]
  15. Tang, J.; Guo, Y.; Xu, C. Color effect of light sources on peridot based on CIE1976 L* a* b* color system and round RGB diagram system. Color Res. Appl. 2019, 44, 932–940. [Google Scholar] [CrossRef]
  16. Nitse, P.S.; Parker, K.R.; Krumwiede, D.; Ottaway, T. The impact of color in the e-commerce marketing of fashions: An exploratory study. Eur. J. Mark. 2004, 38. [Google Scholar] [CrossRef]
  17. Parker, K.R.; Nitse, P.S.; Tay, S.M.A. The impact of inaccurate color on customer retention and CRM. Inf. Sci. 2009, 12, 105. [Google Scholar]
  18. Clare, G.P.; Hebert, P.; Lee, H.-J.; Kang, M.; Chung, Y.; Leong, J.; Slevitch, L. Seeing the Light: Consumer Perceptions of Ground Beef Packages. Management 2014, 4, 77–89. [Google Scholar] [CrossRef]
  19. Luo, L.; Tsang, K.M.; Shen, H.L.; Shao, S.J.; Xin, J.H. An investigation of how the texture surface of a fabric influences its instrumental color. Color Res. Appl. 2015, 40, 472–482. [Google Scholar] [CrossRef]
  20. Lin, J.; Shamey, R.; Trussell, J. The Effect of Texture on Perception and Measurement of Whiteness. AATCC Rev. 2012, 12, 61–68. [Google Scholar]
  21. Schüpbach, R.L.; Reisinger, M.; Schrader, B. Influence of lighting conditions on the appearance of typical interior materials. Color Res. Appl. 2015, 40, 50–61. [Google Scholar] [CrossRef]
  22. Wood, E.J. Description and measurement of carpet appearance. Text. Res. J. 1993, 63, 580–594. [Google Scholar] [CrossRef]
  23. Shams-Nateri, A.; Hajipour, A.; Veysian, M. The optical properties of hand-woven carpet. J. Text. Inst. 2020, 111, 694–700. [Google Scholar] [CrossRef]
  24. Abdullayeva, G.; Kazim-Zada, A. Recognition and identification of plane color images in the case of carpet designs. Autom. Control Comput. Sci. 2008, 42, 288–294. [Google Scholar] [CrossRef]
  25. Pourdeyhimi, B. Evaluating carpet appearance loss: Color change. Text. Res. J. 1994, 64, 485–490. [Google Scholar] [CrossRef]
  26. Önder, E.; Berkalp, Ö.B. Effects of different structural parameters on carpet physical properties. Text. Res. J. 2001, 71, 549–555. [Google Scholar] [CrossRef]
  27. Bleaching Wool Using Hydrogen Peroxide. Available online: https://prochemicalanddye.net/downloads/dl/file/id/89/product/0/bleaching_wool_directions.pdf (accessed on 15 June 2022).
  28. Immersion Dyeing on Wool Using WashFast Acid Dyes. Available online: https://prochemicalanddye.net/downloads/dl/file/id/192/product/0/immersion_dyeing_on_wool_using_pro_washfast_acid_dyes.pdf (accessed on 15 June 2022).
  29. Chavolla, E.; Zaldivar, D.; Cuevas, E.; Perez, M.A. Color spaces advantages and disadvantages in image color clustering segmentation. In Advances in Soft Computing and Machine Learning in Image Processing; Springer: Cham, Switzerland, 2018; pp. 3–22. [Google Scholar]
  30. Ganesan, P.; Rajini, V.; Rajkumar, R.I. Segmentation and edge detection of color images using CIELAB color space and edge detectors. In Proceedings of the INTERACT-2010, Chennai, India, 3–5 December 2010; pp. 393–397. [Google Scholar]
  31. Davis, W.; Ohno, Y. Color quality scale. Opt. Eng. 2010, 49, 033602. [Google Scholar] [CrossRef] [Green Version]
  32. Robertson, A.R. Computation of correlated color temperature and distribution temperature. JOSA 1968, 58, 1528–1535. [Google Scholar] [CrossRef]
  33. Shams-Nateri, A. Evaluating textile fabric color variation by scanner. Res. J. Text. Appar. 2007, 11. [Google Scholar] [CrossRef]
  34. Safi, M.; Soleymanian, T. Scanner colorimetric characterization for concentration estimation in single-component dyeing systems. J. Text. Inst. 2017, 108, 2040–2045. [Google Scholar] [CrossRef]
  35. Džimbeg-Malčić, V.; Barbarić-Mikočević, Ž.; Itrić, K. Kubelka-Munk theory in describing optical properties of paper (I). Teh. Vjesn. 2011, 18, 117–124. [Google Scholar]
  36. Kokhanovsky, A.A. Physical interpretation and accuracy of the Kubelka–Munk theory. J. Phys. D Appl. Phys. 2007, 40, 2210. [Google Scholar] [CrossRef]
  37. Yang, L.; Kruse, B. Revised Kubelka–Munk theory. I. Theory and application. JOSA A 2004, 21, 1933–1941. [Google Scholar] [CrossRef]
  38. Hossen, M.; Imran. Study on Color Strength of Different Reactive Dyes. J. Text. Sci. Eng. 2017, 7, 2. [Google Scholar] [CrossRef]
  39. Becerir, B. Color concept in textiles: A review. J Text. Eng Fash. Technol. 2017, 1, 240–244. [Google Scholar] [CrossRef] [Green Version]
  40. Holmes, W.C. The Influence of Variation in Concentration on the Absorption Spectra of Dye Solutions. Ind. Eng. Chem. 1924, 16, 35–40. [Google Scholar] [CrossRef]
  41. Chakraborty, J. Fundamentals and Practices in Colouration of Textiles; CRC Press: Boca Raton, FL, USA, 2015. [Google Scholar]
  42. Oulton, D.; Chen, P. Colour change sensitivity of dye recipes. J. Soc. Dye. Colour. 1995, 111, 237–244. [Google Scholar] [CrossRef]
  43. Two Essential Components of a Great Color Program. Available online: https://www.xrite.com/blog/two-essential-components-color-program (accessed on 23 July 2022).
  44. Corbalan-Fuertes, M.; Garcia-Verela, M.S.M.; Yzuel, M.J. Color measurement in standard CIELAB coordinates using a 3CCD camera: Correction for the influence of the light source. Opt. Eng. 2000, 39, 1470–1476. [Google Scholar]
  45. Becerir, B. Assessment of colour properties of reactive dyed cotton fabrics under different illuminants by using cielab and hunter systems. Tekst. Konfeksiyon 2010, 20, 145–154. [Google Scholar]
Figure 1. Undyed and Dyed carpets; images were taken under CWF illuminant (a) carpet 1, (b) carpet 2, (c) carpet 3, and (d) carpet 4 (pictures resolution: 4032 × 3024 pixels).
Applsci 13 00500 g001
Figure 2. CIELAB color space.
Applsci 13 00500 g002
Figure 3. CIE L*, a*, and b* values for D65/10 illumination of different carpets dyed in different shades of red and green color (a) L* values for red-colored carpets (b) L* values for green-colored carpets (c) a* values for red-colored carpets (d) a* values for green-colored carpets (e) b* values for red-colored carpets (f) b* values for green-colored carpets.
Applsci 13 00500 g003
Figure 4. sketches of carpet loop structure (a) carpet 1, (b) carpet 2, (c) carpet 3, and (d) carpet 4.
Applsci 13 00500 g004
Figure 5. CIE L*, a*, and b* values for A/10 illumination of different carpets dyed in different shades of red and green color (a) L* values for red-colored carpets (b) L* values for green-colored carpets (c) a* values for red-colored carpets (d) a* values for green-colored carpets (e) b* values for red-colored carpets (f) b* values for green-colored carpets.
Applsci 13 00500 g005
Figure 6. Images of reflectance spectra [43].
Applsci 13 00500 g006
Figure 7. CIE L*, a*, and b* values for F02/10 illumination of different carpets dyed in different shades of red and green colors (a) L* values for red-colored carpets (b) L* values for green-colored carpets (c) a* values for red-colored carpets (d) a* values for green-colored carpets (e) b* values for red-colored carpets (f) b* values for green-colored carpets.
Applsci 13 00500 g007
Figure 8. Images of the carpet 1 under different illuminants. Image (a,d,g) refers to the views under D65 (noon daylight), images (b,e,h) refers to refers to the views under A (incandescent) and images (c,f,i) refers to refers to the views under F02 (cool white fluorescent) for a certain carpet with three different shades (picture resolution: 4032 × 3024 pixels).
Applsci 13 00500 g008
Table 1. Specifications of four different carpets.
Carpet Type No.Yarn Weight (Oz)Gauge (Inch)Stitch Rate (per Inch)Pile Height (Inch)Carpet Density (Oz/Yard3)
1330.167.670.18756336
2500.31255.50.31255760
3600.31253.750.31256912
4540.550.3125 × 0.375 (pattern loop with two different loop heights)5634
Table 2. Amount of Chemicals required for the scouring and bleaching process for a single batch.
Carpet Type NoAverage Sample WeightWater 4 L/lbsScouringBleachingNeutralizing
Sodium Carbonate 2.5 gm/lbs *Detergent 2.5 mL/lbsSodium Carbonate 68 gm/lbs *Detergent 2.5 mL/lbsHydrogen PeroxideWhite Vinegar
175.5 gm0.67 L0.33 gm0.42 mL11.39 gm0.84 mL41.88 mL27.63 mL
262.8 gm0.55 L0.27 gm0.35 mL9.35 gm0.69 mL34.38 mL22.69 mL
384.33 gm0.74 L0.37 gm0.46 mL12.58 gm0.93 mL46.25 mL30.53 mL
485.97 gm0.76 L0.38 gm0.47 mL12.92 gm0.95 mL47.5 mL31.35 mL
Total308.6 gm2.72 L1.35 gm1.47 mL46.24 gm3.41 mL170.01 mL112.2 mL
* Powdered chemicals were measured in gm scale as per batch weight in lbs. * 1 gm = 0.0022 lbs.
Table 3. Amount of chemicals required for preparing the dyeing solution for one batch of carpets. Corresponding batch weight ≈ 308.6 gm.
ShadeLightMediumDark
Chemicals Water
250 mL/lbs
Dye
1.2 gm/lbs *
Water
250 mL/lbs
Dye
4.5 gm/lbs *
Water
500 mL/lbs
Dye
9 gm/lbs *
Required amount 169.9 mL0.816 gm169.9 mL3.06 gm340 mL6.12 gm
* Powdered chemicals were measured in gm scale as per batch weight in lbs. * 1 gm = 0.0022 lbs.
Table 4. Amount of chemicals required for the dye bath for dyeing one batch of carpets. Corresponding batch weight ≈ 308.6 gm.
Dyeing ProtocolsDye Bath PreparationImproving Dye Take Up
ChemicalsWater
14 L/lbs
White Vinegar
165 mL/lbs
Common Salt
15 gm/lbs *
White Vinegar
100 mL/lbs
Required amount9.52 L112.16 mL10.2 gm68 mL
* Powdered chemicals were measured in gm scale as per batch weight in lbs. * 1 gm = 0.0022 lbs.
Table 5. Dye concentration in the dye bath.
ShadeLightMediumDark
Dye Concentration in the Dye Bath0.08 g/Liter0.32 g/Liter0.62 g/Liter
Table 6. Illuminant temperatures.
IlluminantsLight TemperaturesCRI
A (incandescent)≈2850 K100
D65 (noon daylight)≈6500 K96
F02 (Cool White Fluorescent)≈100 K62
Table 7. Summary of the outcome of the regression analysis.
IlluminantColorDependent VariableR Squarep-Value of Gaugep-Value of Stitch Ratep-Value of Pile Heightp-Value of Dye ConcentrationEquation (g = Gauge of the Carpet, s = Stitch Rate of the Carpet, p = Pile Height of the Carpet, and d = Dye Concentration.)
D65RedL*0.87>0.050.040.030.00L = 44.76 − 22.33 d − s − 25.59 p
a*0.92>0.050.010.000.00a = 63.30 − 31.47 d − 1.48 s − 38.55 p
b*0.88>0.050.030.030.00b = 28.94 − 15.05 d − 0.69 s − 15.58 p
GreenL*0.77>0.05>0.05>0.050.00L = 38.61 − 32.68 d
a*0.66>0.05>0.05>0.050.00a = −29.54 + 12.16 d
b*0.740.000.000.000.00b = 33.65 − 7.23 d + 31.64 g − 1.96 s − 90.44 p
A10RedL*0.88>0.050.020.020.00L = 53.91 − 26.75 d − 1.21 s − 30.89 p
a*0.90>0.050.010.010.00a = 59.38 − 26.57 d − 1.23 s − 32.03 p
b*0.90>0.050.010.010.00b = 46.50 − 24 d − 1.10 s − 26.41 p
GreenL*0.76>0.05>0.05>0.050.00L = 35.97 − 31.89 d
a*0.66>0.05>0.05>0.050.00a = −24.11 + 10.8 d
b*0.600.000.000.000.00b = 26.06 − 4.65 d + 29.73 g − 1.95 s − 87.75 p
F02/10RedL*0.86>0.050.040.030.00L = 46.74 − 24.18 d − 1.1 s − 28.02 p
a*0.92>0.050.000.000.00a = 48.42 − 25.19 d − 1.21 s − 30.92 p
b*0.92>0.050.000.010.00b = 30.86 − 17.08 d − 0.81 s − 18.5 p
GreenL*0.76>0.05>0.05>0.050.00L = 35.98 − 32.38 d
a*0.790.000.050.010.00a = −31.58 + 10.41 d − 14.95 g + 0.75 s + 39.02 p
b*0.700.000.000.000.00b = 33.78 − 7.94 d + 33.17 g − 2.16 s − 96.93 p
Disclaimer/Publisher’s Note: The statements, opinions and data contained in all publications are solely those of the individual author(s) and contributor(s) and not of MDPI and/or the editor(s). MDPI and/or the editor(s) disclaim responsibility for any injury to people or property resulting from any ideas, methods, instructions or products referred to in the content.