Article

Investigation of Mechanical Properties of Al/CNT Nanocomposites Produced by Powder Metallurgy

1
Department of Metallurgical and Materials Engineering (DEMM), University of Porto, Rua Dr. Roberto Frias, 4200-465 Porto, Portugal
2
Institute of Science and Innovation in Mechanical and Industrial Engineering (LAETA/INEGI), Rua Dr. Roberto Frias, 4200-465 Porto, Portugal
*
Author to whom correspondence should be addressed.
Appl. Sci. 2023, 13(1), 54; https://doi.org/10.3390/app13010054
Submission received: 29 November 2022 / Revised: 13 December 2022 / Accepted: 16 December 2022 / Published: 21 December 2022

Abstract

:
Demanding requirements in automotive and aerospace applications promote the growing need to obtain materials and advanced technology capable of combining low weight with high mechanical properties. Aluminum matrix nanocomposites could be great candidates to respond to such needs. In this sense, this investigation aims to study the mechanical properties of nanocomposites of aluminum matrices reinforced with carbon nanotubes (CNTs). The nanocomposites were produced by powder metallurgy with 1.00 vol.% of reinforcement and ultrasonication as the dispersion method. Tensile, Vickers microhardness and nanoindentation tests were carried out in different sections. Microstructural characterizations were conducted in scanning electron microscopy (SEM) and electron backscattered diffraction (EBSD) to understand and relate to the mechanical properties. An increase in the yield strength of 185% was observed for the nanocomposites, which can be attributed to the load transfer mechanism. However, the CNTs observed at the grain boundaries promote a decrease in the ductility of the nanocomposites. The mechanical behavior of the nanocomposites was further investigated by EBSD observation. The results revealed that the nanocomposites have a less extensive area of plastic deformation than the Al matrix, which is consistent with the tensile results. The presence of reinforcement affects the lattice rotation during the tensile test and the active slip systems, thus affecting their deformation behavior.

1. Introduction

The automotive and aerospace industries increasingly demand lightweight materials with high strength and stiffness to achieve the established requirements to reduce vehicle weight, increase fuel efficiency and lower emissions. Aluminum matrix nanocomposites could be an attractive option to meet the requirements demanded by these industries [1,2].
Carbon nanotubes, mainly due to their mechanical properties, could be the ideal reinforcement material for these nanocomposites. In this sense, aluminum nanocomposites reinforced by carbon nanotubes (Al/CNT) may have the advantage of being potential candidates for lightweight components with high mechanical strength even when only a small amount of CNTs are added [3,4,5,6,7,8,9,10,11]. However, some challenges in producing these nanocomposites must be overcome to obtain properties close to potential ones. Due to the formation of CNT agglomerates and damage to its structure during the processing of the nanocomposite, the reinforcement potential is compromised, resulting in lower mechanical properties than expected. Previous work has shown that the effectiveness of the reinforcement effect increases with a better reinforcement dispersion, with better results observed in nanocomposites with 1.00 vol.% CNTs dispersed by ultrasonication [12,13,14].
The mechanical properties of nanocomposites must therefore be investigated to assess the dispersion of CNTs, production conditions, the effect of the CNTs fraction and the interfacial bonding of Al/CNTs to evaluate the effect of reinforcement on the final component. For instance, an increase in CNT fraction can promote an increase in the elastic modulus of the composite from 70 GPa to about 110 GPa for CNT addition from 1 to 5 vol.% [3]. However, in the case of poor dispersion of the CNTs, an increase in the fraction can also decrease the elastic modulus due to the formation of large CNT clusters. Due to CNT agglomeration and a reduced load transfer, the stiffness increase rate decreases as CNT content increases [3,4,5,6,7,8].
In this context, some published works investigate the mechanical properties of Al/CNTs nanocomposites produced by different processes and with different fractions of CNTs [3,4,5,6,7,8,9,10,11].
Fan et al. [5] investigated the conditions of the dispersion method in the mechanical properties of the Al/CNTs nanocomposites produced by powder metallurgy. The nanocomposites were produced with 3.00 vol.% of CNTs using high-energy ball milling. The nanocomposites revealed higher tensile strength and Young modulus than the Al matrix did. These results were attributed to the uniform CNTs distribution obtained for 2 h of ball-milling samples.
Shahrdami et al. [6] produced Al/CNTs with different CNTs fractions by ball milling and hot pressing. The yield strength of the nanocomposites increases until 1 wt.% CNTs than the Al matrix, and then it was observed a decrease. The decrease observed for higher amounts of CNTs than 1 wt.% can be explained due to the formation of CNTs clusters.
Zhang et al. [7] studied the mechanical properties of Al/CNTs nanocomposites produced by friction stir welding. The authors observed an enhancement of yield and tensile strength of ≈105 and ≈52%, respectively, while the elongation went from ≈39.5 to ≈24.0% when added 3.20 vol.% CNTs. The authors also observed the fracture surface, seeing the presence of dimples in both Al and the nanocomposite, showing that both had a typical ductile fracture.
Xie et al. [11] observed the same type of fracture surface for the nanocomposites of Al/CNTs produced by powder metallurgy with two different types of CNTs. The CNTs used presented higher and lower aspect ratios. The authors observed a maximum increase in tensile and yield strength of ≈50% and ≈48%, respectively, for concentrations of 0.5 wt.% lower aspect ratio CNTs than aluminum matrix samples.
Chen et al. [8] developed a new approach to improve the interfacial bonding of Al and CNT to enhance the mechanical properties of the nanocomposites. The authors produced the nanocomposites with CNTs with Cu nanoparticles. The nanocomposites were produced by spark plasma sintering. The tensile test results revealed an increase of 105.2% for tensile strength and 54.2% for the elongation than the Al matrix. The presence of the Cu nanoparticles improves the interfacial bonding between the Al and CNTs, playing a crucial role in the load transfer mechanism.
In previous works, an intense microstructural characterization was carried out to determine the best dispersion method and processing conditions in the powder metallurgy of Al/CNTs [12,13,14,15]. However, a detailed study was not conducted to evaluate the mechanical properties of nanocomposites produced under the best conditions. The mechanical characterization at different scales allows knowing to what extent the process can influence the final properties of the component. The main objective of this work consists of a depth mechanical characterization of Al/CNT nanocomposites produced by the powder metallurgy route and a relationship with a microstructural characterization to establish a deformation behavior for the nanocomposites.

2. Materials and Methods

Al and nanocomposite samples were produced through a powder metallurgy route where the aluminum powder was dispersed/mixed to 1.00 vol.% of multi-walled carbon nanotubes. Both the aluminum powders from Goodfellow Cambridge Ltd. (Huntingdon, UK) and the carbon nanotubes from Fibermax Nanocomposites Ltd. (London, UK) were fully characterized with advanced techniques, such as SEM, TEM, HRTEM and RAMAN in previous works [12,13,14,15,16,17,18,19]. In these works, morphology and microstructure were studied to know the powders to a great extent and to evaluate the damage of the CNT during the nanocomposite production. The characterization of the aluminum powders was performed using SEM images and EBSD analysis using a Thermo Fisher Scientific QUANTA 400 FEG SEM (Thermo Fisher Scientific, Hillsboro, OR, USA) with an EBSD detector TSL-EDAX EBSD Unit (EDAX Inc. (Ametek), Mahwah, NJ, USA). The metallic particle analysis was also performed using dynamic light scattering (DLS) in a Laser Coulter LS230 (Beckman Coulter, Inc., Brea, CA, USA). The morphology of CNTs was observed by SEM and by high-resolution TEM (HRTEM, JEOL Ltd., Tokyo, Japan). The carbon nanotubes were characterized using the same SEM equipment as mentioned before, especially with a JEOL high-resolution electron microscope (JEOL Ltd., Tokyo, Japan).
Since the strengthening effect and, consequently, the mechanical properties of the nanocomposite are directly associated with the dispersion of the reinforcement in the matrix, the dispersion/mixture technique was ultrasonication. This was based on previous works [12,13,14,15] being the most efficient method compared with others. The dispersion and mixture of the Al and CNTs (1.00 vol.%) were performed in a single step using ultrasonication and isopropanol for 15 min using 20–400 rpm. These mixtures were then cold-pressed with 300 MPa using a metallic mould with the geometry of the tensile test specimen. The tensile test specimen geometry is described elsewhere [14]. The compact was sintered at 640 °C for 90 min under a high vacuum to avoid oxidation.
The tensile test was performed with a velocity of 0.2 mm/s, using Shimadzu EZ Test equipment (Shimadzu Corporation, Kyoto, Japan), and four samples of each, nanocomposite and aluminium matrix, were tested. It is important to mention that to enable the comparison between them, both Al and Al/CNTs powders were ultrasonicated, cold-pressed and sintered under the same conditions. Nanoindentation tests using Micro Materials–NanoTest equipment with a Berkovich diamond indenter (NanoTest, Micro Materials Limited, Wrexham, UK) were conducted to investigate the hardness and reduced Young’s modulus. The depth-sensing indentation test was performed in load control mode up to a maximum load of 20 mN. Indentation matrixes formed by rows and columns were defined.
Further microstructural analysis and microhardness tests were performed on the fractured tensile specimen. The fracture surface was analyzed using the digital microscope Leica DVM6 and Leica LAS X software (Leica Microsystems, Wetzlar, Germany) and by SEM. After tensile testing, this characterization was conducted in Al and nanocomposite for comparison behavior.
For the microstructural characterization, since the electron backscattered technique (EBSD) is a very powerful characterization technique for investigation deformation behaviors, the top view of fractured tensile samples was analyzed by high-resolution SEM (Thermo Fisher Scientific QUANTA 400 FEG SEM, Thermo Fisher Scientific, Hillsboro, OR, USA), coupled to an EBSD detector TSL-EDAX EBSD Unit (EDAX Inc. (Ametek), Mahwah, NJ, USA). However, to avoid dubious results and indexing errors, the obtained data were submitted to a routine clean-up where the grain tolerance angle was determined to be 15° and the need of 2 points minimum to define a grain. This cleaned data was used by the software of EBSD analysis TSL OIM Analysis 5.2 (EDAX Inc. (Ametek), Mahwah, NJ, USA) to perform the characterization through different EBSD results as described in previous works [16,17,18,19]. These EBSD maps also allowed the average grain size measurements using the grain maps combined by the Image J software (version 1.51, Wayne Rasban, National Institutes of Health, Bethesda MD, USA) to perform the measurement of 180–190 grains per sample. Along with that, as a complement, the ATEX software version 3.28 (University of Lorraine, Metz, France) [20] was also used especially to elaborate average geometrically necessary dislocations (GNDs) density maps and measures.
The tensile specimens were evaluated through EBSD into two different areas: one closer to the fracture surface (2.00 mm to this surface) and another further away (10.00 mm from the fracture), where the deformation is expected to be less significant. The areas of the fractured tensile specimen characterized by EBSD were schematized in Figure 1.
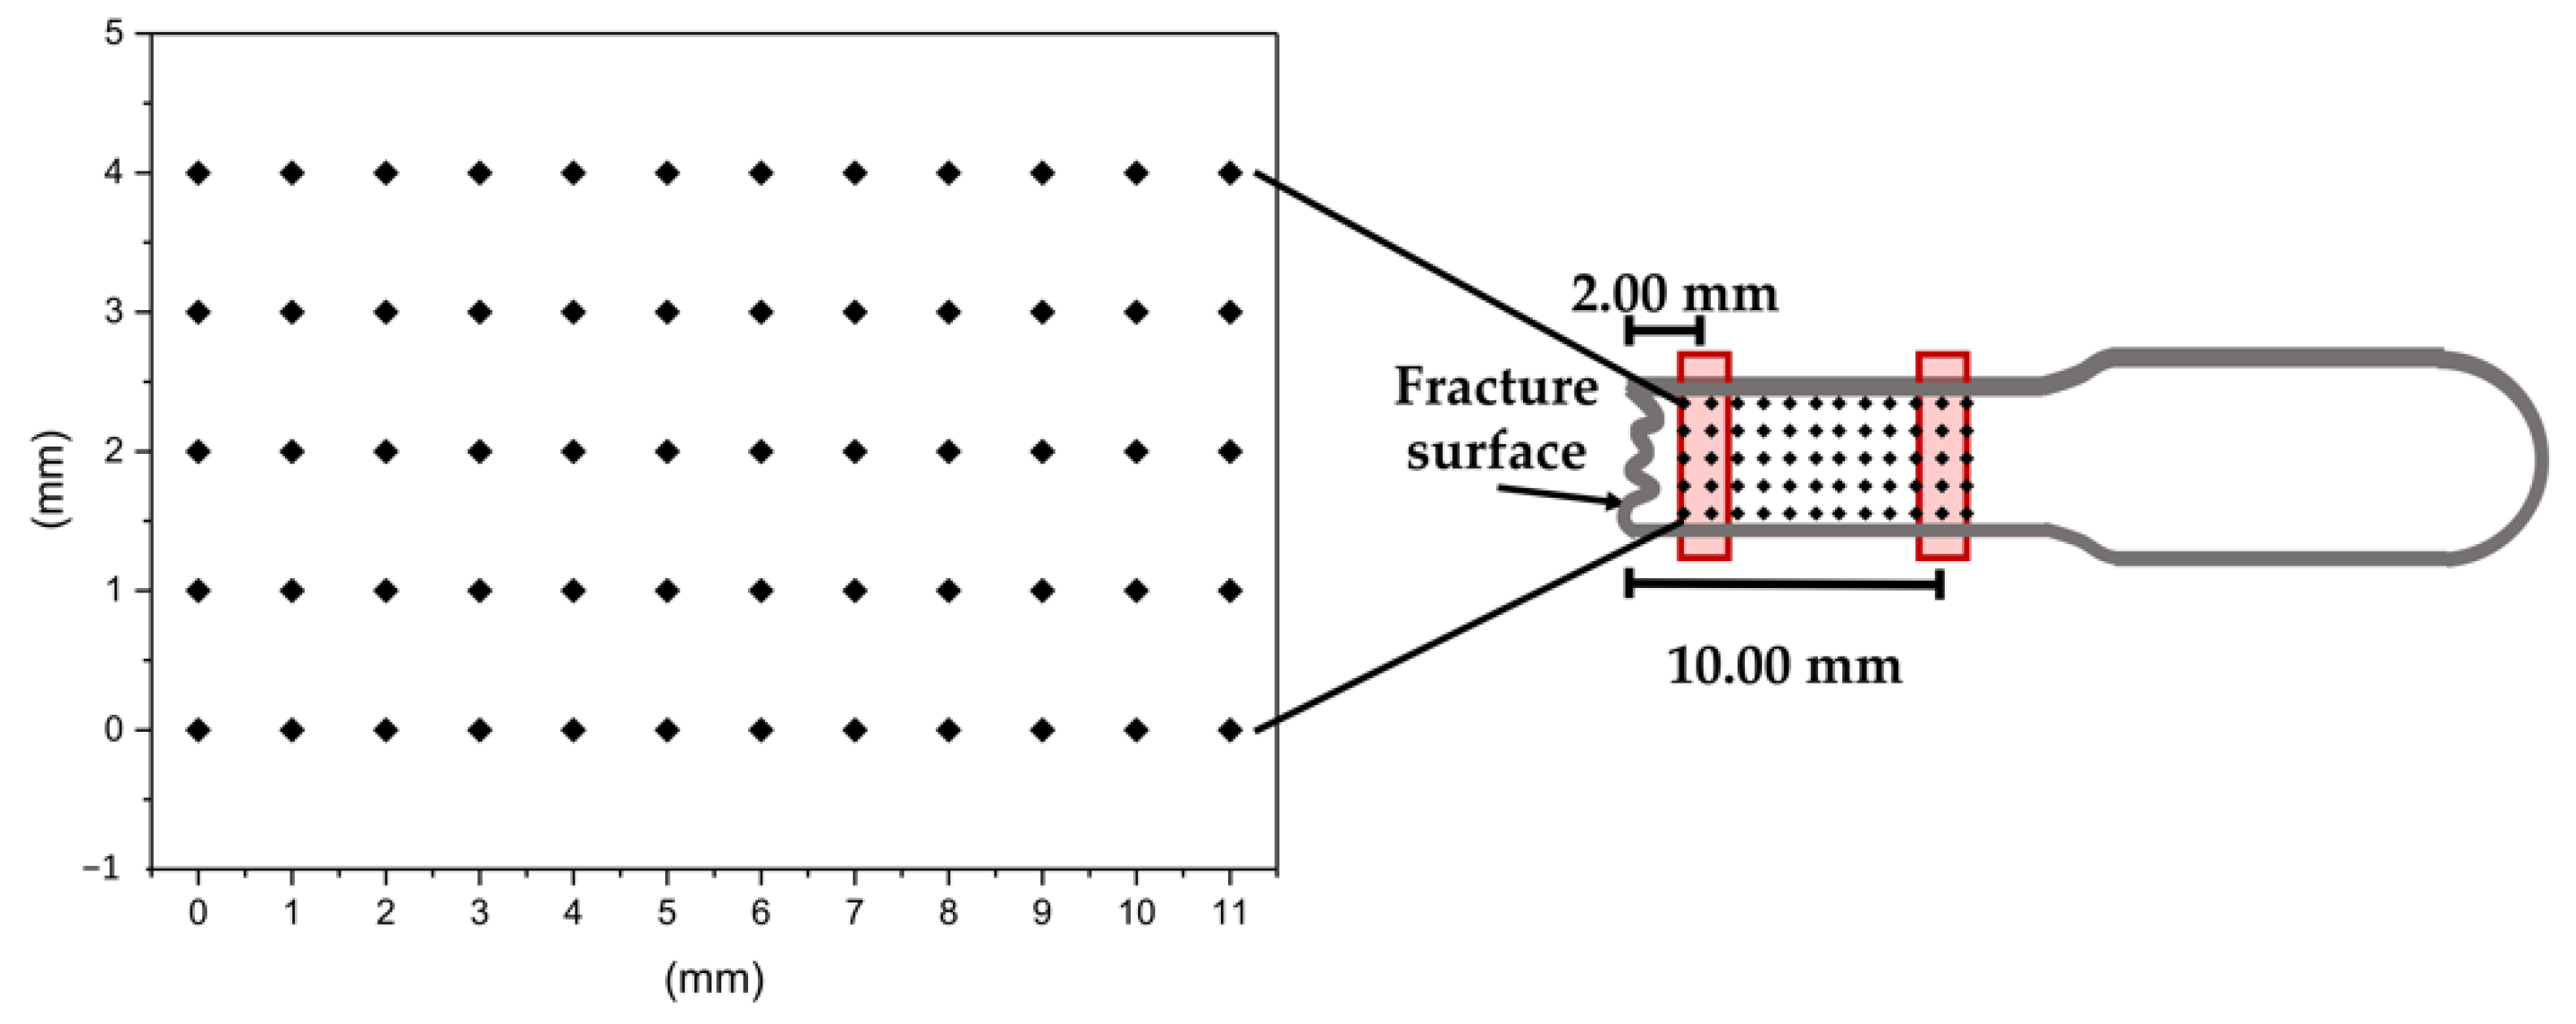
The mechanical characterization performed through the tensile test was also studied to comprehend the deformation evolution within this zone and the CNTs’ influence. Vickers microhardness tests were performed using a Duramin-1 durometer (Duramin-1; Struers A/S, Ballerup, Denmark) with a 98 mN. To investigate this evolution in detail, 60 indentations were performed and organized in 5 profiles from the fracture surface into the less deformed area. The indentations have 1.00 mm between them, both horizontally and vertically, as shown in Figure 2.

3. Results and Discussion

3.1. Aluminum Powders and CNTs’ Characterization

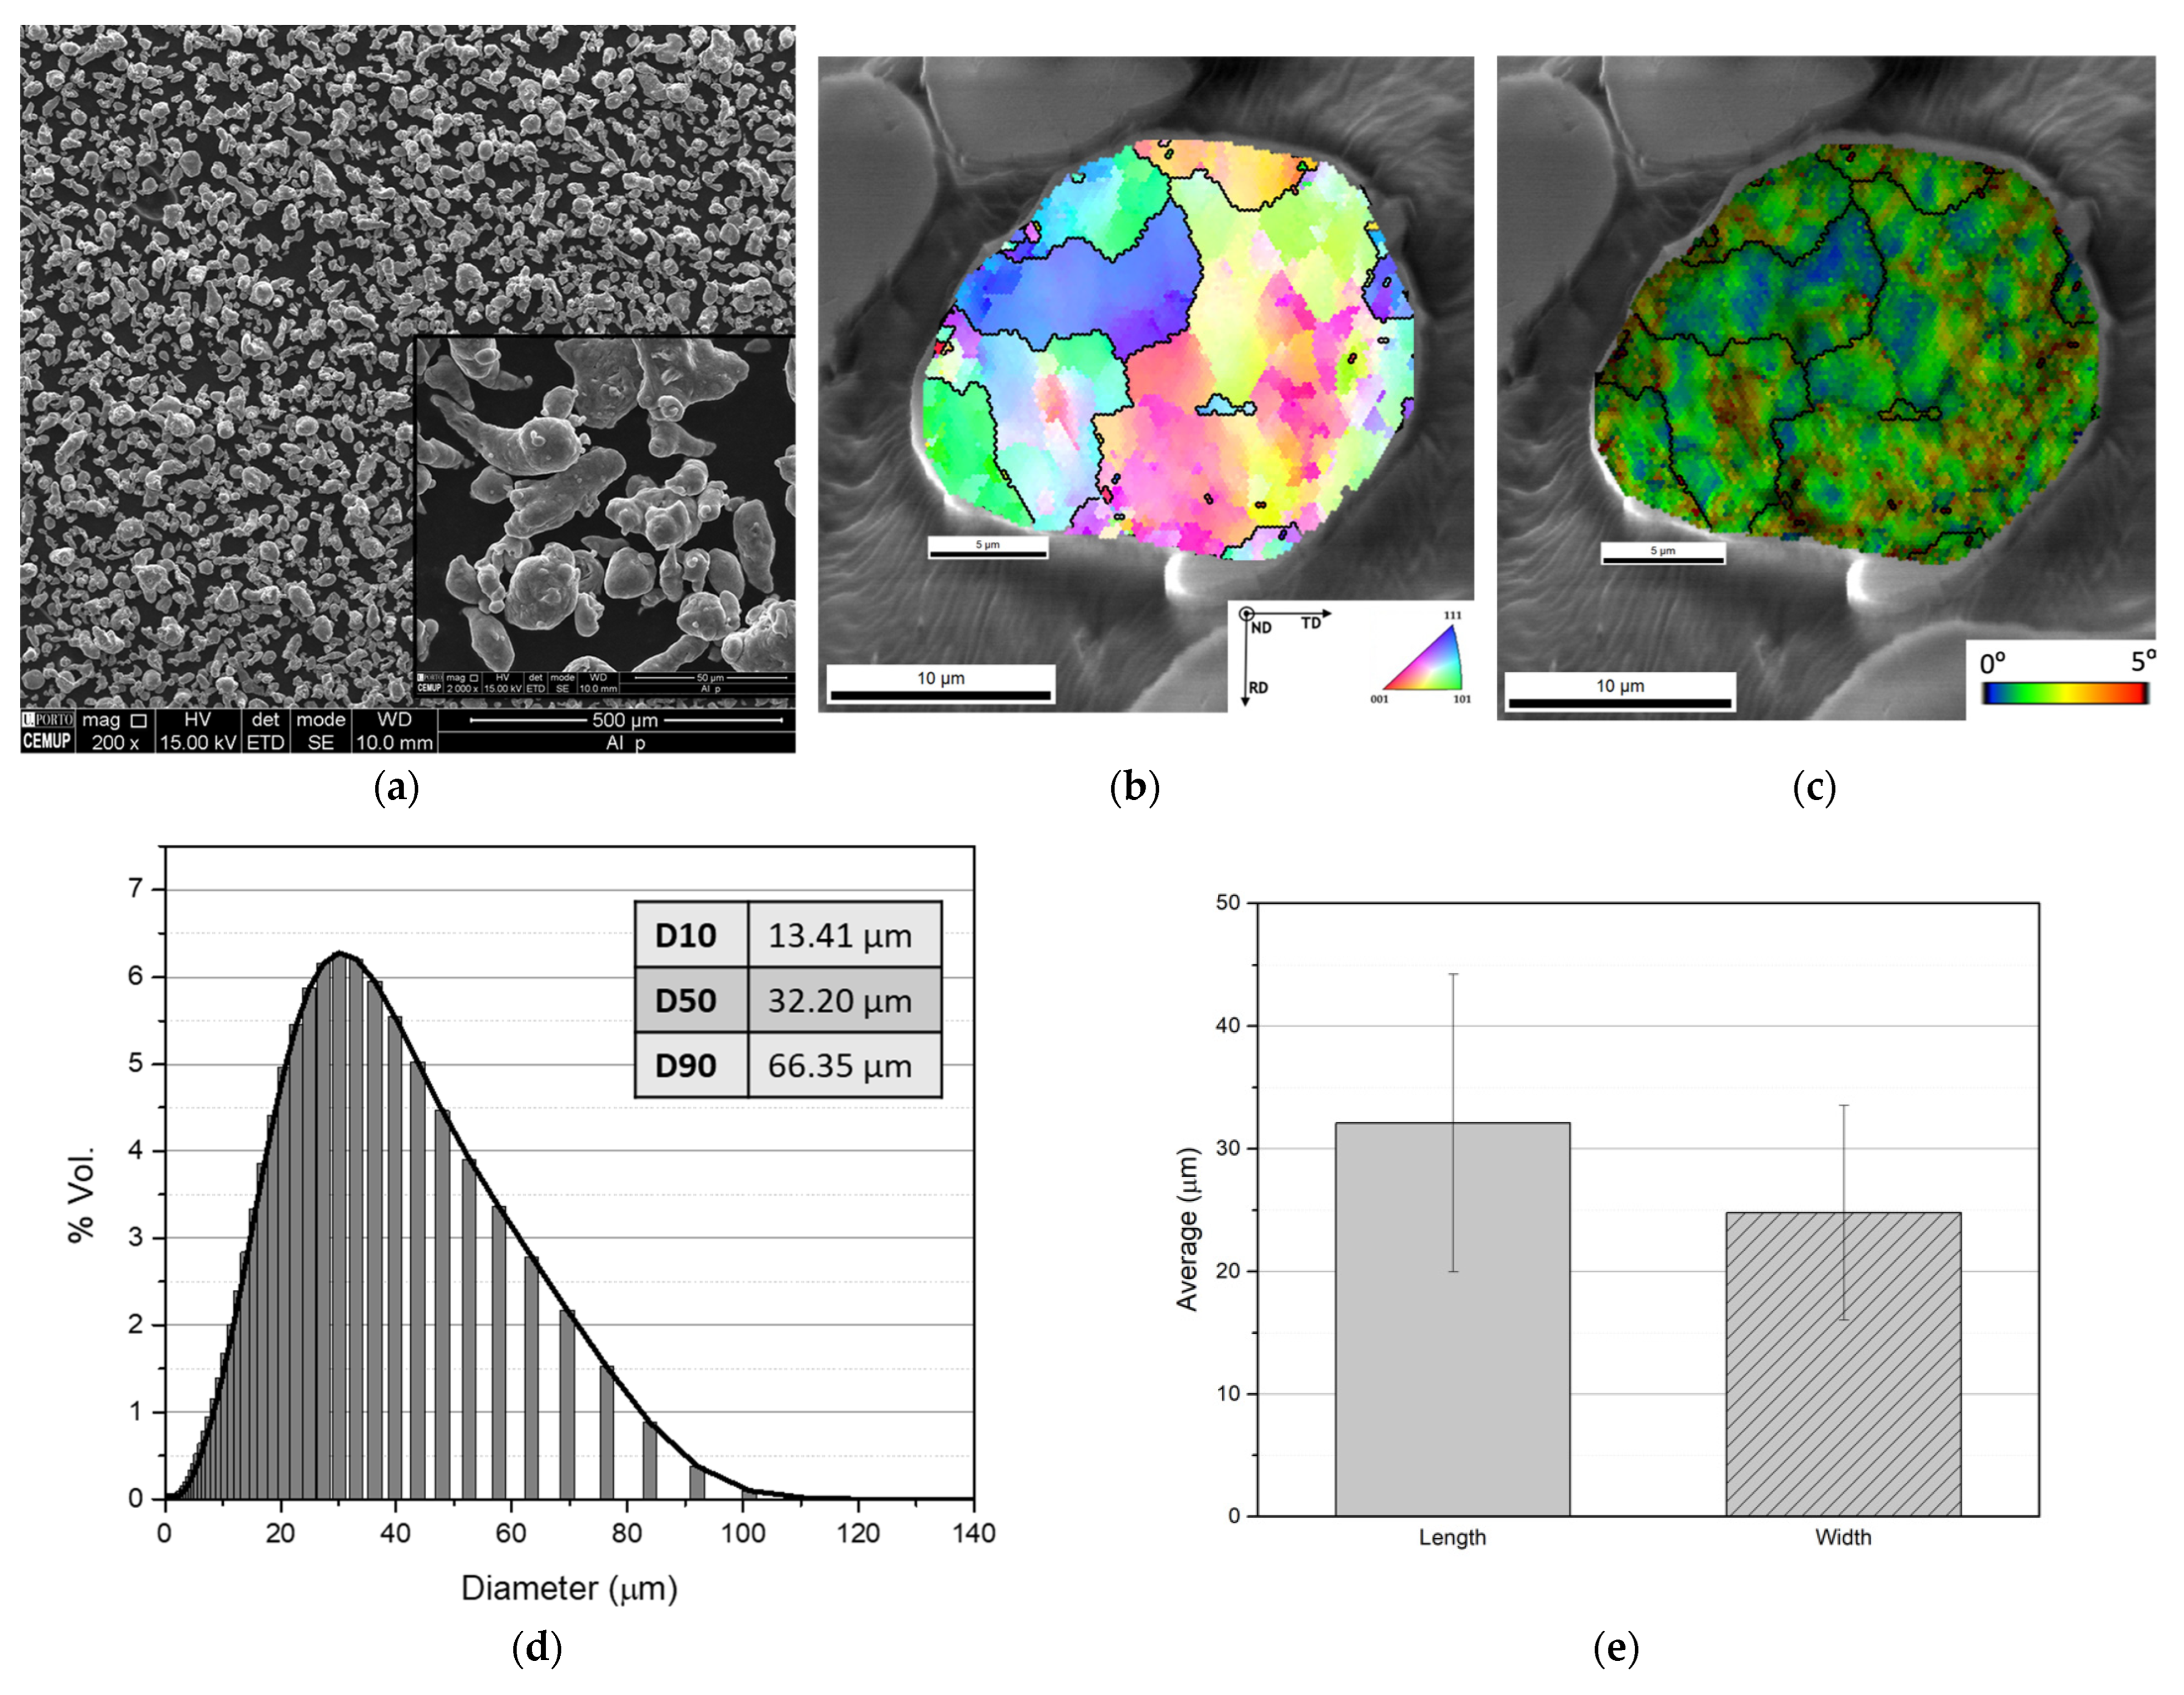
Figure 3 shows the characterization of the aluminum powders. SEM and EBSD were performed to investigate the morphology and microstructure of the as-receive powders. The secondary electron mode in SEM allows the observation of the shape of the powders (Figure 3a). The powders can be classified as close to spherical in shape, with some more elongated. This can be confirmed in the graph in Figure 3e where the length of the particles is close to their width. The EBSD analysis revealed that several grains form each particle (Figure 3b). Due to the production technique, some misorientation can be observed, confirmed by the Kernel average misorientation (KAM) map that can be associated to some plastic deformation. The analysis using DLS revealed that the aluminum powders show a median particle size (D50) of 32.20 µm; the size distribution can be observed in Figure 3d.
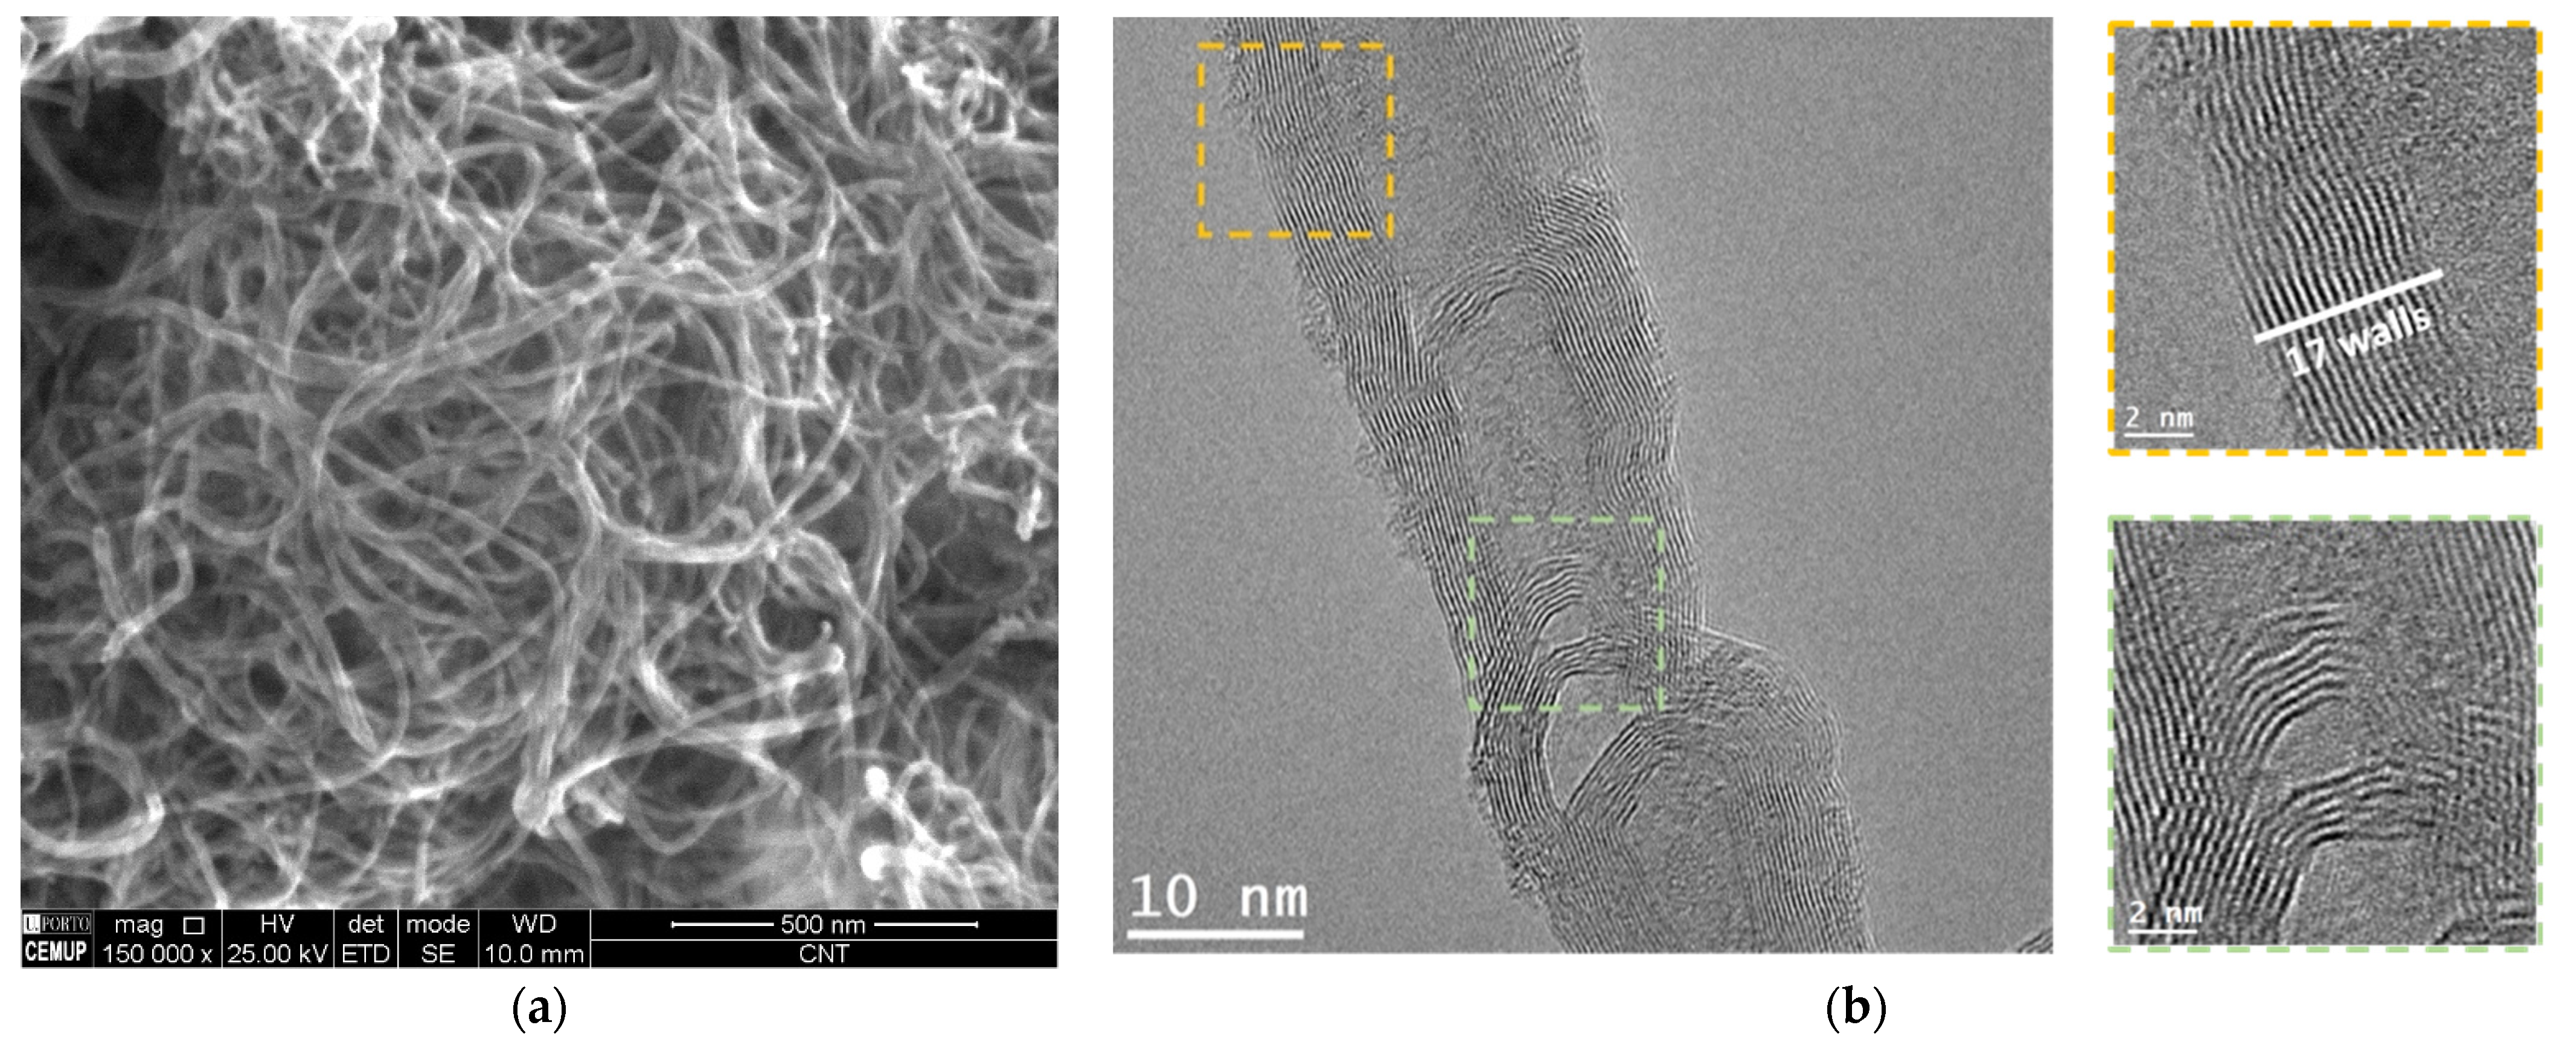
SEM and HRTEM analysis were used to characterize the as-received CNTs. Figure 4 exhibited the images of the CNTs. The HRTEM image of Figure 4b demonstrates the CNT structure, revealing multi-walled CNTs with a bamboo-like structure. The detail shows the presence of 17 walls.
During the dispersion process, the CNTs undergo exfoliation, losing some outer layers, as presented in Figure 5a. The CNTs exhibited an average of 17 ± 6 layers as received with an outer diameter of 18.7 ± 6.5 nm [17]. However, after ultrasonication, the number of walls decreased. Aluminum powders do not suffer significant changes in morphology during the dispersion process, as shown in Figure 5b.

3.2. Mechanical Properties of the Nanocomposites and Aluminum Matrix

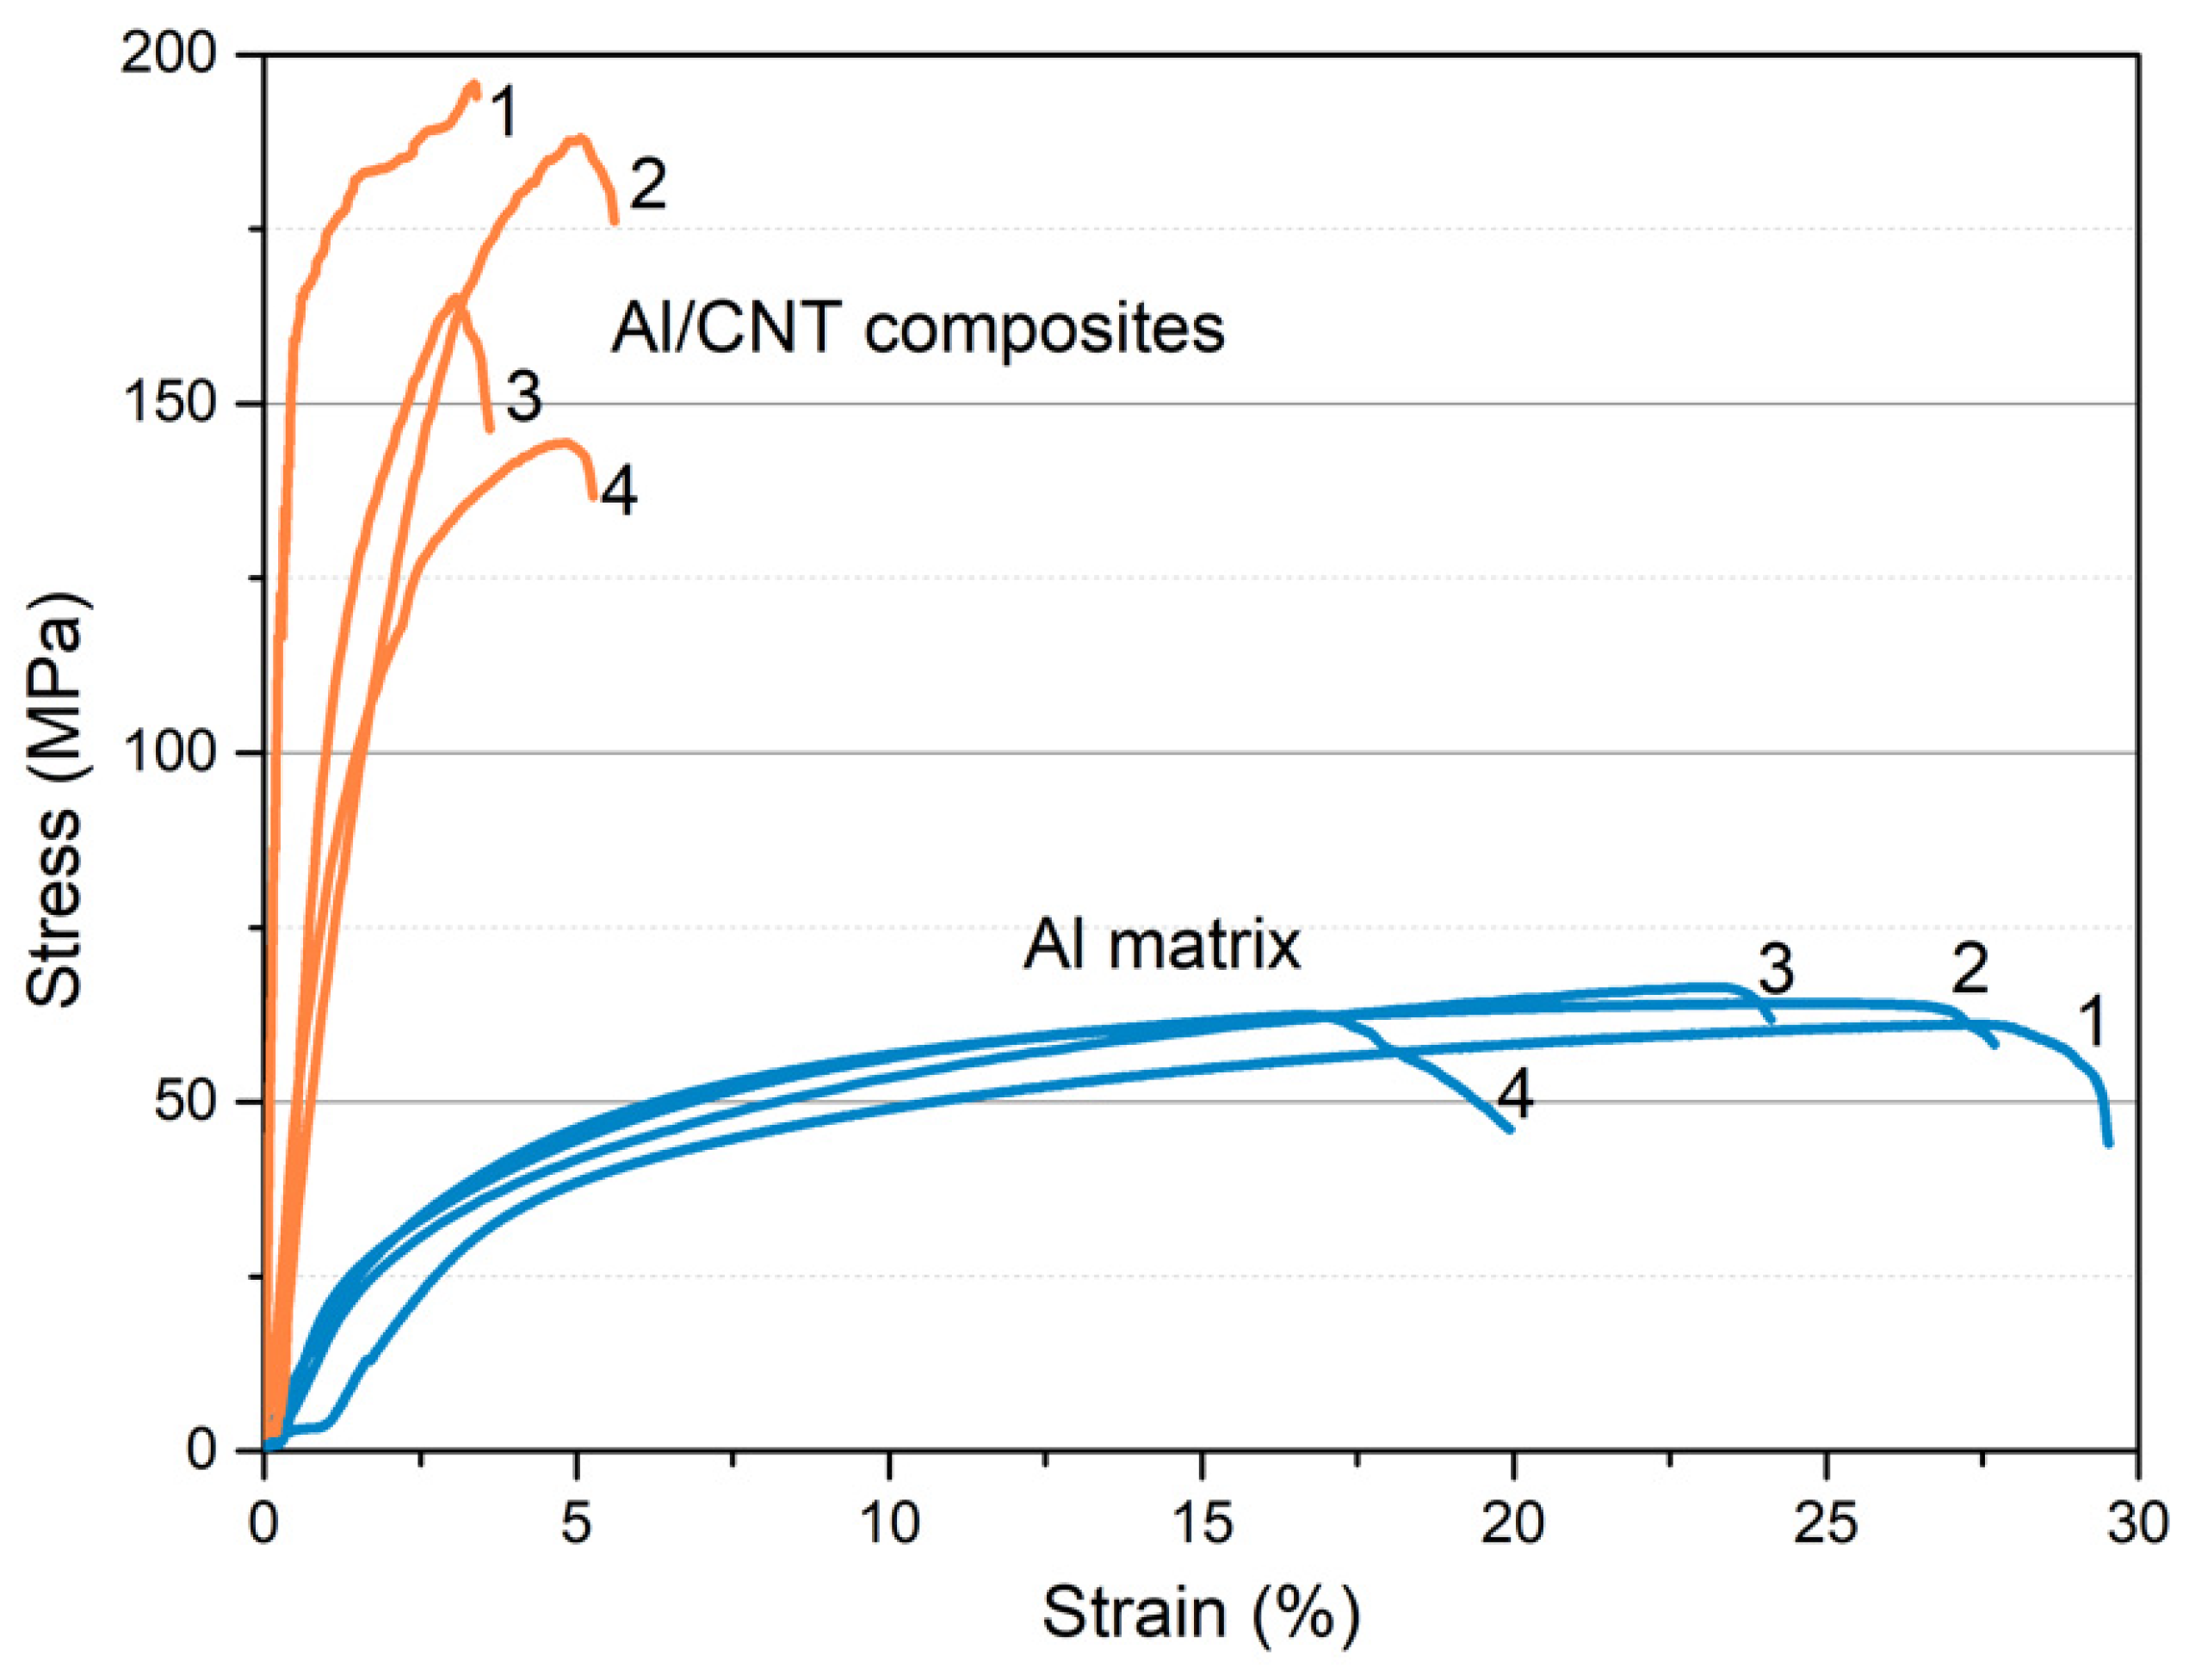
Tensile tests initially evaluated the mechanical properties of the Al/CNT nanocomposites. The Al matrix was also evaluated and produced under the same conditions for comparison purposes and to evaluate the effects of the presence of the reinforcement in the matrix. Figure 6 shows tensile curves for the nanocomposites and aluminum matrix tensile specimens performed at room temperature. For each condition, four samples were tested. The aluminum matrix samples showed lower yield strength, with a maximum attained 66 MPa. These samples showed higher strains being the highest value of 29%. The presence of CNTs improved the yield strength of the matrix, reaching a maximum of 188 MPa for the nanocomposites. However, this increase in the yield strength comes with a detriment of strain, with a maximum of 5% strain.
Fan et al. [5] observed similar results for the Al/CNT composites produced by high-energy ball milling. The authors referred to an increase of 66% in tensile strength and a decrease from 15.8 to 8.8% in elongation for Al/CNT with 3.00 vol.% of CNT. On the other hand, Chen et al. [8] showed that a copper particle could contribute to increasing the ductility of Al/CNT. These nanocomposites produced by spark plasma sintering (SPS) and hot rolling exhibited an increase of 54% in tensile strength but decreased from 9.6 to 6.8% in elongation. The production of the Al/CNT with Cu particles improves the elongation (14.8%) and tensile strength (54.2%) since these particles repair defects in the surface of the CNTs and inhibit the formation of Al4C3.
The high spread in results especially observed in the nanocomposite tensile curves can be associated with the impossibility of obtaining a totally uniform dispersion of carbon nanotubes into the matrix, as well as the existence of pores. These features result in some microstructure heterogeneities (local grain size and crystallographic misorientation, for example) that consequently influence the mechanical behavior of the samples [8,21]. This different mechanical behavior observed between the nanocomposites and the Al matrix can be explained with a detailed mechanical characterization associated with a microstructural characterization of the mechanically tested samples. The samples that showed a higher yield strength value (curves 1 for both samples) were chosen for the detailed microstructural characterization.
Nanoindentation experiments were performed to evaluate hardness and reduce Young’s modulus (Er) distribution maps to evaluate the effect of CNTs on the Al matrix. Figure 7 shows the hardness and Er maps for Al/CNT nanocomposites. Based on these maps, it is possible to observe significant differences closest to the CNTs’ clusters. Nanocomposites are characterized by high hardness values and corresponding high values of Er, which corresponds to the presence of CNTs. This hardness variation may help explain what is observed in the tensile curves. The detail in the OM image shows an SEM image, where clusters of CNTs are visible [22].
This observation of reinforcement at the grain boundaries in the form of clusters that promotes an increase in hardness in some areas of the matrix at the nanometric scale could be one of the reasons for the significant decrease in the elongation observed in the tensile curves for the nanocomposites than the Al matrix.
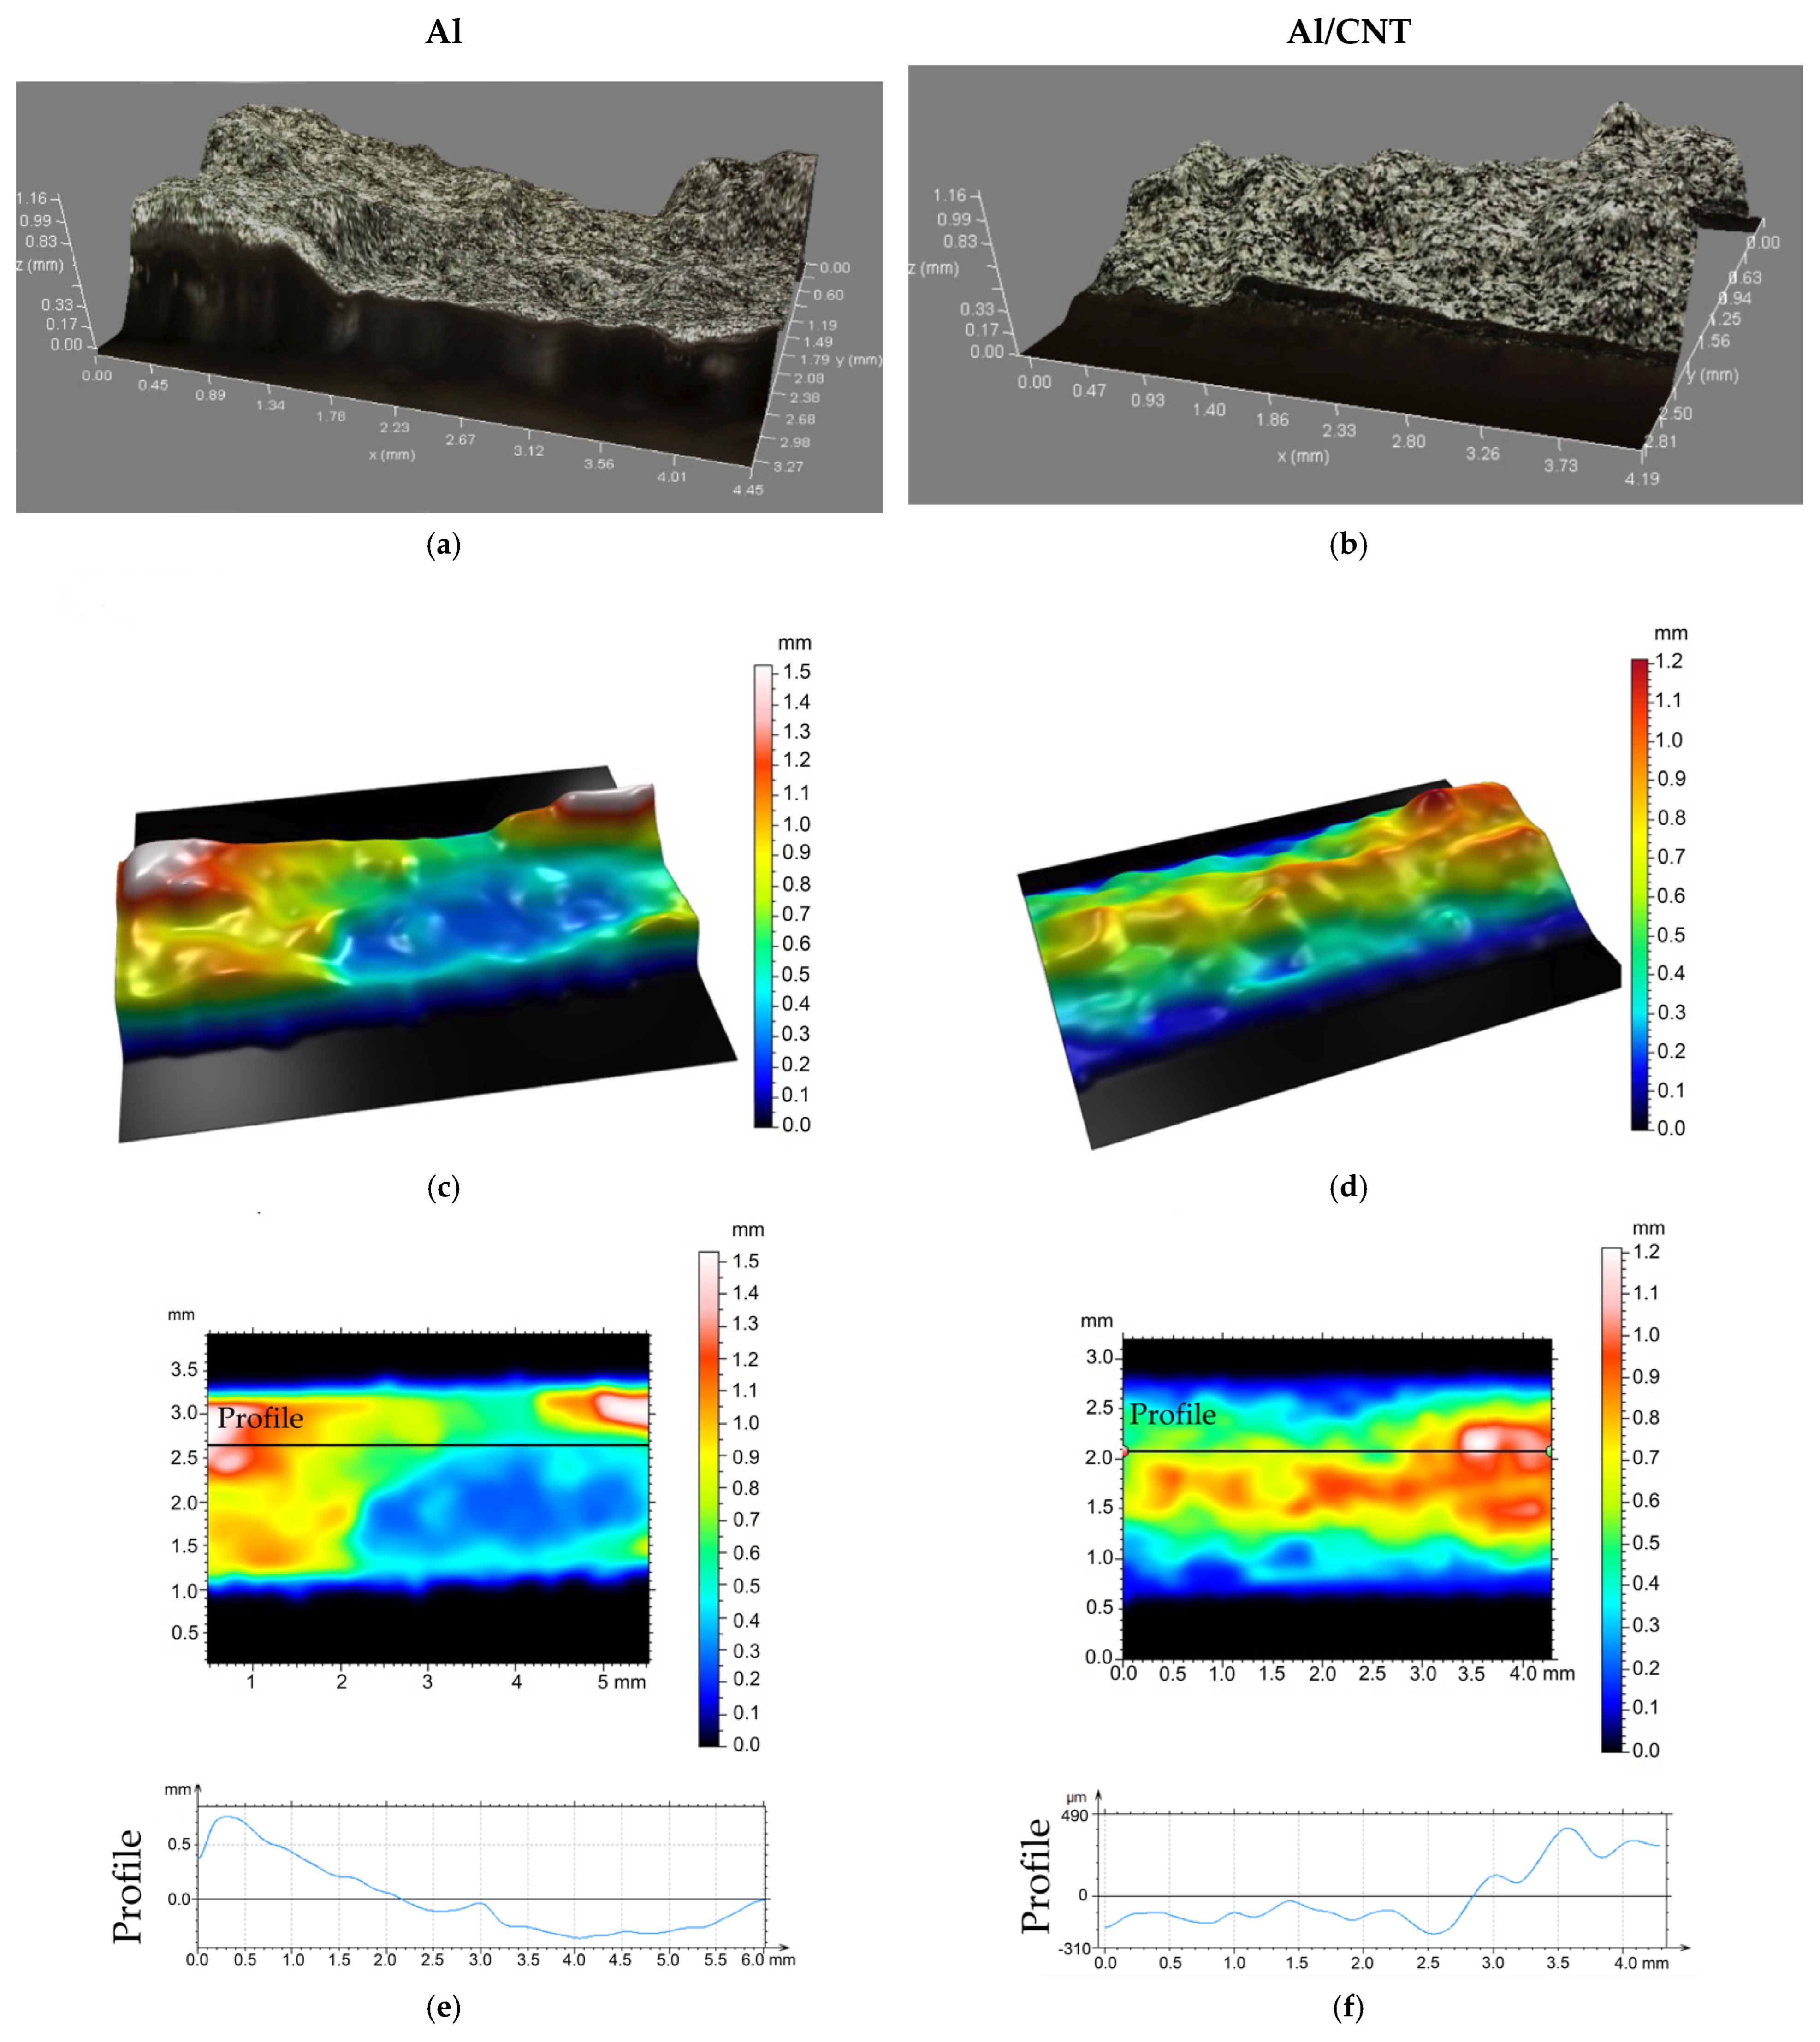
The fracture surface after tensile testing was observed in detail to understand better the mechanical behavior of the samples. Figure 8 shows the fracture surface of the Al matrix and Al/CNT samples observed by digital optical microscopy.
With the observation of the images, great differences between the samples are not detected. The two samples present surfaces with a high topography, which agrees with the results observed in the Al tensile curve but not with what is observed for the nanocomposites. With the observation of the profiles, Al exhibits a greater height between the salience observed in the lower plane compared to the higher one. Still, the difference with nanocomposites is relatively low.
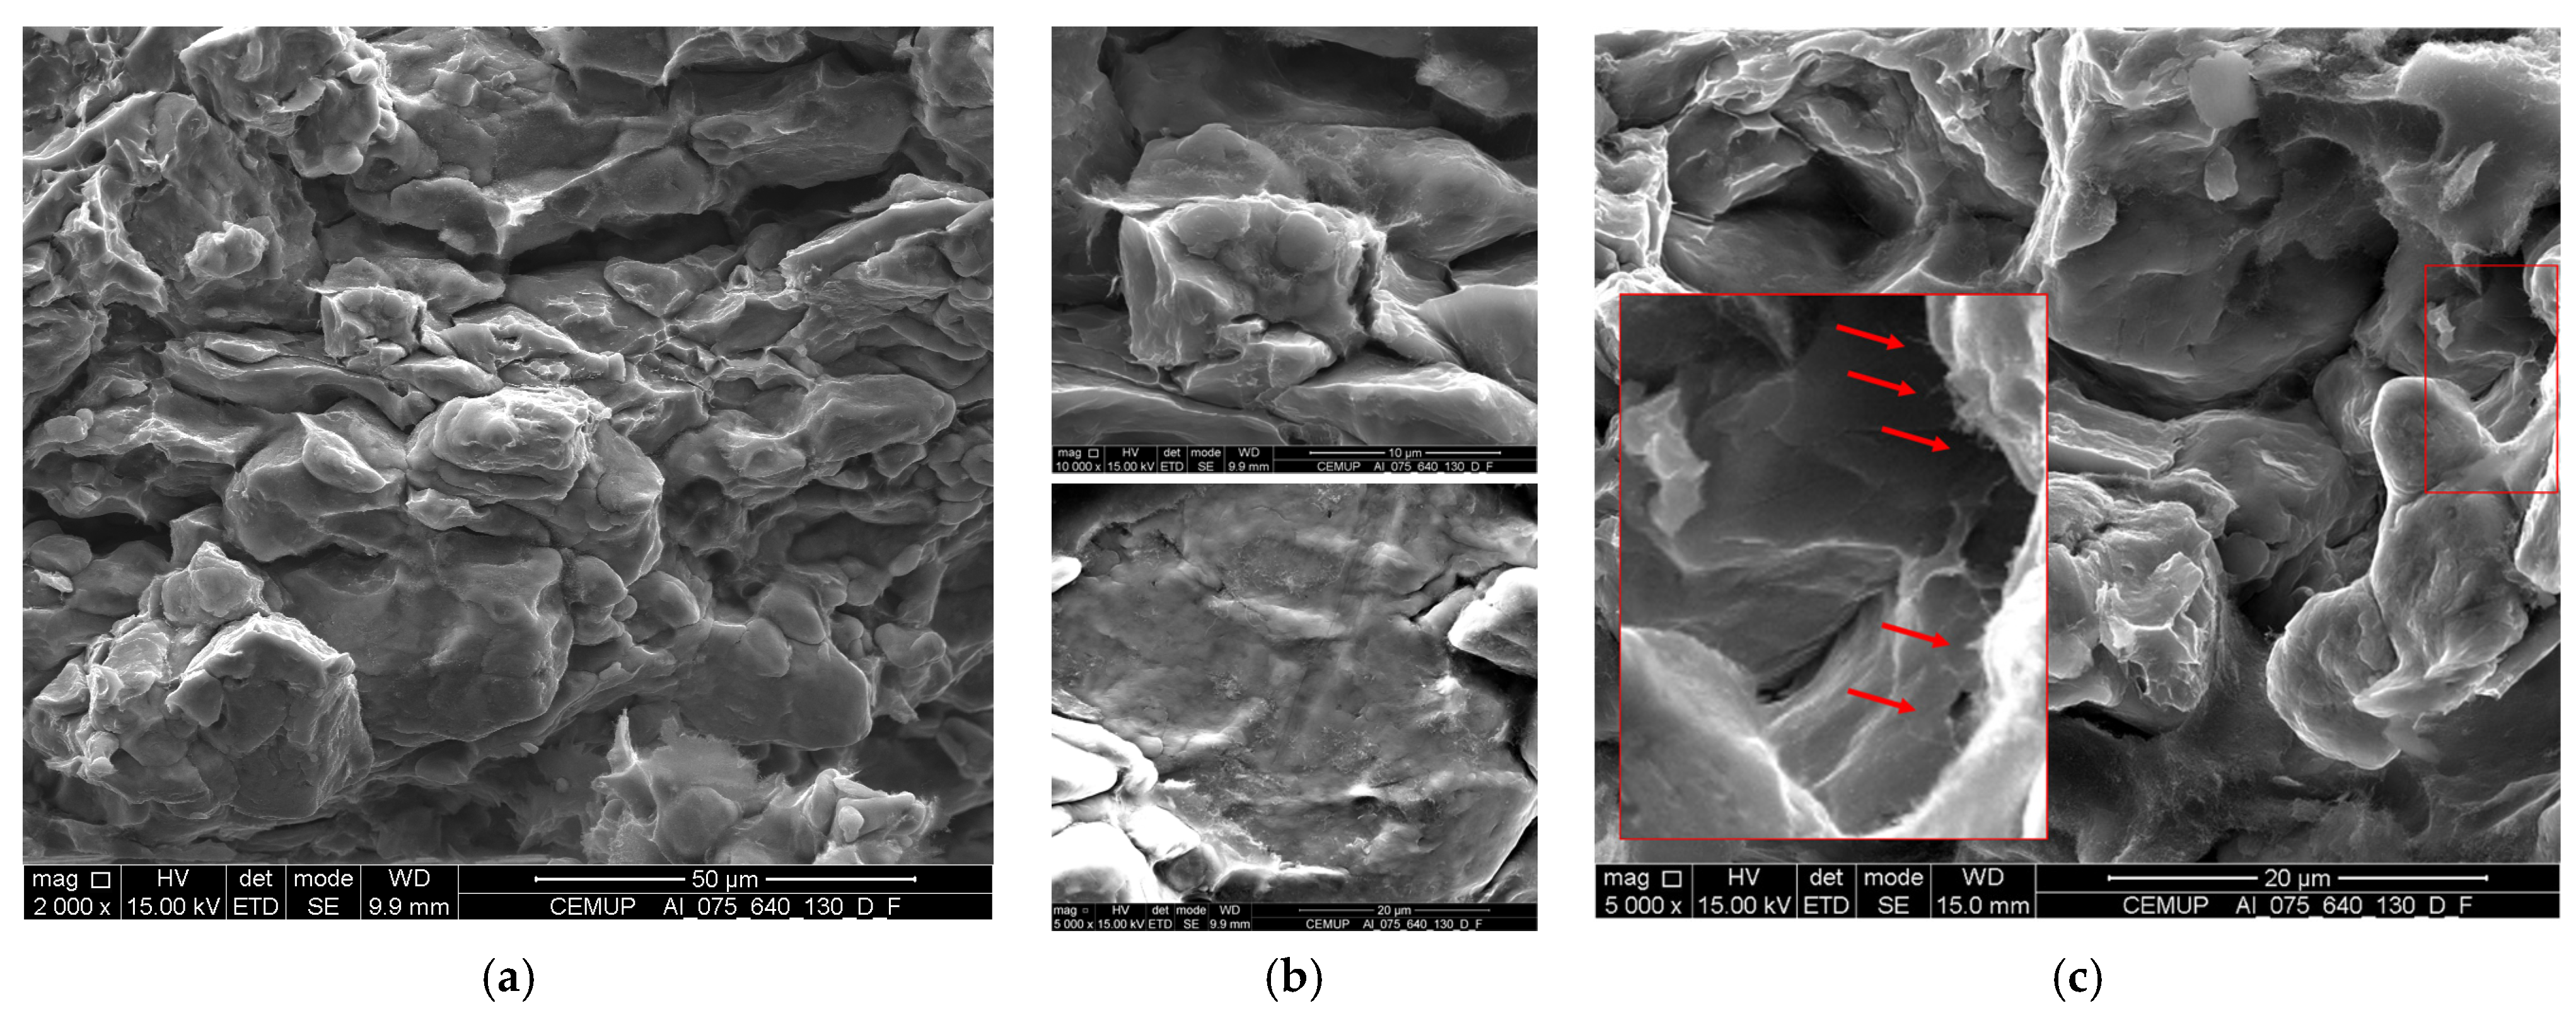
A detailed observation was conducted by SEM in the fractured tensile samples and is present in Figure 9. Based on these images of Al/CNT samples, it is possible to detect that fragile features are characteristics. However, some areas also revealed deformed grains corroborating with a fracture surface characterized by mixed regions, not completely brittle or ductile.
This can be explained due to the microstructure of the nanocomposites that present CNTs clusters, well-dispersed CNTs and pores. The surface fracture observation results are according to the behavior perceived in the tensile curve. CNTs clusters are observed, which confirms that these are present at the grain boundaries that can significantly decrease the ductility of the nanocomposites. However, there was also the presence of CNTs on the fracture surface, agglomerated in the pores and embedded in the matrix. Additionally, some CNTs seem elongated in the tensile test direction, which can have acted as a bridge, hindering the crack propagation, as seen in other works [23,24,25,26,27,28,29,30]. This means that the matrix can transfer the load to the CNTs, during the tensile test, which prevents crack propagation. As the cracks expand into the CNTs, they act as a bridge between two points in the matrix, restraining crack growth. However, these CNTs that act as a bridge will fracture. These protruding CNTs on the surfaces of some grains can be related to the increase in yield strength to the reinforcement mechanism associated with the load transfer from the matrix to the reinforcement during the tensile test. Park et al. [26] observed the load transfer mechanism that resulted in a 60% increase in the yield stress of Al/CNTs nanocomposites. The authors observed elongated and fractured CNTs on the fracture surface analyzed by SEM. Although the authors have identified different strengthening mechanisms acting simultaneously, they consider that load transfer was the dominant mechanism.
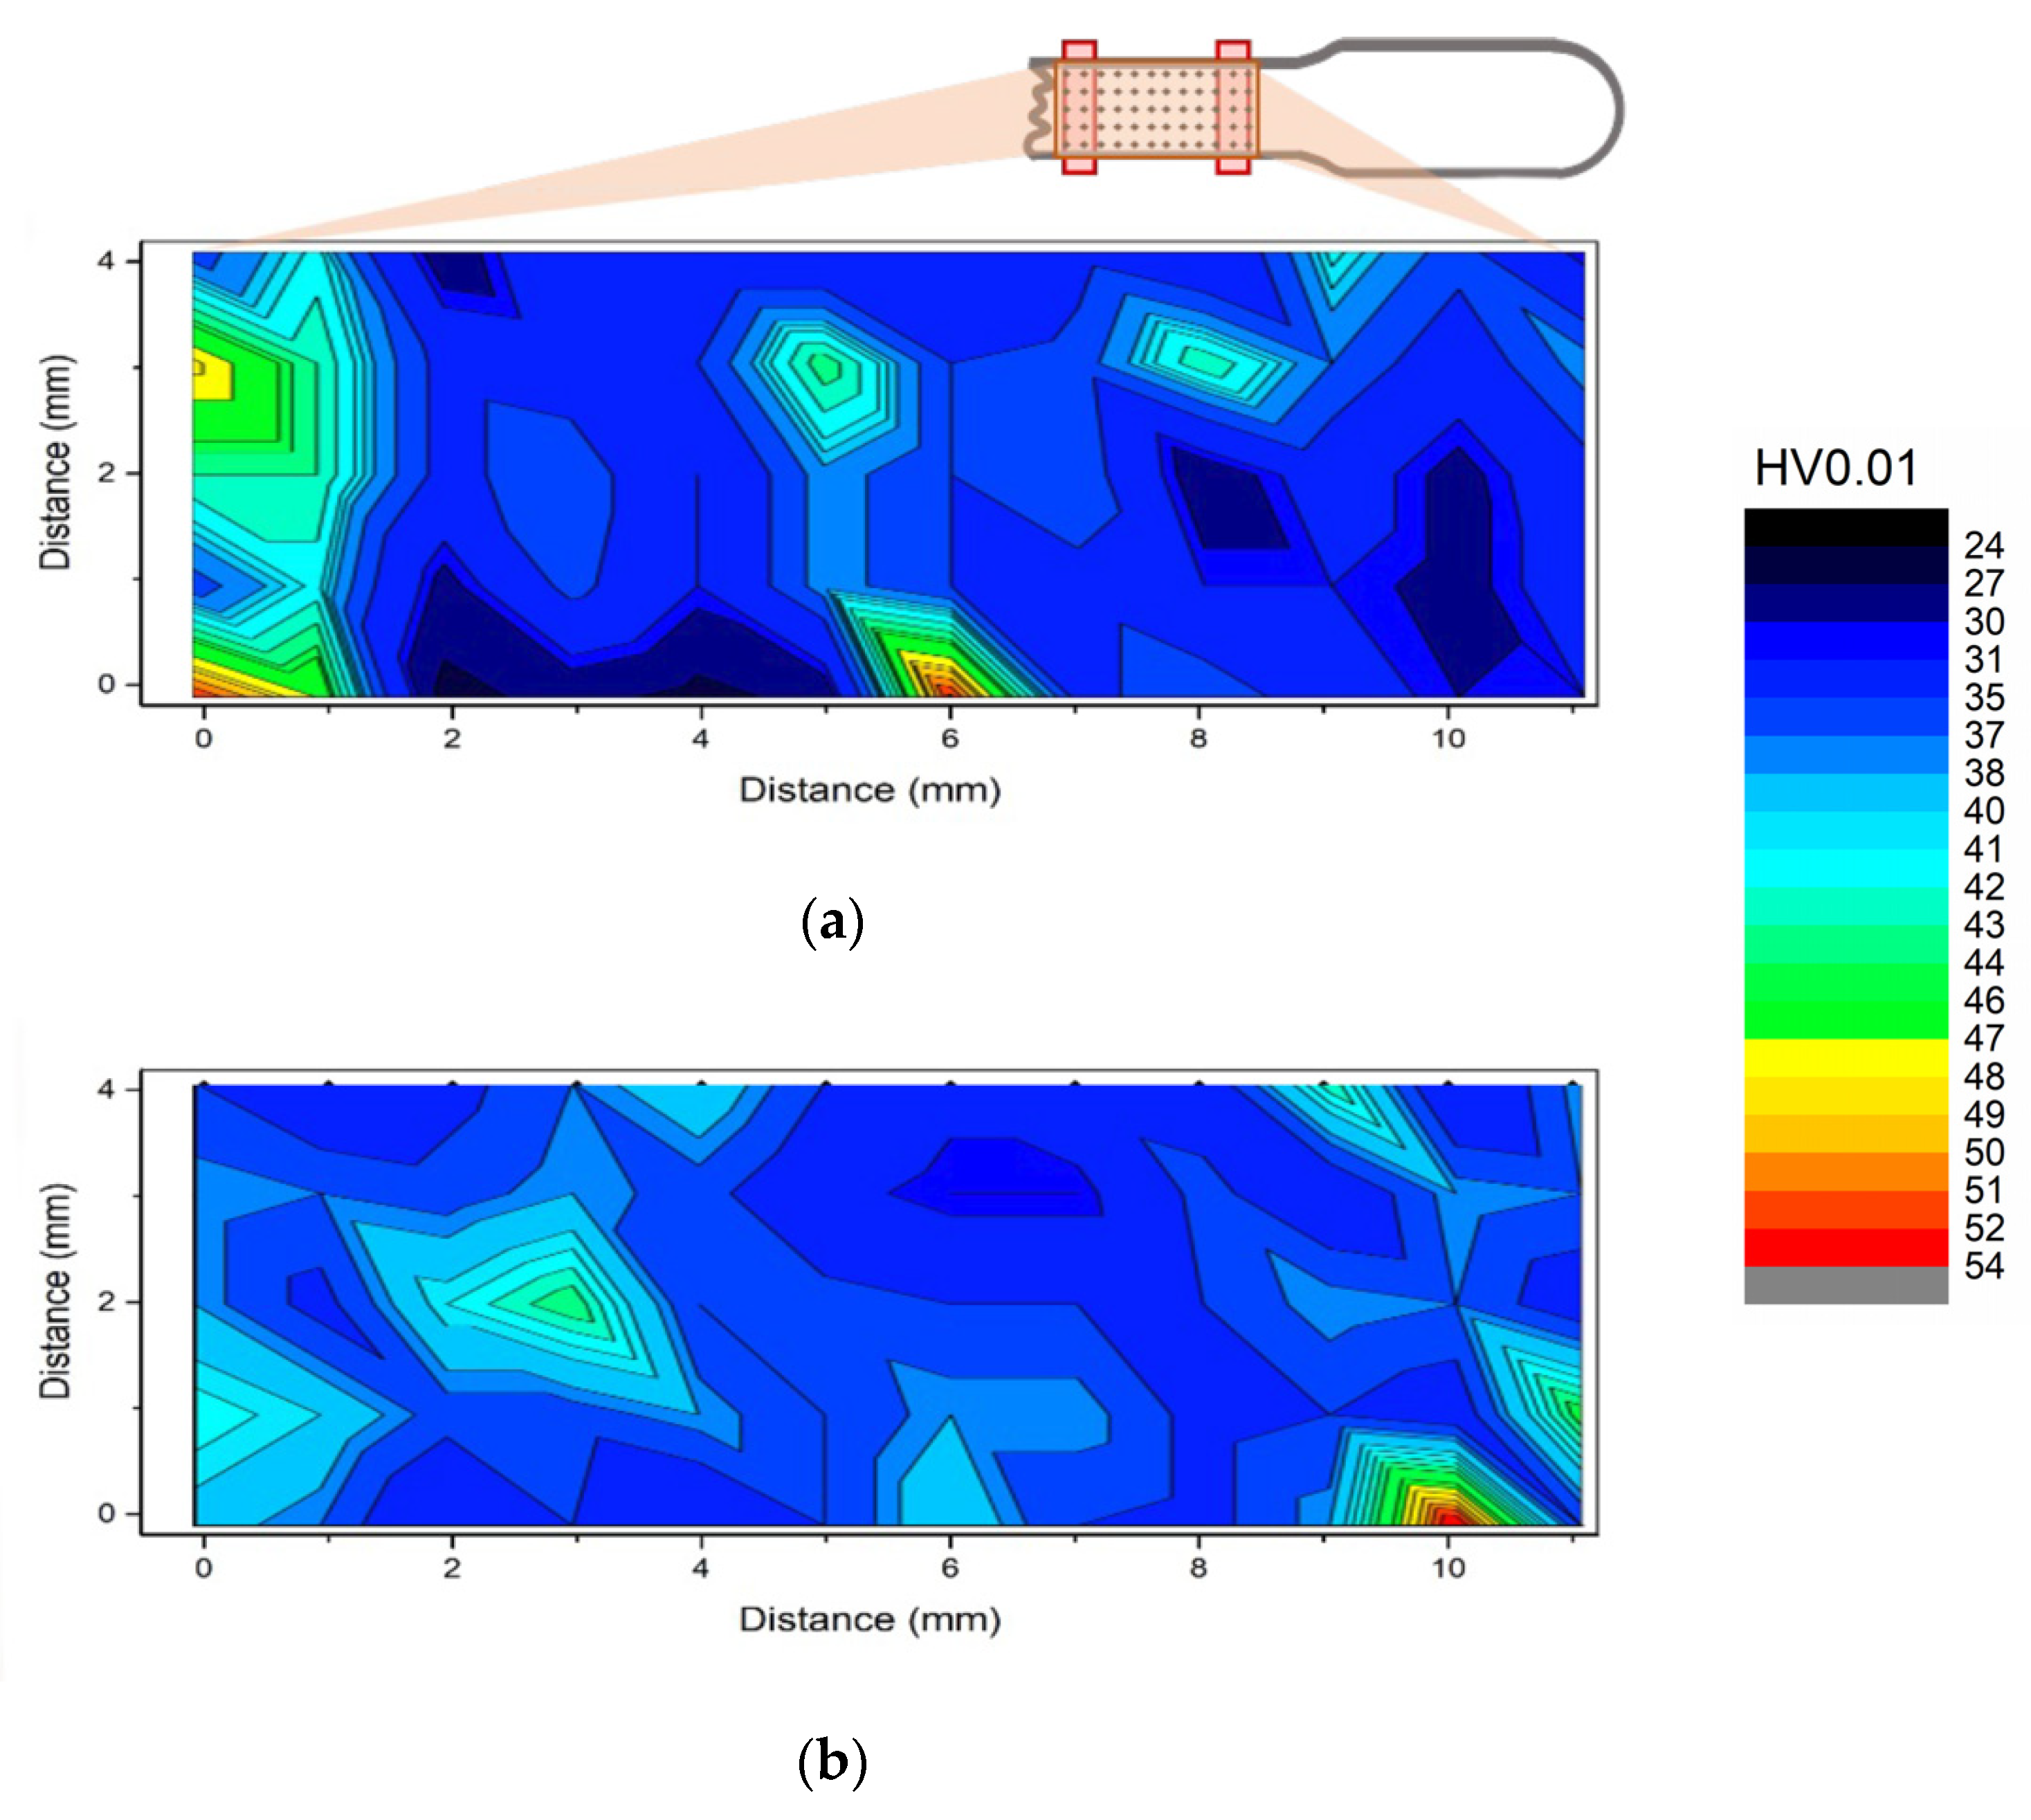
Figure 10 shows the Vickers microhardness maps of the fractured tensile samples of the Al matrix and the nanocomposites. Significant differences can be observed between samples in the evolution of hardness. For the Al matrix, the highest hardness value is observed near the fracture surface, while the nanocomposite is observed in the zone furthest from the fracture. A detailed microstructure analysis was performed in the two areas (closer to the fracture surface and further away from the fracture surface) to better understand the hardness variations. This characterization involved the observation of the crystallographic orientation, the average misorientation of the grains and the determination of the estimated density of dislocations.
A detailed analysis close to the fracture surface can be seen in Figure 11. Vickers hardness maps and average geometrically necessary dislocations (GNDs) density can be seen for the Al matrix and the nanocomposites. The Al matrix revealed a higher hardness in this region. However, the difference in hardness cannot be influenced by the grain size of the samples, since they show a similar grain size: 7.2 and 8.3, respectively. On the contrary, with the observation of these results, the aluminum matrix reveals a higher density of dislocations near the fracture surface than the nanocomposites. These results agree with the hardness map, which reveals a higher hardness value for the matrix than the nanocomposites for the same characterized area and the results observed in the tensile curves. The Al matrix showed a greater ductility than the nanocomposites and, therefore, a greater elongation, resulting in a greater deformed area and, consequently, a greater plastic deformation.
Figure 12 shows the Kernel average misorientation (KAM) and the tensile Taylor factor maps for Al and Al/CNT samples for the region of 2.0 mm from the fracture surface of tensile specimens. The KAM maps are one of the most powerful tools to study the deformation shown in a microstructure and are often used for this purpose [26,27,28,29,30,31,32,33,34]. These maps show, in both samples, that the highest deformation (represented by red associated with higher misorientation values) is presented around the pores and CNTs agglomerates (in the nanocomposite case) of the samples. This result is because these areas are brittle points of the samples, being zones without any material, having lower strength and being easier to deform during tensile testing.
As mentioned previously, the cracks are also more prone to initiate in these areas due to their vulnerability. Based on these images, it is possible to conclude that the Al samples reveal higher misorientation close to the surface fracture than the nanocomposites. This agrees with the hardness, dislocation density, and tensile curve results. The Taylor maps show grains with a higher factor than the nanocomposites, revealing their different behavior to deformation. Another point in common between the two samples is that it is nitid that some of the grains are significantly more deformed than the others, which is represented by green within the grains. One of the possible causes of these effects is the different crystallographic orientations of these grains, being that softer grains, orientated to directions favorable to the dislocation formation and propagation, will be the first to deform when a load is applied. Whether these grains are surrounded by other grains in a favorable crystallographic orientation (softer grains) or not (harder grains), the deformation can be easier or more difficult. When harder ones surround a soft grain, it is more difficult for the deformation to continue, and more load is needed for the process to occur [35]. In addition, what should be mentioned is that the analysis of Figure 12 allows us to verify some differences in the grain size, being visible smaller grains around the larger ones. The presence of these small grains could be formed during the sintering, where some recrystallization of the aluminum occurs [14] but also with the presence of CNTs agglomerates, in the case of nanocomposites, where the grain growth is hindered. Either way, the presence of these smaller grains can affect the mechanical properties since materials with smaller grains show a more fragile deformation behavior. In comparison, samples with larger grains have higher elongation but lower tensile strength. In that sense, bimodal microstructure, as in this case, can be a good compromise as it presents a behavior between soft and brittle [36].
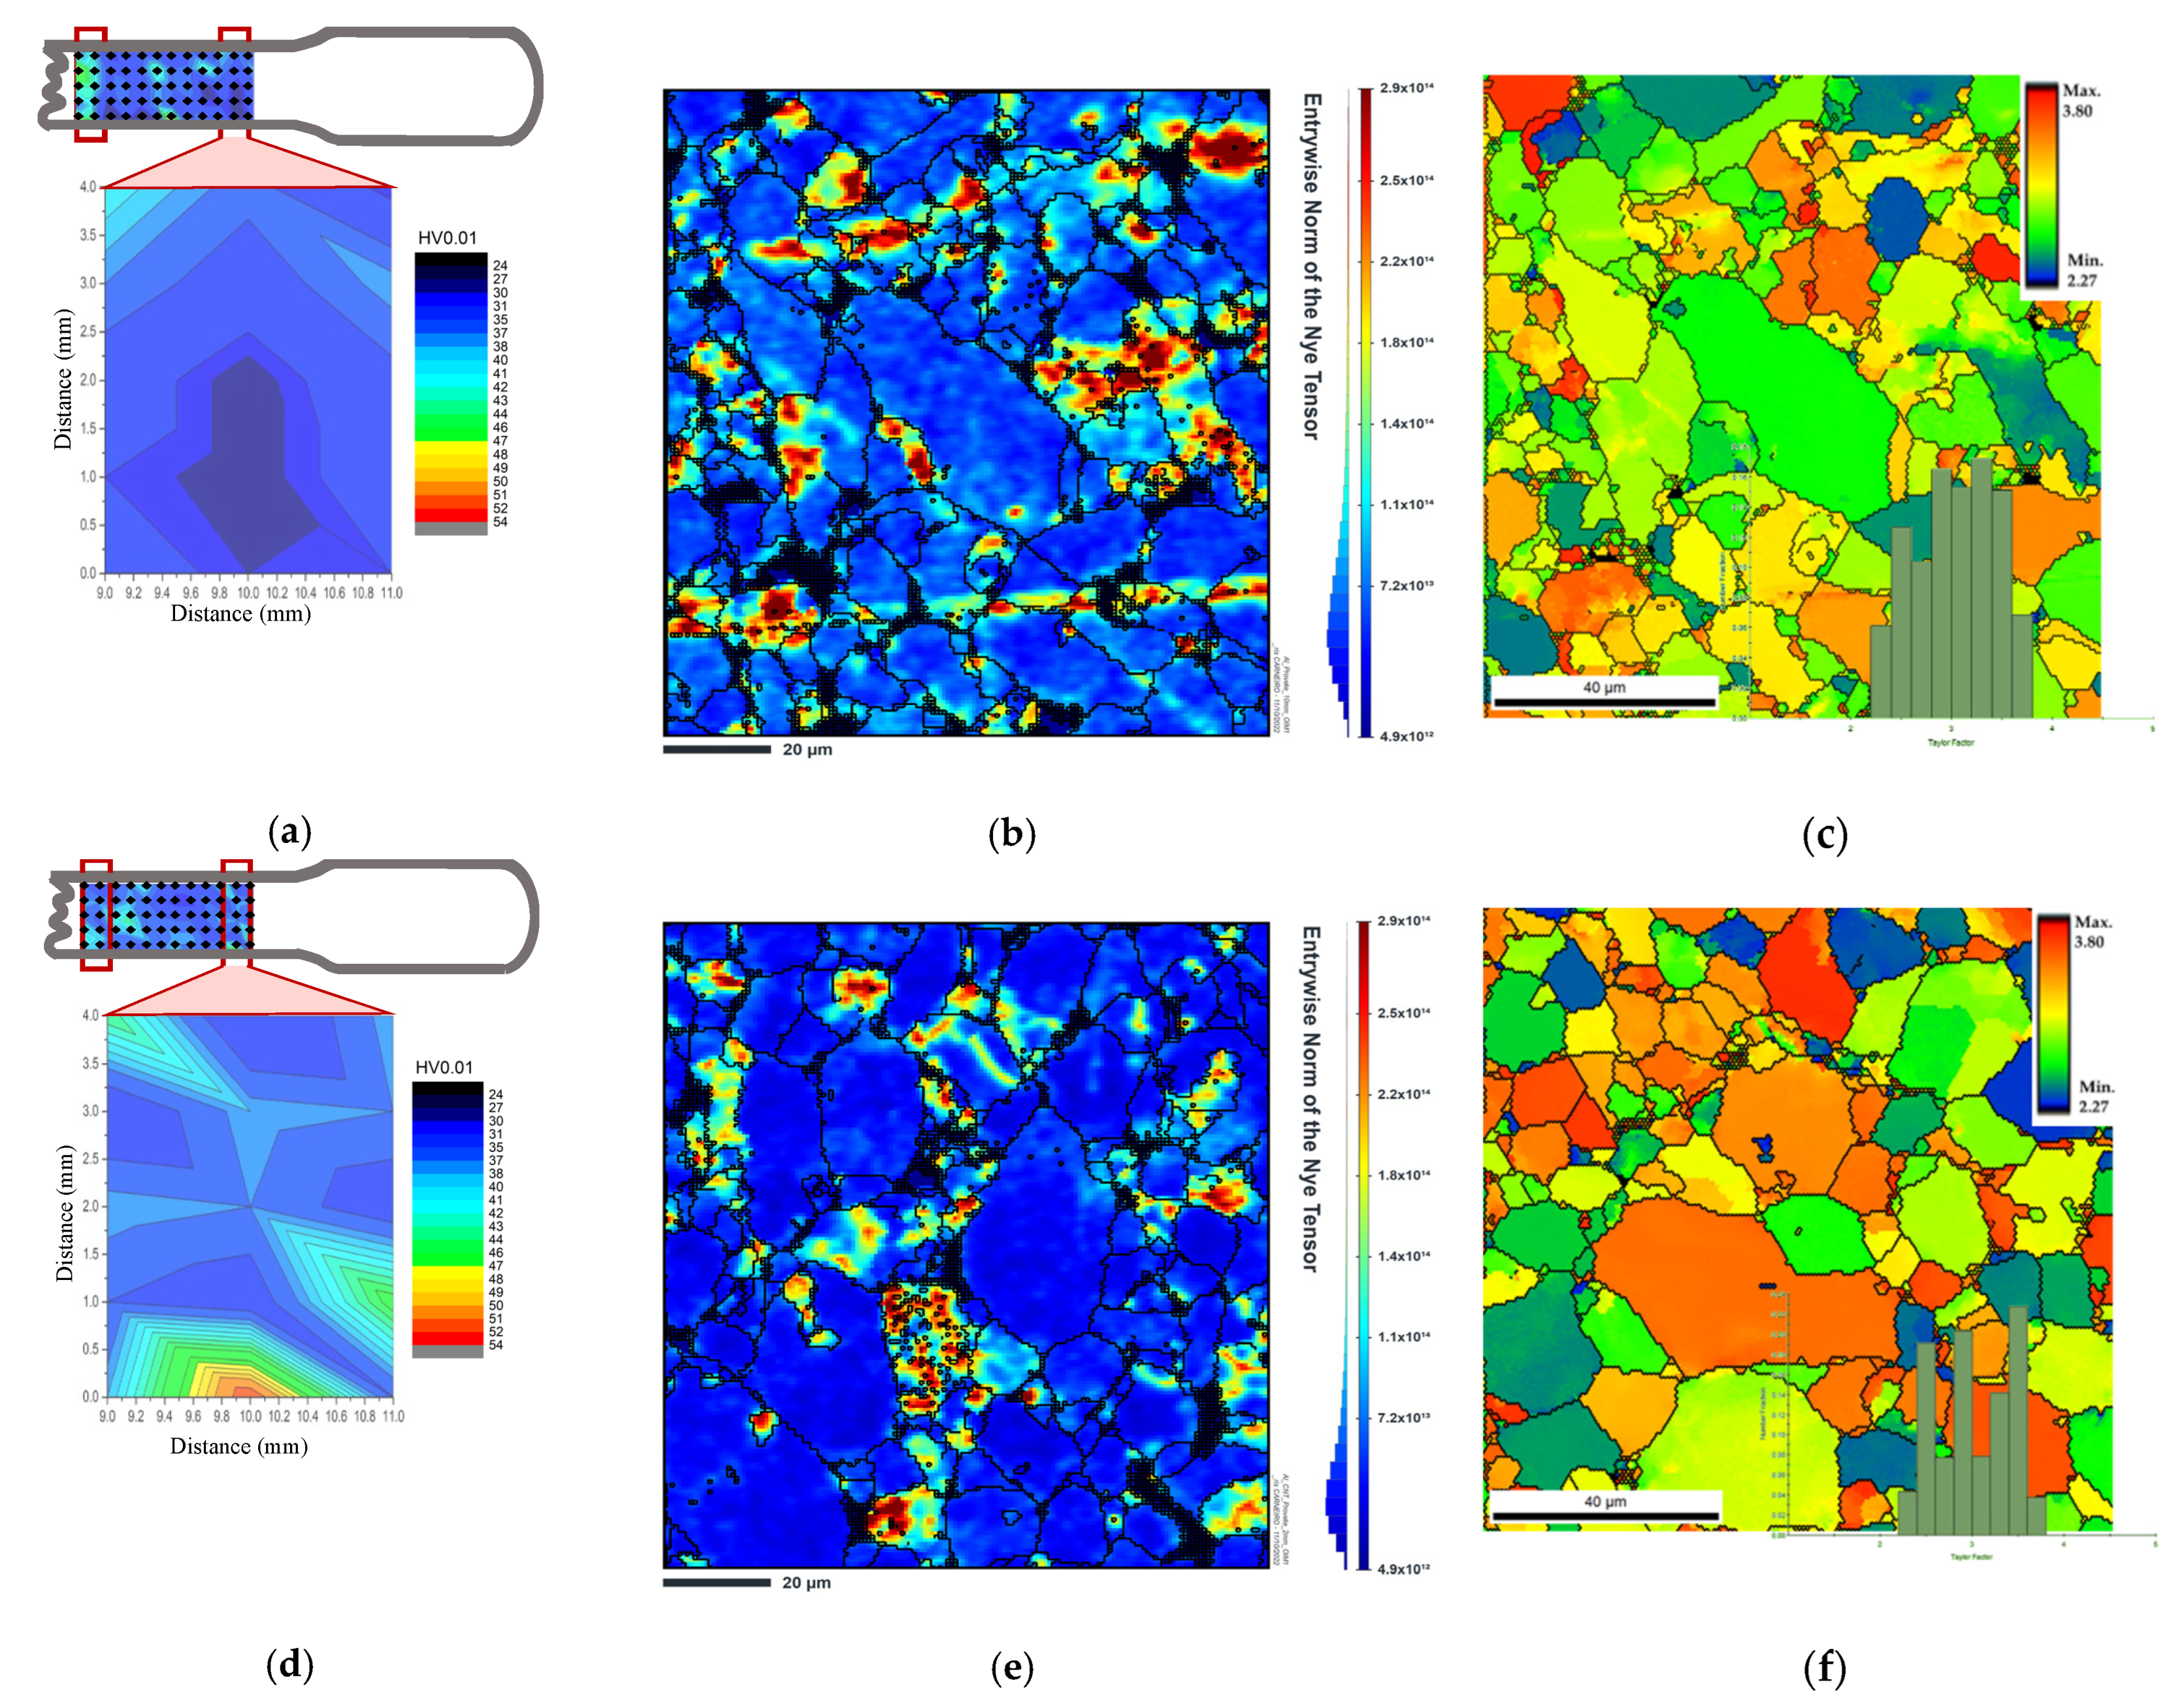
Analyzing the area at 10 mm from the fracture, Vickers hardness maps, GND distribution maps and tensile Taylor maps can be seen in Figure 13. With the observation of these results, the increase in hardness for the nanocomposites in this region cannot be attributed to the increase in dislocation density or to the grain size of the samples (7.0 for Al matrix and 6.4 for nanocomposites). In fact, the dislocation density is similar for the two samples. The hardness in this region can be explained by the presence of CNTs or even other microstructural changes. In the Taylor factor maps, it is visible that significant differences can be observed, which is an indication of the different tensile behavior of these materials. In Al, it is possible to observe more grains with a lower Taylor factor than in the nanocomposites, which indicates that it will be more difficult for them to deform.
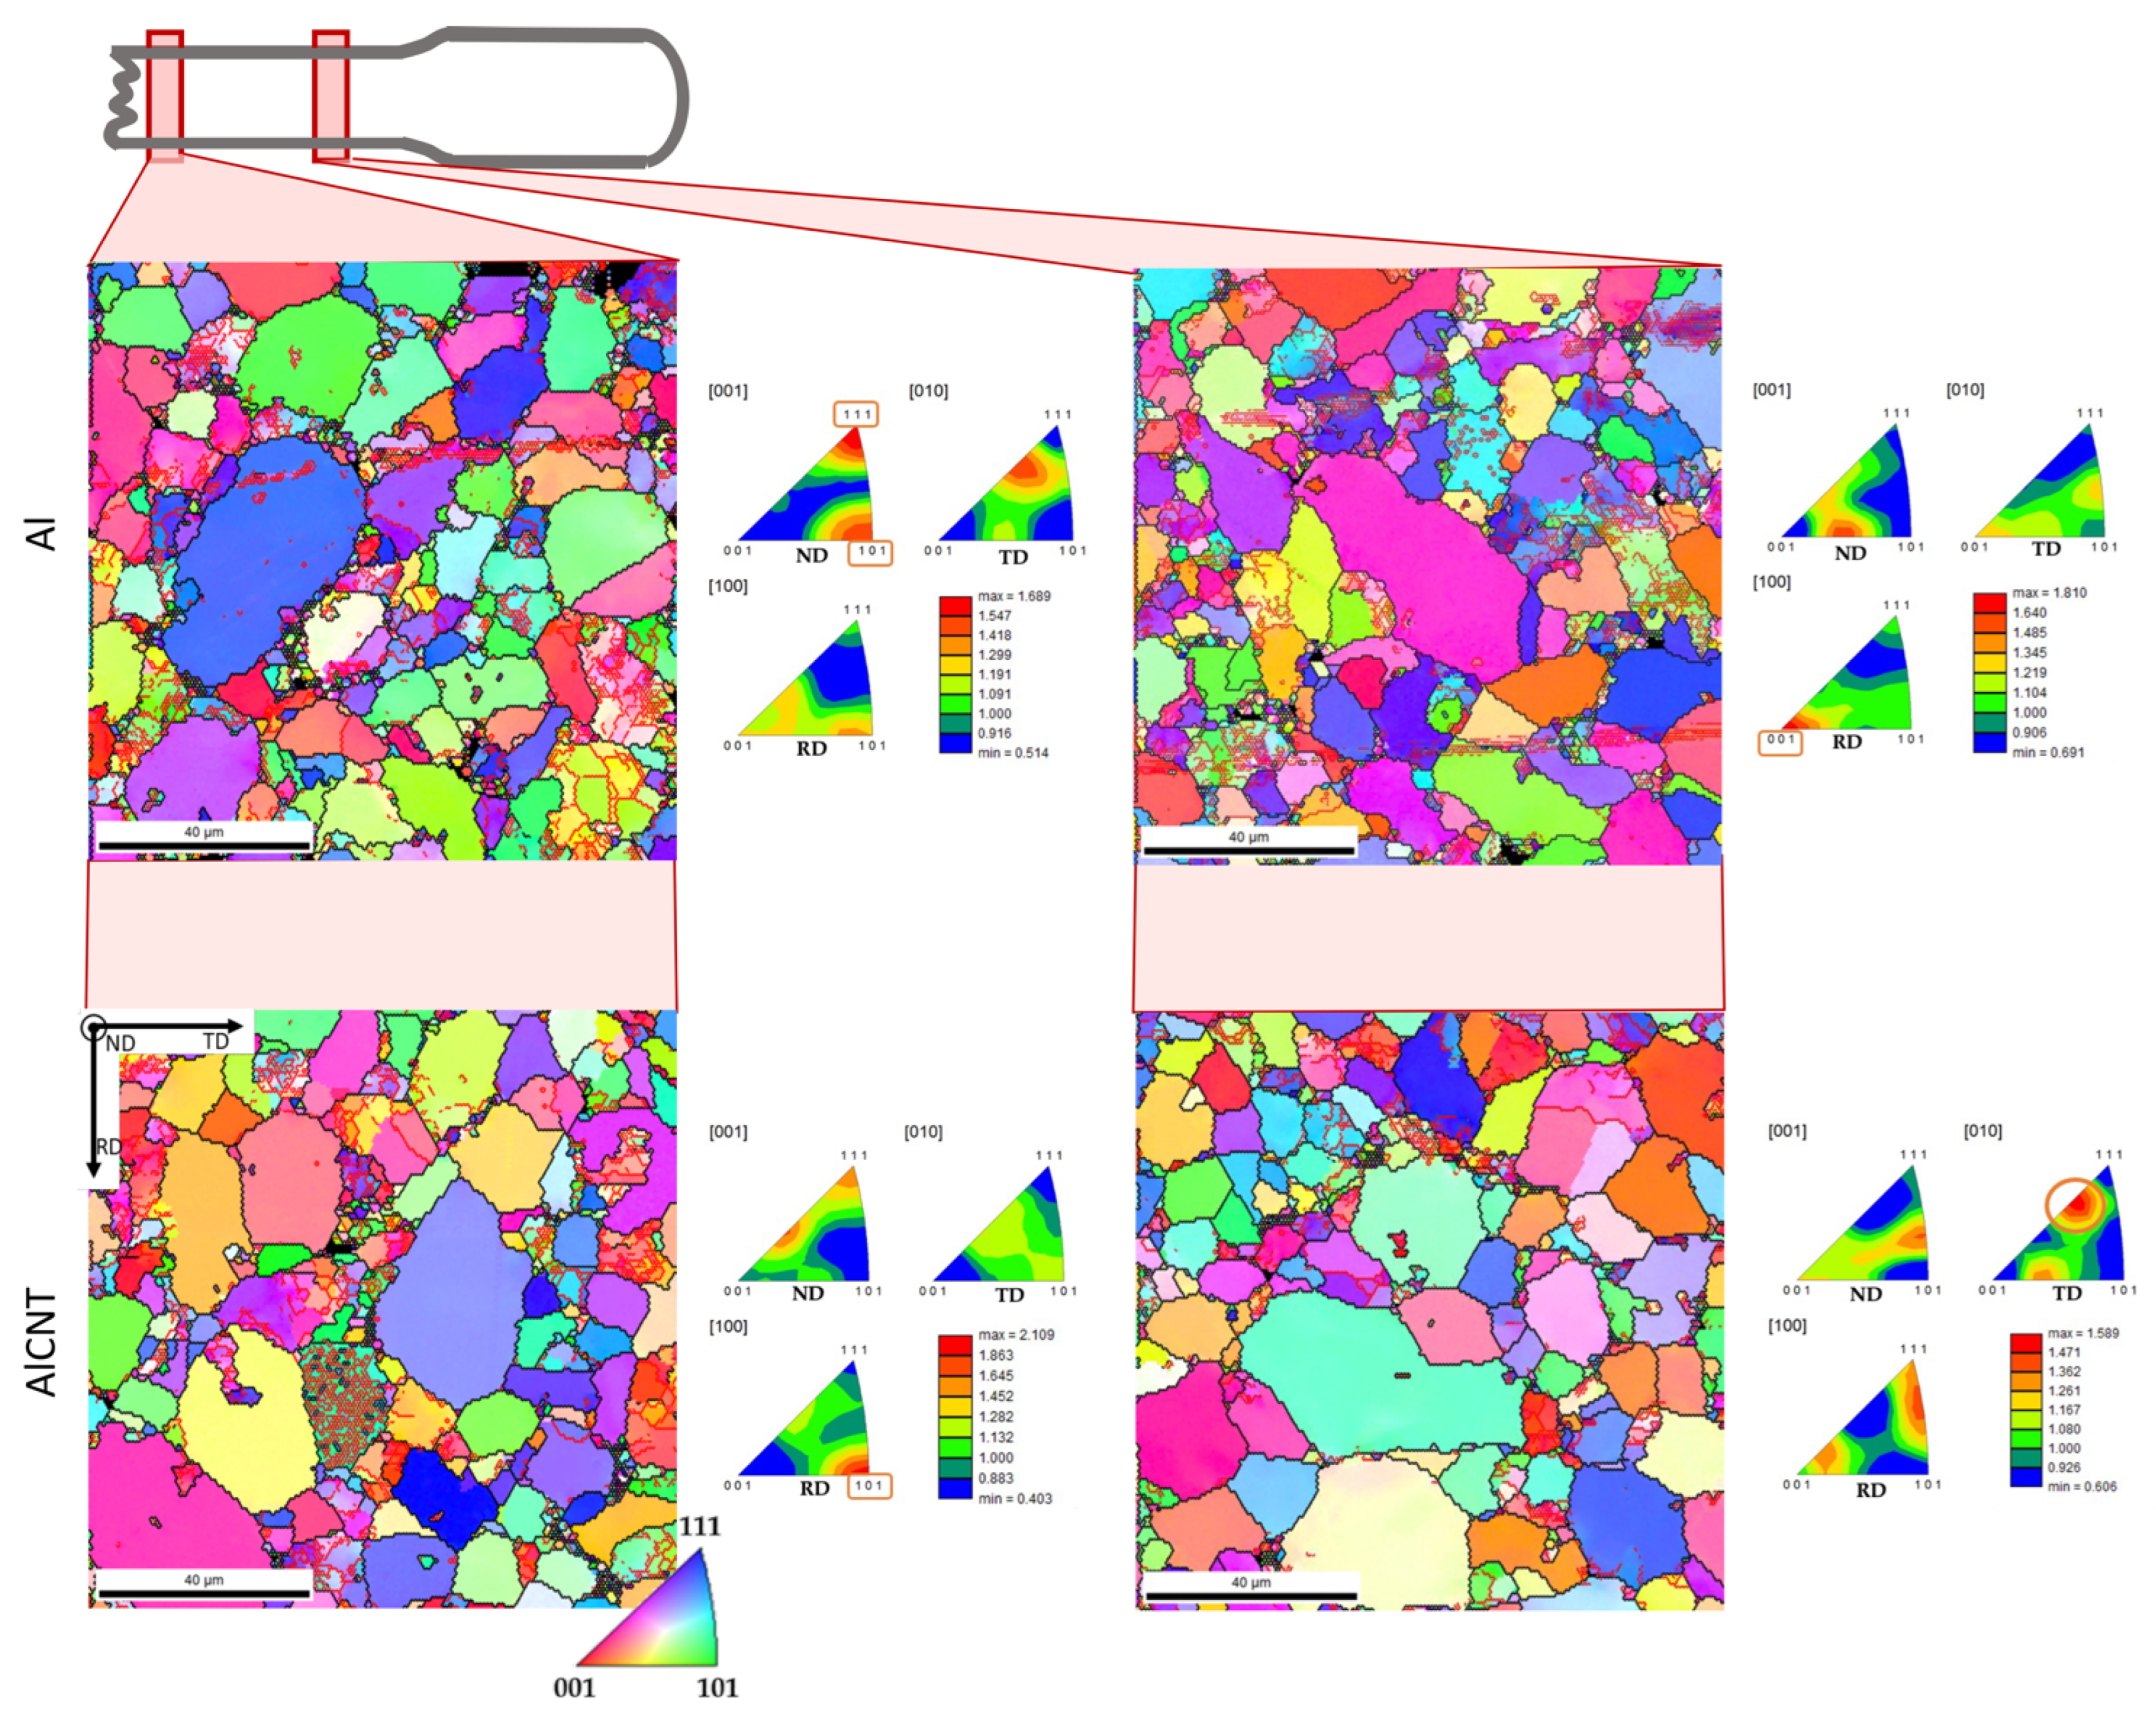
IPF maps with low-angle boundaries marked in red and inverse pole figures for the regions at 2 mm and 10 mm from the fracture surface were shown in Figure 14. Comparing the two zones from the aluminum sample, the fraction of low-angle boundaries is very similar, with a higher density of these boundaries on certain grains than others. Besides that, neither zone has a texture, as can be seen by the IPF map not having a predominant color and by the low intensity of the inverse pole figures. However, there are slight differences between the crystallographic orientation of the two regions. The aluminum in the region at 2.0 mm from the fracture surface showed a strong crystallographic orientation in the directions <111> and <101> parallel to the normal direction (ND). In contrast, 10.0 mm from the fracture, the strong crystallographic orientations were observed at <101> parallel to the rolling direction (RD).
Regarding nanocomposites, a higher density of low-angle boundaries can be observed in the region at 2 mm from the fracture than in the region of 10 mm. The crystallographic orientation differs from the observed zone being strongest for <101> in the RD direction for the region 2 mm away from the surface fracture.
The differences between the nanocomposite and the Al matrix are significant in the strongest crystallographic orientation for each region and the density of low-angle boundaries. While the Al matrix presents a higher density of low-angle grain boundaries in a larger area of the tensile specimen, the nanocomposites only present the deformation in a more localized zone. These results are in line with what has already been mentioned.
CNTs affect the plastic deformation of the nanocomposites since they negatively affect them when they are in clusters at the grain boundaries. At the same time, their presence in the matrix affects the lattice rotation and, thus, the number of slip planes activated. This significantly decreases elongation, but the nanocomposites exhibit a higher yield strength due to the load transfer mechanism.
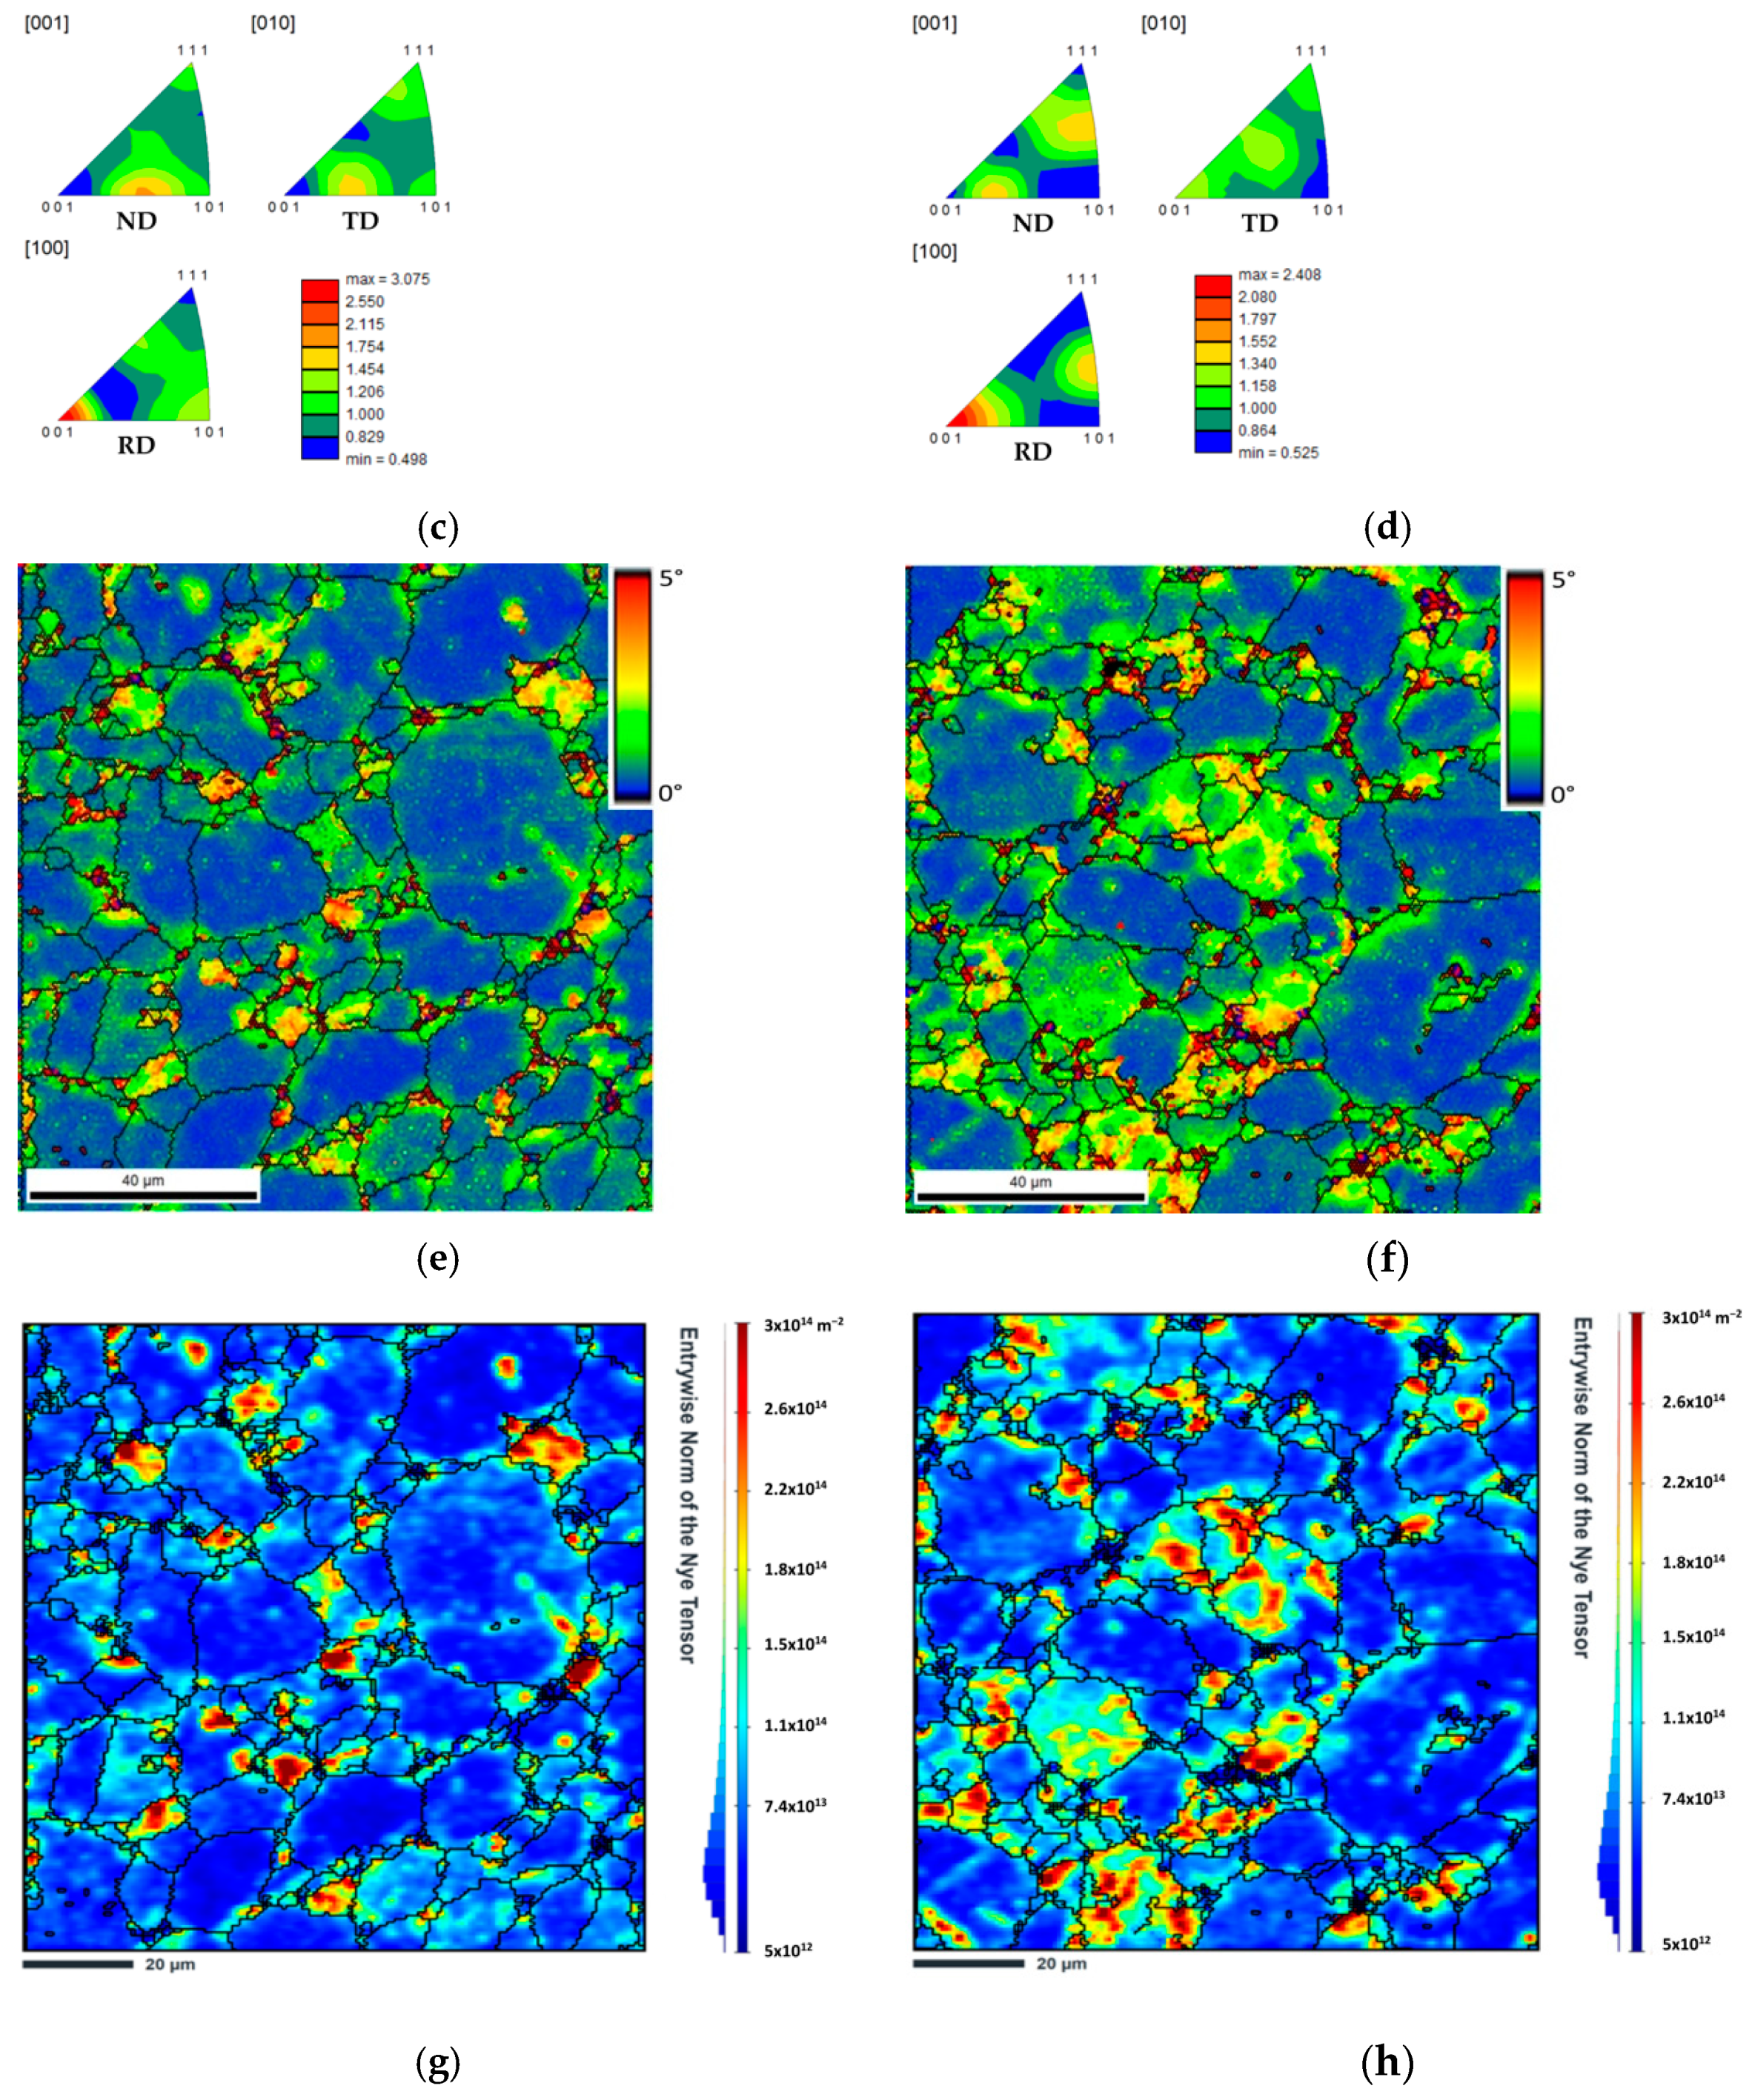
Another region without deformation was also observed for both samples. Figure 15 shows the results of the IPF maps, IPFs, GND density and KAM maps for the Al matrix and the nanocomposites. Based on these results, it can be observed that this region presents less plastic deformation than the one subjected to the tensile test, as expected.
In this region, no significant differences are observed in the crystallographic orientation of the samples. Regarding GNDs density, the nanocomposites reveal a slight increase, especially close to the clusters of CNTs, according to the results observed by the nanoindentations. These microstructural variations are responsible for the deformation behavior between the Al matrix and the Al/CNTs nanocomposites. Therefore, it would be important for these nanocomposites to decrease the fraction of CNTs at the grain boundaries to increase the ductility, thus maintaining the charge transfer.

4. Conclusions

In this investigation, Al/CNT nanocomposites were produced by powder metallurgy route with 1.00 vol.% of the CNTs. The CNTs were dispersed by ultrasonication with the Al powder in isopropanol for 15 min. The tensile test results revealed an increase in the yield strength of 185% for nanocomposites than the Al matrix. However, a decrease in ductility is observed, which can be explained by the presence of some CNTs clusters at the grain boundaries of the matrix.
The nanoindentation test exhibits the nanocomposite’s high hardness values and corresponding high values of reduced Young´s modulus, which corresponds to the presence of CNTs.
The increase in the yield strength of the nanocomposites can be attributed to the load transfer mechanism due to the CNTs elongated observed in the fracture surface of the tensile samples, which can have acted as a bridge, hindering the crack propagation. However, CNTs clusters are observed, which confirms that these are present at the grain boundaries that can significantly decrease the ductility of the nanocomposites.
Microstructural characterization and Vickers hardness evolution of the tensile specimen at different regions explain the different behavior of the nanocomposite samples. The Al samples revealed higher hardness values close to the surface fracture than the nanocomposites. The presence of a higher dislocation density can justify this behavior. In addition, different crystalline orientations and Taylor factors are observed for the samples, corroborating the results observed in the tensile tests. In the non-tested regions, the nanocomposites exhibit a higher density of dislocations and a higher hardness value that can be attributed to CNTs in the matrix.

Author Contributions

Conceptualization, Í.C.; investigation, Í.C. and S.S.; writing–original draft preparation, Í.C. and S.S; supervision, S.S.; formal analysis, S.S.; validation, S.S.; writing–review and editing, S.S. All authors have read and agreed to the published version of the manuscript.

Funding

This research received no external funding.

Institutional Review Board Statement

Not applicable.

Informed Consent Statement

Not applicable.

Data Availability Statement

Data can be available upon request from the authors.

Acknowledgments

The authors are grateful to CEMUP—Centro de Materiais da Universidade do Porto for the expert assistance with SEM.

Conflicts of Interest

The authors declare no conflict of interest.

References

  1. Zhang, W.; Xu, J. Advanced lightweight materials for Automobiles: A review. Mater. Des. 2022, 221, 110994. [Google Scholar] [CrossRef]
  2. Czerwinski, F. Current Trends in Automotive Lightweighting Strategies and Materials. Materials 2021, 14, 6631. [Google Scholar] [CrossRef] [PubMed]
  3. Sridhar, I.; Narayanan, K.R. Processing and characterization of MWCNT reinforced aluminum matrix composites. J. Mater. Sci. 2009, 44, 1750–1756. [Google Scholar] [CrossRef]
  4. Ogawa, F.; Masuda, C. Fabrication and the mechanical and physical properties of nanocarbon-reinforced light metal matrix composites: A review and future directions. Mater. Sci. Eng. A 2021, 820, 141542. [Google Scholar] [CrossRef]
  5. Fan, G.; Jiang, Y.; Tan, Z.; Guo, Q.; Xiong, D.-b.; Su, Y.; Lin, R.; Hu, L.; Li, Z.; Zhang, D. Enhanced interfacial bonding and mechanical properties in CNT/Al composites fabricated by flake powder metallurgy. Carbon 2018, 130, 333–339. [Google Scholar] [CrossRef]
  6. Shahrdami, L.; Sedghi, A.; Shaeri, M.H. Microstructure and mechanical properties of Al matrix nanocomposites reinforced by different amounts of CNT and SiCW. Compos. B Eng. 2019, 175, 107081. [Google Scholar] [CrossRef]
  7. Zhang, S.; Chen, G.; Qu, T.; Wei, J.; Yan, Y.; Liu, Q.; Zhou, M.; Zhang, G.; Zhou, Z.; Gao, H.; et al. A novel aluminum-carbon nanotubes nanocomposite with doubled strength and preserved electrical conductivity. Nano Res. 2021, 14, 2776–2782. [Google Scholar] [CrossRef]
  8. Chen, J.; Yan, L.; Liang, S.; Cui, X.; Liu, C.; Wang, B.; Zou, L. Remarkable improvement of mechanical properties of layered CNTs/Al composites with Cu decorated on CNTs. J. Alloys Compd. 2022, 901, 163404. [Google Scholar] [CrossRef]
  9. Sadeghi, B.; Tan, Z.; Qi, J.; Li, Z.; Min, X.; Yue, Z.; Fan, G. Enhanced mechanical properties of CNT/Al composite through tailoring grain interior/grain boundary affected zones. Compos. B Eng. 2021, 223, 109133. [Google Scholar] [CrossRef]
  10. Esawi, A.M.K.; Morsi, K.; Sayed, A.; Taher, M.; Lanka, S. Effect of carbon nanotube (CNT) content on the mechanical properties of CNT-reinforced aluminium composites. Compos. Sci. Technol. 2010, 70, 2237–2241. [Google Scholar] [CrossRef]
  11. Xie, K.; Zhang, G.; Huang, H.; Zhang, J.; Liu, Z.; Cai, B. Investigation of the main strengthening mechanism of carbon nanotube reinforced aluminum composites. Mater. Sci. Eng. A 2021, 804, 140780. [Google Scholar] [CrossRef]
  12. Simões, S.; Viana, F.; Reis, M.A.L.; Vieira, M.F. Influence of dispersion/mixture time on mechanical properties of Al–CNTs nanocomposites. Compos. Struct. 2015, 126, 114–122. [Google Scholar] [CrossRef]
  13. Simões, S.; Viana, F.; Reis, M.A.L.; Vieira, M.F. Microstructural Characterization of Aluminum-Carbon Nanotube Nanocomposites Produced Using Different Dispersion Methods. Microsc. Microanal. 2016, 22, 725–732. [Google Scholar] [CrossRef] [PubMed]
  14. Simões, S.; Viana, F.; Reis, M.A.L.; Vieira, M.F. Improved dispersion of carbon nanotubes in aluminum nanocomposites. Compos. Struct. 2014, 108, 992–1000. [Google Scholar] [CrossRef]
  15. Simões, S.; Viana, F.; Reis, M.A.L.; Vieira, M.F. Aluminum and Nickel Matrix Composites Reinforced by CNTs: Dispersion/Mixture by Ultrasonication. Metals 2017, 7, 279. [Google Scholar] [CrossRef]
  16. Carneiro, Í.; Fernandes, J.V.; Simões, S. Strengthening Mechanisms of Aluminum Matrix Nanocomposites Reinforced with CNTs Produced by Powder Metallurgy. Metals 2021, 11, 1711. [Google Scholar] [CrossRef]
  17. Carneiro, Í.; Simões, S. Effect of Morphology and Structure of MWCNTs on Metal Matrix Nanocomposites. Materials 2020, 13, 5557. [Google Scholar] [CrossRef]
  18. Carneiro, Í.; Fernandes, J.V.; Simões, S. Deformation Behaviour of Cold-Rolled Ni/CNT Nanocomposites. Appl. Sci. 2022, 12, 9471. [Google Scholar] [CrossRef]
  19. Carneiro, Í.; Viana, F.; Vieira, F.M.; Fernandes, V.J.; Simões, S. EBSD Analysis of Metal Matrix Nanocomposite Microstructure Produced by Powder Metallurgy. Nanomaterials 2019, 9, 878. [Google Scholar] [CrossRef] [Green Version]
  20. Beausir, B.; Fundenberger, J.-J. Analysis Tools for Electron and X-ray diffraction, ATEX–software; Université de Lorraine–Metz: Metz, France, 2017. [Google Scholar]
  21. Wang, M.; Li, Y.; Chen, B.; Shi, D.; Umeda, J.; Kondoh, K.; Shen, J. The rate-dependent mechanical behavior of CNT-reinforced aluminum matrix composites under tensile loading. Mater. Sci. Eng. A 2021, 808, 140893. [Google Scholar] [CrossRef]
  22. Liao, J.Z.; Pang, J.J.; Tan, M.J. Nanoindentation of Multi-Wall CNT Reinforced Al Composites. Key Eng. Mater. 2010, 447–448, 549–553. [Google Scholar] [CrossRef]
  23. Chen, B.; Li, S.; Imai, H.; Jia, L.; Umeda, J.; Takahashi, M.; Kondoh, K. Load transfer strengthening in carbon nanotubes reinforced metal matrix composites via in-situ tensile tests. Compos. Sci. Technol. 2015, 113, 1–8. [Google Scholar] [CrossRef]
  24. Wang, F.-C.; Zhang, Z.-H.; Sun, Y.-J.; Liu, Y.; Hu, Z.-Y.; Wang, H.; Korznikov, A.V.; Korznikova, E.; Liu, Z.-F.; Osamu, S. Rapid and low temperature spark plasma sintering synthesis of novel carbon nanotube reinforced titanium matrix composites. Carbon 2015, 95, 396–407. [Google Scholar] [CrossRef]
  25. Nasiri, S.; Wang, K.; Yang, M.; Guénolé, J.; Li, Q.; Zaiser, M. Atomistic aspects of load transfer and fracture in CNT-reinforced aluminium. Materialia 2022, 22, 101376. [Google Scholar] [CrossRef]
  26. Park, J.G.; Keum, D.H.; Lee, Y.H. Strengthening mechanisms in carbon nanotube-reinforced aluminum composites. Carbon 2015, 95, 690–698. [Google Scholar] [CrossRef]
  27. Carneiro, Í.; Simões, S. Recent Advances in EBSD Characterization of Metals. Metals 2020, 10, 1097. [Google Scholar] [CrossRef]
  28. Gussev, M.N.; Leonard, K.J. In situ SEM-EBSD analysis of plastic deformation mechanisms in neutron-irradiated austenitic steel. J. Nucl. Mater. 2019, 517, 45–56. [Google Scholar] [CrossRef]
  29. Xiong, W.; Huang, Z.; Xie, G.; Ge, Z.; Wang, X.; Lu, Y.; Zheng, W.; Lou, L.; Zhang, J. The effect of deformation temperature on recrystallization in a Ni-based single crystal superalloys. Mater. Des. 2022, 222, 111042. [Google Scholar] [CrossRef]
  30. Zhang, X.; Zou, L.; Chen, J.; Dai, P.; Pan, J. Design and Preparation of CNTs/Mg Layered Composites. Materials 2022, 15, 864. [Google Scholar] [CrossRef]
  31. Zribi, Z.; Ktari, H.H.; Herbst, F.; Optasanu, V.; Njah, N. EBSD, XRD and SRS characterization of a casting Al-7wt%Si alloy processed by equal channel angular extrusion: Dislocation density evaluation. Mater. Charact. 2019, 153, 190–198. [Google Scholar] [CrossRef]
  32. Li, S.; Guo, C.; Hao, L.; Kang, Y.; An, Y. In-situ EBSD study of deformation behaviour of 600 MPa grade dual phase steel during uniaxial tensile tests. Mater. Sci. Eng. A 2019, 759, 624–632. [Google Scholar] [CrossRef]
  33. Wu, X.; Suo, H.; Ji, Y.; Li, J.; Ma, L.; Liu, M.; Zhang, Z.; Wang, Q. Systematical analysis on the grain orientation evolution of pure nickel under plastic deformation by using in-situ EBSD. Mater. Sci. Eng. A 2020, 792, 139722. [Google Scholar] [CrossRef]
  34. Ding, H.; Cui, X.; Wang, Z.; Zhao, T.; Wang, Y.; Zhang, Y.; Chen, H.; Huang, L.; Geng, L.; Chen, J. A new strategy for fabrication of unique heterostructured titanium laminates and visually tracking their synchronous evolution of strain partitions versus microstructure. J. Mater. Sci. Technol. 2022, 107, 70–81. [Google Scholar] [CrossRef]
  35. Brewer, L.N.; Field, D.P.; Merriman, C.C. Mapping and Assessing Plastic Deformation Using EBSD. In Electron Backscatter Diffraction in Materials Science; Schwartz, A.J., Kumar, M., Adams, B.L., Field, D.P., Eds.; Springer: Boston, MA, USA, 2009; pp. 251–262. [Google Scholar] [CrossRef]
  36. Mohammed, S.M.A.K.; Chen, D.L.; Liu, Z.Y.; Ni, D.R.; Wang, Q.Z.; Xiao, B.L.; Ma, Z.Y. Deformation behavior and strengthening mechanisms in a CNT-reinforced bimodal-grained aluminum matrix nanocomposite. Mater. Sci. Eng. A 2021, 817, 141370. [Google Scholar] [CrossRef]
Figure 1. (a) Image of the fracture tensile specimen and (b) schematic illustration of the sections observed using SEM and EBSD techniques.
Applsci 13 00054 g001
Figure 2. Schematic illustration of Vickers microhardness matrix in the top view fractured tensile specimen.
Applsci 13 00054 g002
Figure 3. Full analysis of the Al powder as received showing (a) Scanning electron microscopy (SEM) image of Al powders, (b,c) exemplifying particle analyzed with electron backscatter diffraction (EBSD) with an (a) inverse pole figure map and (b) Kernel average misorientation map, (d) size distribution and (e) average values of length and width of the particles.
Applsci 13 00054 g003
Figure 4. (a) SEM image of the as-received CNTs, (b) HRTEM image of the CNTs showing some structure details as the multi-walls (yellow) and concentric CNTs (green).
Applsci 13 00054 g004
Figure 5. (a) HRTEM image of the CNT after ultrasonication showing some structure details and (b) SEM image of the Al/CNT mixtures after 15 min ultrasonication.
Applsci 13 00054 g005
Figure 6. Tensile curves of tensile specimens of aluminum matrix and the nanocomposites produced under the same conditions.
Applsci 13 00054 g006
Figure 7. OM image with an SEM detail and with the nanoindentation matrix marked and hardness and reduced Young’s modulus (Er) maps in the nanocomposites.
Applsci 13 00054 g007
Figure 8. Surface analysis of the fracture surface of the samples after the tensile test: (a,b) digital optical microscope image of the area selected of Al and Al/CNT samples; (c,d) 3D image of the area of the (a,b); (e,f) profile of the line selected in the surface image.
Applsci 13 00054 g008
Figure 9. Secondary electrons image obtained by scanning electron microscopy (SEM) of different areas of the nanocomposite fracture surface of tensile samples, being (a) low magnification (b) higher magnifications and (c) a detail showing elongated CNT.
Applsci 13 00054 g009
Figure 10. Hardness distribution maps (HV 0.01) of (a) Al and (b) Al/CNT of fractured tensile test specimens.
Applsci 13 00054 g010
Figure 11. Hardness distribution maps (HV 0.01) of (a) Al and (d) Al/CNT of fractured tensile test specimens close to the fracture and average geometrically necessary dislocations (GNDs) density maps of (b,c) Al and (e,f) Al/CNT samples.
Applsci 13 00054 g011
Figure 12. (a,b) 2nd neighbor kernel average misorientation (KAM) maps, (c,d) tensile Taylor factor maps and (e,f) Taylor factor distribution of (a,c,e) Al and (b,d,f) Al/CNT tensile test specimen 2.0 mm from the fracture surface.
Applsci 13 00054 g012
Figure 13. Hardness distribution maps (HV 0.01) of (a) Al and (d) Al/CNT of fractured tensile test specimens and average geometrically necessary dislocations (GNDs) density and Taylor factor maps of (b,c) Al and (e,f) Al/CNT samples.
Applsci 13 00054 g013
Figure 14. Inverse pole figure (IPF) maps, with high-angle (black) and low-angle (red) boundaries and the correspondent IPFs of Al and Al/CNT samples at 2.0 mm and 10.0 mm from the fracture surface.
Applsci 13 00054 g014
Figure 15. (a,b) IPF maps, with high-angle (black) and low-angle (red) boundaries, (c,d) IPFs, (e,f) GNDs density and (g,h) Al and Al/CNT samples at the head of the tensile samples.
Applsci 13 00054 g015aApplsci 13 00054 g015b
Disclaimer/Publisher’s Note: The statements, opinions and data contained in all publications are solely those of the individual author(s) and contributor(s) and not of MDPI and/or the editor(s). MDPI and/or the editor(s) disclaim responsibility for any injury to people or property resulting from any ideas, methods, instructions or products referred to in the content.