Article

Portable Prototype of Hydrogen Fuel Cells for Educational Training

Electrical Engineering Department, College of Engineering, Najran University, Najran 11001, Saudi Arabia
Appl. Sci. 2023, 13(1), 608; https://doi.org/10.3390/app13010608
Submission received: 23 November 2022 / Revised: 21 December 2022 / Accepted: 21 December 2022 / Published: 2 January 2023
(This article belongs to the Section Energy Science and Technology)

Abstract

:
This paper presents an experimental prototype of hydrogen fuel cells suitable for training engineering students. The presented system is designed to teach students the V-I characteristics of the fuel cells and how to record the V-I characteristics curve in the case of a single or multiple fuel cells. The prototype contains a compact electrolyzer to produce hydrogen and oxygen to the fuel cell. The fuel cell generates electricity to supply power to various types of loads. The paper also illustrates how to calculate the efficiency of fuel cells in series and parallel modes of operation. In the series mode of operation, it is mathematically proven that the efficiency is higher at lower currents. Still, the fuel cell operating area is required where the power is the highest. According to experimental results, the efficiency in the case of series connection is approximately 25 % , while in parallel operation mode, the efficiency is about 50 % . Thus, a parallel connection is recommended in the high current applications because the efficiency is higher than the one resulted from series connection. As explained later in the study plan, several other experiments can be performed using this educational kit.

1. Introduction

The history of fuel cells (FC) goes back to the 1800s when Anthony Carlisle and William Nicholson first described the electrolysis process. In 1839, William Grove was credited with the first fuel cell [1]. He made a “Gas Battery,” which consists of separate platinum electrodes submerged in a sulfuric acid electrolyte solution. The gas battery produced 12 amps and 1.8 volts [2]. Friedrich Ostwald described the theoretical understanding of FC and explained FC components’ roles in 1893 [3]. Using coal-derived gas, Ludwig Mond performed experiments on FC in 1889 and utilized platinum as an electrode [4]. The output parameters achieved by this FC were 0.73 V and 6 Ampere per square foot [5,6]. Alder Wright and C. Thompson developed a similar fuel cell, but these cells had the problem of leaking gases from one chamber to another [7]. That is why they produced a voltage of less than 1 to meet the electricity needs. Louis Paul and Joseph (1832–1913) [8] also thought that the fuel cell electrochemical process lacks practicality due to needing costly metals, and coal was inexpensive, so it was impossible to develop a new system with higher efficiency with less electricity cost [9]. In the early 1900s, Emil Baur performed experimentation on various FC types, especially on high-temperature FC [10]. This work led to FC types being researched for these days, such as Molten Carbonate Fuel Cell (MCFC) and Solid Oxide Fuel Cell (SOFC) devices [11].
Current energy sources primarily depend on fossil fuels [12,13]. However, due to technological advancements, energy demand is increasing while fossil fuels are depleting due to their limited supply resulting in a considerable energy gap. As per IEA, during the last two decades, an increase of 49% in energy demand has been observed [14,15]. Moreover, all emerging economies depend on their energy sector for development [16]. To meet this energy demand, keeping in view fossil fuel depletion, the focus these days is to explore renewable energy technologies such as hydrogen energy, solar energy, bioenergy, etc. Although solar and wind energies are renewable, they are intermittent and not dispatchable [17]. Solar photovoltaics and wind energy system often require energy storage elements to mitigate intermittency, stabilize the power system, and improve the utilization rate [18]. Fuel cells are dispatchable, and their system is less complex. Hydrogen can be produced from water through electrolysis and used as fuel in fuel cells for electricity production or power in fuel cell-based vehicles [16]. In 2022, the total market size of hydrogen energy was USD 136 billion, giving rise to the creation of more than 10,000 new jobs [19]. The hydrogen economy has the potential to lead the energy sector in the future.
Fuel cells are similar to batteries in how they store chemical energy in the form of hydrogen and oxidant [20]. The fuel cell will continue to produce power until fuel and oxidant are supplied, thus behaving like a factory. The capacity of the fuel cell depends upon the fuel tank size. Therefore fuel cell power rating may vary from a few kW to MW [21]. Surplus energy from renewable energy sources during fewer peak hours can be used for the electrolysis of water, producing hydrogen. This hydrogen can later be used in the fuel cell to produce electricity during peak hours or for electricity breakdown [22]. This paper will describe, through several experiments, the operation of fuel cells and calculate the energy efficiency for series and parallel connected fuel cells on the portable educational prototype. In addition, it also describes the principle of operation of electrolyzers, which is used to the splitting of water molecules into hydrogen and oxygen [23,24].
The rest of this paper is organized as follows: Section 2 presents the theoretical background of the fuel cell. Section 3 illustrates the portable kit’s setup and the experiments’ details. Section 4 and Section 5 present the experimental results of the prototype and the conclusions, respectively.

2. Theoretical Background

This section presents the theoretical background given to learners before starting experimentation. The theoretical background can be divided into four sections, as described in the following subsections.

2.1. Applications of Fuel Cells
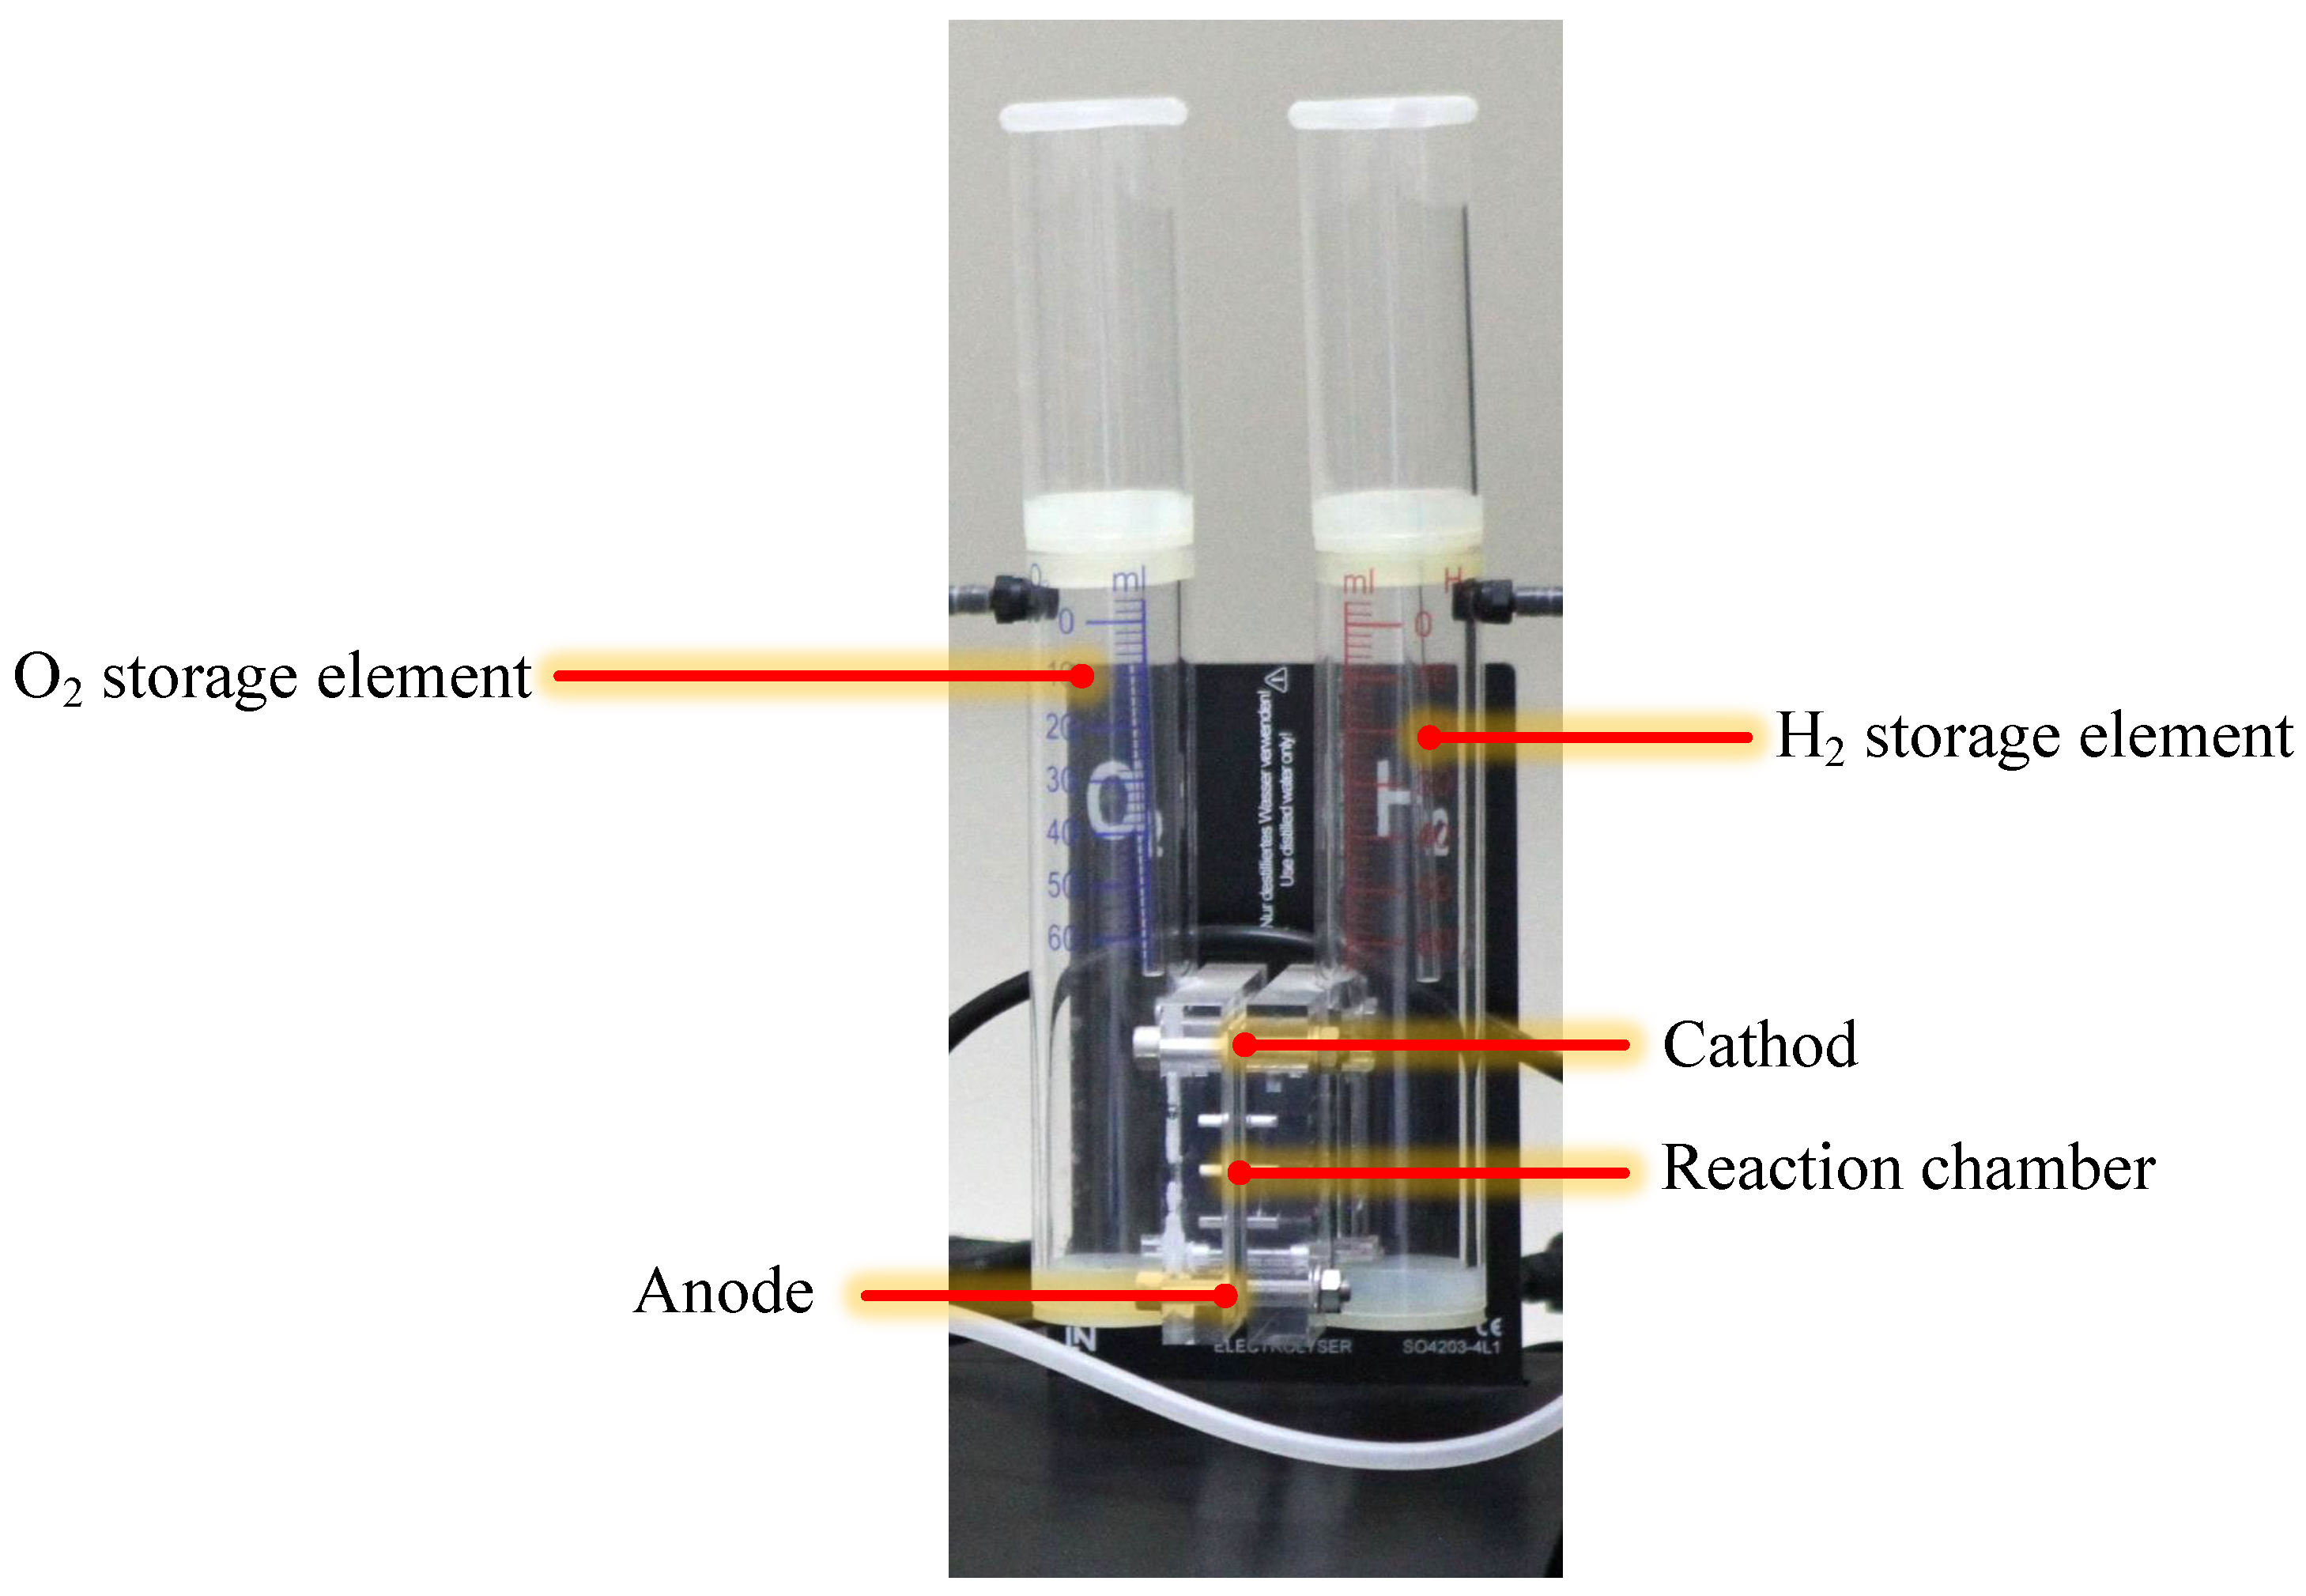
Integrating fuel cells into automobiles may transform the automotive industry since hydrogen energy is renewable. The reactants of fuel cells are oxygen and hydrogen, with water as a byproduct. Almost a decade ago, hydrogen and electricity were positioned as the greatest conceivable replacements for traditional fossil-fuel automobiles. Nonetheless, battery-powered electric vehicles continue to dominate the transition to our envisioned environmentally friendly transportation system. However, historical data patterns reveal that hydrogen-powered cars have yet to ramp up the pace of integration into our transportation system. Electric vehicles, on the other hand, outsell hydrogen-powered vehicles owing to the considerable hydrogen infrastructure needed, which is still lacking when compared to electric vehicle charging stations [25,26].
The main component of fuel cell vehicles is the fuel cell itself, motor, battery, coolant, and air cleaning system, as shown in Figure 1. Fuel cells produce electricity to power the electric vehicle’s motor by converting hydrogen. The charging time of electric cars is a significant problem that can take even hours, but in the case of fuel cell vehicles, the tank can be refilled within minutes, just like conventional vehicles. Moreover, in terms of mileage, fuel cell vehicles outperform electric vehicles [27].
Daisie et al. [28] simulated vehicle proton exchange membrane FC application. This simulation model examined FC fuel economy in automotive applications and control strategies. Controlling the air compressor, cooling system, and other auto parts could boost PEMFC efficiency. Two cases were studied. The first case had perfect air compressor control, while the second had none. Because vehicle load changes with speed, this simulation examined power train performance under various load cycles. Rajesh et al. [29] discussed FC vehicle fuel economy. FC vehicles had 2.7 times the fuel economy of conventional vehicles. FCV fuel economy competed with IC engine vehicles even at 0.6 V, the theoretical cell voltage of 0.7 V. FC efficiency and low driving load profiles drove this fuel economy. The parasitic losses are minimized in the FC. In non-hybrid vehicles, FC voltage below 0.6 V reduces fuel economy. FC vehicles need the air management system because it has the highest parasitic losses. The air management system should provide reasonable turndown and operate at low pressures.
Other uses of hydrogen FC can be found in both the residential and commercial sectors. The residential and commercial sectors contribute 30% of greenhouse gas emissions globally, which can be reduced by replacing the conventional system with an FC grid-connected CHP system. A 1 kW FC system can help to reduce the 1250 Kg CO 2 emissions per household. It was found that the energy supply from FC production units to the residential sector will be more cost-effective than the local grid supply due to the low operational cost of the fuel cell [30]. Research is now focusing on integrating FC into CHP and cogeneration units to generate electricity for the residential and commercial sectors. As hydrogen is produced from water and 70% of the earth is covered in water, the potential of hydrogen energy is immense. SOFC can operate at high temperatures, even at 800 °C, so it is most suitable for application in cogenerations power units and CHP [31].

2.2. Electrolyzer

Electrolyzers contain cathode and anode electrodes, which are positively and negatively charged, respectively. An electrolyte separates these electrodes. The theory of operation and the behavior of the different electrolyzers depends upon ionic species and electrode materials. The most common electrolyzers are polymer electrolyte membrane electrolyzers (PEM) [32], alkaline electrolyzers [33], and solid oxide electrolyzers [34]. The comparison of the state-of-the-art electrolyzers has been given in Table 1 [35,36]. In terms of performance during hydrogen evolution reaction, platinum has been proven to be the best catalyst in alkaline and acidic environments. However, the reaction kinetics in the alkaline environment are much slower than acidic environment due to sluggish water dissociation, which reduces the magnitude of the response by 2–3 times. Therefore, alkaline electrolysis has been a more economical option at the industrial level [37].

2.3. Cell and the Stack

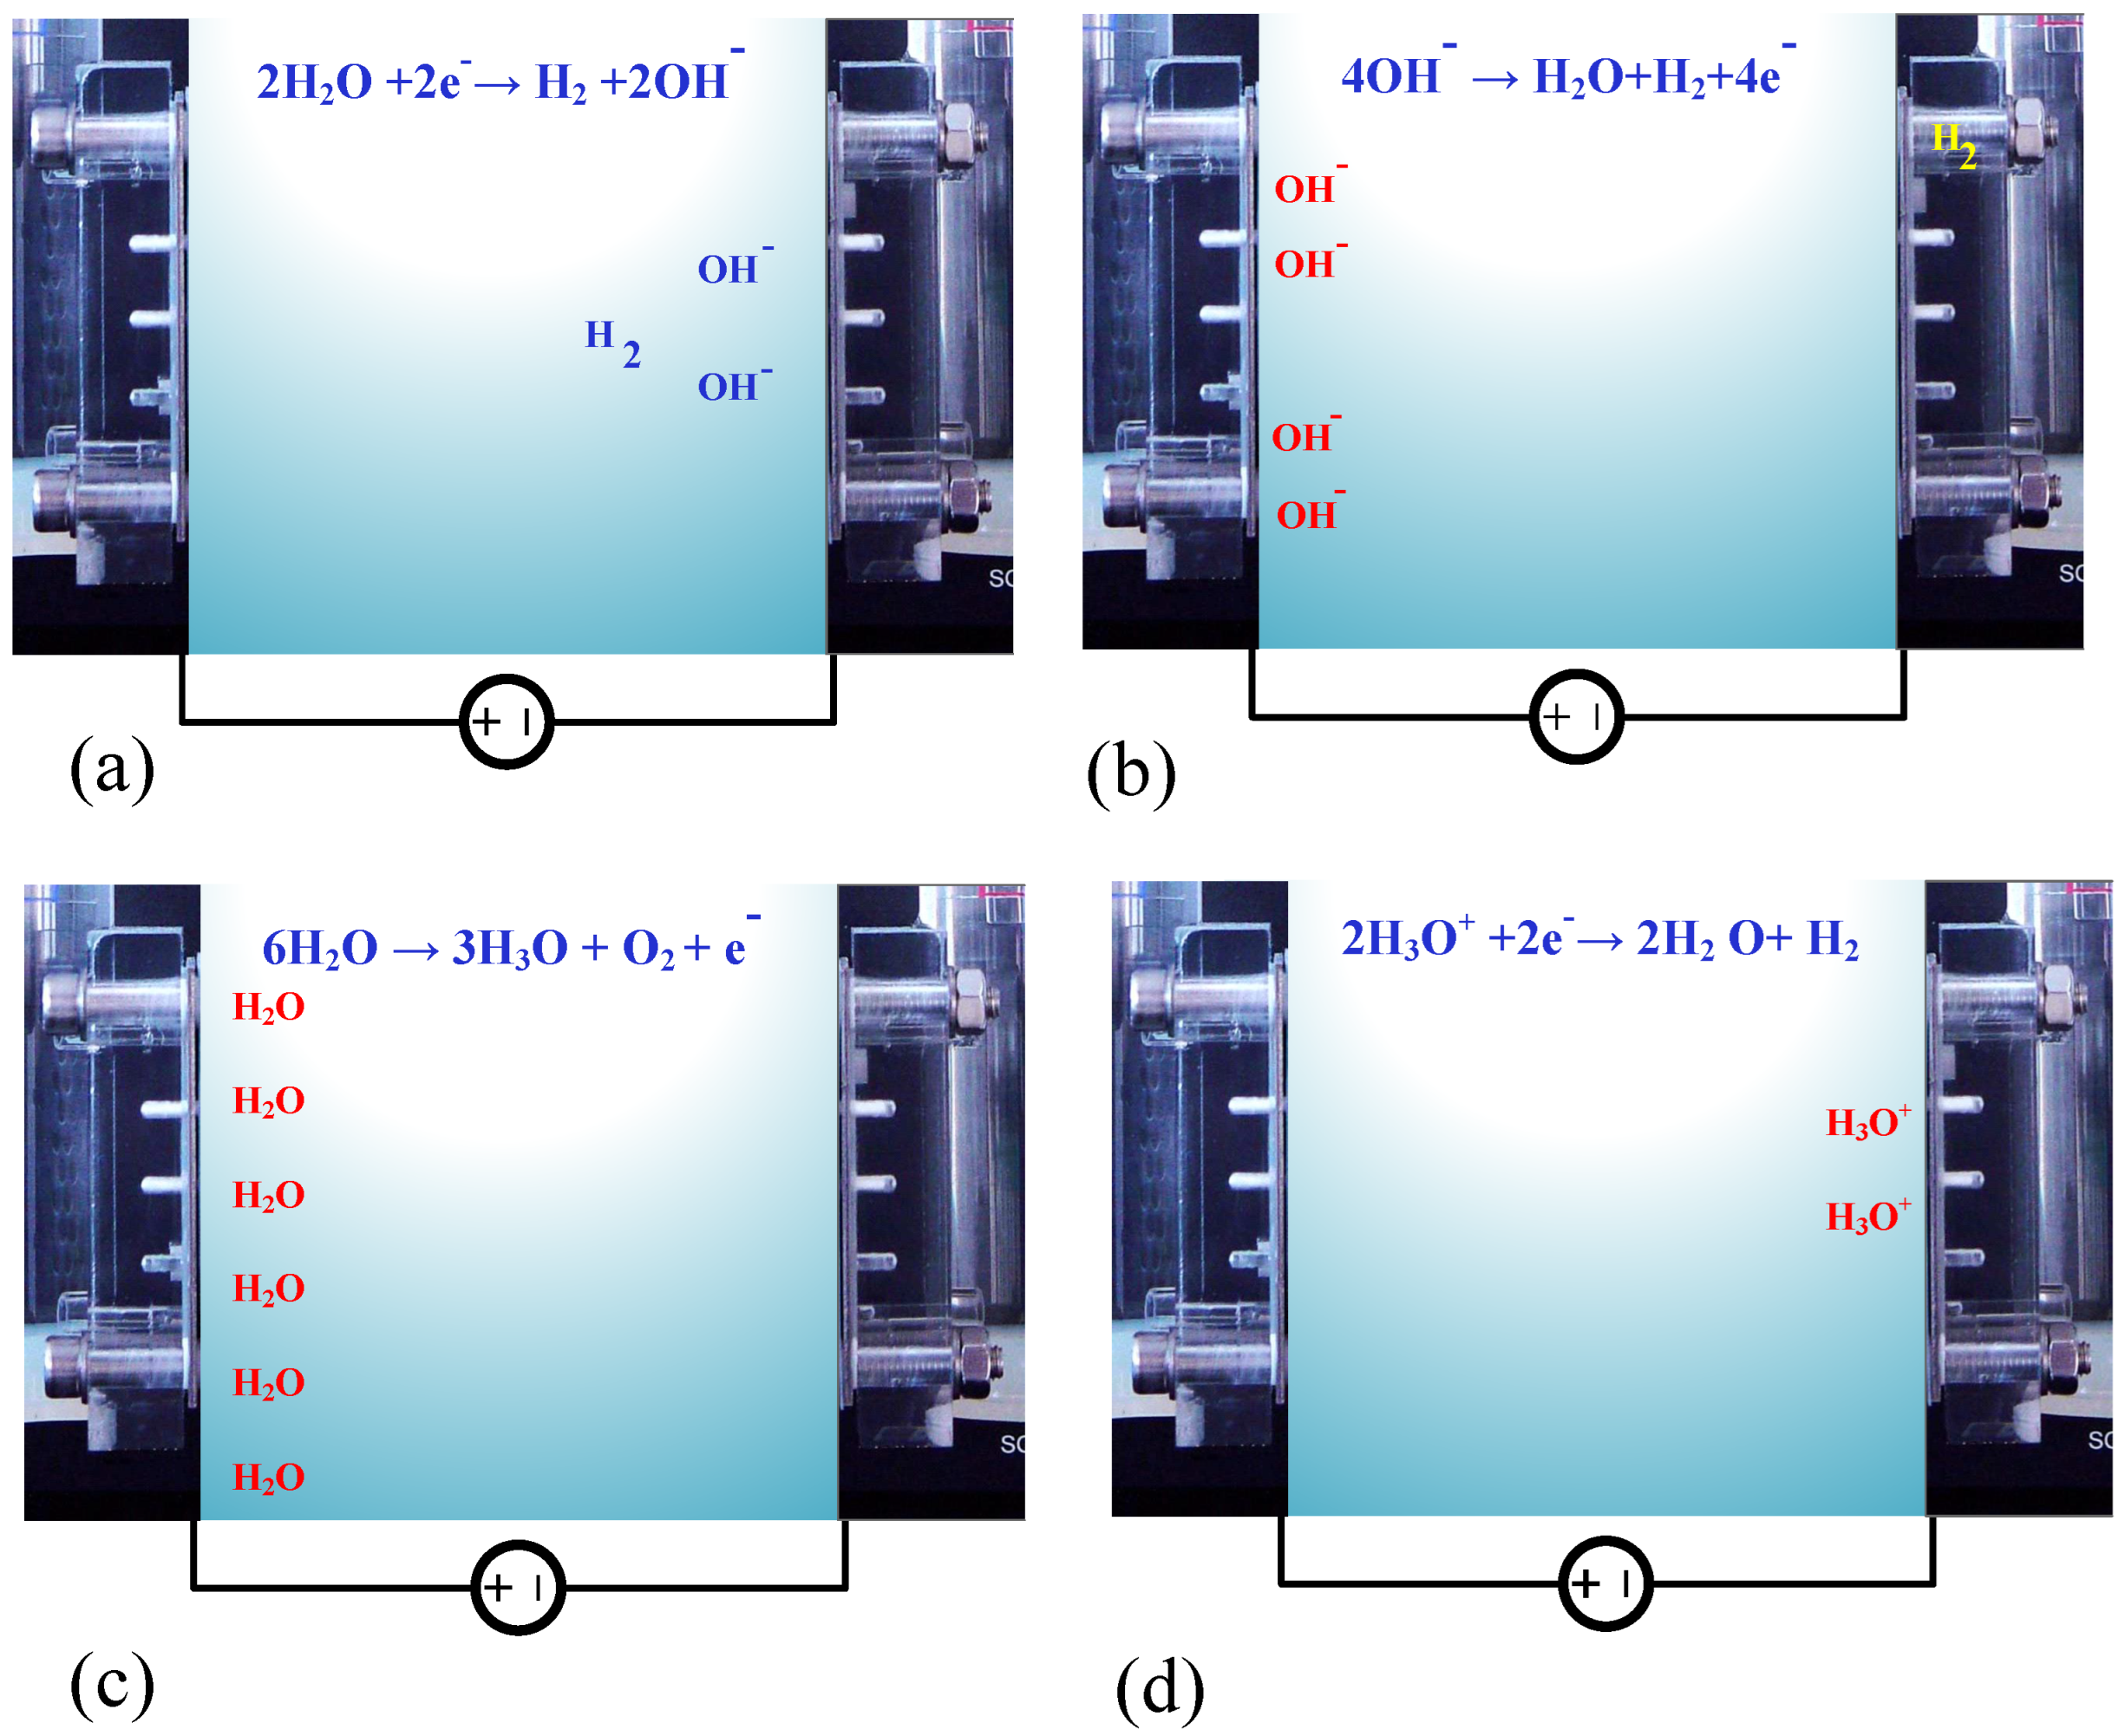
2.3.1. Operating Principles

Hydrogen is introduced as fuel, while oxygen acts as an oxidant. The reaction at the anode happens, and hydrogen undergoes oxidation and e- leaves the cell. Another reaction occurs at the cathode. Electrons e- enter the cell at the cathode side O 2 undergo reduction, react with the hydrogen, and form the water. A catalyst helps to speed up the hydrogen splitting into electrons and hydrogen ions at the anode. These hydrogen ions are transferred to the cathode through the electrolyte membrane while electrons pass through an external circuit resulting in an electric current. Therefore the electronic conductivity of the catalyst layer is of crucial importance. The area where electrolytes, electrodes, and reactants come into contact is called the reaction area. The higher the reaction area, the higher the amount of current produced. Reaction kinetics is another crucial parameter. A fast reaction rate has higher output, while sluggish kinetics result in lower output, which is why a catalyst is used to enhance FC’s production and overall efficiency. Electrons and ions produced at either electrode must be consumed at the other electrode to keep charge balance as electrons are small in size than ions. Therefore, their movement is effortless. At the same time, ions have large sizes and must pass through electrolytes, making their movement difficult. Ion’s movement takes place through a hopping mechanism. For efficient ion movement, the electrolyte must be very thin. Water is produced as a byproduct and must be removed continuously. Otherwise, it may accumulate in the fuel cell and strangle it. Thus the transport of fuel and oxygen will be disturbed [38].

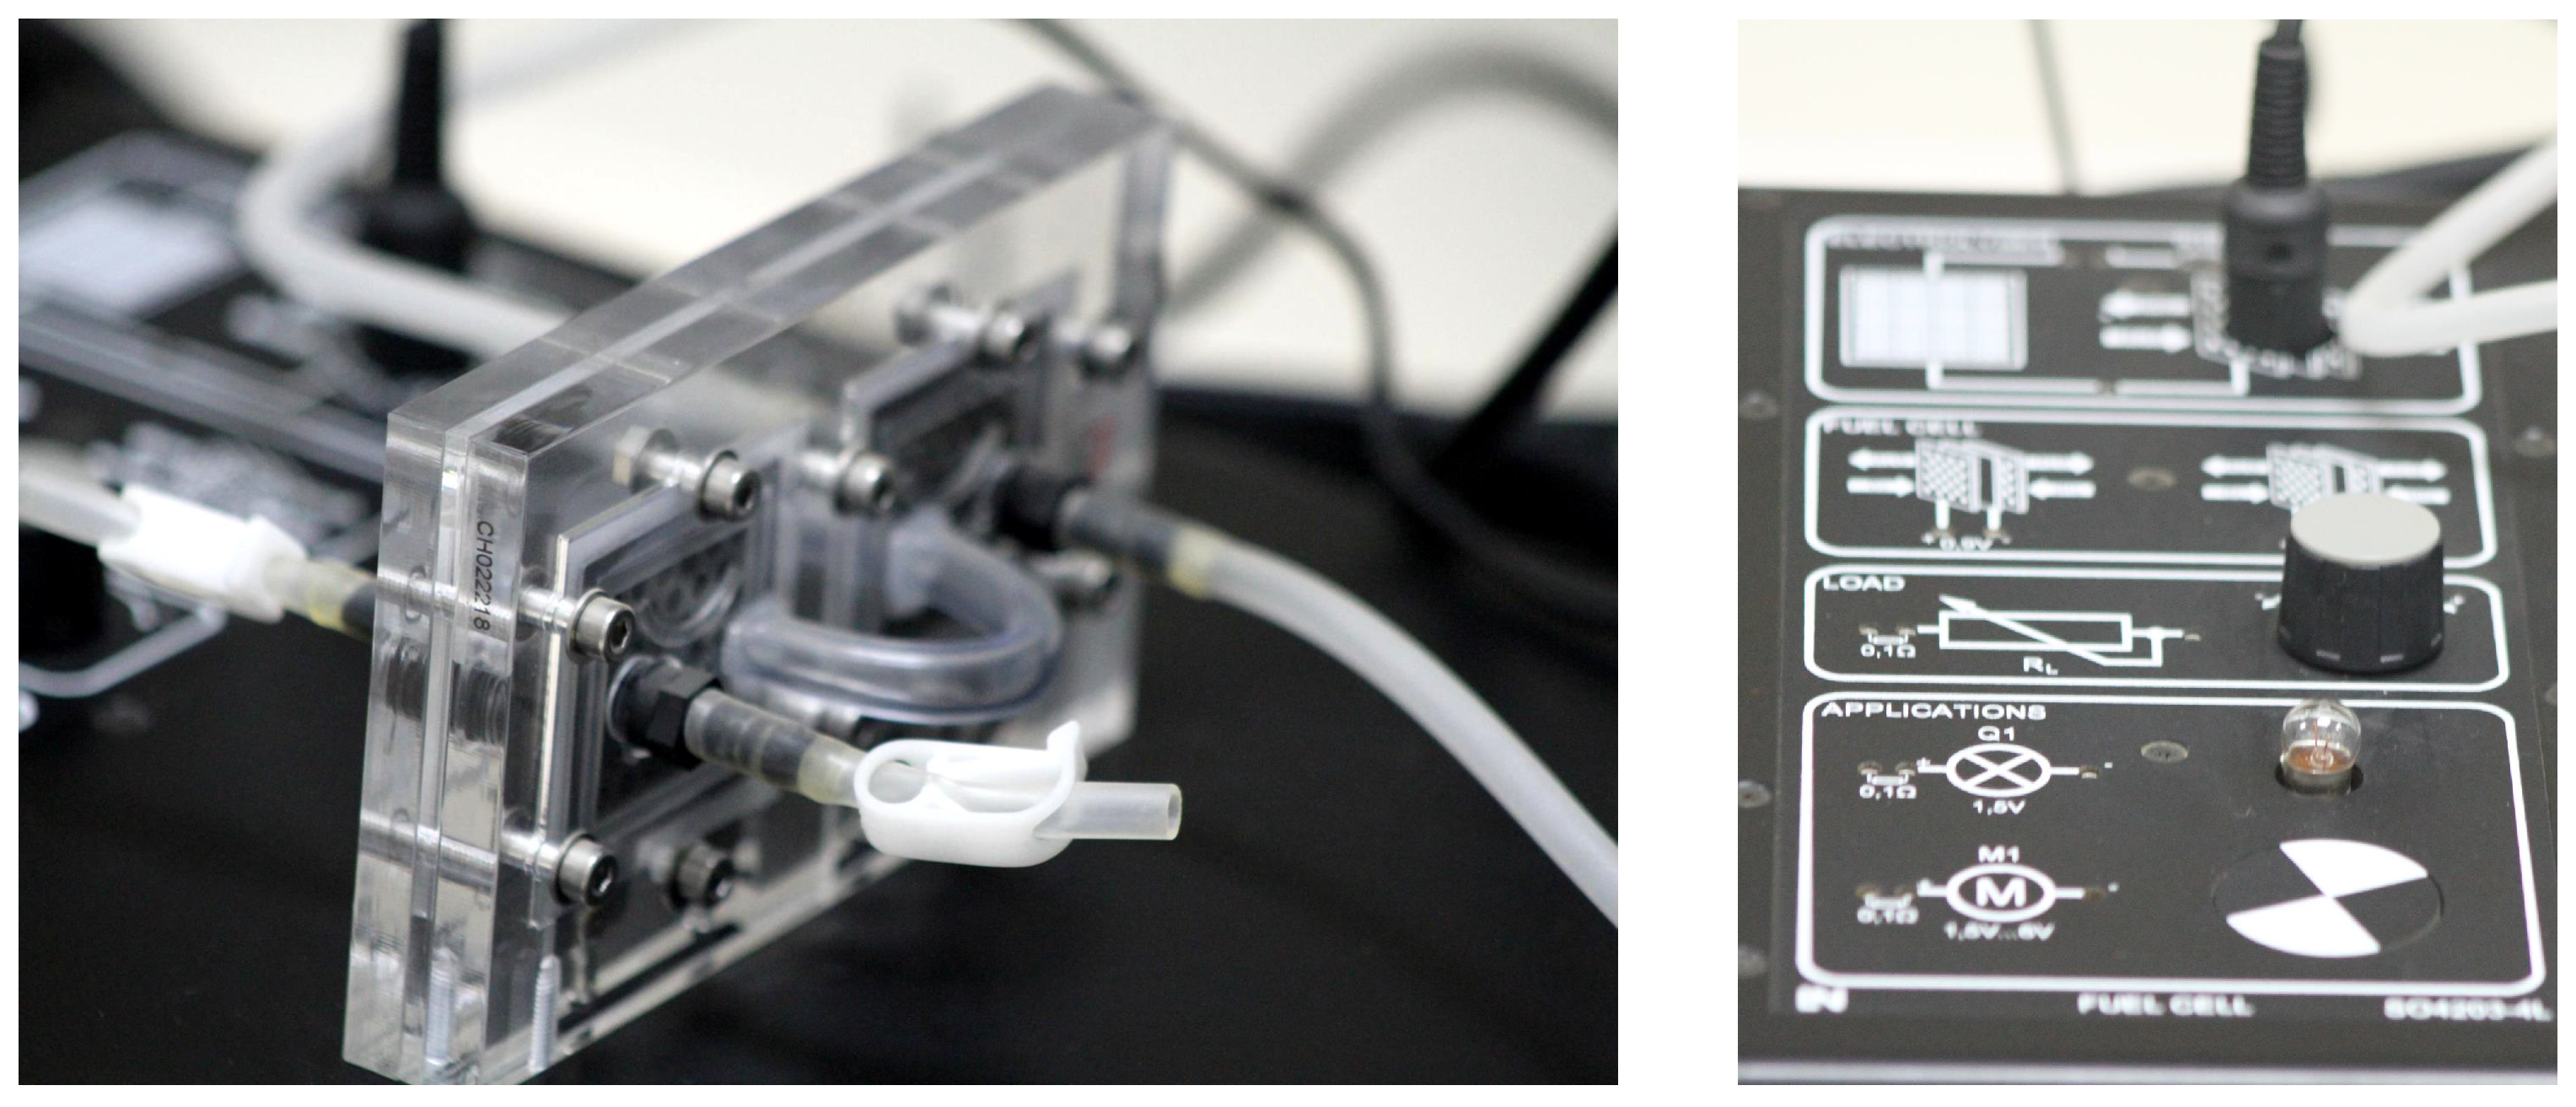
2.3.2. Fuel Cell Stack and Components
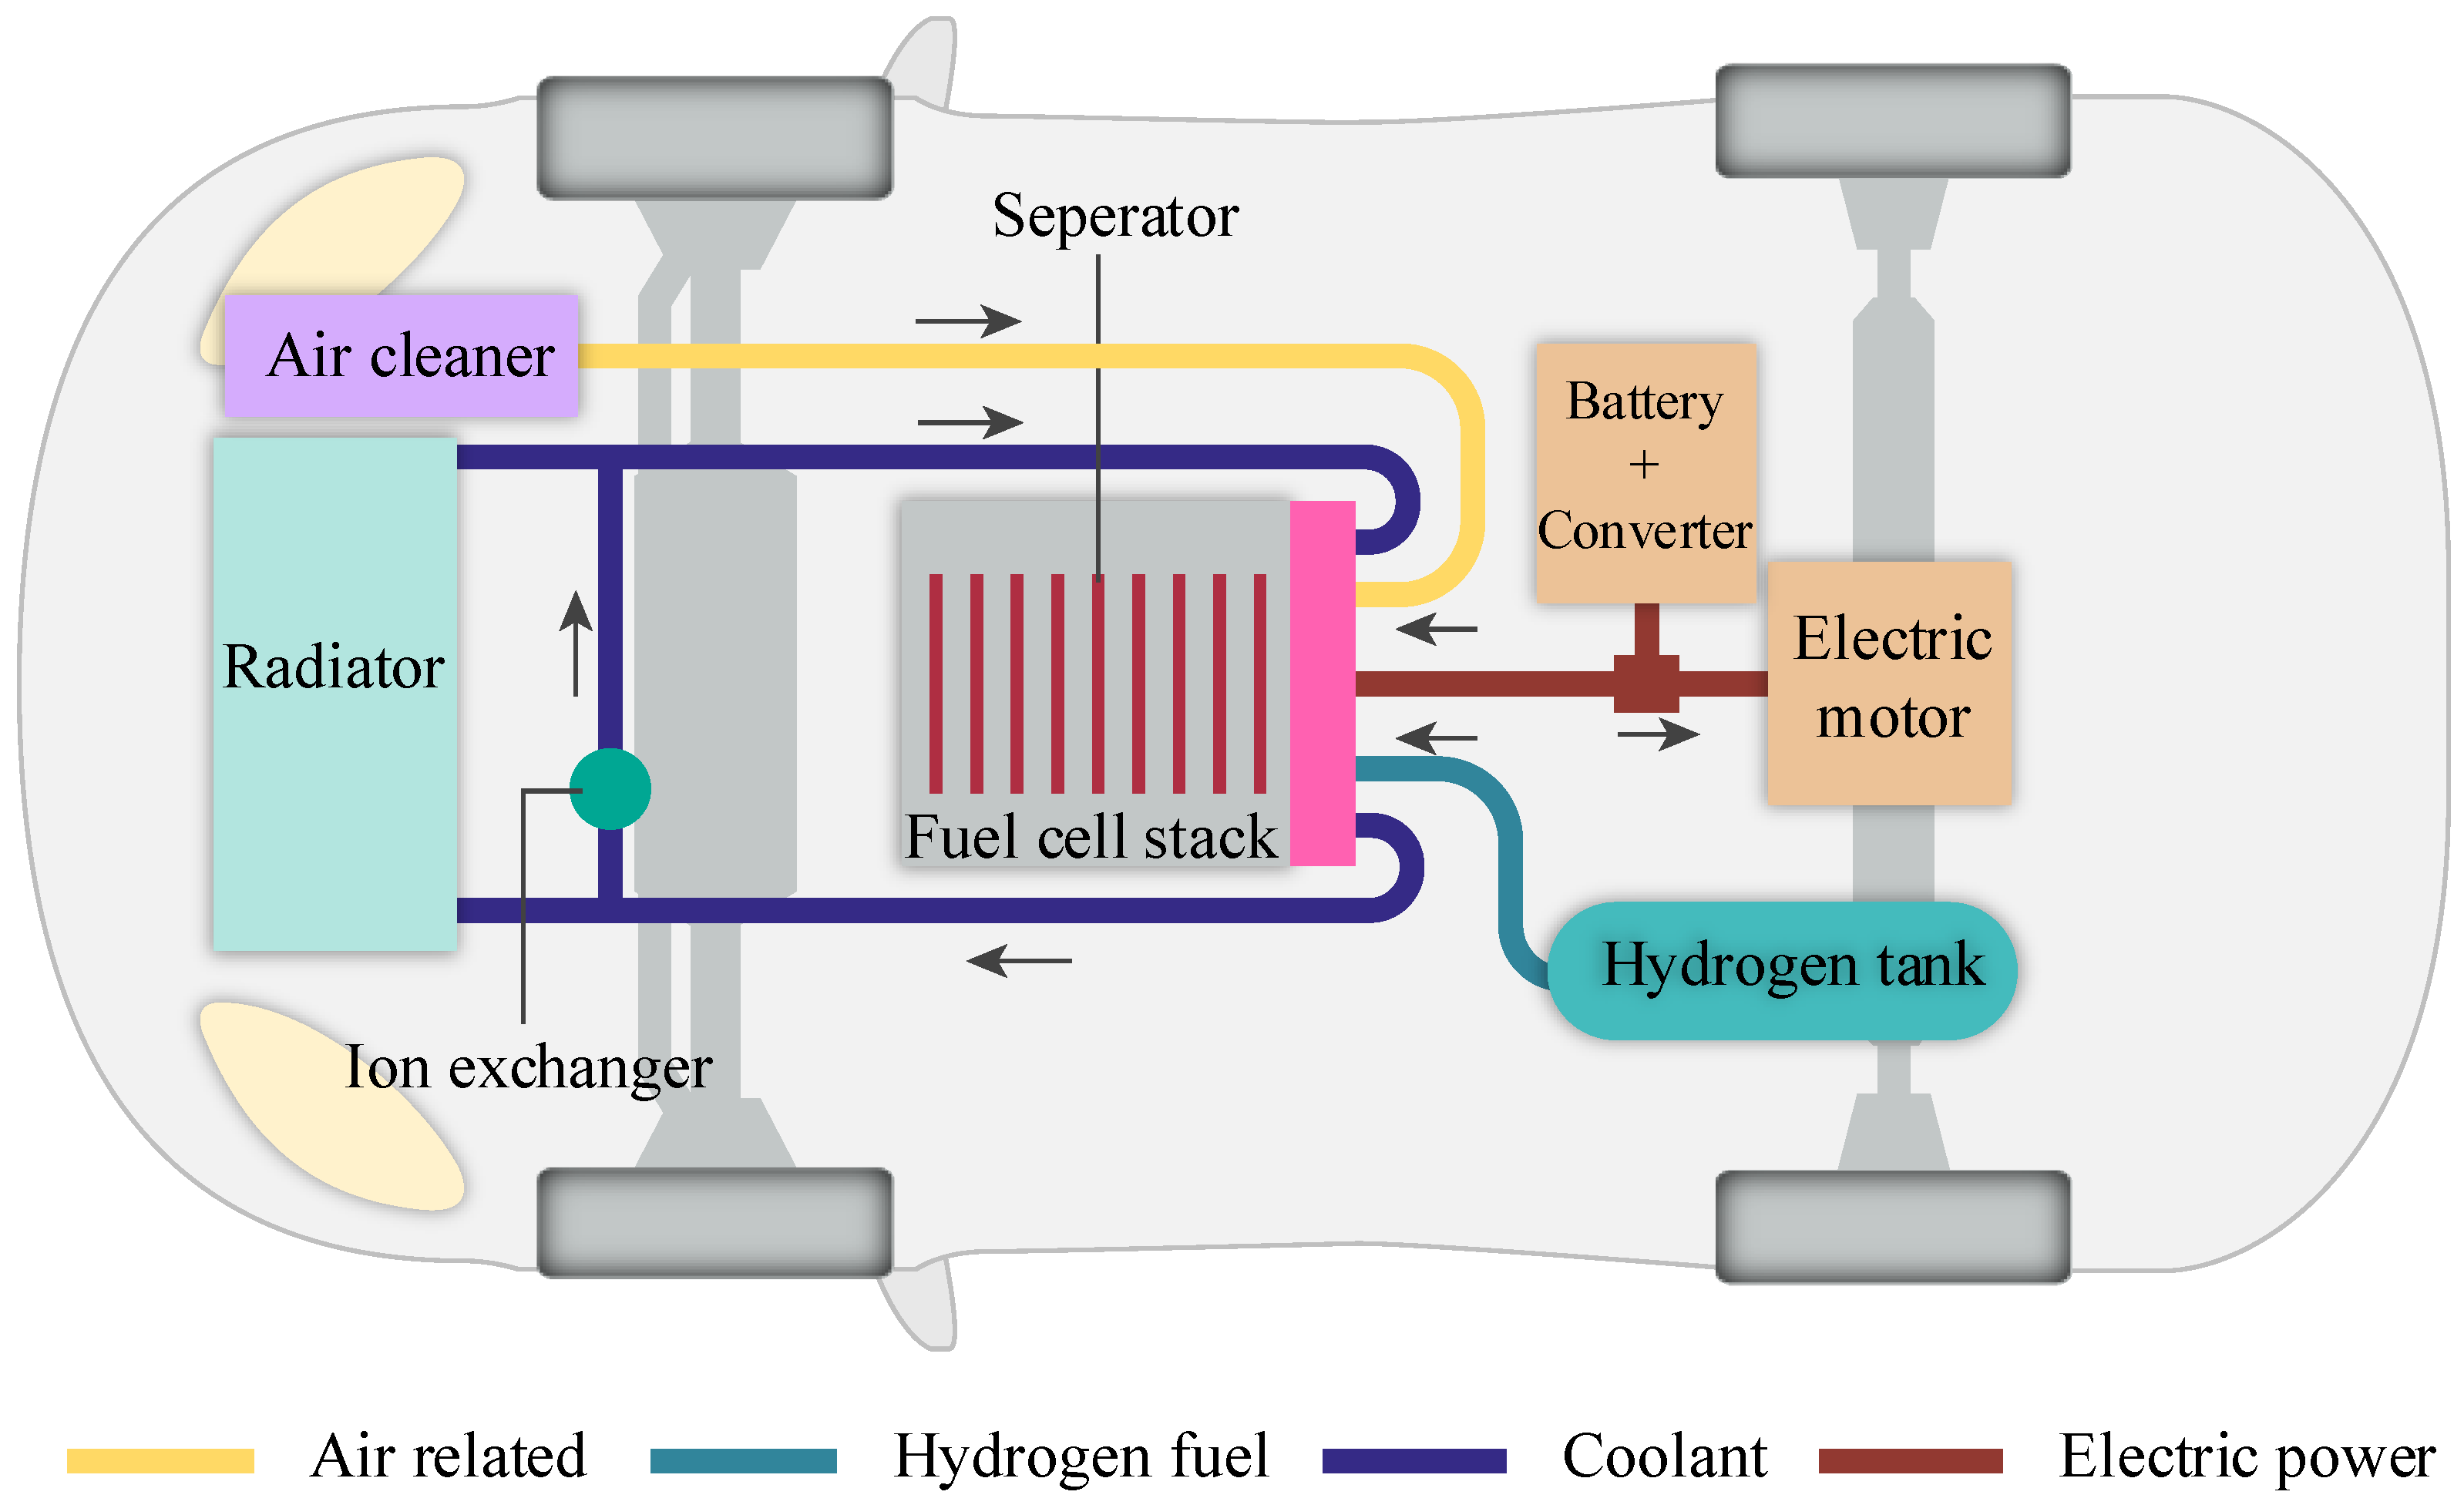
The anode is a negative electrode where the oxidation of fuel occurs. Free electrons produced are transferred from the anode to an external circuit. The anode is provided with fuel channels for the even distribution of fuel on the catalyst surface. The cathode is a positive electrode where reduction takes place. It is supplied with flow channels that help to distribute oxidants over the catalyst surface. At the cathode, electrons are collected from an external circuit that combines oxygen and hydrogen, forming water. The electrolyte helps conduct ions and is also called a proton exchange membrane. It is a permeable membrane that allows ions to pass through it while blocking electrons. Current collectors transfer electrons between two electrodes in the case of one cell, while in the case of a stack, they conduct electrons from one cathode to another cell’s cathode. In most designs, structure integrity is provided by the current collector. Coolants are also provided to current collectors for the dissipation of waste heat.
The one-cell voltage is 0.9 V, which is very small. Various cells are connected in series or parallel to draw a higher power output depending on the application’s requirement for a higher voltage or current. For a series connection, the cathode and anode are connected. In contrast, for a parallel connection, the anode of one cell is connected to the anode of another adjacent cell, and the same goes for cathodes. A conduction plate called a bipolar plate is used between the anode of one cell and the cathode of the next cell. This bipolar plate is made up of graphite, which offers good electrical conductivity and helps supply gas electrodes. However, it is challenging for bipolar plates to achieve good conductivity and gas supply. Therefore, on bipolar plates, a set of grooves is made. A bipolar plate has two surfaces used for the diagonal flow of hydrogen and oxygen [39]. Figure 2 shows the internal component of FC and the stack.

2.4. Material Flow

For continuous current production, fuel cells must be continuously supplied with hydrogen and oxygen. At high currents, reactant must be uniformly and constantly supplied; otherwise, it may cause gas starvation. Flow field plates are provided with fine channels and grooves for efficient reactant delivery that help distribute the reactants uniformly over the FC surface. The performance of flow field channels depends on the size and shape of the channels. Therefore, selecting the proper flow field channel pattern is critical for the better performance of FC [40]. Poor design of flow patterns can result in poor fuel delivery and product removal resulting in flooding of fuel cells and blocking fuel delivery. Fuel blockage and flooding reduce power output and decrease the structure’s lifetime. The blockage occurs because cell polarity could be locally reversed in gas-starved parts, which might lead to corrosion and material degradation [41].

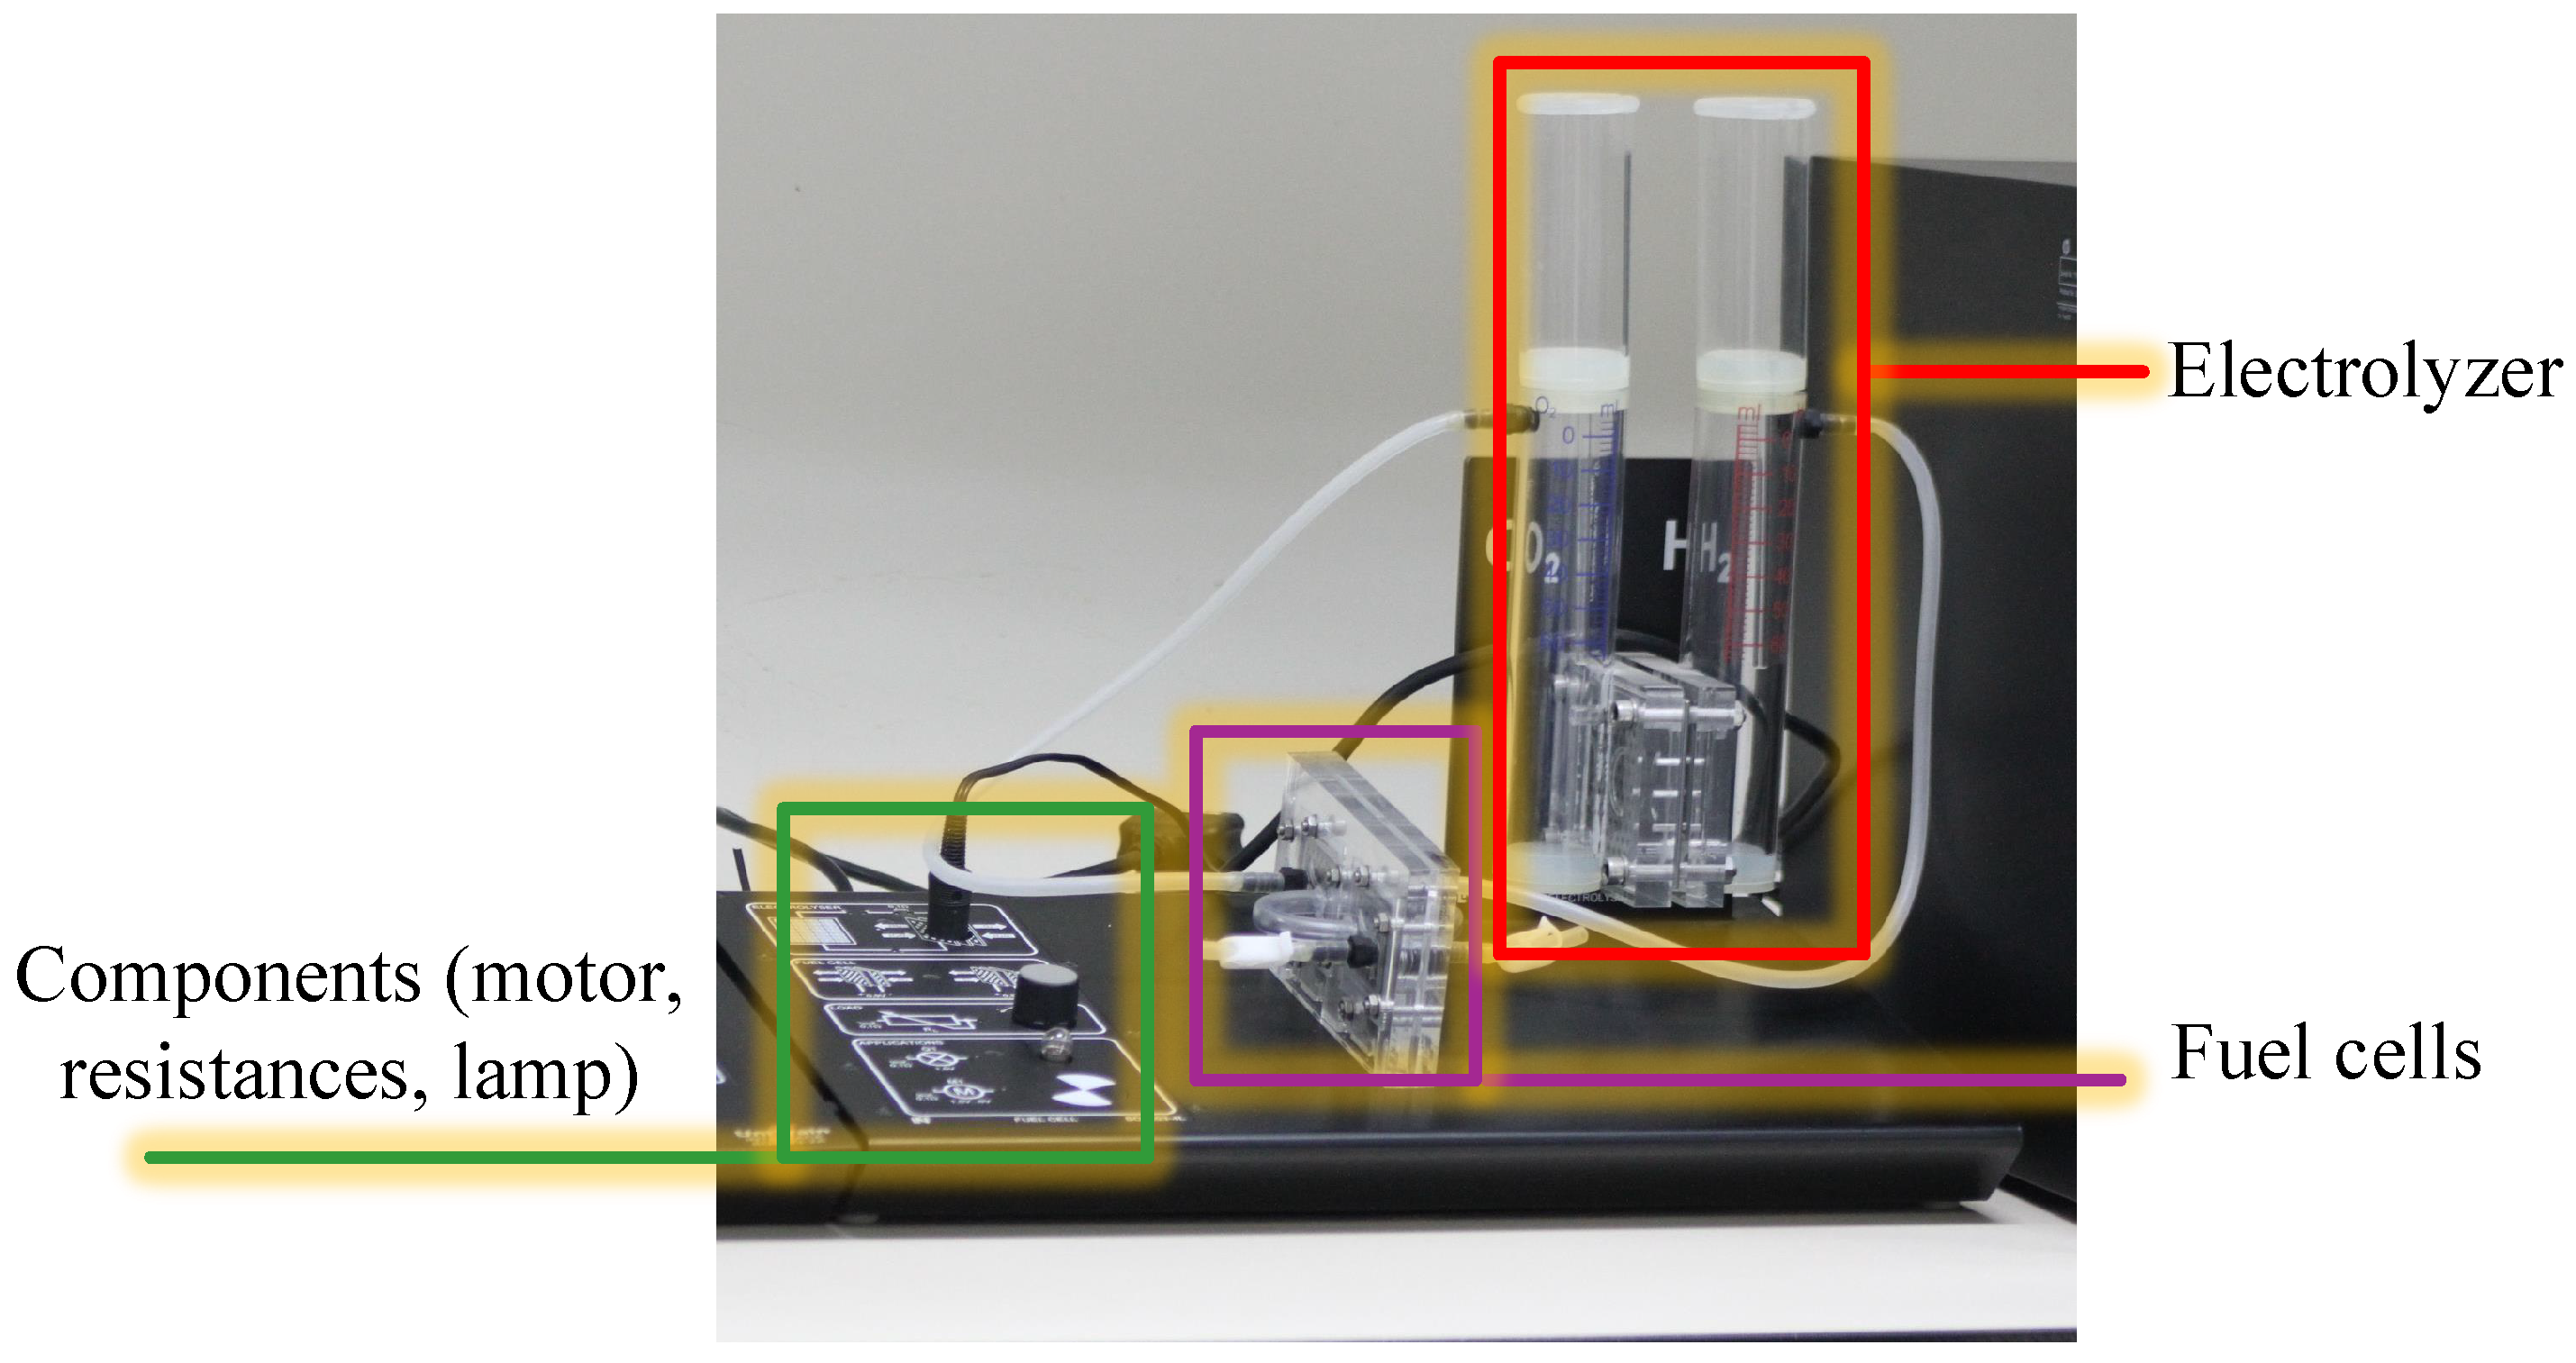
3. The Portable Educational Prototype of Hydrogen Fuel Cell

The prototype of the training equipment consists of an electrolyzer, two fuel cells, a variable resistor, a light bulb, and an electric motor, as shown in Figure 3. The electrolyzer is a device used for the electrolysis of water. It consists of two water tanks filled with different gases during the electrolysis process. The tank marked with H 2 is filled with hydrogen, while the tank marked with O 2 is filled with oxygen [23], as shown in Figure 4. A fuel cell is an electrochemical device that works on the principle of converting chemical energy into electrical energy, similar to a battery, but cannot store electrical energy. This new technology for generating electricity has dramatically reduced carbon dioxide emissions. However, as mentioned earlier, this gas contributes to global warming [42]. Fuel cells can be used in transport applications such as the automotive industry and stationary applications such as power plants [43]. Fuel cells are shown in Figure 3 in the center of the model. The output voltage of each cell is typically around 0.9 V. The fuel cell’s operation principle is explained theoretically in the previous section. Figure 5 on the left shows what fuel cells look like in more detail on the prototype model, and Figure 5 on the right shows the connectors: electrolyzer, fuel cell, variable resistor, lamp, and electric motor. In Figure 5, on the right, you can see a variable resistor. The electrical resistance changes its value with the help of a rotary switch, depending on whether the button turns clockwise or counterclockwise. The lamp and the electric motor are used as nonlinear loads. The lamp has an operating voltage of 1.5 V. The electric motor is DC and operates at a voltage of 1.5 V to 6 V.

The Principle of the Electrolyzer Prototype Board

It is known that all substances consist of atoms, and an atom is a sphere containing a nucleus and electrons moving randomly around the nucleus. The nucleus contains protons and neutrons [44,45]. A proton can be considered an electrically charged particle of a certain mass. The mass of protons is challenging to describe to human consciousness, and it is m p = 1.672622 × 10 27 kg [46]. The neutron, on the other hand, is electrically neutral. The mass of a neutron is approximately equal to the mass of a proton. An electron is a negatively charged particle, and its mass does not play a significant role in an atom because it is very small compared to a proton and a neutron, and the mass of an electron is m e = 9.109383 × 10 31 kg, which shows that the mass of an electron is more than 1000 times smaller than protons or neutrons [47]. Each atom contains an equal number of protons and electrons, which means that the atom is electrically neutral [6]. In order for the fuel cell to work, it needs a certain amount of hydrogen (H). Hydrogen is the simplest chemical element that is the first element in the periodic table. One of the ways to obtain hydrogen is electrolysis. Electrolysis of water is splitting a water molecule into hydrogen and oxygen atoms [23] utilizing an electrolyzer.
An electrolyzer is a device that consists of two tanks, an anode and a cathode, and a chamber in which the electrolysis of water (H 2 O) takes place. Distilled water is poured into the water tanks, and the electrolyzer is turned ON, which uses electricity from the external source for its operation. When the electrolyzer is switched on, the circuit is closed. The current flows through the water and the electrodes together underwater in the reaction chamber. The reaction chamber is bounded by an anode and a cathode, which is visually enlarged in Figure 6 to help explain how the process works, and the light blue field in the figure represents distilled water. The direct current source is connected to the electrodes, and because of it, electrons move from the negative pole of the direct source (cathode) through the water to the positive pole of the direct source (anode). This process also creates an excess of electrons that the water receives, producing negatively charged hydroxide ions and hydrogen [23]. Figure 7 shows the working principle of the electrolyzer.
Hydrogen is gaseous and goes up into the hydrogen tank Figure 7a. The hydrogen oxide ions are negatively charged (each ion that previously received one electron at the cathode) and move through the water toward the anode. Naturally, these processes do not happen one by one, but several of them at once. Figure 7b shows how the four hydroxides are moved to the anode, which is positively charged and attracts them. Each hydroxide ion divides previously collected electrons and gives them to the positive pole of the source, and these ions react with two molecules of H 2 O. Then the form of O 2 (two oxygen atoms) is combined, which further travels in gaseous form to the hydrogen tank, parallel to the chemical reactions described earlier. Figure 7c shows how a chemical reaction occurs at the anode, which begins with six water molecules that release four electrons at the positive pole of the current source. Water now reacts with four hydronium molecules (H 3 O + − ions). Furthermore, according to Figure 7d, positively charged ions of hydronium molecules receive one electron at the cathode. This is accompanied by a reaction in which each ion releases a hydrogen atom, and ordinary water is formed again [45].

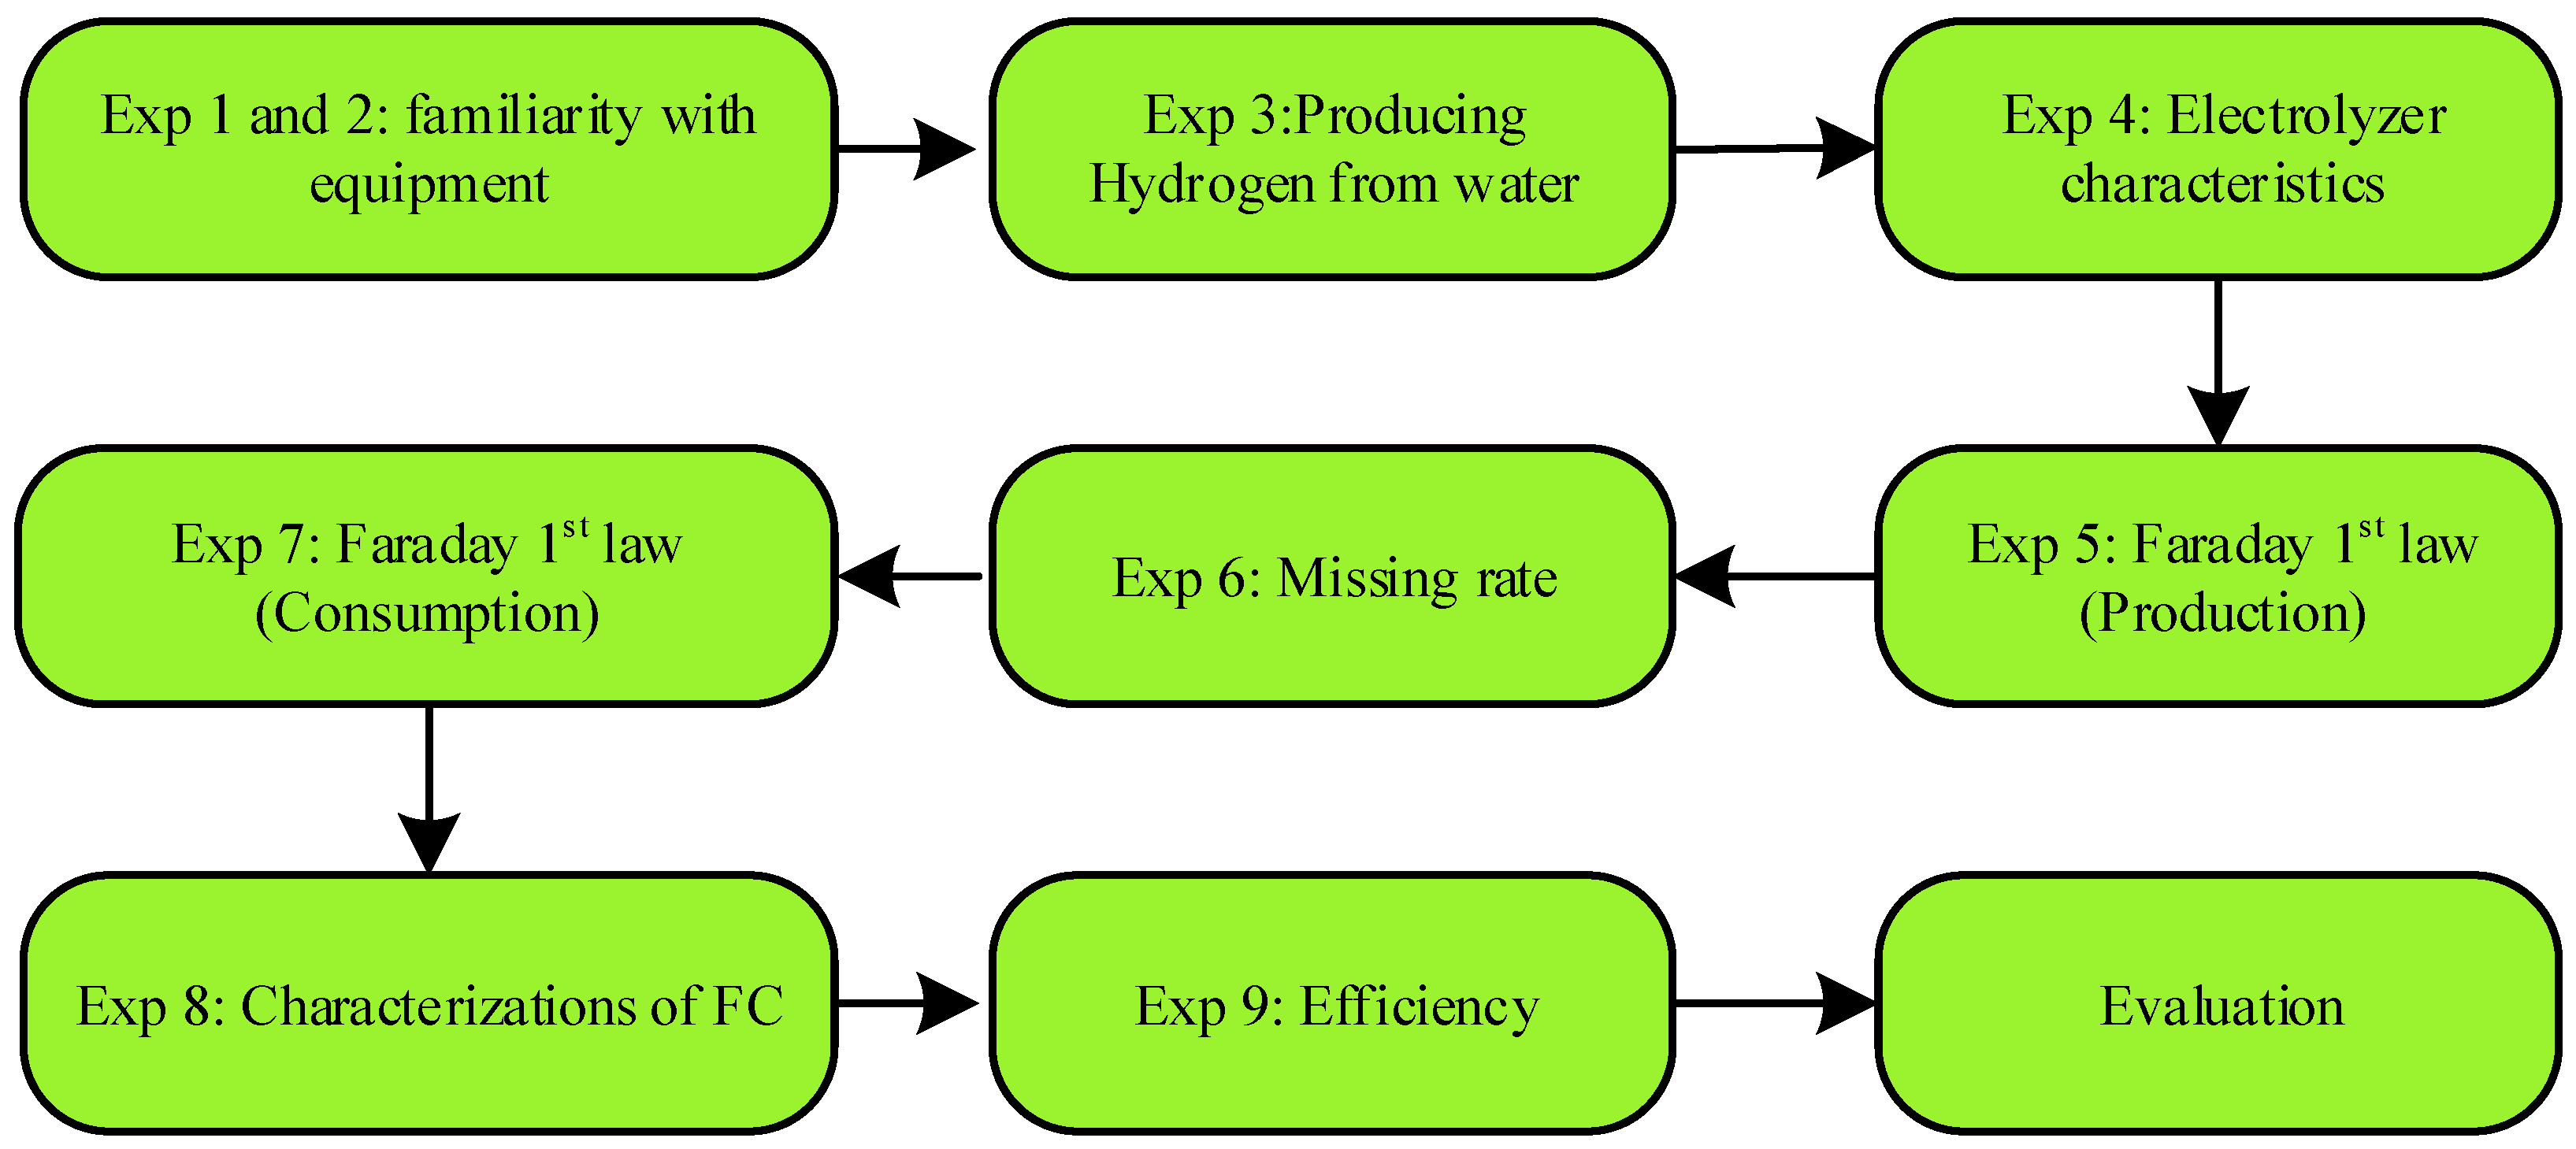
4. Experimental Setup

Along with the model, a software part was also prepared: the interface to the portable educational prototype., where experiments can be performed with the education prototype are proposed. The list of experiments is shown in Figure 8.

4.1. First and Second Experiment: Familiarity with the Equipment

The first and second experiments introduce learners to the prototype. These two experiments illustrate the connection between the electrolyzer, fuel cells, and the motor as a load. First, the electrolyzer is turned on, producing oxygen and hydrogen, which are brought to the fuel cells through pipes in a gaseous state. Then, in the cells, the chemical energy of the gases is converted into electricity, which drives the connected engine. In the second part, voltage, current, and power are measured, and the V-I characteristic of series-connected fuel cells is recorded.
The voltmeter measurements show the result of the second part, in which the voltage of the motor connected to the series connection of the fuel cells is measured. The result is V = 1.65 V. It is written on the model that one cell gives a voltage of 0.9 V. The measurements show a voltage drop of 0.15 V on the measuring instruments. The current measurement indicates that I = 0.012 A. The active power of the consumer is determined by using a wattmeter, which indicates that P = 0.02 W. This reading can also be checked using the power equation P = V × I = 1.65 × 0.012 = 0.0198 W, which is close to the one indicated by the wattmeter.

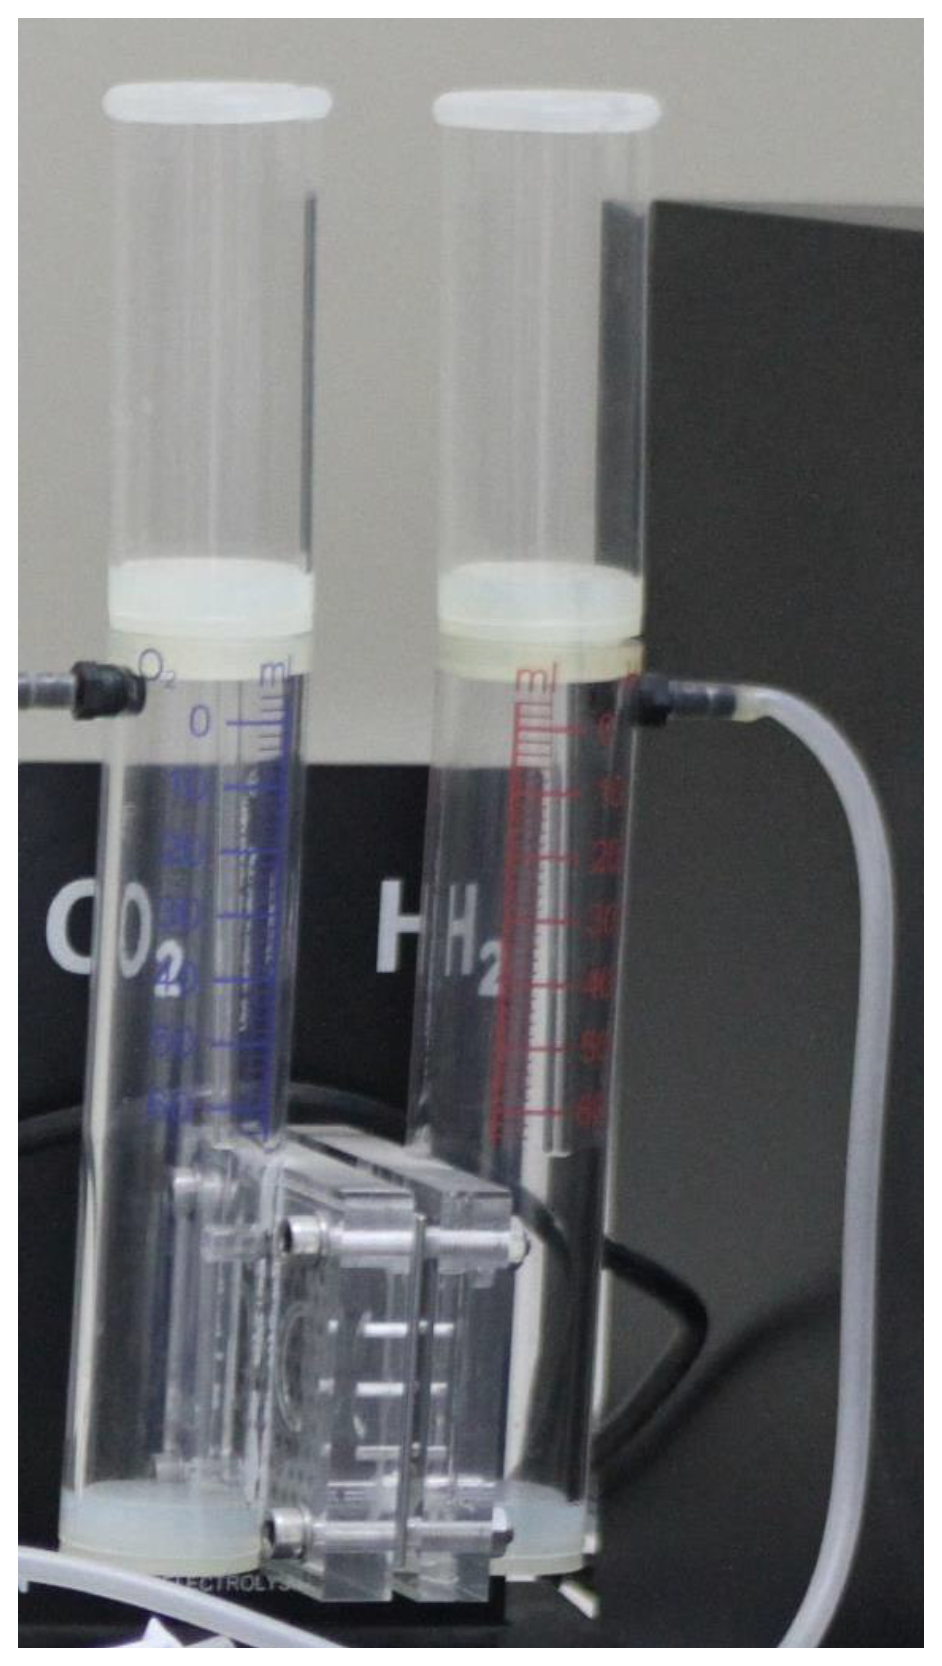
4.2. Third Experiment: Water = H 2 O

The experiment aims to conduct electrolysis of water and pay attention to the amount of oxygen and hydrogen produced. From the already-known chemical notation (H 2 O), it can be noticed that water contains two atoms of hydrogen and one of oxygen, which means that the hydrogen produced is twice the oxygen produced. Figure 9 shows the hydrogen and oxygen containers after the experiment. It is also demonstrated that the experiment produced 60 mL of hydrogen and 30 mL of oxygen, proving the composition of H 2 O, two hydrogen atoms, and one oxygen atom.

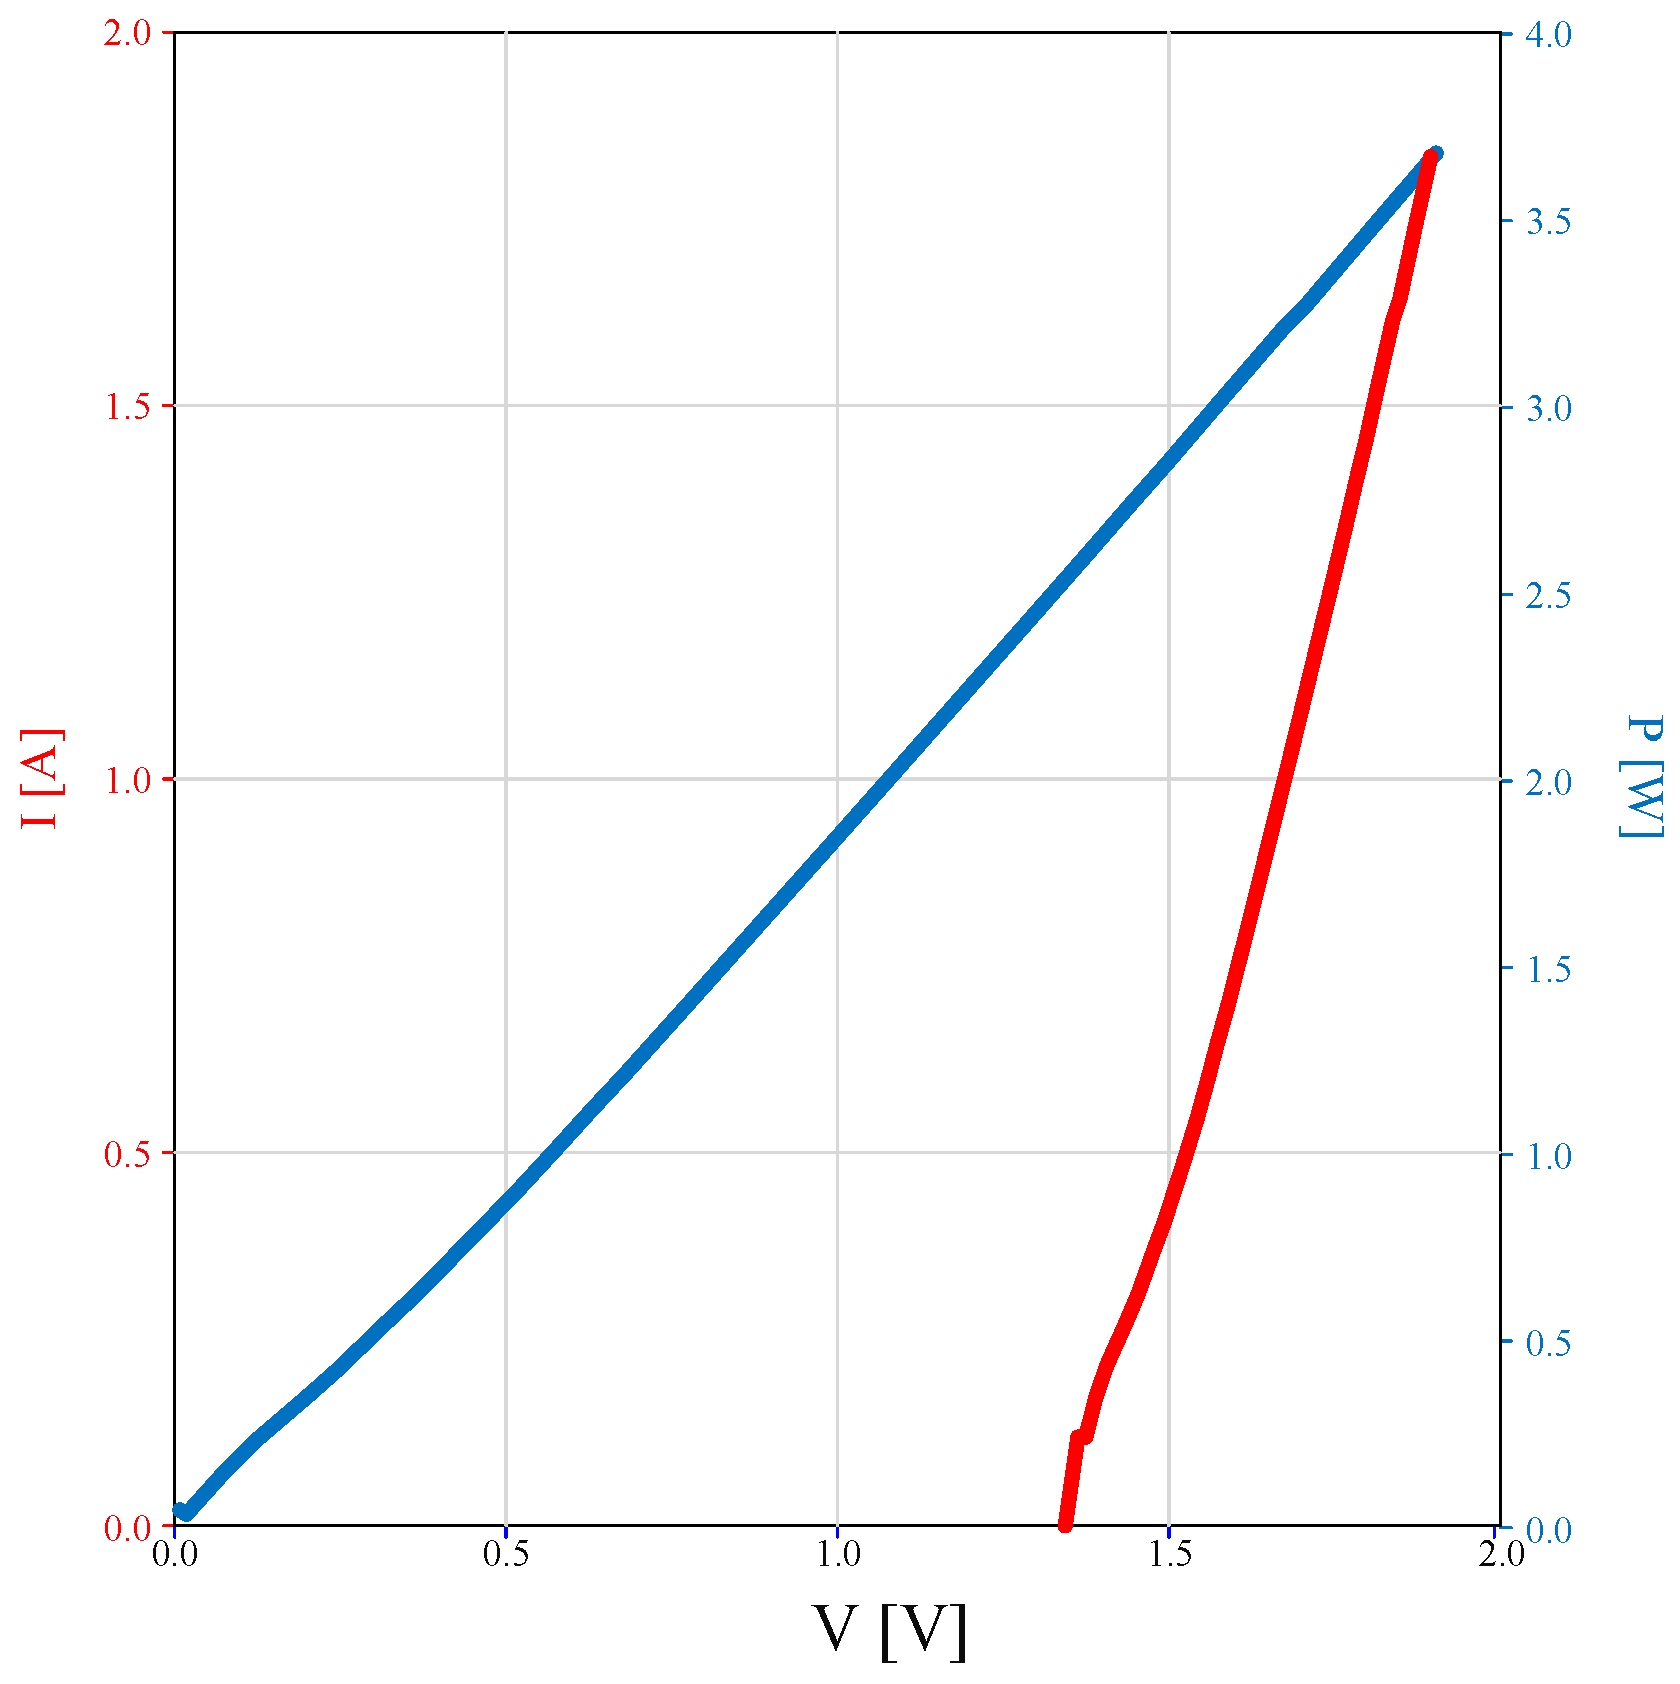
4.3. Fourth Experiment: Electrolyzer Characteristics

In this experiment, the characteristics of the electrolyzer are investigated. The investigation is completed by connecting the electrolyzer to an external power source. Then gradually increasing the electrolysis current. The characteristic is recorded using an interface program. Figure 10 shows that no current flows through the electrolyzer until a voltage of 1.4 V is reached. That means that until the threshold voltage of 1.4 V is reached, the electrolyzer will not start the electrolysis process. This alone will not provide fuel for the fuel cell, and it can also be seen that the maximum power of the electrolyzer is approximately 3.8 W (Figure 10).

4.4. Fifth Experiment: Faraday’s First Law: Production of H 2

In this experiment, it was proposed to examine the production of H 2 in dependence on time and the current flowing through the electrolyzer. In the first part of the experiment, the value of the current does not change, but only the production of H 2 is read at certain time intervals. According to the results, Table 2 was obtained and showed the production of H 2 as a function of time. According to Table 3 it can be seen that the production of H 2 is proportional to the positive value of the electric current.

4.5. Sixth Experiment: Missing Rate

As mentioned previously, the hydrogen atom is tiny and difficult to store [48]. In this experiment, hydrogen leakage in the tank is investigated. Figure 11 shows the tank H 2 after the investigation. After filling the hydrogen tank to 50 mL, let everything stand for 5 min. The level has dropped by 4 mL, meaning the leakage rate is 0.8 mL/min. This experiment illustrates that high-quality equipment is needed to store the hydrogen. Therefore, instructors must be careful with hydrogen leakage. Due to its propensity for easy diffusion, hydrogen is less likely to pose a fire or explosion threat in open or well-ventilated spaces. However, hydrogen poses a safety hazard if it accumulates in an enclosed or unventilated location. Therefore, ensuring a well-ventilated room is an essential step to performing these experiments safely [49,50].

4.6. Seventh Experiment: Faraday’s First Law (Consumption)

Before describing the fuel cell consumption experiment, learners should be familiar with its operation principle and components (Figure 12). Figure 12, fuel cell stack, shows that the cell consists of five parts. On the far left and right are the bipolar plate, then two electrodes, the anode and the cathode, and in the middle, there is a membrane. From the left is the entry of hydrogen (H 2 ), while oxygen (O 2 ) comes from the right. When the hydrogen molecules pass to the anode, their bond is broken because the electrons start moving through it. Now the hydrogen molecules become positively charged ions. On the other hand, oxygen arrives at the cathode and waits for the electrons that have left the hydrogen. The directed movement of electrons from the anode to the cathode represents an electric current. When electrons reach oxygen, their atoms absorb electrons, becoming negatively charged ions. Therefore, hydrogen ions can pass through the membrane and combine with oxygen ions to form water (H 2 O). The ions cancel each other out because the electrons lost by the hydrogen get to the oxygen, and when these ions come into contact, they cancel each other out. It follows from this that the main product is electricity. Electricity and the byproducts are ordinary water and heat [51]. The experiment aims to measure hydrogen consumption dependent on time and electrolysis current. The hydrogen tank is filled to 60 mL in the first part. Furthermore, switch off the electrolyzer and set the resistance so that a current of 600 mA flows through the circuit. Then the results are recorded, and Table 4 is obtained. The results show that the consumption increases with time, as does the gas that is leaked.
In the experiment’s second part, the tank was filled with 60 mL of hydrogen after the electrolyzer was turned off. Then, the current passing through the resistor was measured with an ammeter. The resistance is set so that the current is of a certain amount, according to the table. Each measurement lasted 2 min, and the results are recorded in Table 5.
Table 5 shows that consumption is proportional to the amount of current. However, the gas leaked is always the same because it depends on time, and from the previous experiment, a gas loss constant of 0.8 mL/min was determined, which must be taken into account.

4.7. Experiment 8: Characterization of Fuel Cells

This experiment consists of three parts, V-I characteristics curve of fuel cells is examined for a single fuel cell and also different connections, which can be either serial or parallel. This portable prototype contains two fuel cells on which experiments are carried out. The first part investigates the characteristics of a single fuel cell. The tank is filled with hydrogen, and the variable resistor is set to the highest resistance. The characteristic of the fuel cell is then recorded, and the resistance is gradually reduced during the recording. The connection diagram is shown in Figure 13, which also the V-I characteristic curve of a single fuel cell. The Figure also shows that the maximum voltage of one fuel cell is approximately equal to V m a x = 0.9 V and decreases almost linearly with increasing resistance. From the characteristics curve, the maximum power is about P m a x = 0.45 W. In the second part of the experiment, the cells are connected in parallel, and the measurement procedure is repeated. First, the tank is filled with 60 mL of hydrogen, then the variable resistor is set to the highest possible value, and then the characteristic is recorded. During recording, the resistance of the variable resistor decreases. The connection diagram is shown in Figure 14, which also shows the obtained characteristic curve. This characteristic (Figure 14) shows that the maximum voltage is approximately equal to V m a x = 0.9 V. The maximum current is significantly higher than the previous characteristics curve. A parallel connection is used in applications where the voltage should remain approximately the same as the load current increases. In this case, the load is a variable resistor. In the third part, the characteristic of serially connected fuel cells is recorded according to the scheme of Figure 15. The hydrogen tank is filled as in the previous part, and the same process of recording the characteristics of the fuel cell is performed. It is assumed that the voltage must be doubled because two DC sources are connected in series, which means that now the maximum voltage should be V m a x = 0.9 + 0.9 = 1.8 V. Figure 15 shows that the maximum voltage is approximately equal to V m a x = 1.8 V. It can be seen from the characteristic that this series connection is used in applications where the power stays relatively high with increasing load. The maximum power is approximately P m a x = 0.58 W, while the maximum current is approximately I m a x = 1.2 A.

4.8. Efficiency of the Fuel Cell

Each technical energy system has input and output power, and the ratio of these two quantities gives energy efficiency. Energy appears in various forms, such as chemical, electrical, thermal, etc. Efficiency is important because it is an indicator of the utilization of energy sources and is always less than 100% [23]. The formula for the fuel cell efficiency is obtained by first using the formula for the electrical work obtained at the output of the fuel cell [23].
W e l e c t r i c a l = V . I . t
where W electrical is the electrical work, V is the voltage, I represents the current, and t is the time in seconds. Chemical energy is calculated from the calorific value of the input material, and the consumed volume of hydrogen, and chemical energy also represents the input energy [46].
W c h e m i c a l = H H 2 · V o l
where W c h e m i c a l is the chemical work, Vol is the volume, and H H 2 is the hydrogen calorific value. The hydrogen has a fixed calorific value, which is 11 , 920 kJ per cubic meter. The efficiency of fuel cells is given by:
η = W e l e c t r i c a l W c h e m i c a l = V · I · t H H 2 · V o l

4.9. Evaluation of the Characterization Results

The experiment connects the electrolyzer to an external voltage and changes the electrolysis current. The hydrogen level is set to 0 mL, then turn on the electrolyzer, and the hydrogen level in the tank is visible after three minutes. The electrolysis current was set to 1.2 A. The results of the evaluation of the experimental measurements. The leak rate increases the mean production value from the previous experiment, and the leak rate is 0.8 mL/min, which means that 2.4 mL of hydrogen leaked out in three minutes. According to the Equation (4), the energy efficiency of the electrolyzer is obtained:
η e l e c t r i c a l = W c h e m i c a l W e l e c t r i c a l = H H 2 · V o l V · I · t = 11920 · ( 24.33 + 2.4 ) · 10 3 1.7 · 1.2 · 180 = 0.8677
The results show the efficiency of the electrolyzer at currents of 1.2 A, which is equal to 0.8677 or 86.77%. Other measurements are made in the same way. Only the electrolysis current is changed.

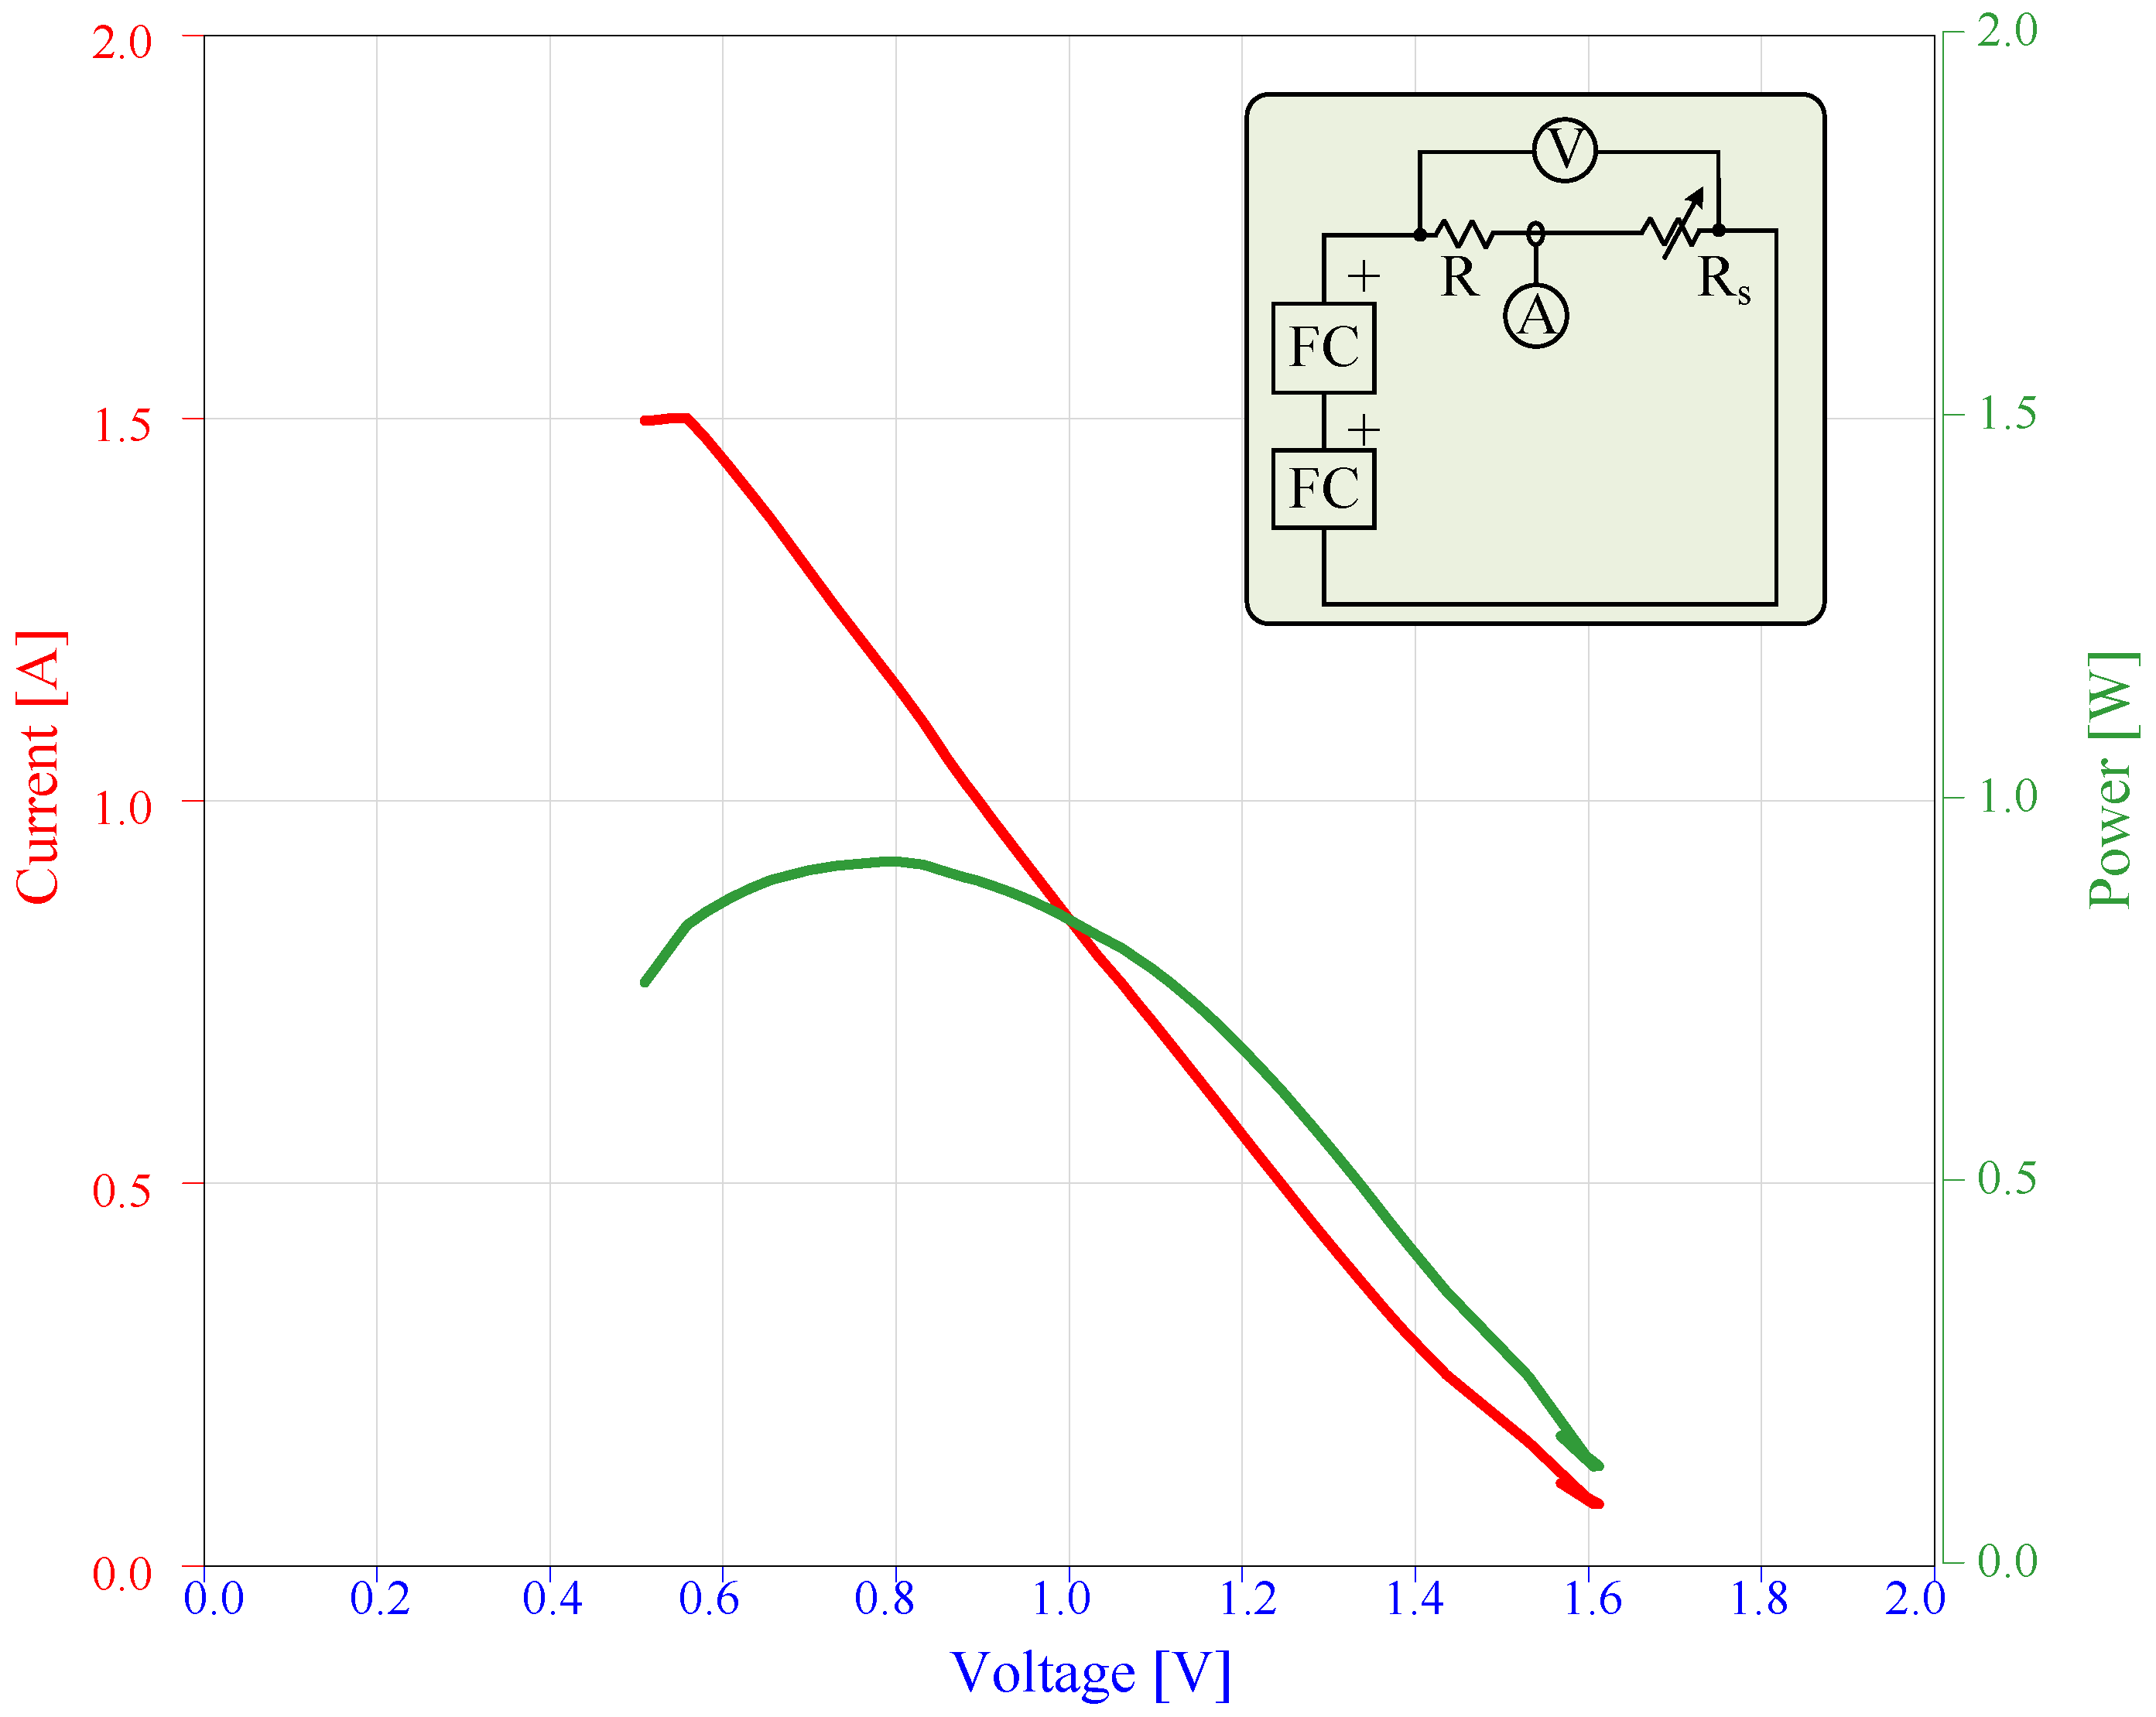
4.9.1. Serially-Connected FC

The mean consumption value is reduced by the leakage rate from the previous experiment, and the leakage rate is 0.8 mL/min, which means that 2.4 mL of hydrogen leaked out in three minutes. Therefore, according to the Equation (5), the energy efficiency of the fuel cell can be calculated:
η f c = W e l W c h = V · I · t + I 2 · R H H 2 · V o l = 0.29 · 1 · 180 + 1 2 · 0.1 11920 · ( 45.33 2.4 ) · 10 3 = 0.102
The equation shows that the energy efficiency of the cells on the model is 0.102 or 10.2%. Other measurements are made the same way. Only the current of the series-connected fuel cells is changed using a variable resistor. Energy efficiency is calculated according to the Equation (5). The working power of the fuel cell is calculated according to the equation.
P f c = I · V [ W ]
where P f c is the delivered power of the fuel cell, I and V are the operating current and voltage, respectively. It can be concluded that mathematically speaking, the efficiency is most significant at lower currents. However, that area could be more interesting for practical applications since the goal is to achieve the highest possible power during operation and, therefore, a higher current load. Thus, the system’s maximum efficiency is calculated according to the Equation (7) by taking the maximum value of the efficiency of the fuel cell and multiplying it by the maximum value of the efficiency of the electrolyzer.
η t = η f c · η e l = 0.5166 · 0.9396 = 0.4854
The maximum efficiency of the series-connected fuel cell system is 48.54%.

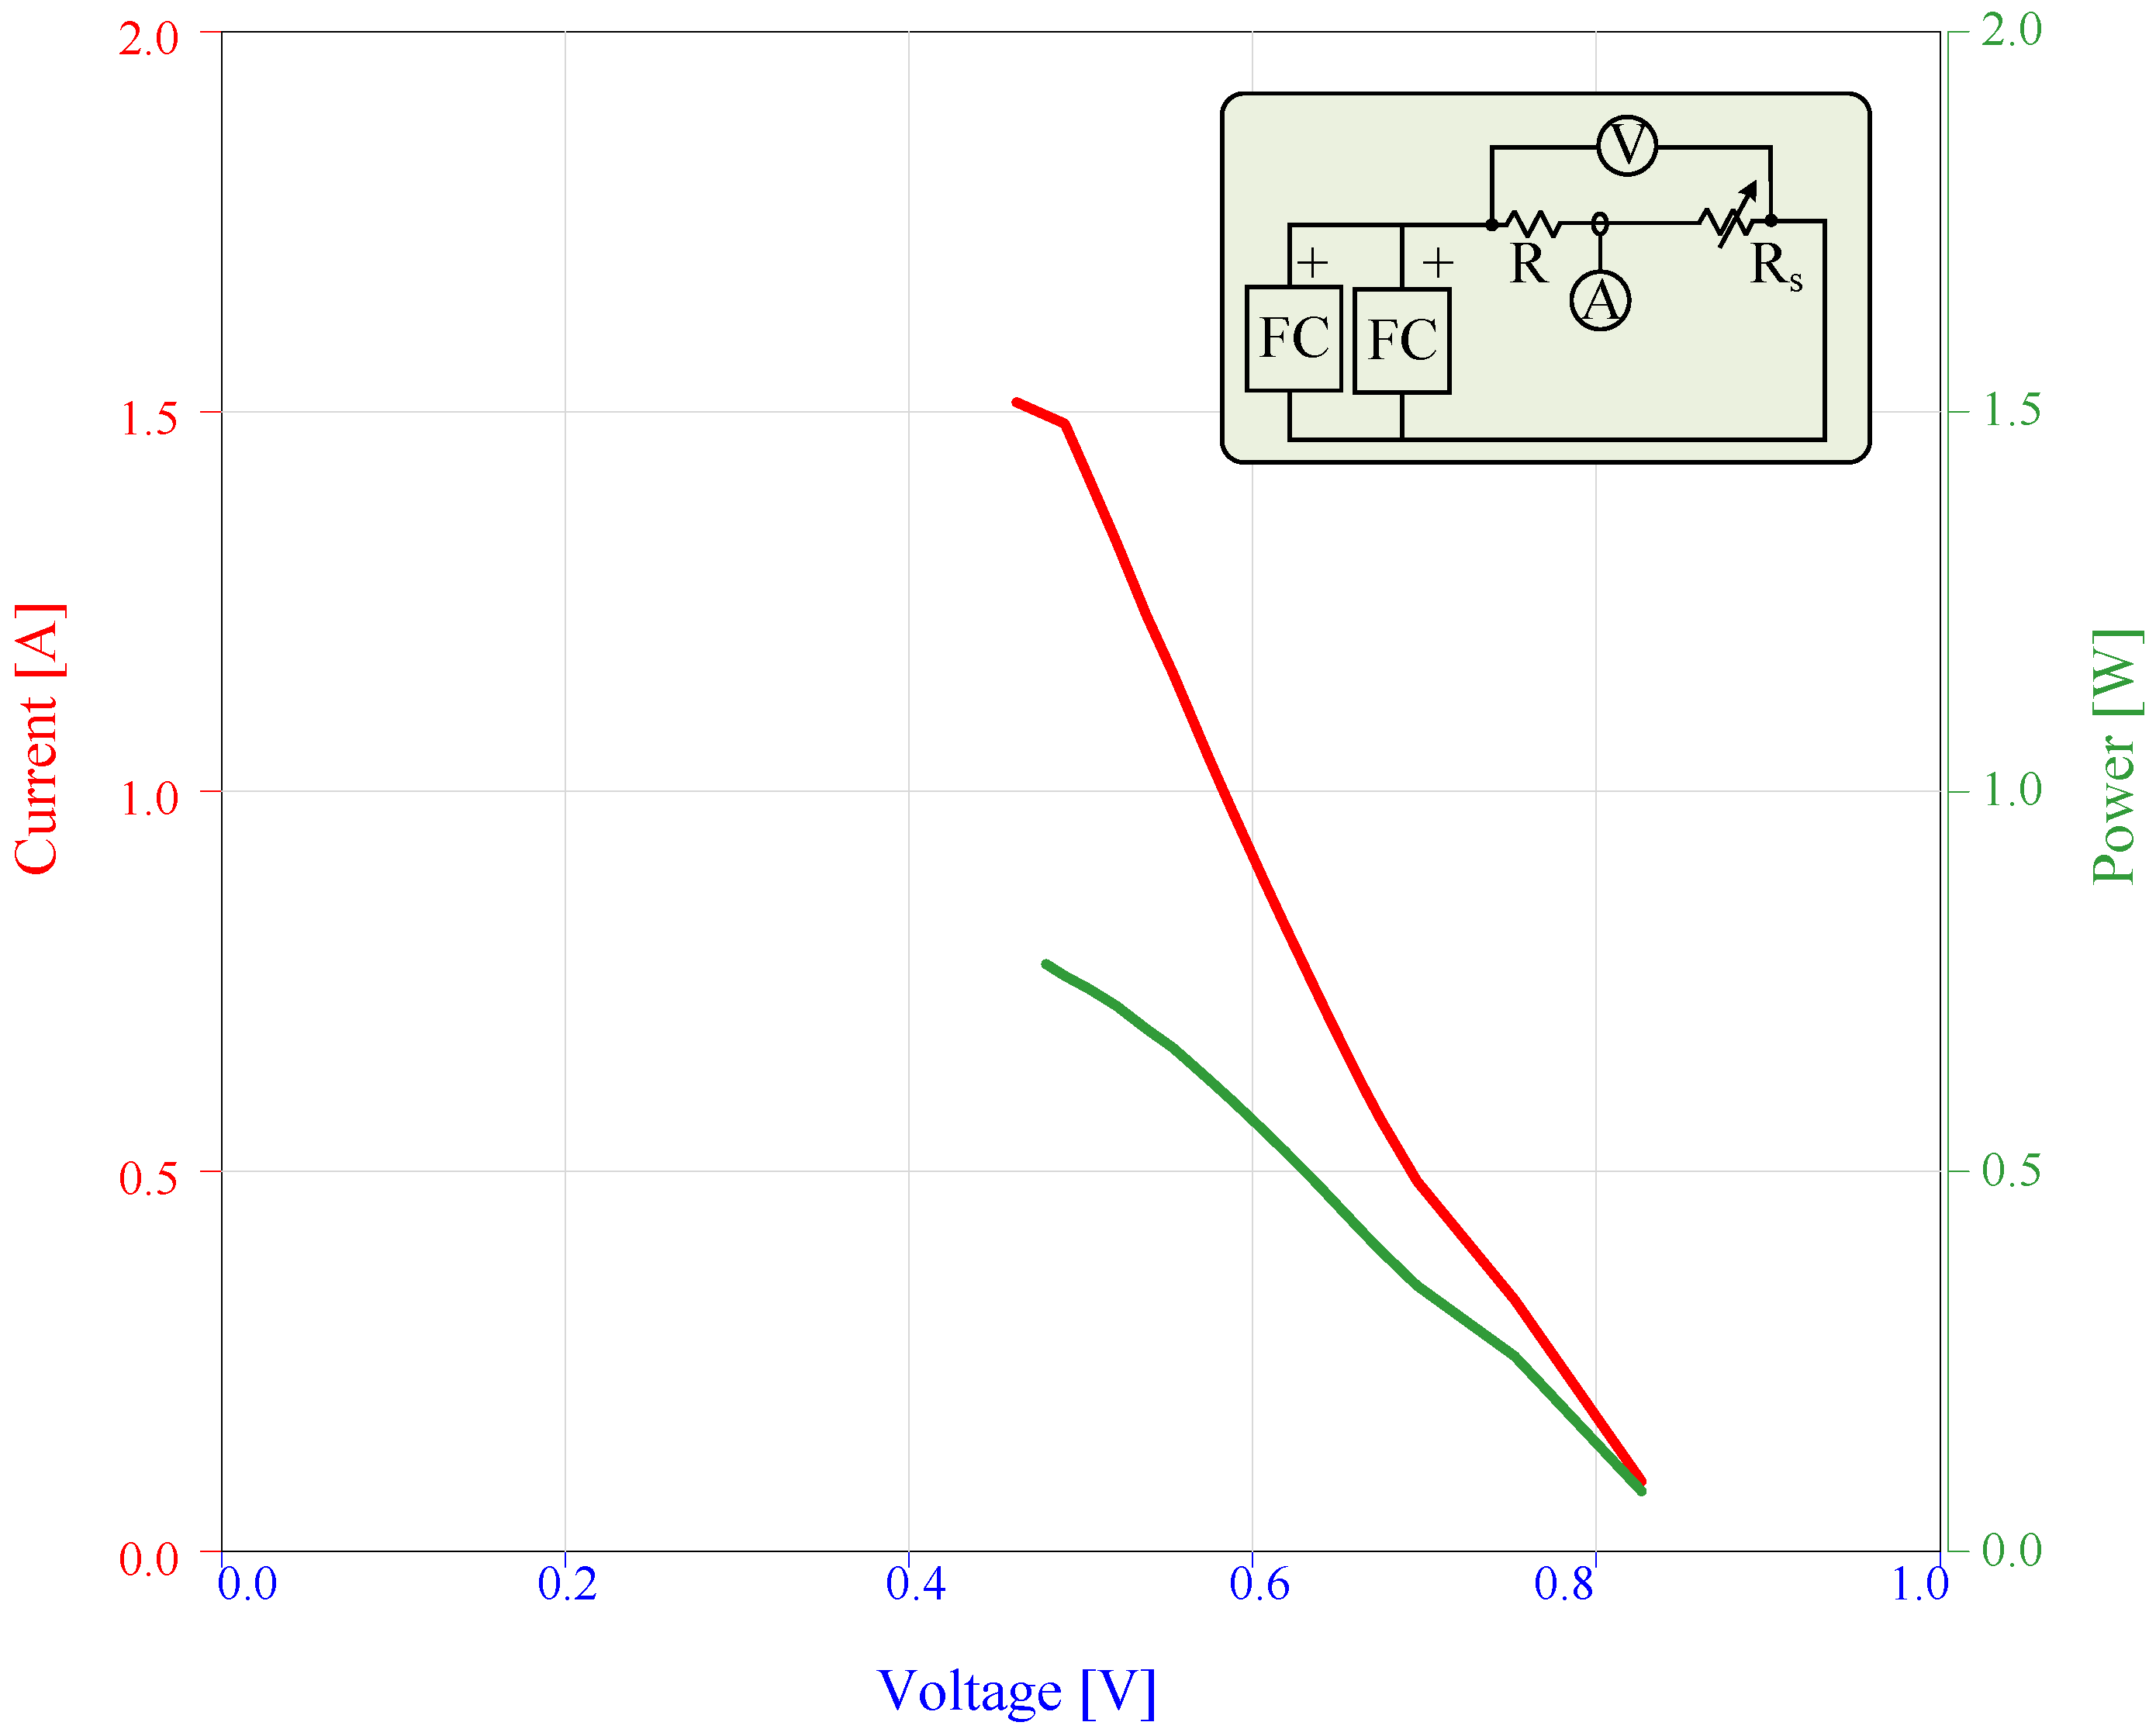
4.9.2. Parallel-Connected FC

Experiments are performed with fuel cells connected in parallel, which are connected to a variable resistor that changes the current. The voltmeter is connected in parallel, and the ammeter is with a shunt in series. Figure 14 shows the connection diagram. Before starting the experiment, fill the tank with hydrogen and then connect the circuit as in Figure 14 and adjust the variable resistor so that a current of 1000 mA flows through it. Hydrogen consumption is recorded for three minutes, and the measurement has repeated three times. The mean consumption value is reduced by the leakage rate from the previous experiment, and the leakage rate is 0.8 mL/min, which means that 2.4 mL of hydrogen leaked out in three minutes. The energy efficiency of the fuel cell is calculated according to the following equation:
η f c = W e l e c t r i c a l W c h e m i c a l = V · I · t + I 2 · R H H 2 · V = 0.44 · 1 · 180 + 1 2 · 0.1 11920 · ( 19 2.4 ) · 10 3 = 0.4008
This equation shows that the energy efficiency of the cells on the model is 0.4008 or 40.08%. Other measurements are performed in the same way. Only the current of parallel connected fuel cells is changed. Thus, for currents equal 0.4–1 A, the efficiency is about 50%, which is more than the case of a series connection. This type of connection is preferred for applying a fuel cell in practice. The system’s maximum efficiency is calculated according to the Equation (9) by taking the maximum efficiency value of the fuel cell in parallel connection and multiplying it by the maximum efficiency value of the electrolyzer.
η t = η f c · η e l = 0.6671 · 0.9396 = 0.6268
The maximum efficiency of the system of parallel connected fuel cells is 62.68%.

5. Conclusions

This paper presents an experimental prototype suitable for the education of Electrical engineering students. The portable educational prototype is capable of a simple recording of V-I characteristics of different connections of fuel cells (serial and parallel). Furthermore, the prototype can help obtaining the analysis and operation procedure of the electrolyzer, and visualizing the operation of electric loads, such as motor and bulb. Experimental analysis of the electrolyzer illustrates that water electrolysis produces 60 mL hydrogen and 30 mL oxygen. The study proves that water composition (H 2 O) has two atoms of hydrogen and one atom of oxygen. The V-I characteristics show that the electrolyzer has a threshold voltage of 1.4 V. If the threshold voltage is not reached, no current will flow through the electrolyzer. Therefore, the water electrolysis process will not be performed. The electrolyzer, as a two-tank system, has losses in terms of hydrogen leakage. Thus, the experiment determined a hydrogen leakage constant of 0.8 mL/min, from which it can be concluded that high-quality equipment for hydrogen storage is needed.
The paper also determined the efficiency of fuel cells in series and parallel modes of operation. In the series mode of operation, it is mathematically proven that the efficiency is higher at lower currents. Still, the fuel cell operating area is required where the power is the highest. According to the V-I characteristic of the series connection, the current value is between 0.6 and 0.8 A. According to the results, it obtained an efficiency of approximately 25%. On the other hand, in the parallel operation mode, the power constantly increases by increasing the current according to the V-I characteristic. According to the test results, the efficiency is approximately constant for the current between 0.4 and 1 A, which is about 50%. Thus, a parallel connection is recommended in the application of fuel cells.

Funding

This work was funded by the Deanship of Scientific Research at Najran University grant code (NU/RG/SERC/11/2).

Institutional Review Board Statement

Not applicable.

Informed Consent Statement

Not applicable.

Data Availability Statement

Not applicable.

Conflicts of Interest

The author declares no conflict of interest.

Abbreviations

The following abbreviations are used in this manuscript:
IEAInternational Energy Agency
MCFCMolten Carbonate Fuel Cell
SOFCSolid oxide fuel cell
FCVFuel cell vehicles
CHPCombined heat and power
PSOParticle swarm optimization
AFCAlkaline fuel cells
PAFCPhosphoric acid fuel cells
Z r O 2 Zirconium dioxide

References

  1. Andújar, J.M.; Segura, F. Fuel cells: History and updating. A walk along two centuries. Renew. Sustain. Energy Rev. 2009, 13, 2309–2322. [Google Scholar] [CrossRef]
  2. Grove, W.R. VIII. On the gas voltaic battery.—Experiments made with a view of ascertaining the rationale of its action and its application to eudiometry. Philos. Trans. R. Soc. Lond. 1843, 133, 91–112. [Google Scholar]
  3. Ortiz-Rivera, E.; Salazar-Llinas, A.; Velez-Delgado, J. An enriched undergraduate research experience based on the simulation, experiments, and theory of fuel cells. In Proceedings of the 2009 39th IEEE Frontiers in Education Conference, San Antonio, TX, USA, 18–21 October 2009; pp. 1–6. [Google Scholar]
  4. Katz, E.; Bollella, P. Fuel cells and biofuel cells: From past to perspectives. Isr. J. Chem. 2021, 61, 68–84. [Google Scholar] [CrossRef]
  5. Sharma, S.; Ghoshal, S.K. Hydrogen the future transportation fuel: From production to applications. Renew. Sustain. Energy Rev. 2015, 43, 1151–1158. [Google Scholar] [CrossRef]
  6. Demirbas, A. Biohydrogen; Springer: Berlin/Heidelberg, Germany, 2009. [Google Scholar]
  7. Wright, C.R.A.; Thompson, C. XVII. Note on the development of voltaic electricity by atmospheric oxidation of combustible gases and other substances. Proc. R. Soc. Lond. 1890, 46, 372–376. [Google Scholar]
  8. Spiegel, C. PEM Fuel Cell Modeling and Simulation Using MATLAB; Elsevier: Amsterdam, The Netherlands, 2011. [Google Scholar]
  9. Lorca Martínez, J.M. Optimización del contenido de catalizador en una pila de combustible tipo PEM. 2021. Available online: https://repositorio.upct.es/bitstream/handle/10317/9892/tfg-lor-opt.pdf?sequence=1 (accessed on 22 November 2022).
  10. Stambouli, A.B. Fuel cells: The expectations for an environmental-friendly and sustainable source of energy. Renew. Sustain. Energy Rev. 2011, 15, 4507–4520. [Google Scholar] [CrossRef]
  11. Turco, M.; Ausiello, A.; Micoli, L. Fuel cells operating and structural features of MCFCs and SOFCs. In Treatment of Biogas for Feeding High Temperature Fuel Cells; Springer: Berlin/Heidelberg, Germany, 2016; pp. 31–76. [Google Scholar]
  12. Arto, I.; Capellán-Pérez, I.; Lago, R.; Bueno, G.; Bermejo, R. The energy requirements of a developed world. Energy Sustain. Dev. 2016, 33, 1–13. [Google Scholar] [CrossRef] [Green Version]
  13. Chow, J.; Kopp, R.J.; Portney, P.R. Energy resources and global development. Science 2003, 302, 1528–1531. [Google Scholar] [CrossRef] [Green Version]
  14. Shafiee, S.; Topal, E. When will fossil fuel reserves be diminished? Energy Policy 2009, 37, 181–189. [Google Scholar] [CrossRef]
  15. Pérez-Lombard, L.; Ortiz, J.; Pout, C. A review on buildings energy consumption information. Energy Build. 2008, 40, 394–398. [Google Scholar] [CrossRef]
  16. Abas, N.; Kalair, A.; Khan, N. Review of fossil fuels and future energy technologies. Futures 2015, 69, 31–49. [Google Scholar] [CrossRef]
  17. Sun, C.; Negro, E.; Vezzù, K.; Pagot, G.; Cavinato, G.; Nale, A.; Bang, Y.H.; Di Noto, V. Hybrid inorganic-organic proton-conducting membranes based on SPEEK doped with WO3 nanoparticles for application in vanadium redox flow batteries. Electrochim. Acta 2019, 309, 311–325. [Google Scholar] [CrossRef]
  18. Sun, C.; Zhang, H. Review of the Development of First-Generation Redox Flow Batteries: Iron-Chromium System. ChemSusChem 2022, 15, e202101798. [Google Scholar] [CrossRef] [PubMed]
  19. Cader, J.; Koneczna, R.; Olczak, P. The Impact of Economic, Energy, and Environmental Factors on the Development of the Hydrogen Economy. Energies 2021, 14, 4811. [Google Scholar] [CrossRef]
  20. Burke, A.F. Batteries and ultracapacitors for electric, hybrid, and fuel cell vehicles. Proc. IEEE 2007, 95, 806–820. [Google Scholar] [CrossRef]
  21. Mench, M.M. Fuel Cell Engines; John Wiley & Sons: New York, NY, USA, 2008. [Google Scholar]
  22. Agbossou, K.; Kolhe, M.; Hamelin, J.; Bose, T.K. Performance of a stand-alone renewable energy system based on energy storage as hydrogen. IEEE Trans. Energy Convers. 2004, 19, 633–640. [Google Scholar] [CrossRef]
  23. Lucas Nülle, G. Electrical Power Engineering, Renewable Energies, EPH 2 Advanced Photovoltaics Trainer (PV). Available online: https://www.4test.no/cosmoshop/default/artikelpdf/LN-5677-EPH_en.pdf (accessed on 22 November 2022).
  24. Farias, C.B.B.; Barreiros, R.C.S.; da Silva, M.F.; Casazza, A.A.; Converti, A.; Sarubbo, L.A. Use of Hydrogen as Fuel: A Trend of the 21st Century. Energies 2022, 15, 311. [Google Scholar] [CrossRef]
  25. Ajanovic, A.; Haas, R. Prospects and impediments for hydrogen and fuel cell vehicles in the transport sector. Int. J. Hydrog. Energy 2021, 46, 10049–10058. [Google Scholar] [CrossRef]
  26. Pei, P.; Chen, H. Main factors affecting the lifetime of Proton Exchange Membrane fuel cells in vehicle applications: A review. Appl. Energy 2014, 125, 60–75. [Google Scholar] [CrossRef]
  27. Muthukumar, M.; Rengarajan, N.; Velliyangiri, B.; Omprakas, M.; Rohit, C.; Raja, U.K. The development of fuel cell electric vehicles–A review. Mater. Today Proc. 2021, 45, 1181–1187. [Google Scholar] [CrossRef]
  28. Boettner, D.D.; Paganelli, G.; Guezennec, Y.G.; Rizzoni, G.; Moran, M.J. Proton exchange membrane fuel cell system model for automotive vehicle simulation and control. J. Energy Resour. Technol. 2002, 124, 20–27. [Google Scholar] [CrossRef]
  29. Ahluwalia, R.K.; Wang, X.; Rousseau, A.; Kumar, R. Fuel economy of hydrogen fuel cell vehicles. J. Power Sources 2004, 130, 192–201. [Google Scholar] [CrossRef]
  30. Maleki, A. Optimal operation of a grid-connected fuel cell based combined heat and power systems using particle swarm optimisation for residential sector. Int. J. Ambient. Energy 2021, 42, 550–557. [Google Scholar] [CrossRef]
  31. Gencoglu, M.T.; Ural, Z. Design of a PEM fuel cell system for residential application. Int. J. Hydrog. Energy 2009, 34, 5242–5248. [Google Scholar] [CrossRef]
  32. Rahim, A.A.; Tijani, A.S.; Kamarudin, S.; Hanapi, S. An overview of polymer electrolyte membrane electrolyzer for hydrogen production: Modeling and mass transport. J. Power Sources 2016, 309, 56–65. [Google Scholar] [CrossRef]
  33. Ulleberg, Ø. Modeling of advanced alkaline electrolyzers: A system simulation approach. Int. J. Hydrog. Energy 2003, 28, 21–33. [Google Scholar] [CrossRef]
  34. Stempien, J.P.; Sun, Q.; Chan, S.H. Solid Oxide Electrolyzer Cell Modeling: A Review. J. Power Technol. 2013, 93. [Google Scholar]
  35. Hall, J. Cell Components; Liskins, H.F., Jackson, J.F., Eds.; Springer: Berlin/Heidelberg, Germany, 1987; pp. 238–399. [Google Scholar]
  36. O’hayre, R.; Cha, S.-W.; Colella, W.; Prinz, F.B. Fuel Cell Fundamentals; Wiley: Hoboken, NJ, USA, 2009. [Google Scholar]
  37. Wang, S.; Lu, A.; Zhong, C.J. Hydrogen production from water electrolysis: Role of catalysts. Nano Converg. 2021, 8, 1–23. [Google Scholar] [CrossRef]
  38. Ottman, N.; Ruokolainen, L.; Suomalainen, A.; Sinkko, H.; Karisola, P.; Lehtimäki, J.; Lehto, M.; Hanski, I.; Alenius, H.; Fyhrquist, N. Soil exposure modifies the gut microbiota and supports immune tolerance in a mouse model. J. Allergy Clin. Immunol. 2019, 143, 1198–1206. [Google Scholar] [CrossRef] [PubMed] [Green Version]
  39. Hermann, A.; Chaudhuri, T.; Spagnol, P. Bipolar plates for PEM fuel cells: A review. Int. J. Hydrog. Energy 2005, 30, 1297–1302. [Google Scholar] [CrossRef]
  40. Chen, H.; Zhao, X.; Zhang, T.; Pei, P. The reactant starvation of the proton exchange membrane fuel cells for vehicular applications: A review. Energy Convers. Manag. 2019, 182, 282–298. [Google Scholar] [CrossRef]
  41. Taccani, R.; Zuliani, N. Effect of flow field design on performances of high temperature PEM fuel cells: Experimental analysis. Int. J. Hydrogen Energy 2011, 36, 10282–10287. [Google Scholar] [CrossRef]
  42. Meyers, R.A. Encyclopedia of Physical Science and Technology; Academic: Cambridge, MA, USA, 2002. [Google Scholar]
  43. Xu, J.; Zhang, C.; Wan, Z.; Chen, X.; Chan, S.H.; Tu, Z. Progress and perspectives of integrated thermal management systems in PEM fuel cell vehicles: A review. Renew. Sustain. Energy Rev. 2022, 155, 111908. [Google Scholar] [CrossRef]
  44. Carlsson, G.A.; Ljungberg, M. Basic Atomic and Nuclear Physics. In Handbook of Nuclear Medicine and Molecular Imaging for Physicists; CRC Press: Boca Raton, FL, USA, 2022; pp. 15–37. [Google Scholar]
  45. Bethe, H.A.; Bacher, R.F. Nuclear physics A. Stationary states of nuclei. Rev. Mod. Phys. 1936, 8, 82. [Google Scholar] [CrossRef] [Green Version]
  46. Whittle, K. Nuclear Materials Science; IOP Publishing: Bristol, UK, 2016. [Google Scholar]
  47. McQuarrie, D.A. Quantum Chemistry; University Science Books: Sausalito, CA, USA, 1983. [Google Scholar]
  48. Bland, W.J.; Rolls, D. Weathering: An Introduction to the Scientific Principles; Routledge: London, UK, 2016. [Google Scholar]
  49. Hao, D.; Wang, X.; Zhang, Y.; Wang, R.; Chen, G.; Li, J. Experimental study on hydrogen leakage and emission of fuel cell vehicles in confined spaces. Automot. Innov. 2020, 3, 111–122. [Google Scholar] [CrossRef]
  50. Sakamoto, J.; Misono, H.; Nakayama, J.; Kasai, N.; Shibutani, T.; Miyake, A. Evaluation of safety measures of a hydrogen fueling station using physical modeling. Sustainability 2018, 10, 3846. [Google Scholar] [CrossRef] [Green Version]
  51. Dyantyi, N.; Parsons, A.; Sita, C.; Pasupathi, S. PEMFC for aeronautic applications: A review on the durability aspects. Open Eng. 2017, 7, 287–302. [Google Scholar] [CrossRef]
Figure 1. The main components of the hydrogen fuel cell vehicles.
Applsci 13 00608 g001
Figure 2. The main components of the fuel cell (a) internal parts and (b) fuel cell stack.
Applsci 13 00608 g002
Figure 3. The educational prototype of the fuel cell.
Applsci 13 00608 g003
Figure 4. The electrolyzer.
Applsci 13 00608 g004
Figure 5. Fuel cells (left) and various electric loads (right).
Applsci 13 00608 g005
Figure 6. Expanded view of the electrolyzer’s reaction chamber.
Applsci 13 00608 g006
Figure 7. The principle of the electrolyzer board: Reactions at the cathode (a,d) and the anode (b,c).
Applsci 13 00608 g007
Figure 8. Optimized plan for experimental studies using the prototype.
Applsci 13 00608 g008
Figure 9. Tanks O 2 and H 2 .
Applsci 13 00608 g009
Figure 10. The Characteristics of the Electrolyzer: P-V curve (blue) and I-V curve (red).
Applsci 13 00608 g010
Figure 11. Consumed H 2 .
Applsci 13 00608 g011
Figure 12. The Structure of a Fuel Cell.
Applsci 13 00608 g012
Figure 13. The characteristic V-I curve (red) and V-P curve (green) for a single FC. The test circuit and the FC connection is shown in the upper right corner.
Applsci 13 00608 g013
Figure 14. The characteristic V-I curve (red) and V-P curve (green) for parallel-connected FCs. The test circuit and the parallel connection of FCs is shown in the (upper right corner of the graph).
Applsci 13 00608 g014
Figure 15. The characteristic V-I curve (red) and V-P curve (green) for serially-connected FCs. The test circuit and the series connection of FCs are shown in the (upper right corner of the graph).
Applsci 13 00608 g015
Table 1. Comparison of different types of electrolyzers.
AlkalinePEMSolid Oxide
Electrolyte15–35% NaOH or KOHPerfluorosulfonic acidZrO 2 doped
Cell seperatorDiaphragmElectrolyte membraneElectrolyte membrane
Anode reaction 4 OH O 2 + 2 H 2 O + 4 e H 2 O 2 H + + 0.5 O 2 + 2 e H 2 O + 2 e H 2 + O 2
Cathode reaction 2 H 2 O + 2 e H 2 + 2 OH 2 H + + 2 e H 2 O 2 0.5 O 2 +2 e
Typical Temperature50–20 °C80–100 °C750–1000 °C
Durability100,000 h10,000–50,000 h500 –2000 h
Capacity1–700 Nm 3 per hour1–100 Nm 3 per hour1–10 Nm 3 per hour
Cost1300$ per kWh2000$ per kWh2300$ per kWh
Advantages- Commercialized technology
- Cost effective
- High nominal output power
- Abundance of raw material
- Commercialized technology
- Fast dynamic characteristics
- Fast start operation
- Pure hydrogen output
- High efficiency
- Direct synthesis gas generation
Disadvantages- Slow cold start
- vulnerability to impurities in
- Electrodes are made of valuable electrodes
- High cost
- Still in development phase
- High cost
- Slow start
Table 2. The production of H 2 as a function of time.
Time [s]60.090.0120.0150.0180.0210.0240.0
Production H2, V [mL]7.011.014.018.021.024.028.0
Table 3. The Production of H 2 vs. the Current [A].
I [A]0.400.801.201.6020
Production H2, V [mL]9.016.026.035.044.0
Table 4. The Production of H 2 vs. Time [s].
Time [s]60.0120.0180.0240.0
Volume of H 2 [mL]44.038.034.028.0
loss H 2 [mL]0.801.602.403.20
consumed H 2 [mL]15.2020.4023.6028.80
Table 5. The production of H 2 vs. the current [mA].
I [mA]4008001200
Volume of H 2 [mL]524642
loss H 2 [mL]1.61.61.6
consumed H 2 [mL]6.412.416.4
Disclaimer/Publisher’s Note: The statements, opinions and data contained in all publications are solely those of the individual author(s) and contributor(s) and not of MDPI and/or the editor(s). MDPI and/or the editor(s) disclaim responsibility for any injury to people or property resulting from any ideas, methods, instructions or products referred to in the content.

