Article

Experimental and Empirical Studies to Evaluate Liquefaction Resistance of Partially Saturated Sands

by
Abdülhakim Zeybek
Department of Architecture, Faculty of Engineering and Architecture, Mus Alparslan University, Mus 49250, Turkey
Appl. Sci. 2023, 13(1), 81; https://doi.org/10.3390/app13010081
Submission received: 29 November 2022 / Revised: 17 December 2022 / Accepted: 19 December 2022 / Published: 21 December 2022
(This article belongs to the Section Civil Engineering)

Abstract

:
Partially saturated sands with occluded gas bubbles may occur naturally in the field or can be created artificially as a way of mitigating liquefaction effects. This study aimed to investigate the main parameters that influence the liquefaction resistance of partially saturated sands containing occluded gas bubbles. It also adopted a simplified approach and proposed empirical relationships that linked the liquefaction-resistance ratio to the bulk modulus, maximum volumetric strain, and excess pore-pressure ratio. Considering these objectives, a total of 60 stress-controlled dynamic triaxial tests were conducted. Nearly/fully saturated and partially saturated sand specimens prepared using sodium percarbonate were subjected to undrained cyclic loading with a loading frequency of 0.1 Hz. The loosely or densely packed sand specimens at different degrees of saturation (79–100%) were examined under different initial effective confining stresses (25–100 kPa) and back pressures (100–400 kPa). The analysis of the test results indicated that the liquefaction resistance of the partially saturated sands constantly increased as the degree of saturation decreased, and this effect was more prominent under higher initial effective confining stresses and lower back pressures. The adopted method satisfactorily captured this trend and showed reasonable matches between the empirical predictions and experimentally observed results from this study and previous research.

1. Introduction

Earthquake-induced liquefaction is an important phenomenon of natural hazards that causes significant deformation of soil deposits and failure of geotechnical structures. The catastrophic effects of liquefaction have been recurrently observed in many seismic events such as the 1964 Alaska (USA) and Niigata (Japan) earthquakes [1,2], the 1999 Kocaeli and Duzce (Turkey) earthquakes [3], the 2010 Haiti and Maule (Chile) earthquakes [4,5], the 2011 Tohoku (Japan) and Christchurch (New Zealand) earthquakes [6,7], and the 2016 Ecuador earthquake [8,9].
Liquefaction occurs in granular deposits when excess pore pressures develop under seismic loading and cause a large reduction in the effective stress and significant degradation of the soil strength and stiffness. In aftermath of the 1964 earthquakes, comprehensive research has been conducted to elucidate the important mechanisms and fundamental understanding of earthquake-induced liquefaction. These studies have mostly benefited from the analysis of case histories and/or laboratory tests on undisturbed or reconstituted samples and have produced several semi-empirical principles and frameworks that are widely used in current design practice for the evaluation of liquefaction susceptibility and its effects [10,11,12,13].
Natural soil deposits in seismically active zones may be found in a nearly/fully saturated, unsaturated, or partially saturated state depending on the groundwater level, degree of saturation ( S r ), and distribution of gas bubbles in the soil [14,15]. Granular soil deposits tend to contract when subjected to cyclic shear strains, which causes the rearrangement and densification of soil grains. For the nearly/fully saturated state, which generally occurs well below the groundwater level, interparticle pores are filled with practically incompressible pore fluid (e.g., water). During an earthquake loading in an undrained condition, the pore fluid cannot move or contract because the rate of loading and the bulk stiffness of the pore fluid are high, thereby causing the build-up of large excess pore pressures. For the unsaturated state, which usually occurs well above the groundwater level, interparticle pores are filled with a continuous air and water meniscus, and the effective stress and hence liquefaction resistance of the soil deposit increase due to the presence of a large matric suction. For the partially saturated state occurring below the groundwater level, pores are filled with water and gas that may exist in a continuous or an occluded bubble form depending on the level of saturation. The gas takes an occluded bubble form at high degrees of saturation (typically S r 80%), whereas the continuous gas phase is prevalent below this level [16]. In the former case, the presence of entrapped gas bubbles in pore spaces of submerged soil significantly reduces the bulk modulus and increases the compressibility of pore fluid, namely, the gas–water mixture. The gas bubbles tend to reduce in volume and absorb the excess pore pressures during an earthquake loading, thereby enhancing the resistance of the soil to liquefaction [17].
Partially saturated soils can be formed by naturally occurring gas bubbles via biological activities [18,19] or via human activities. In the latter case, the degree of saturation of soil deposits is reduced by using various induced partial saturation (IPS) methods to enhance the liquefaction resistance. Air injection [20,21,22], electrolysis and drainage–recharge [23], use of denitrifying bacteria [24,25], and use of chemical composition [26,27] are some of the most widely used IPS techniques. Previous studies on IPS methods showed that gas bubbles created in partially saturated soils can stay in the pore spaces and that the partially saturated state can last for a sufficiently long time [23,28,29].
Previous element and physical modeling tests showed that several parameters such as the degree of saturation ( S r ), initial effective confining stress ( σ c ), and back pressure ( u 0 ) affect the co- and post-liquefaction behavior of partially saturated soils. The excess pore pressure generation, ground surface, and structural settlement are significantly reduced as the degree of saturation of soils is lowered [30,31,32,33]. Through element tests, the liquefaction resistance of partially saturated soils was shown to increase with a decreasing degree of saturation [34,35,36,37,38,39,40]. The observations based on cyclic element tests also indicated that not only the degree of saturation is of importance, but the effects of initial effective confining or vertical stress and back pressure also must be accounted for [17,41]. Partially saturated soils under a higher confining stress and lower back pressure appear to show greater resistance to liquefaction.
As mentioned previously, the presence of gas bubbles in the pore spaces plays an important role in soil liquefaction, and a true assessment of this aspect is important in geotechnical earthquake engineering practice. The current study discusses the most important parameters that govern the liquefaction behavior of partially saturated sands with occluded gas bubbles (e.g., S r 80%). Moreover, an empirical framework was adopted to obtain a quick and reasonable estimation of the liquefaction-resistance ratio in terms of the bulk modulus, maximum volumetric strain, and excess pore-pressure ratio. To achieve these goals, a series of 60 stress-controlled undrained dynamic triaxial tests were conducted on nearly/fully saturated and partially saturated sand specimens prepared with a chemical composition of sodium percarbonate. The test parameters (e.g., degree of saturation, initial effective confining stress, back pressure, and relative density) were changed. Subsequently, the predictions of the proposed empirical methodology were compared with the experimental data obtained from this study and collected from the published literature. This study is expected to provide significant insights that may enhance the use of this particular induced-partial-saturation method in design practice.

2. Prediction Models for Partially Saturated Soils

2.1. Previous Literature

Liquefaction is directly associated with the build-up of excess pore pressures under cyclic loading, and therefore its prediction is of engineering significance. For this purpose, different stress-based [42,43,44], and energy-based predictive models [45] have been proposed in the literature. These models are intended for nearly or fully saturated sands with or without fines, and their robustness relies heavily on the soil and test-dependent empirical coefficients.
The gas bubbles in pore spaces reduce the bulk modulus of the pore fluid (gas–water mixture) and therefore affect the generation of excess pore pressures in partially saturated sands. Previous studies [46,47] suggested that excess pore pressures during one loading cycle ( Δ u ) can be correlated with the volumetric strain increment ( Δ ε v d ), the rebound modulus of the soil skeleton ( E r ), the porosity of the soil deposit ( n ), and the bulk modulus of the pore fluid ( K f ):
Δ u = Δ ε v d 1 E r + n K f
This model requires the determination of several soil parameters and experimental constants that define the magnitude of volume change and elastic rebound of soils under drained conditions.
For partially saturated sands with occluded gas bubbles ( S r 80%), the surface tension between the gas and water can be ignored, and the gas bubble pressure is considered to be almost equal to pore water pressure. The bulk modulus of the pore fluid ( K f ) for this particular case can be estimated using the relationship given in Equation (2) proposed by Koning [48]:
K f = 1 S r K w + 1 S r K g
where K w and K g are the bulk modulus of water and gas, respectively.
The occluded gas bubbles in pore spaces of partially saturated sand initially exist in equilibrium with the surrounding pore water. During cyclic loading in undrained conditions, the change in pore water ( Δ u w ) and gas pressure ( Δ u g ) will be the same as the excess pore pressure ( Δ u ). In this condition, the volumetric strains ( ε v ) suffered by partially saturated sands can be estimated using the theoretical formulation in Equation (3):
ε v = Δ u P 0 + Δ u ( 1 S r ) e e + 1 σ c P 0 + σ c ( 1 S r ) e e + 1 = ε v *
where e is the void ratio of the soil and P 0 is the absolute pore water pressure. The sand suffers the largest (potential or maximum) volumetric strain ( ε v * ) when the excess pore pressure reaches the initial effective confining stress ( σ c ).
Okamura and Soga [17] showed that a unique relationship exists between the maximum volumetric strain ( ε v * ) and liquefaction resistance ratio ( L R R ) that is defined as the liquefaction resistance of partially saturated soils normalized with that of fully saturated soils. Few strain-based or stress-based empirical models were proposed for excess pore pressure generation [26,49] and for settlement in partially saturated soils [50,51].

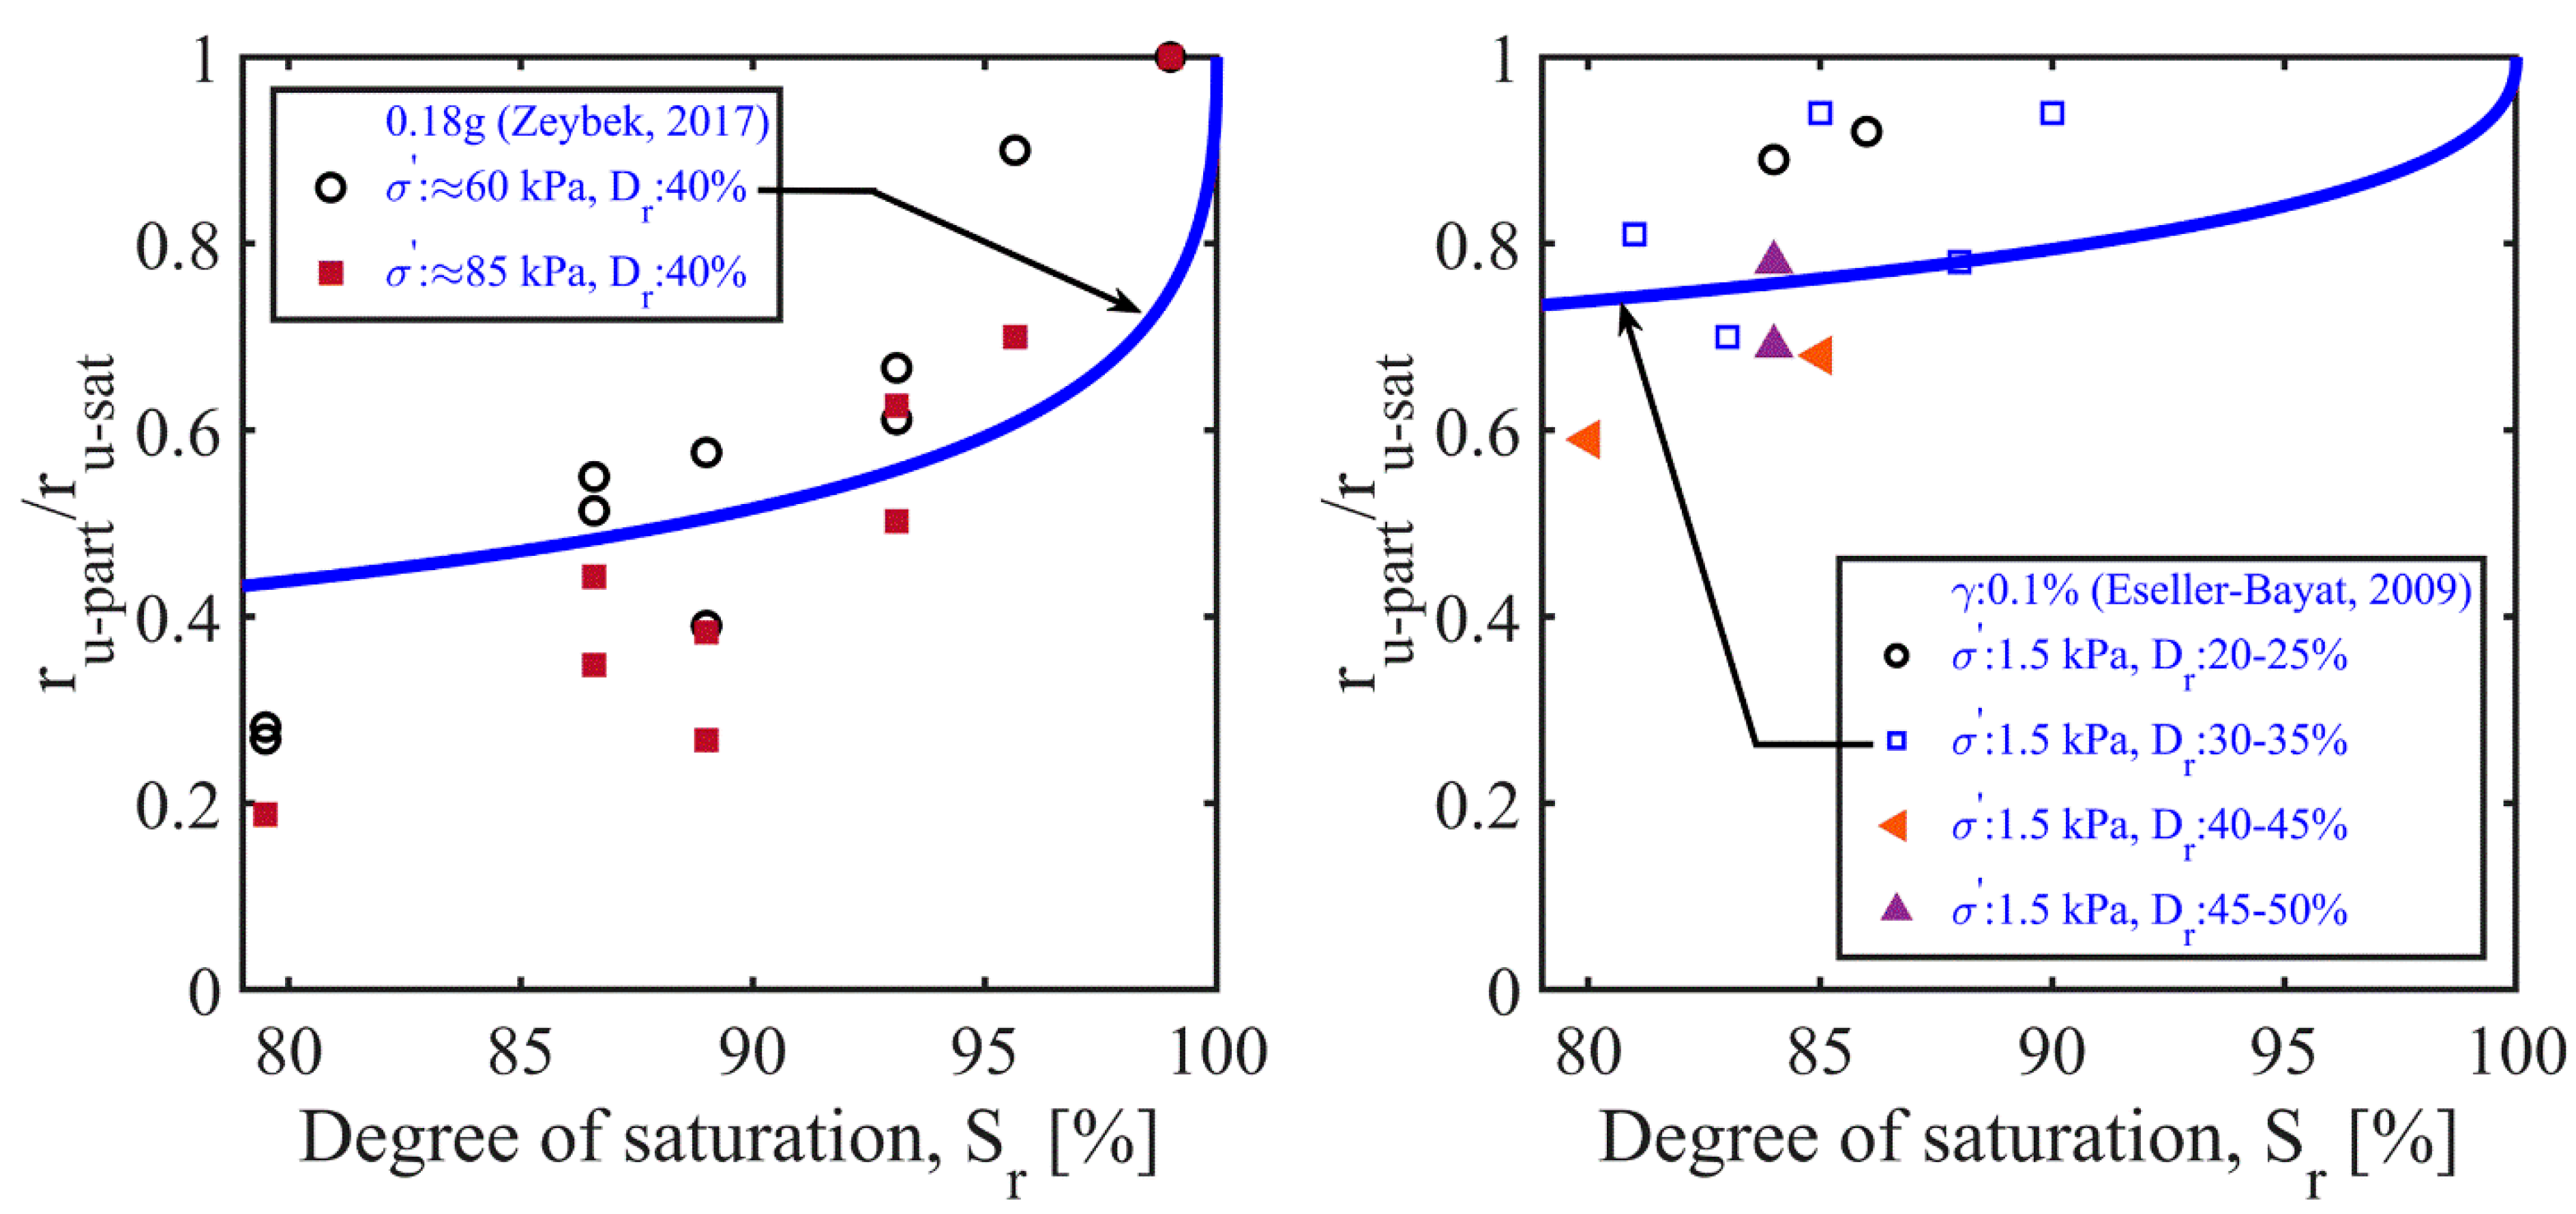
2.2. Adopted Empirical Methodology

In the field of geotechnical earthquake engineering, studies on partially saturated soils are markedly less common than on fully saturated soils, which is probably due to difficulties and problems encountered during laboratory research or field investigation. A review of the literature indicated that only a few models are available to predict the important aspects of the liquefaction mechanism and response of partially saturated sands with occluded gas bubbles, so this topic requires further attention. This study used a potentially simple empirical methodology to evaluate the liquefaction-resistance ratio ( L R R ) in terms of pore fluid bulk modulus ( K f ), maximum volumetric strain ( ε v * ), and excess pore-pressure ratio ( r u ). This method was built on the basis of experimental observations, analysis of the database compiled from the literature, and theoretical justification.
The liquefaction-resistance ratio ( L R R ) can be estimated as a function of the maximum volumetric strain ( ε v * ) or the bulk modulus of the pore fluid ( K f ):
L R R = f ( ε v * ) = f ( K f )
As Equation (3) indicates, the maximum volumetric strain ( ε v * ) is a function of the degree of saturation ( S r ), initial effective confining stress ( σ c ), back or pore fluid pressure ( u 0 ), and void ratio ( e ) or relative density ( D r ):
ε v * = f ( S r ,   σ c ,   u 0 ,   D r )
The normalized excess pore-pressure ratio ( r u p a r t r u s a t ) can be inversely correlated to the liquefaction-resistance ratio ( L R R ):
r u p a r t r u s a t = f 1 ( L R R )
where r u s a t and r u p a r t are the excess pore-pressure ratios generated in fully and partially saturated sands, respectively.

3. Materials and Methods

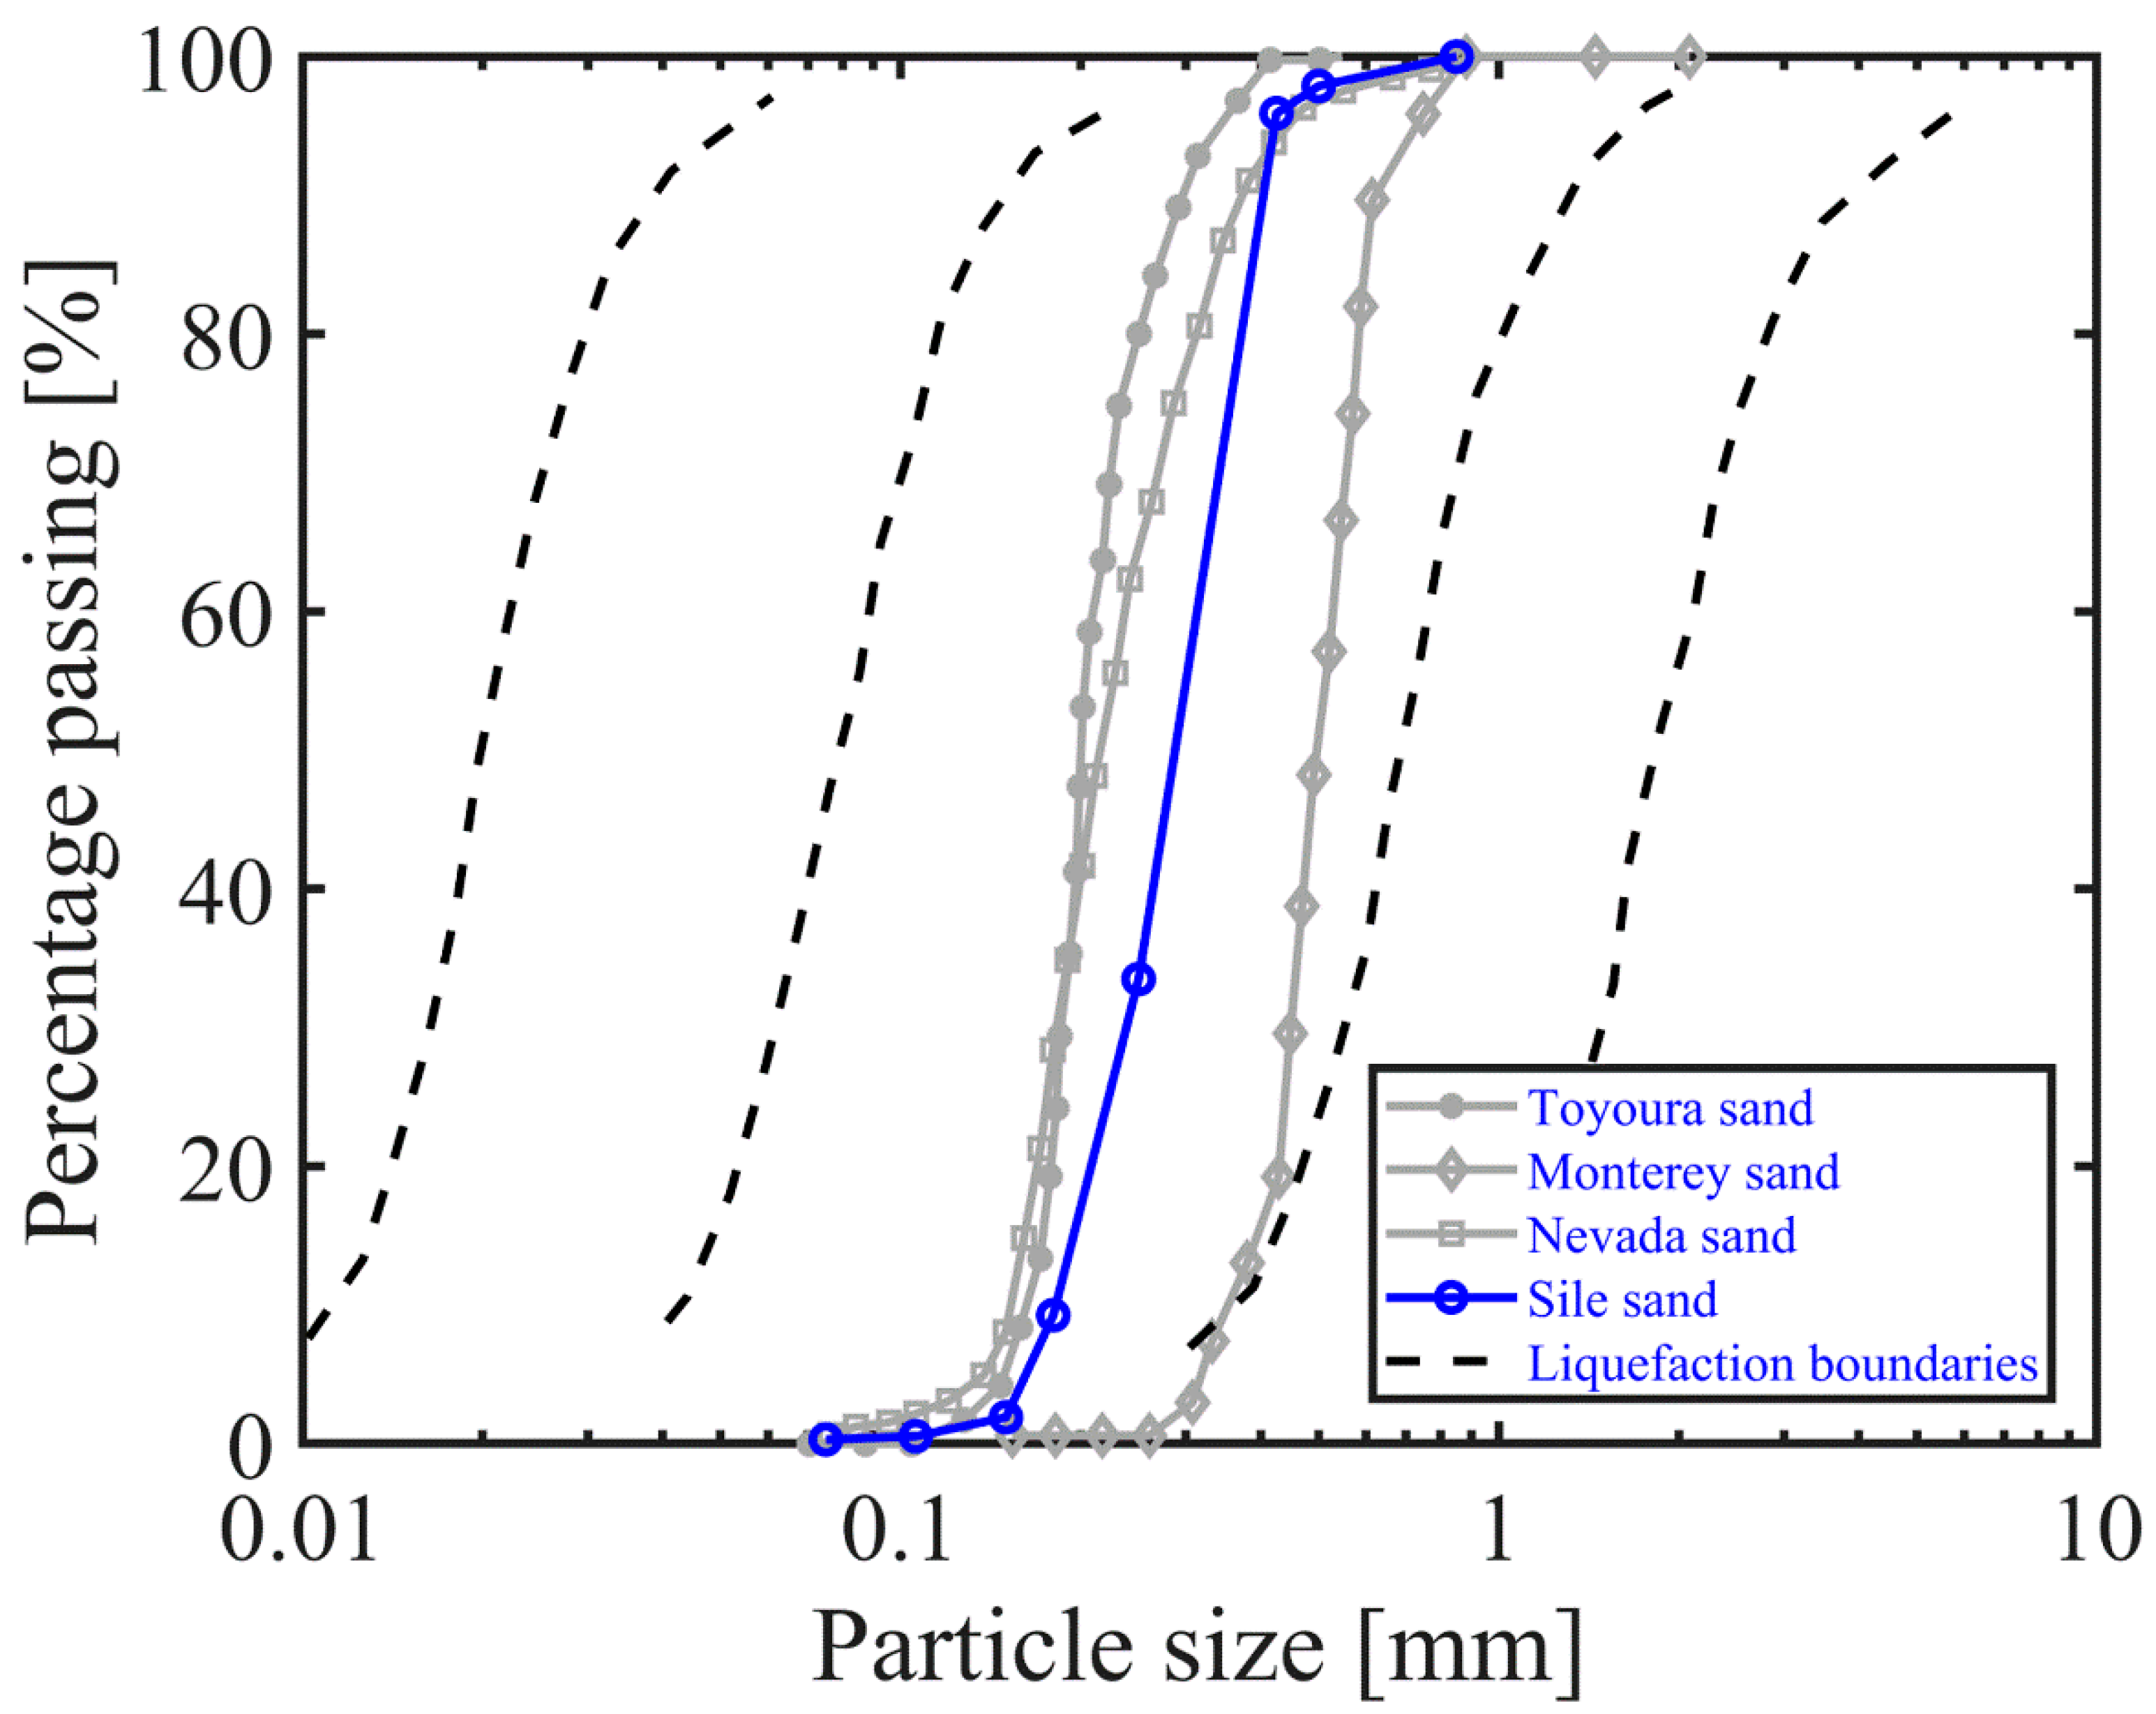
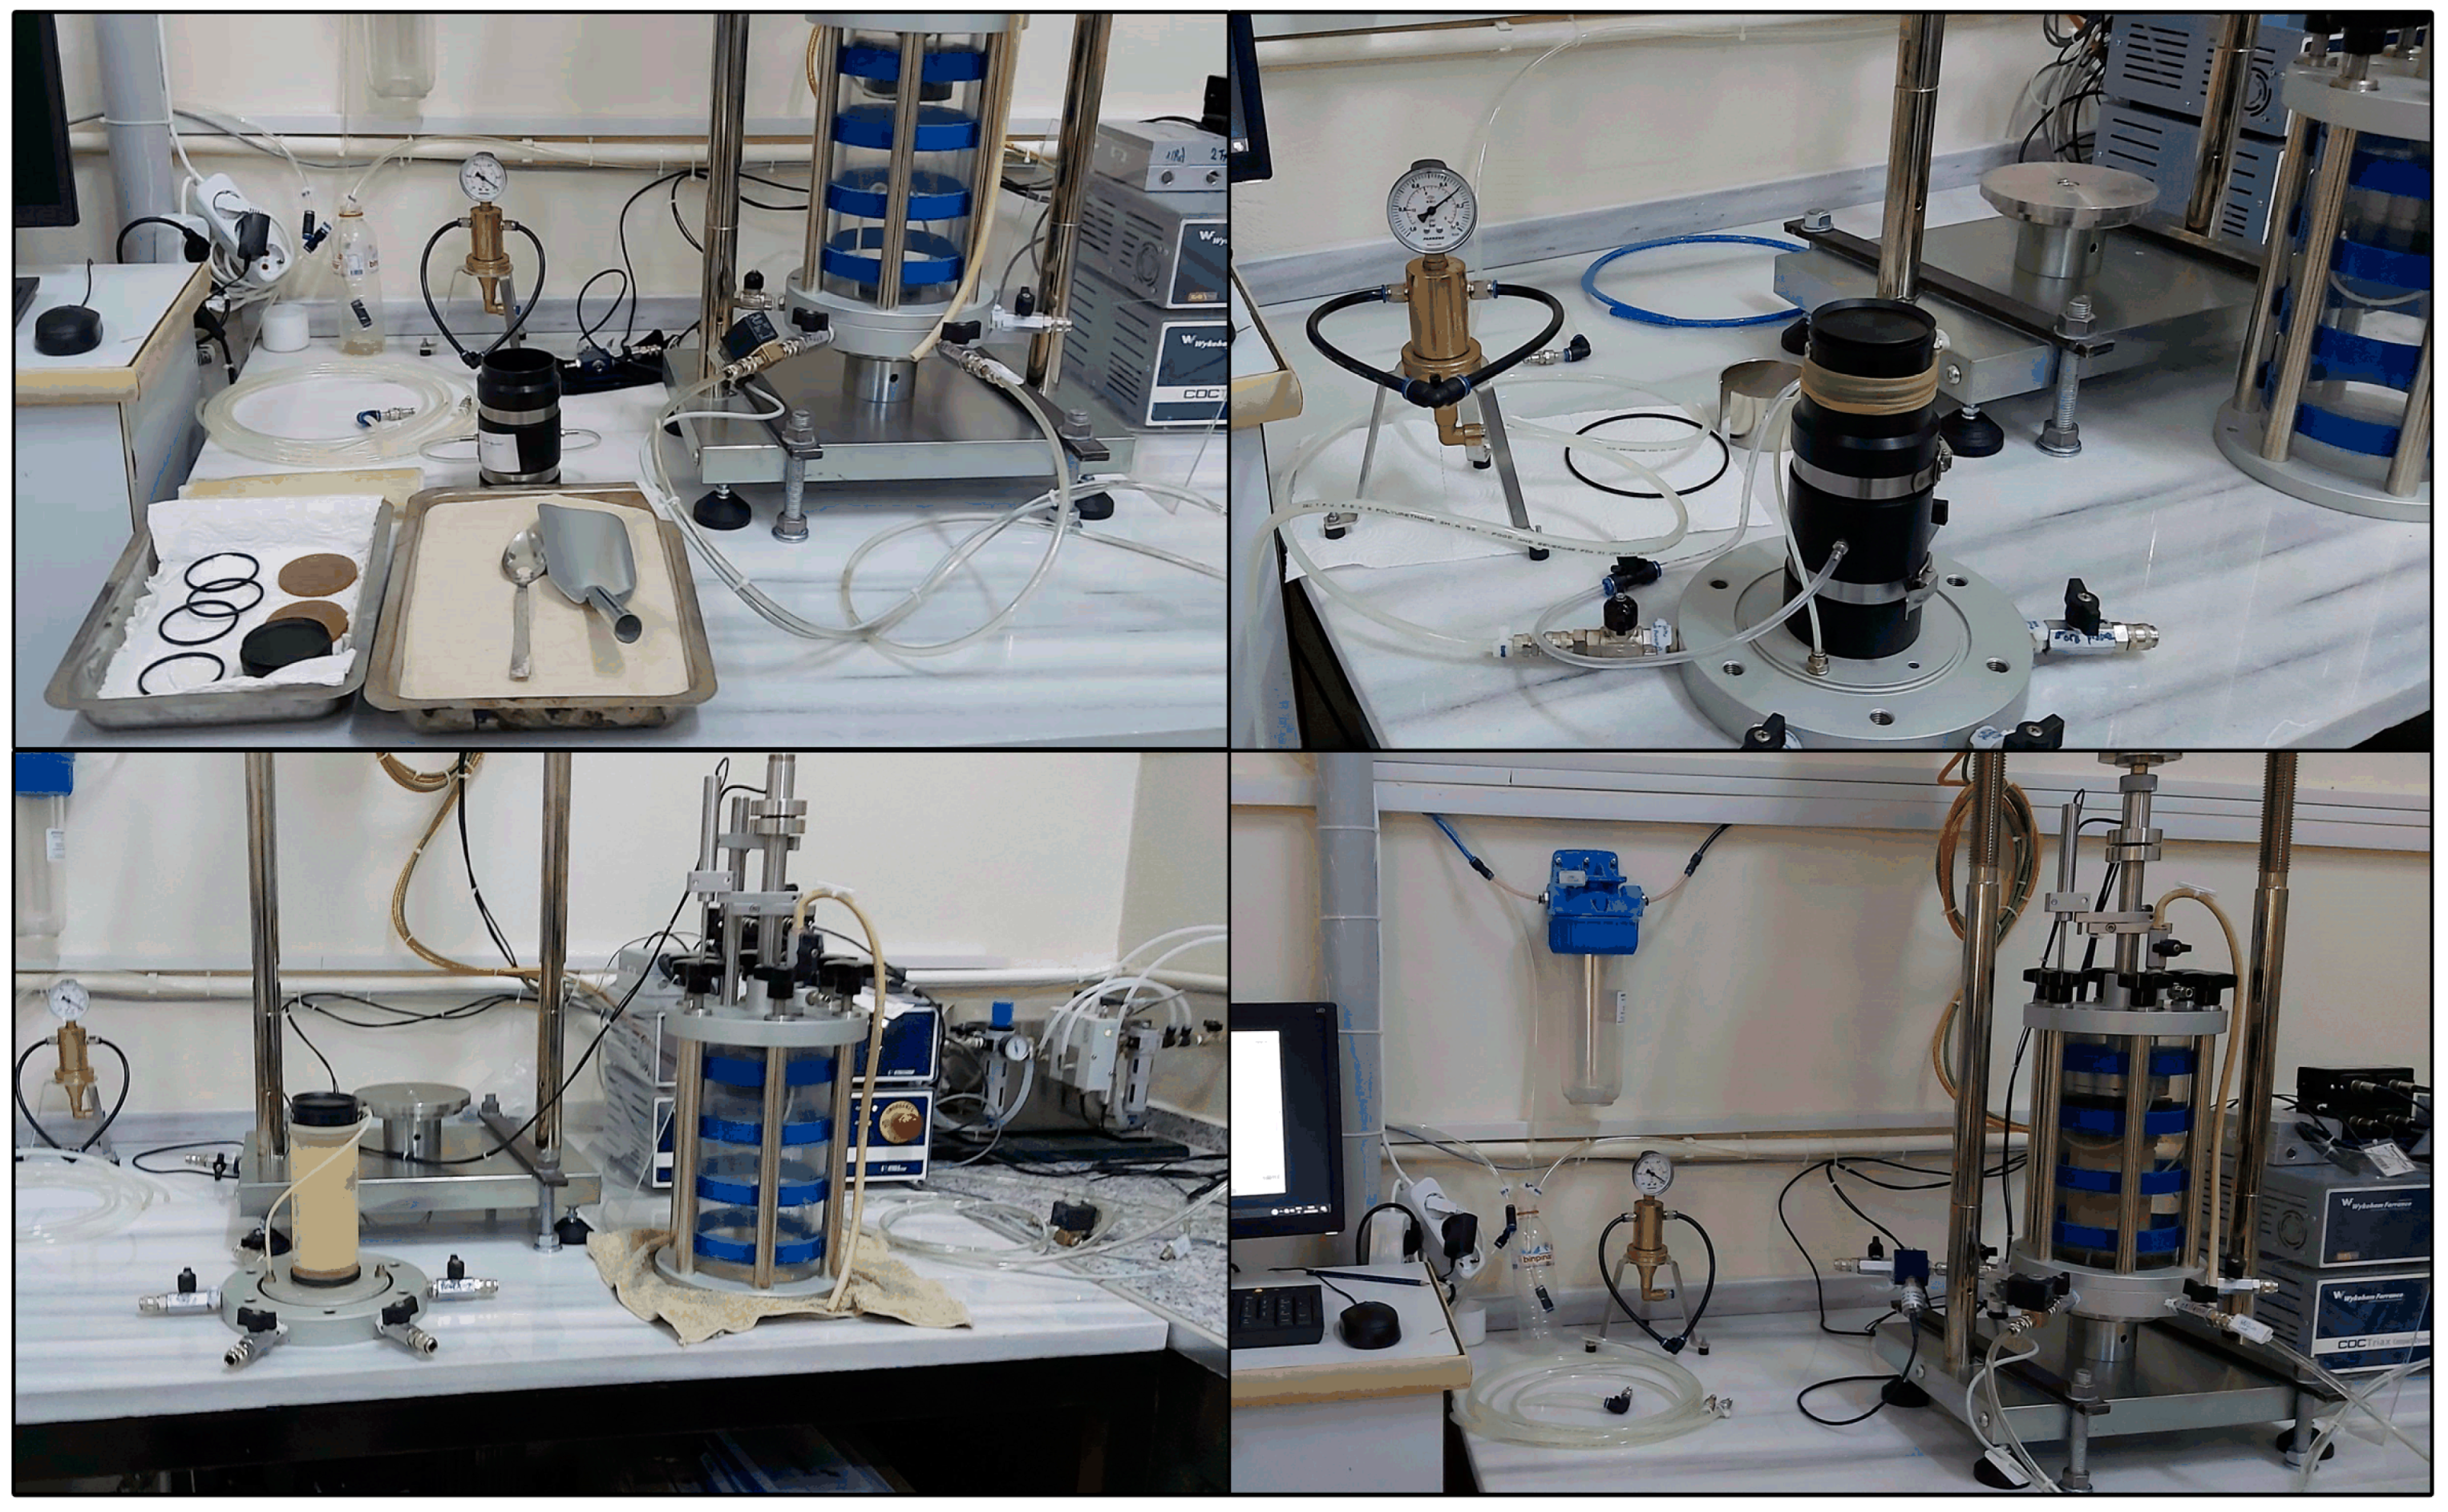
3.1. Testing Device and Test Material

The dynamic triaxial experiments were conducted at Mus Alparslan University using a fully automated test system (Dynatriax EmS). The triaxial apparatus was manufactured by Wykeham Farrance—Controls Groups (Milan, Italy); its main components are shown in Figure 1.
The electromechanical actuator of the Dynatriax EmS system has a 15 kN dynamic load capacity, and the system is capable of producing loading cycles with various wave shapes (e.g., sinusoidal) with frequencies ranging from 0.01 to 10 Hz. The software and data-acquisition system of the equipment provides automatic and effective control of the saturation, consolidation, and cyclic-shearing stages of the triaxial tests. The basic instrumentation of the system consists of a submersible load cell (with a 0–25 kN measurement range and accuracy of ±0.05% FS); pressure transducers that measure the pore water, cell, and back pressure (0–1000 kPa measurement range and accuracy of ±0.25% FS); external displacement transducers (±25 mm measurement range and accuracy of 0.2% FS); and a 100 cc automatic volume-change device (precision of ±0.1 cc). The instruments were periodically calibrated to minimize the uncertainties of the measurements made during the test program.
The triaxial specimens were prepared using Sile sand (AFS 55/60). Figure 2 presents the particle size distribution (PSD) curve of this sand and its comparison with different types of sand that are widely used in geotechnical laboratories around the world. Based on the liquefaction boundaries of Tsuchida [52], it is a highly liquefiable soil. The index properties of Sile sand are given in Table 1.

3.2. Specimen Preparation

In this study, nearly/fully saturated and partially saturated sand specimens with a height/diameter ratio of about 2 were prepared in loose or dense conditions. For the cylindrical triaxial specimens, a porous stone and filter paper was positioned in the bottom part of the cell (base pedestal), and a rubber latex membrane was installed using a pair of O-rings. A rigid split mold (140 mm in height and 70 mm in diameter) was used to support the specimens. Suction was applied with a vacuum pump to remove air between the membrane and mold and to hold them together. The reconstituted, uniform, dry sand specimens were prepared inside the mold. The air (dry)-pluviation method was used for the loose specimens, while the dry-tamping method was chosen for the densely packed sand specimens. A filter paper, porous stone, and top adaptor (cap) were placed over the specimens, and membrane ends were sealed with another pair of O-rings. Vacuum pressure (e.g., 20 kPa) was applied to the specimens so that they could stand up by themselves and remain undeformed following the removal of the split mold. The triaxial cell was carefully lowered over the specimens and filled with water. The specimens were kept under suction until an effective confining stress of 20 kPa was applied by increasing the cell pressure. Figure 3 shows examples of test images recorded during the specimen preparation.
For the nearly/fully saturated sand tests, the dry specimens set in the triaxial cell and subjected to effective confining stress of 20 kPa were flushed with carbon dioxide gas. This process was repeated with de-aired water. For the partially saturated sand tests, the dry specimens under an effective confining stress of 20 kPa were flushed with a known volume of sodium percarbonate–water solution. This solution was prepared by mixing finely powdered sodium percarbonate with de-aired water in specified ratios. The chemical compound of sodium percarbonate reacted with water (for 1 day) and generated oxygen bubbles inside the pore spaces of specimens, which produced a partially saturated condition. The degree of saturation ( S r ) of the specimens was adjusted by changing the initial concentration of the solution. Details of the specimen-preparation procedure in partially saturated sands were elaborated in Zeybek [57].

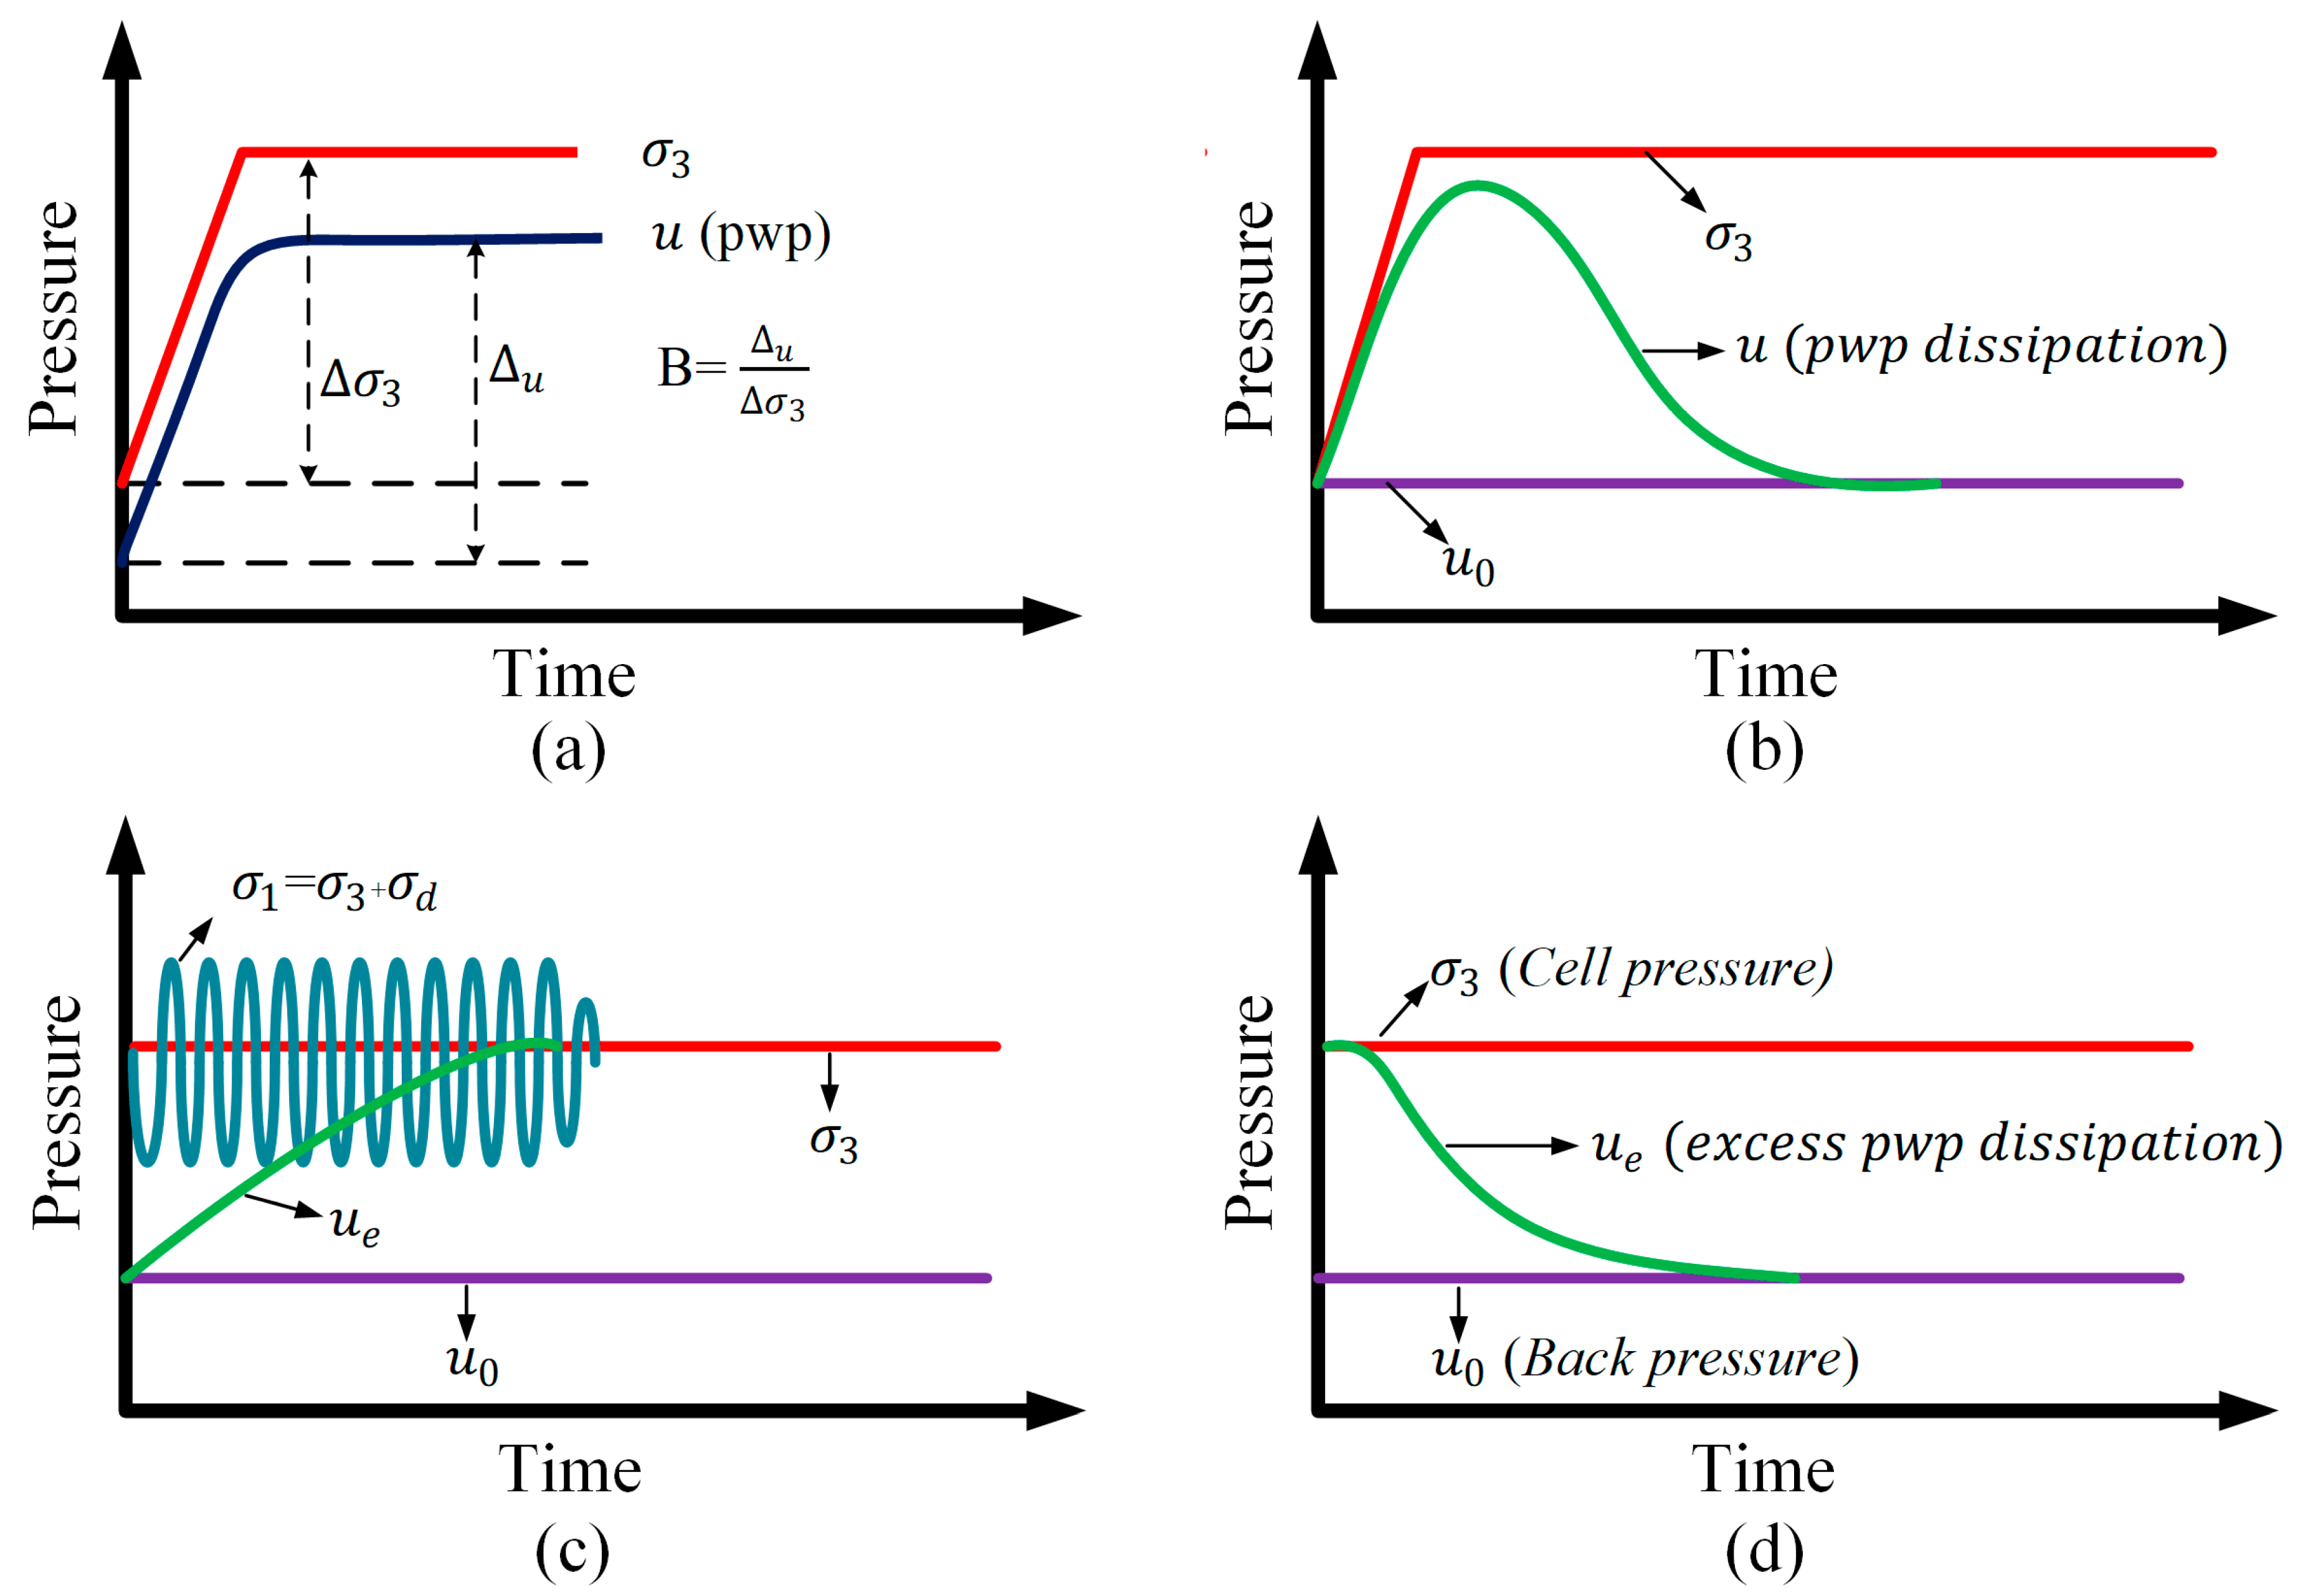
3.3. Testing Stages and Test Program

The specimens were saturated using the back-pressure method in which the cell and back pressures were steadily increased with a 10 kPa difference (Figure 4a). The back pressures ( u 0 ) applied to the nearly fully saturated sand specimens were high (300–400 kPa), while they were relatively low (100–200 kPa) for the partially saturated sand specimens. The final B values (Skempton’s pore pressure coefficient) were recorded; this was followed by the isotropic consolidation of the specimens (Figure 4b). The effective confining stress ( σ c ) was in the range of 25–100 kPa in the tests. The consolidated specimens were cyclically sheared with a loading frequency of 0.1 Hz (Figure 4c). The applied cyclic-stress ratios ( C S R ) ranged from 0.1 to 0.45 depending on the test requirements. The cyclic loading was continued until the excess pore-pressure ratios ( r u ) reached 1. Finally, excess pore pressures were allowed to dissipate (Figure 4d). The experiments were performed following the principles in ASTM, D5311/D5311M-13 [58].
Table 2 and Table 3 present the testing parameters and typical experimental results obtained in the nearly/fully saturated and partially saturated tests. A total of 60 stress-controlled dynamic triaxial tests were conducted in undrained conditions; 16 of these tests were on nearly or fully saturated sand specimens, which provided a benchmark for the assessment of the influential parameters in partially saturated sand behavior. The rest of the 44 tests were carried out on partially saturated sand specimens. The target relative densities ( D r ) were 40% and 85% for the loose and dense specimens, respectively; these were recalculated upon completion of the consolidation of the specimens. The degrees of saturation ( S r ) of the partially saturated specimens were determined using the soil phase relationships while considering the amount of pore fluid leaving and entering the specimens during the saturation and/or desaturation process. Following the back- and cell-pressure ramp, the final degree of saturation was in the range of 99–100% and 79–96% for the nearly/fully saturated and partially saturated sand specimens, respectively.

4. Experimental Results

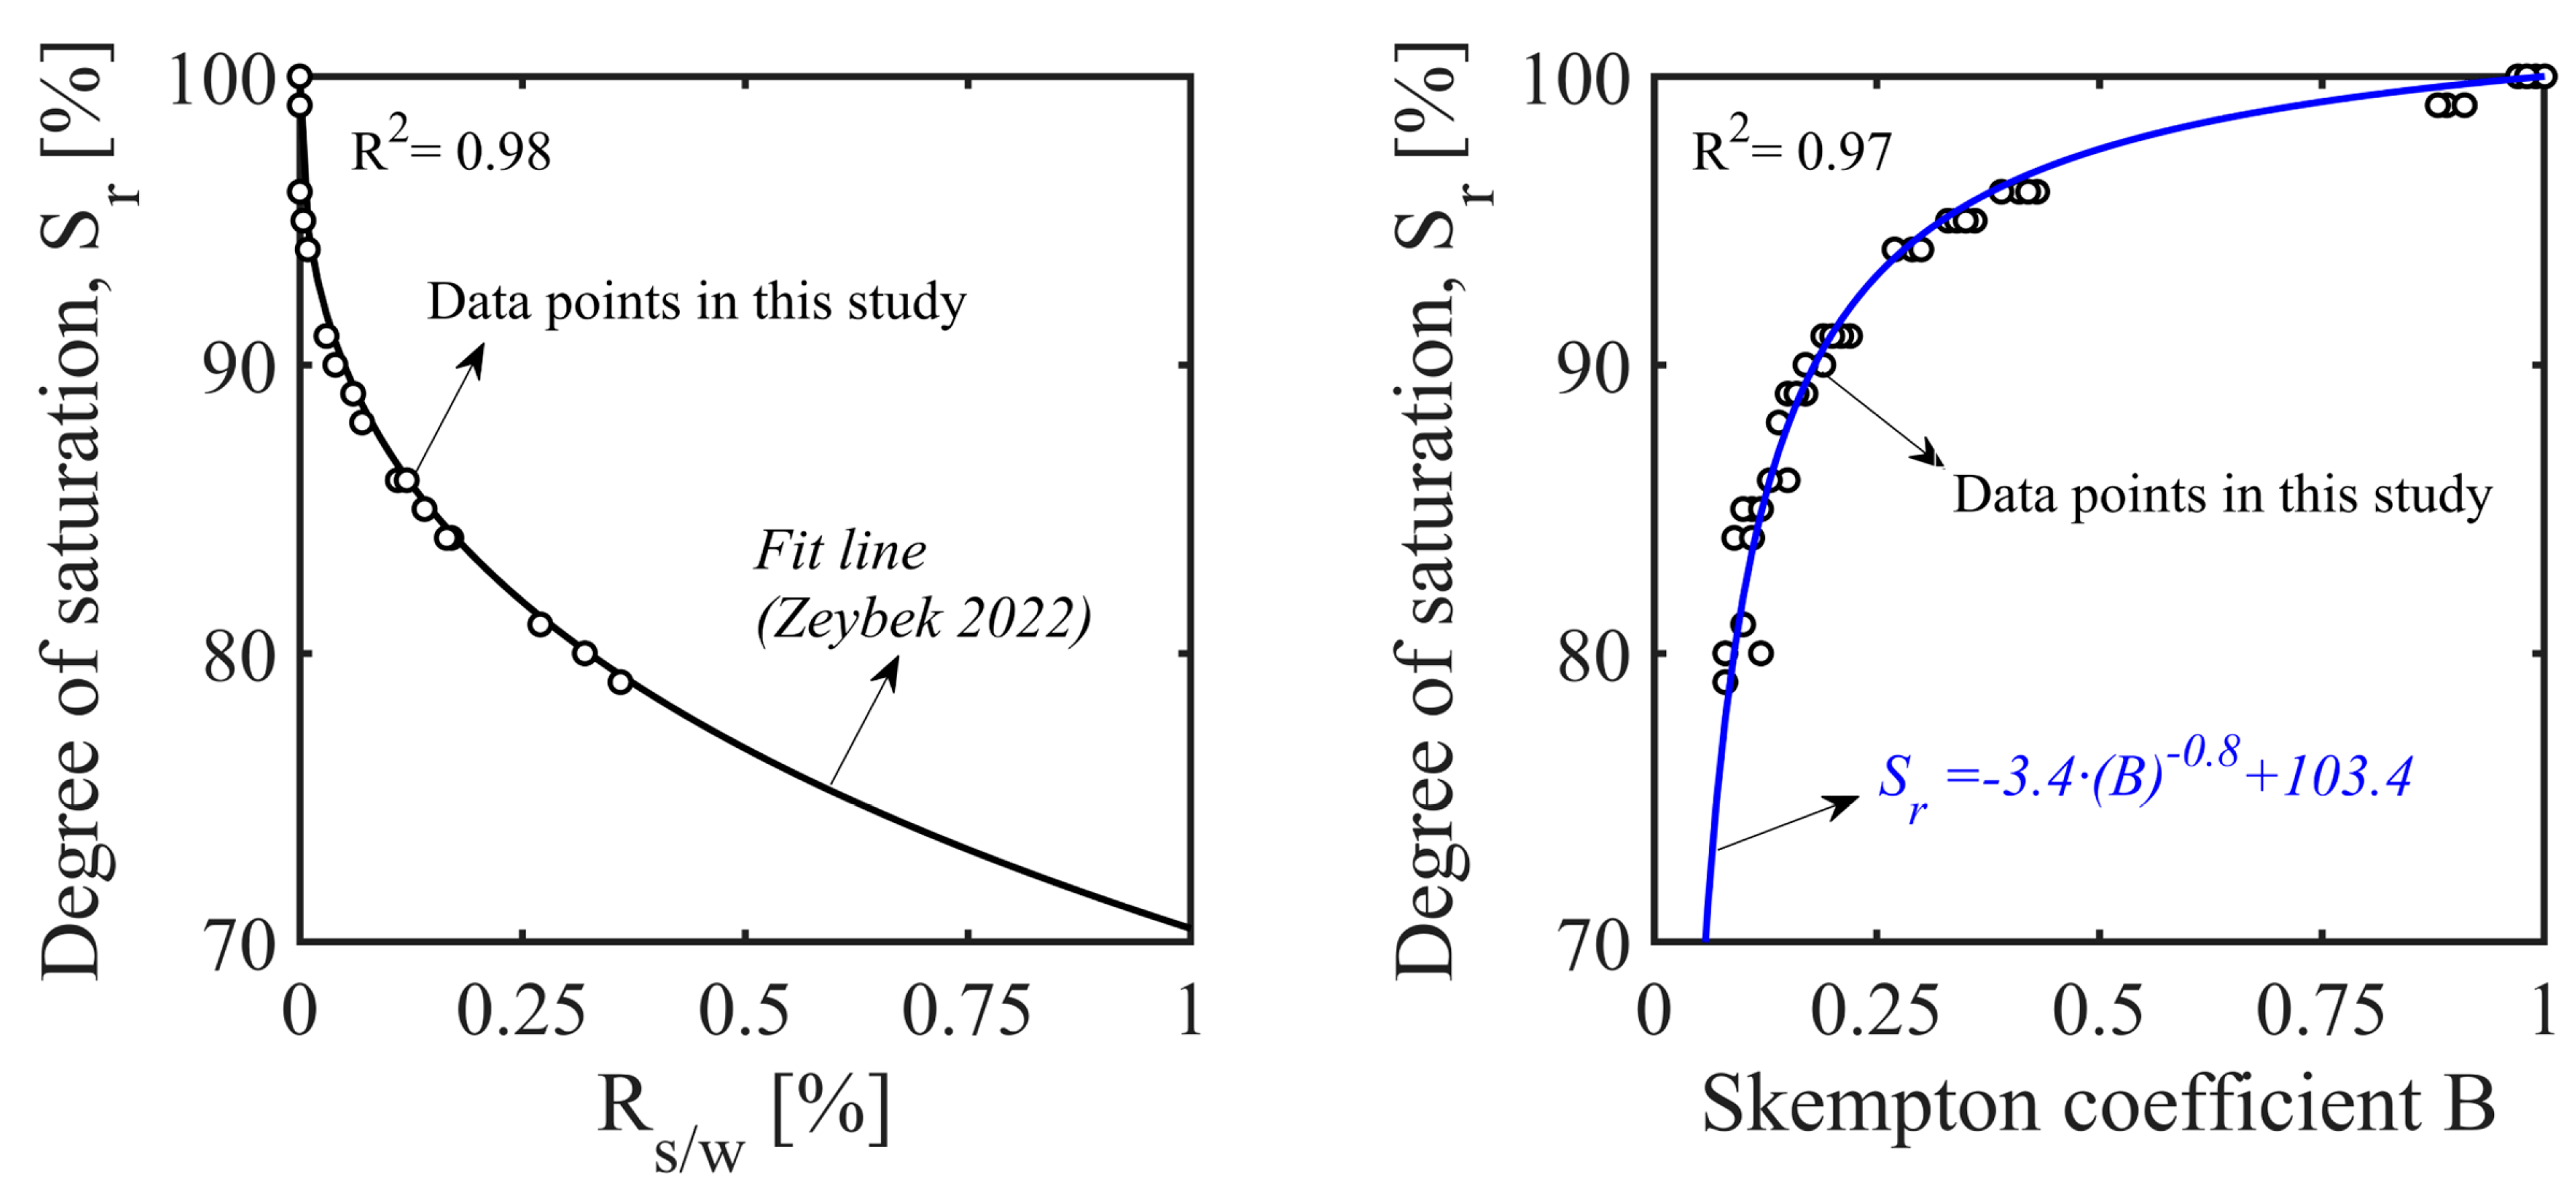
4.1. Relationship between Degree of Saturation and B Parameter

Zeybek [57] conducted a series of beaker tests on partially saturated sand specimens prepared with a sodium percarbonate–water solution and established a correlation between the weight of the sodium percarbonate normalized with that of the de-aired water ( R s / w ) and the degree of saturation ( S r ). The prediction of his empirical equation was compared with the experimental data accomplished in the current study. Figure 5 shows that the degree of saturation ( S r ) was reduced as the sodium percarbonate concentration in the aqueous solution was increased, and this trend was captured well by the empirical relation proposed by Zeybek [57]. Figure 5 also contains a plot of the degree of saturation values against the B measurements that shows a drop in the degree of saturation from nearly 1 to 0.8 as the B value decreased from almost 1 to 0.08; the power function in Equation (7) appeared to provide the best fit line for these datasets.
S r = 3.4 ( B ) 0.8 + 103.4

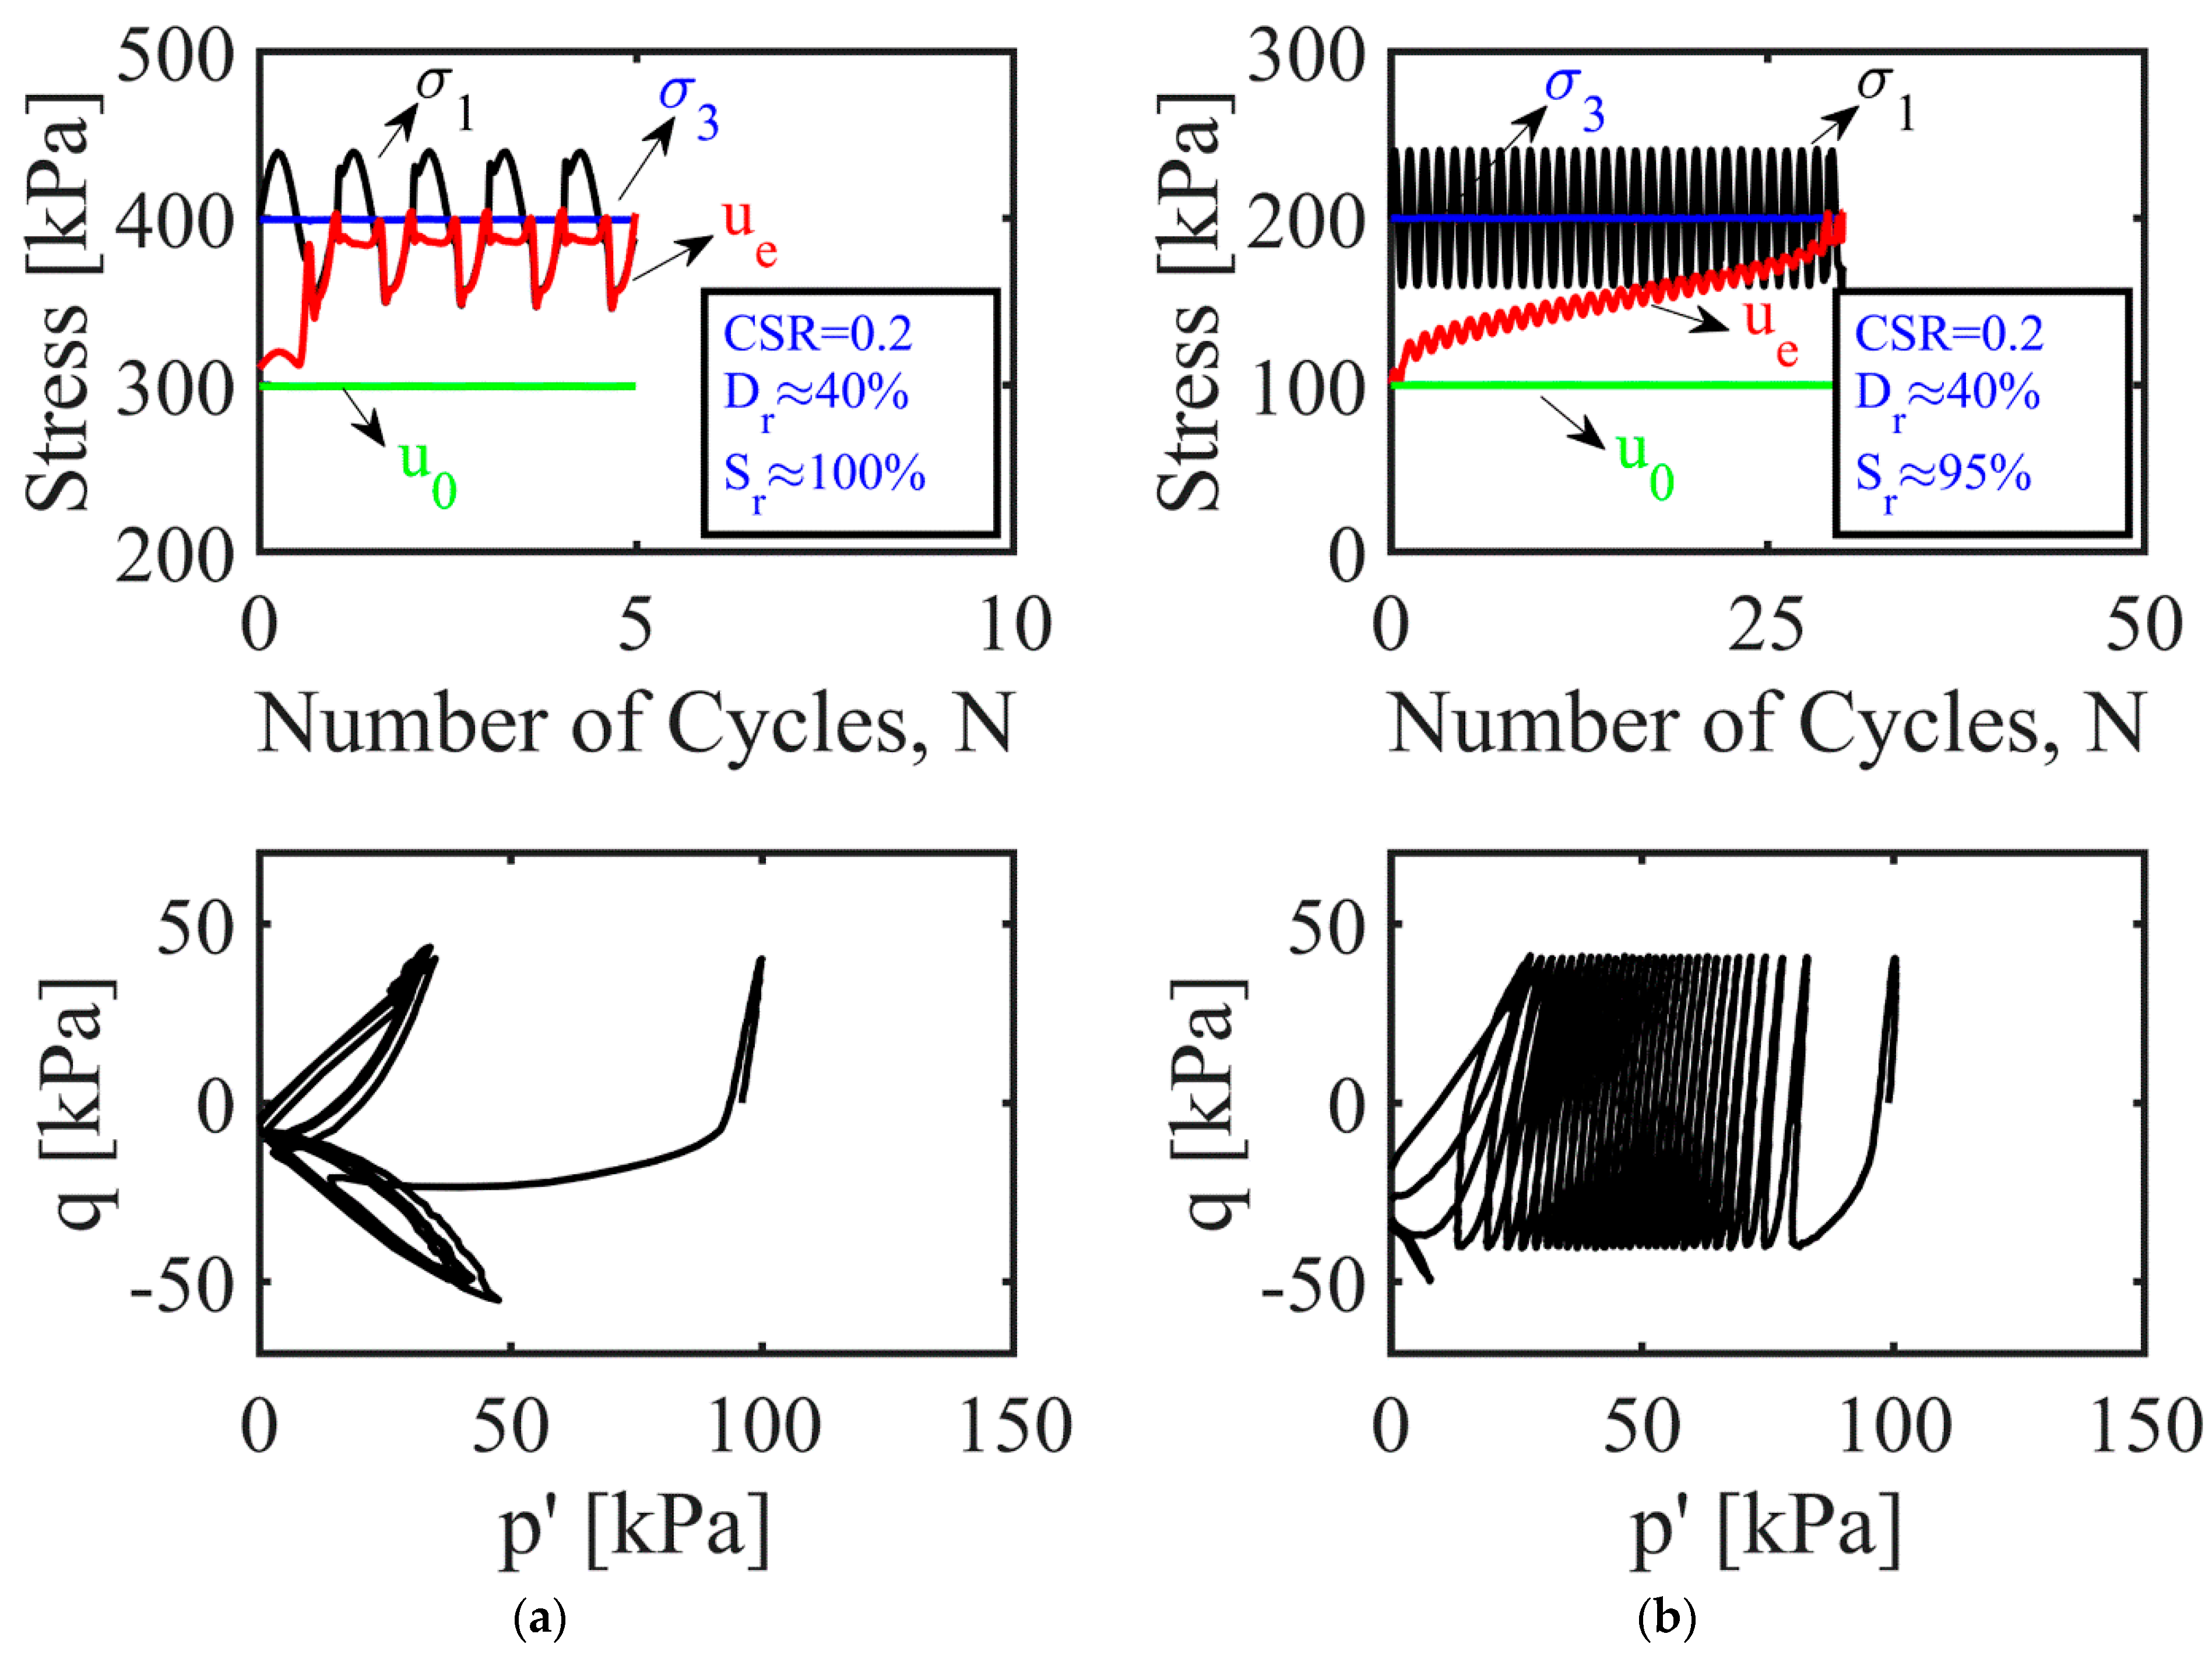
4.2. Excess Pore-Pressure Generation and Stress Degradation

Typical experimental results in terms of excess pore pressure ( u e ) generation and effective stress paths ( q p ) are presented in Figure 6 to show the liquefaction behavior of the nearly/fully and partially saturated sand specimens. The plots on the left-hand side of the figure (Figure 6a) show the triaxial test data for loose, fully saturated sand ( S r 100%) tested under a back pressure of u 0 = 300 kPa and an initial effective confining stress of σ c = 100 kPa. The results on the right-hand side (Figure 6b) correspond to test data for loose, partially saturated sand ( S r 95%) examined under a back pressure of u 0 = 100 kPa and an initial effective confining stress of σ c = 100 kPa. In both cases, the specimens were subjected to a cyclic-stress ratio of C S R = 0.2.
When both sand specimens were cyclically sheared in undrained conditions, the pore pressures accumulated and become almost equal to the initial total stress. The mean effective stresses ( p ) were reduced and approached zero as the excess pore pressures ( u e ) increased and converged up to the initial effective confining stresses, which corresponded to liquefaction ( r u = 1). Under similar loading conditions, the degradation of the mean effective stress was consistently slower, and the number of cycles required for liquefaction ( N l i q ) was consistently larger in the partially saturated sands than their fully saturated counterparts.

4.3. Parameters Affecting Liquefaction Behavior of Partially Saturated Sands

This section presents the liquefaction resistance curves defined by the relationship between the cyclic-stress ratio ( C S R ) and the number of cycles required for liquefaction ( N l i q ) in order to discuss the effects of the initial effective confining stress ( σ c ), degree of saturation ( S r ), back pressure ( u 0 ), and relative density ( D r ) on the sand behavior when subjected to undrained cyclic loading.

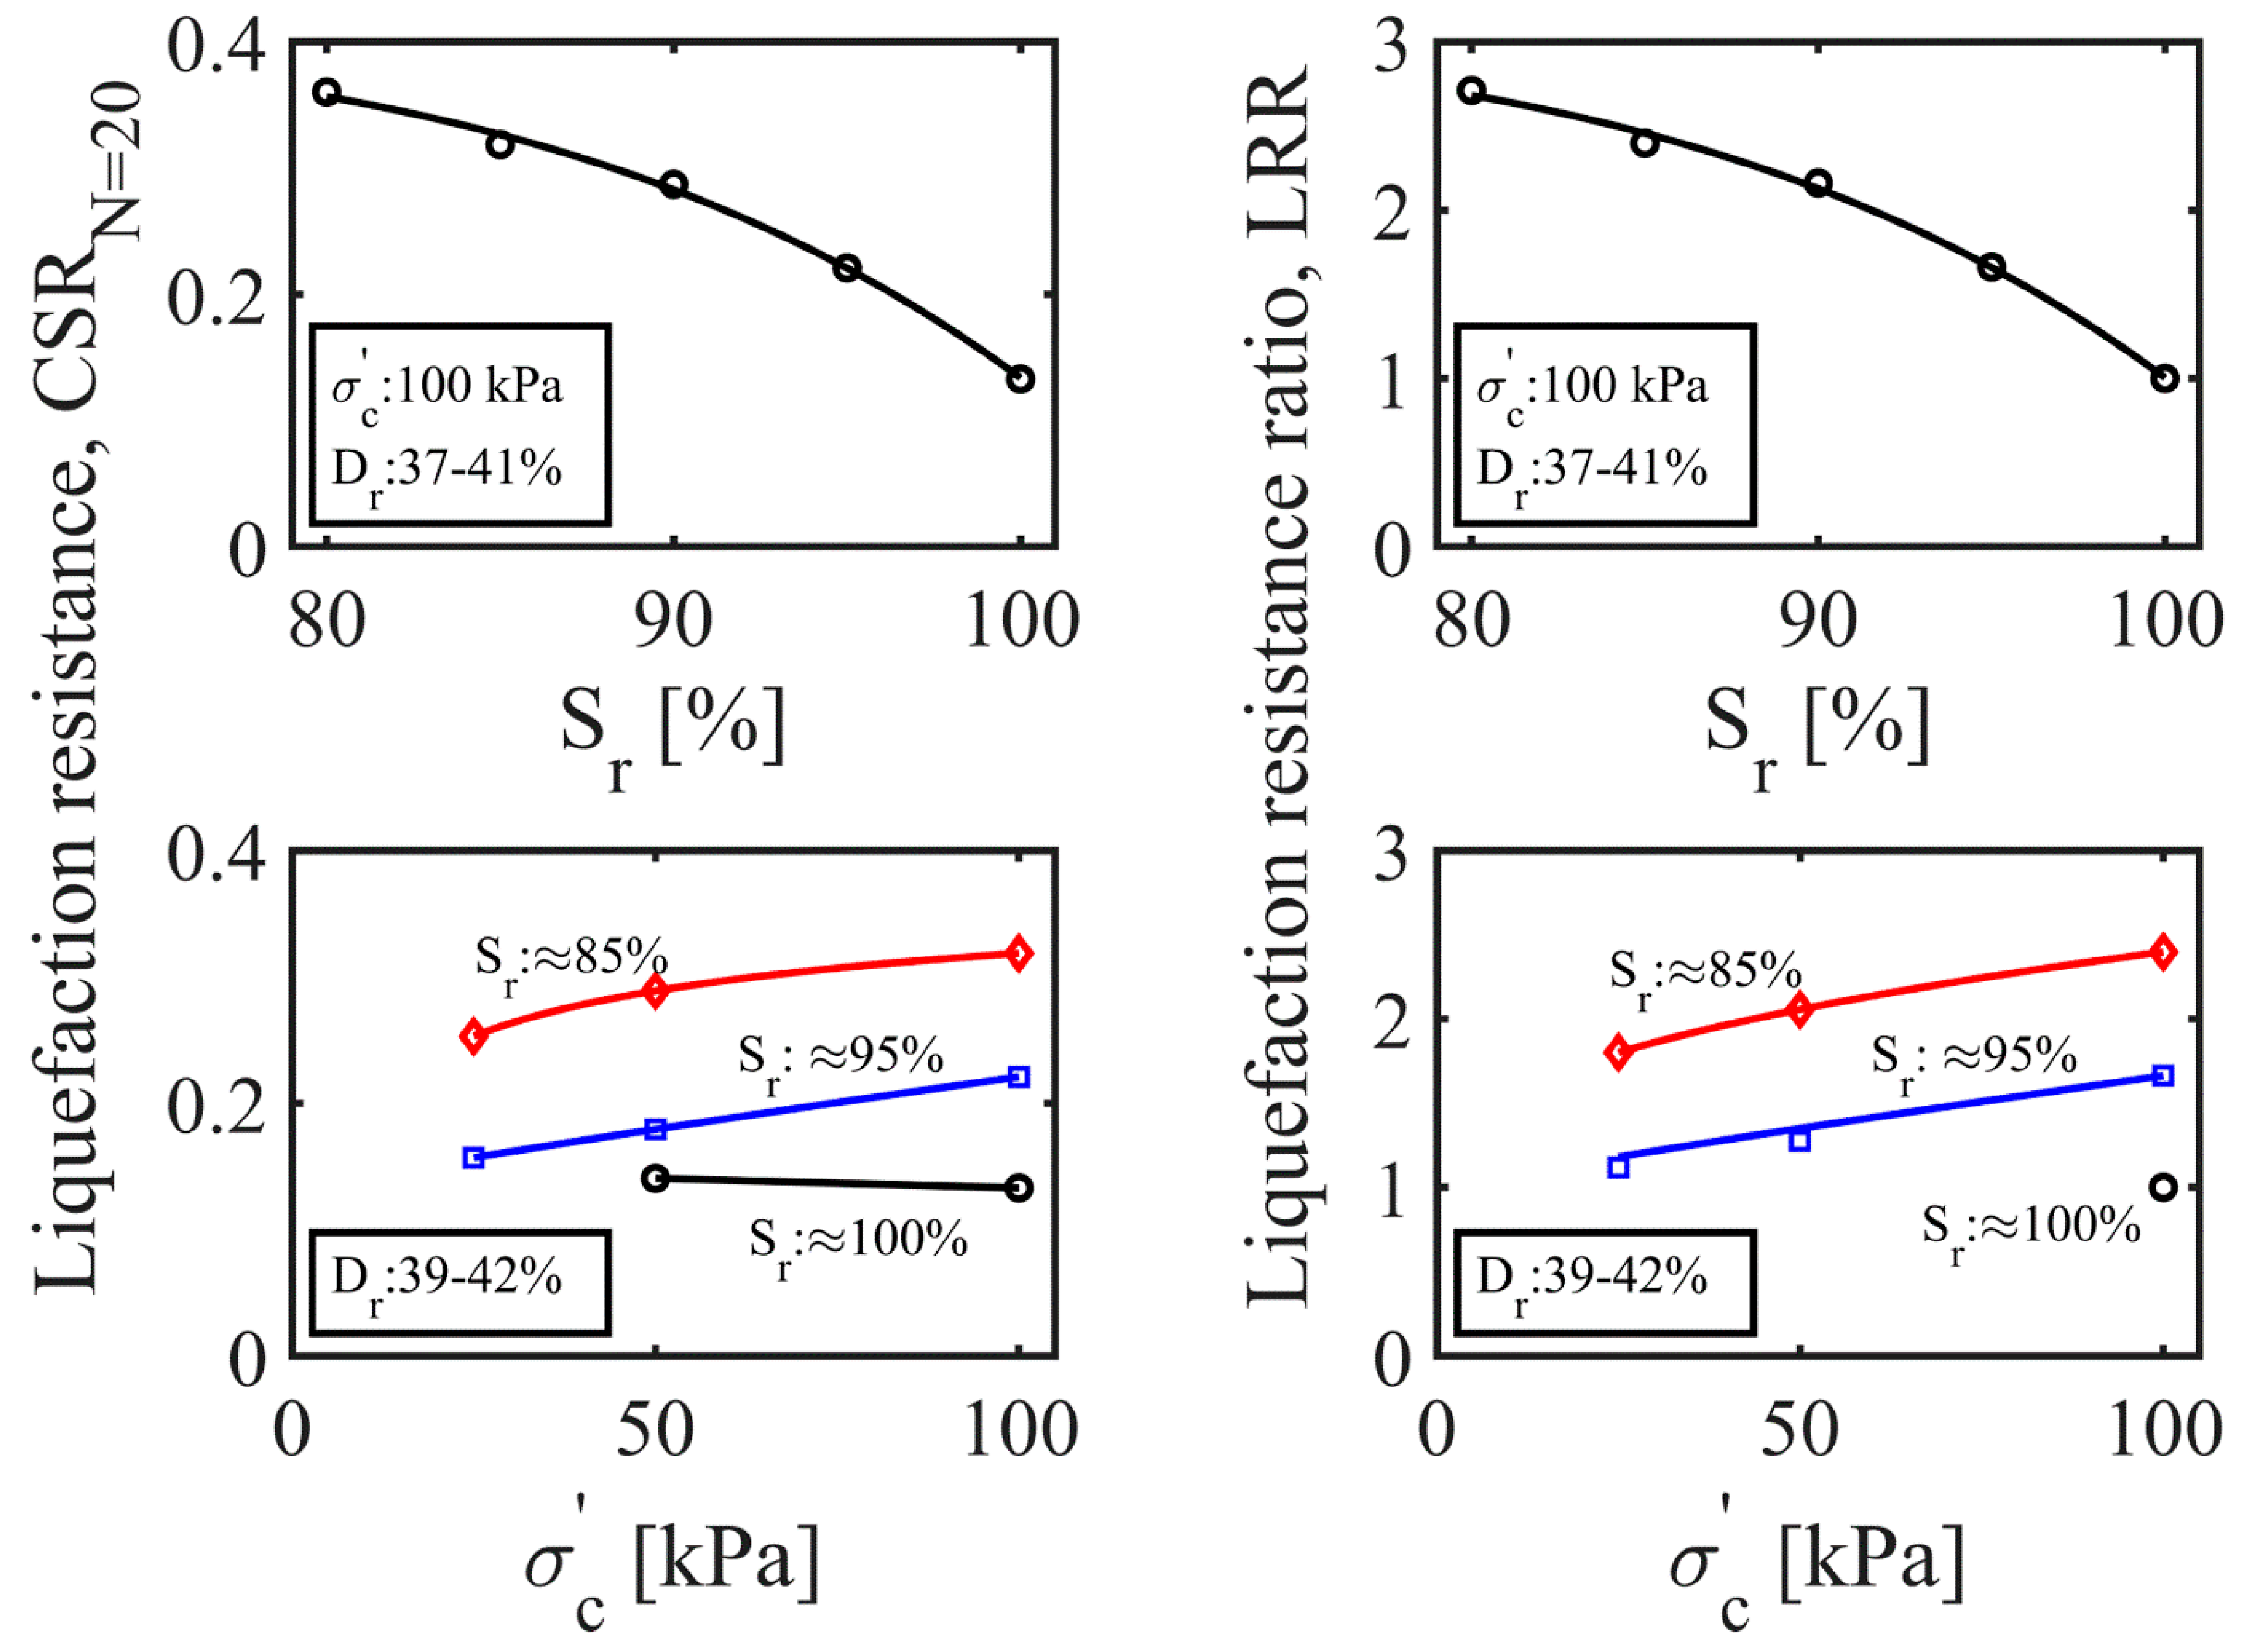
4.3.1. Effective Confining Stress

The effect of the initial effective confining stress on the liquefaction behavior of the sands was examined using the results from the tests in which the sand specimens were isotropically consolidated under different stress levels ( σ c = 25, 50, or 100 kPa) while the other testing parameters (e.g., S r , u 0 , and D r ) were analogous.
Figure 7 shows the liquefaction-resistance curves for the nearly/fully saturated sand specimens. It can be seen that the CSR at a given N l i q decreased as the σ c increased from 50 to 100 kPa. This implied that under comparable loading and experimental conditions, the resistance of the nearly or fully saturated sands to liquefaction was reduced with an increase in the initial effective confining stress. This result agreed with many research findings in the field of soil liquefaction [59,60].
Figure 8 exhibits the cyclic liquefaction-resistance curves obtained from two sets of tests conducted at two different degrees of saturation (e.g., S r = 94–96% and S r = 84–86%). It appeared that for a constant relative density, back pressure, and degree of saturation, the CSR at a specific N l i q increased as the initial effective confining stress was increased from 25 kPa to 100 kPa. This indicated that the partially saturated sand specimens were more resistant to liquefaction at high effective confining stresses. Similar observations were made in previous studies [17,41].

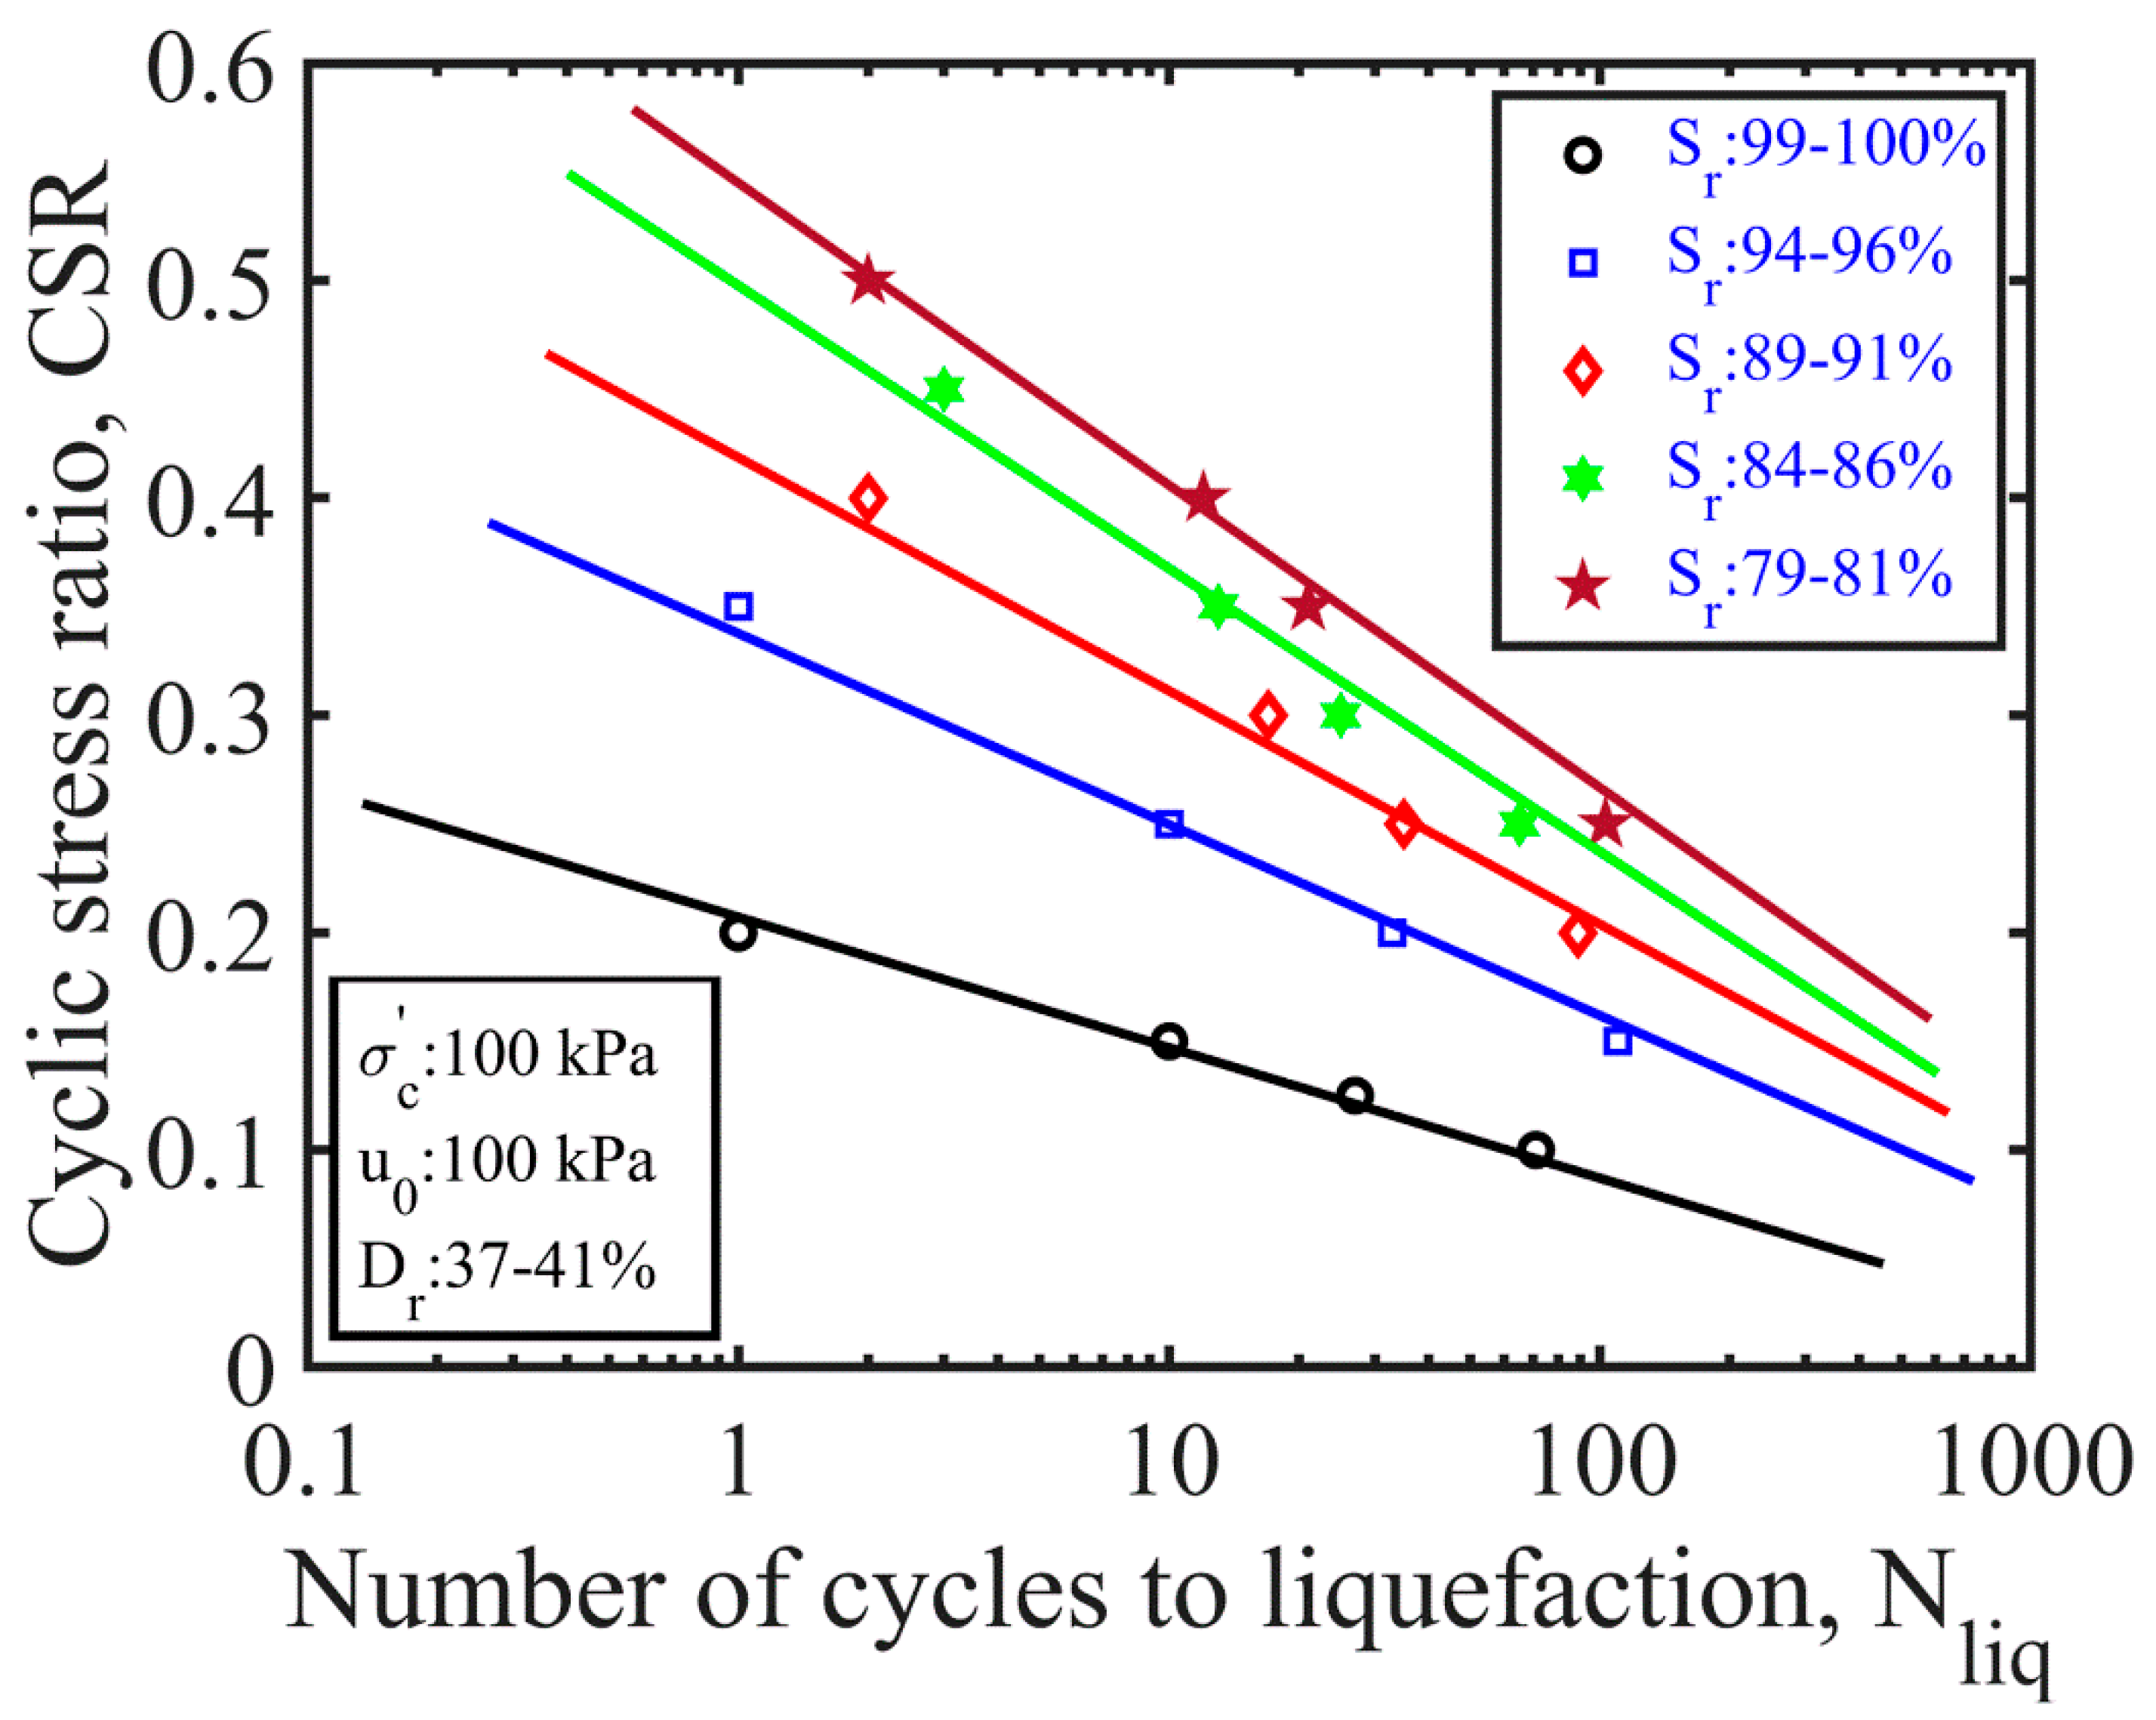
4.3.2. Degree of Saturation

Figure 9 depicts the variation in the C S R with N l i q at different degrees of saturation in the range of 79–100% under a constant relative density, effective confining stress, and back pressure. The cyclic-stress ratios at the same number of cycles were found to increase as the nearly/fully saturated sand specimens were desaturated using the IPS method. Irrespective of the level of saturation, the liquefaction resistance of the partially saturated specimens was larger than that of the nearly/fully saturated specimens. Further improvement in the liquefaction resistance was obtained via a further reduction in the degree of saturation, which was in agreement with previous experimental observations [41,61,62,63].

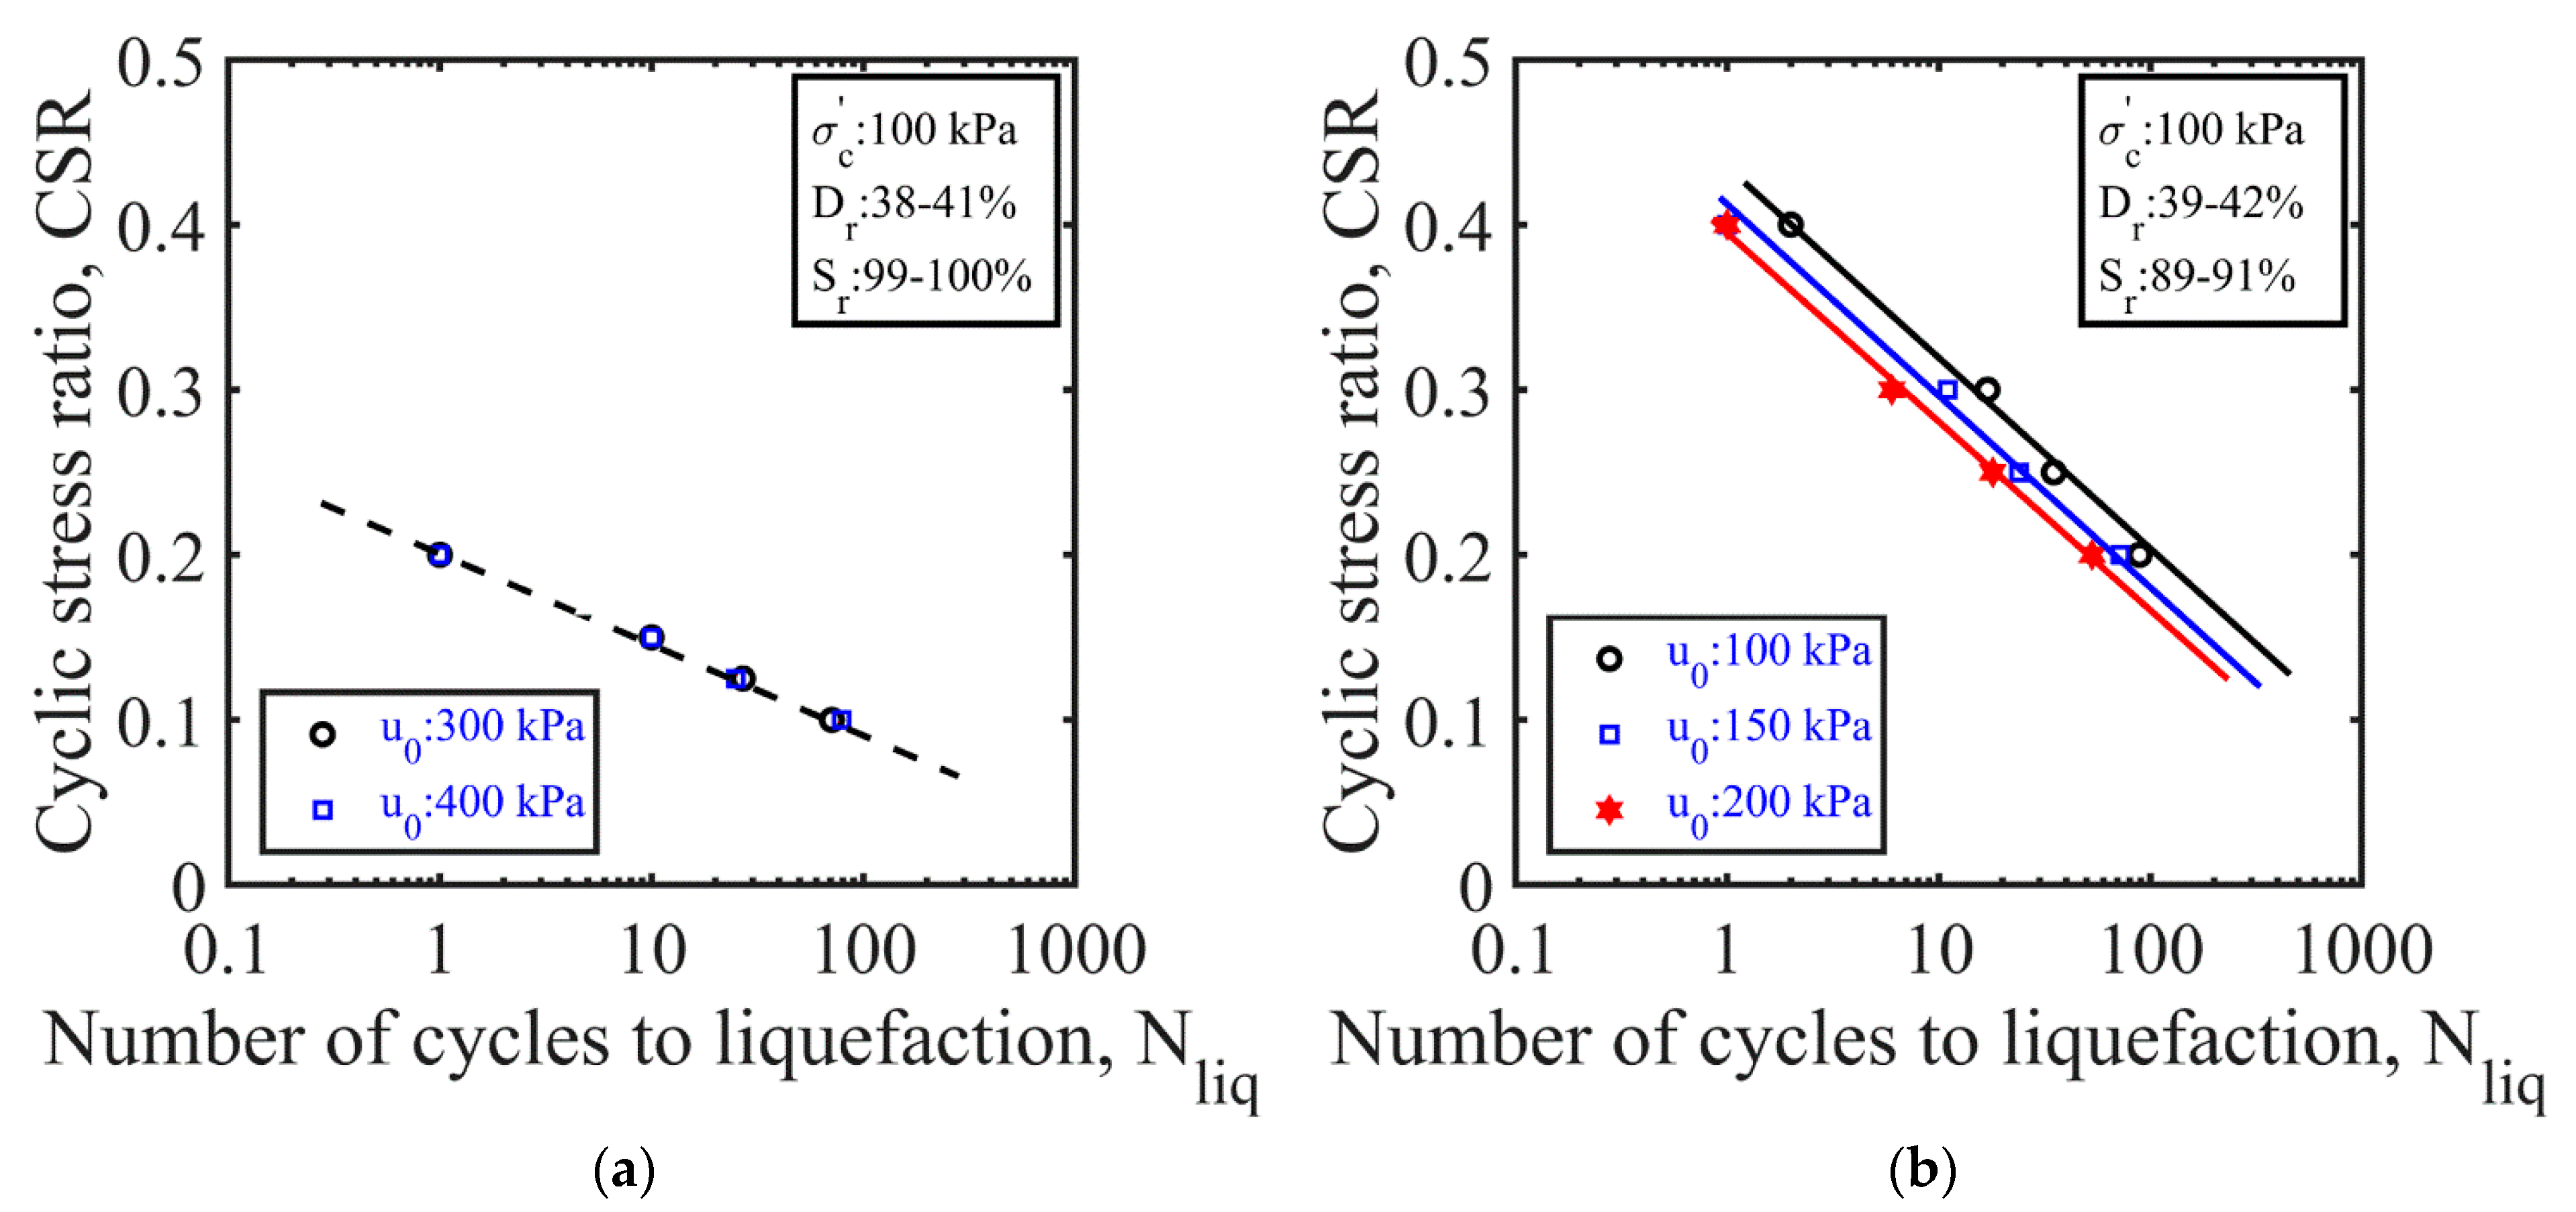
4.3.3. Back Pressure

The C S R - N l i q curves recorded at varying back pressures are presented in Figure 10 to show the effect of the back pressure. The nearly/fully saturated sand specimens tested at back pressures of 300 and 400 kPa showed an almost identical trend, which suggested that the back pressure had an insignificant effect on the liquefaction resistance of such soils. The results of the partially saturated sand tests under back pressures of 100, 150, and 200 kPa showed that back pressure affected the liquefaction behavior of the partially saturated sand specimens, which were observed to exhibit a lower liquefaction resistance at larger back pressures. This again correlated well with the previous findings of researchers [17,41].

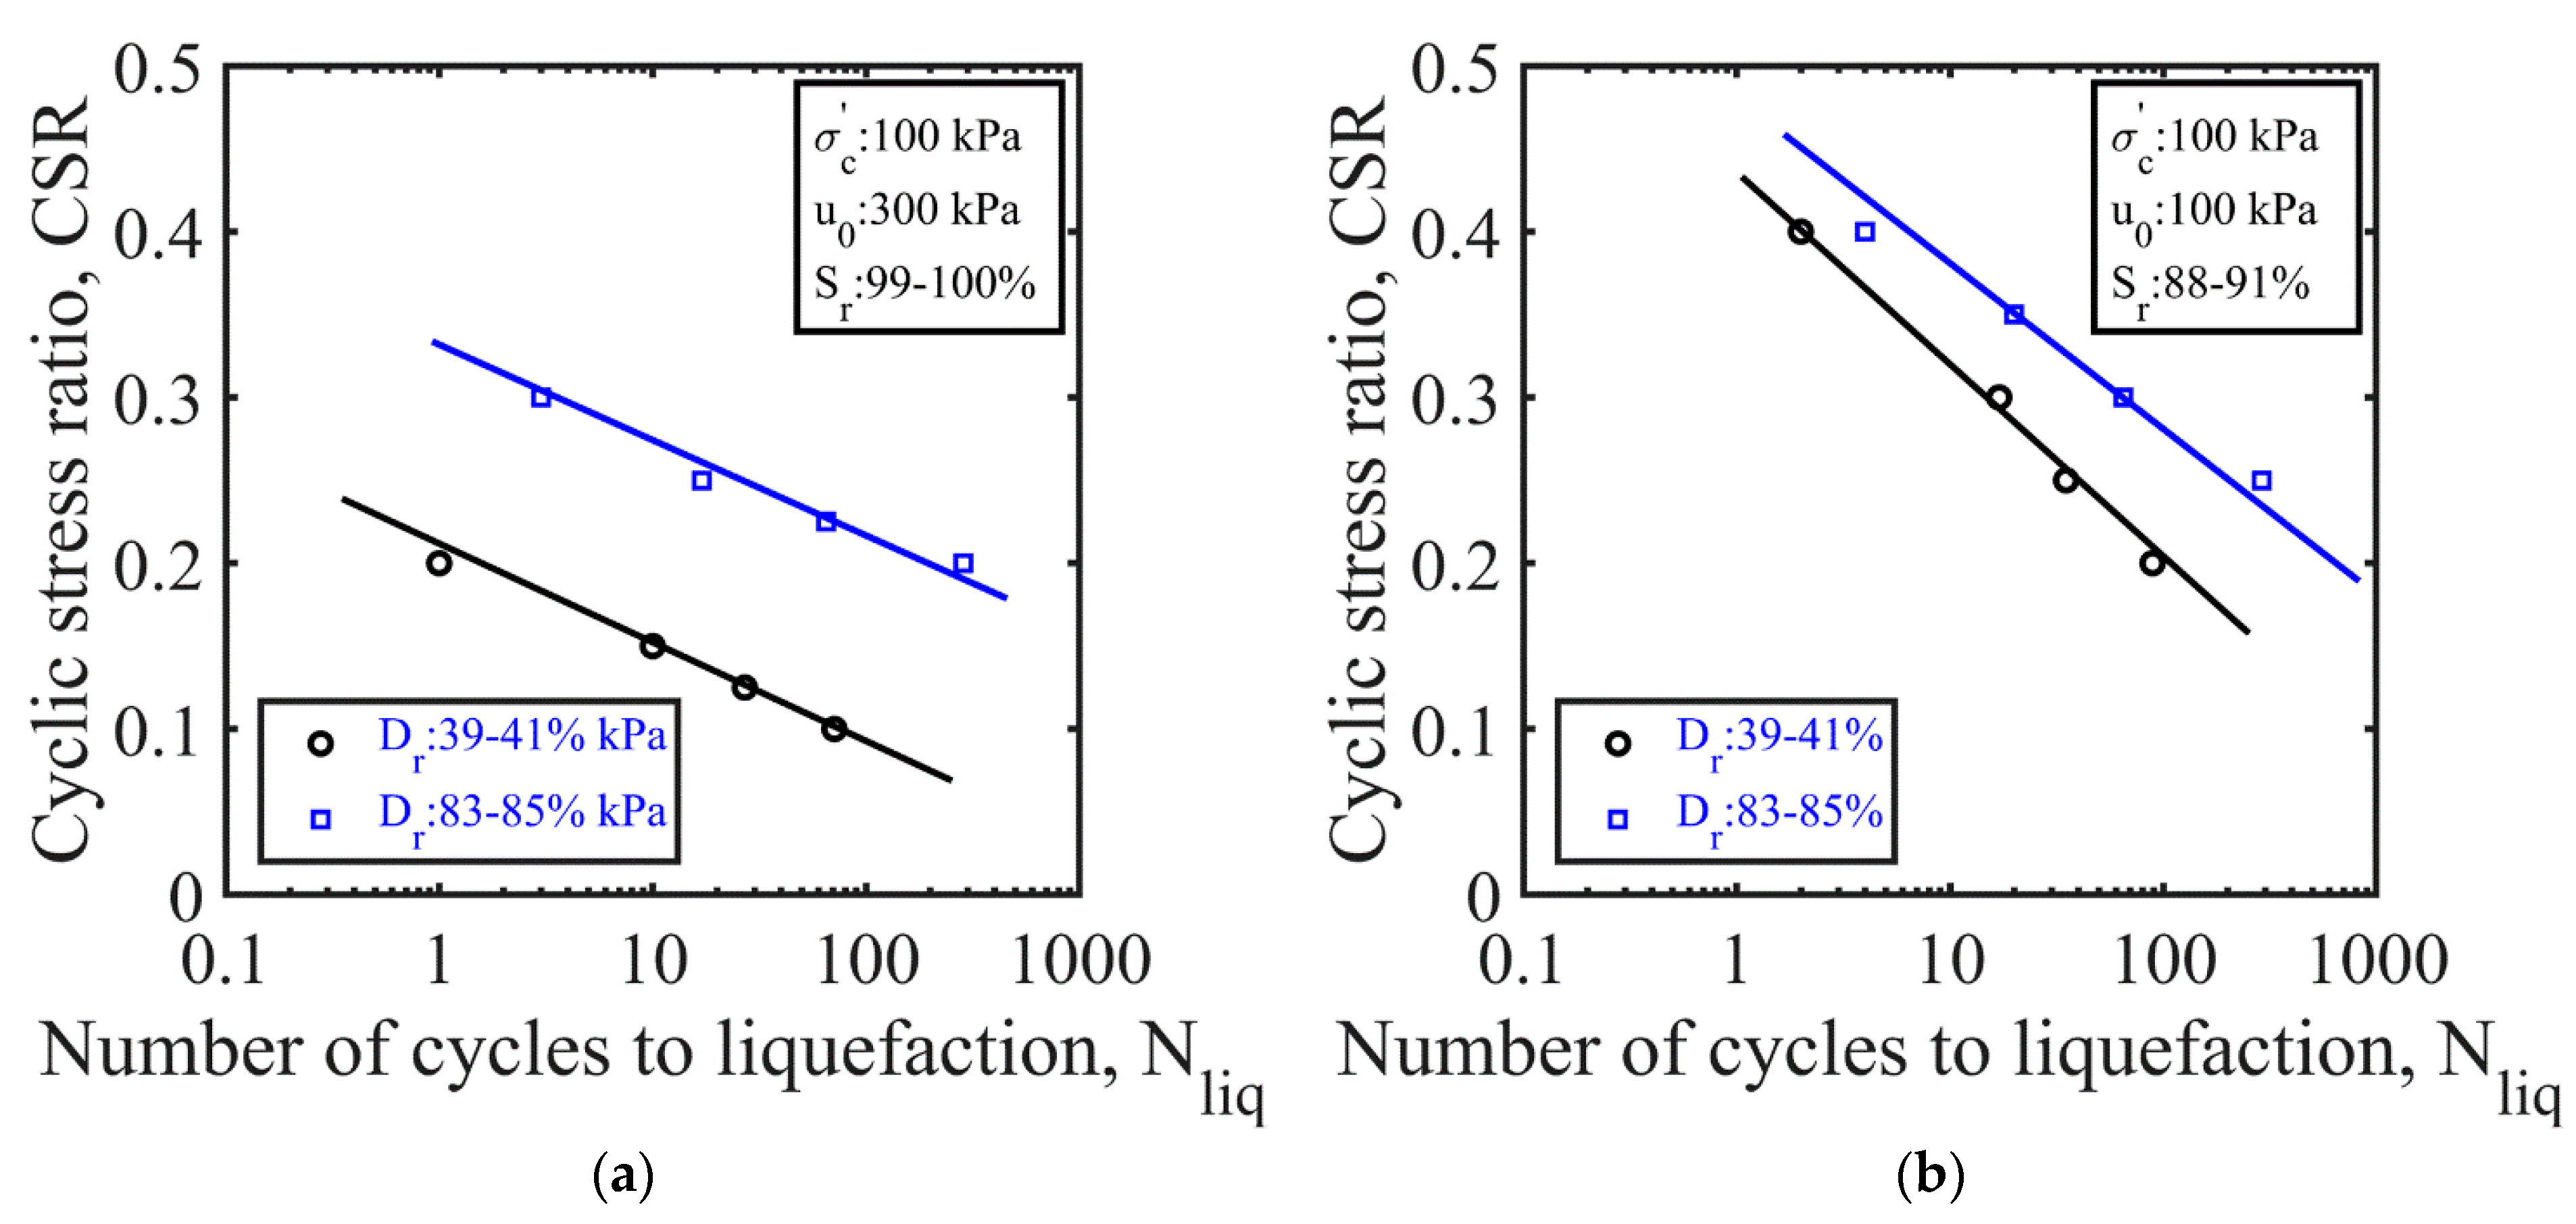
4.3.4. Relative Density

Figure 11 shows the test results obtained in the nearly/fully saturated and partially saturated sand tests conducted at two different relative densities and with the same effective confining stress. Whilst an increase in the relative density caused an increase in the liquefaction resistance of both the nearly/fully saturated and partially saturated sand specimens, this effect was much more pronounced in the former case. The increasing liquefaction resistance of the sand specimens with an increasing relative density can be ascribed to their contraction/dilation tendency. Loose sands have a higher tendency to contract, whereas dense sands show less contractive or dilative behavior. Under comparable test conditions, dense sands tend to generate lower excess pore pressures during undrained cyclic loading, and they exhibit greater liquefaction resistance than loose sands.

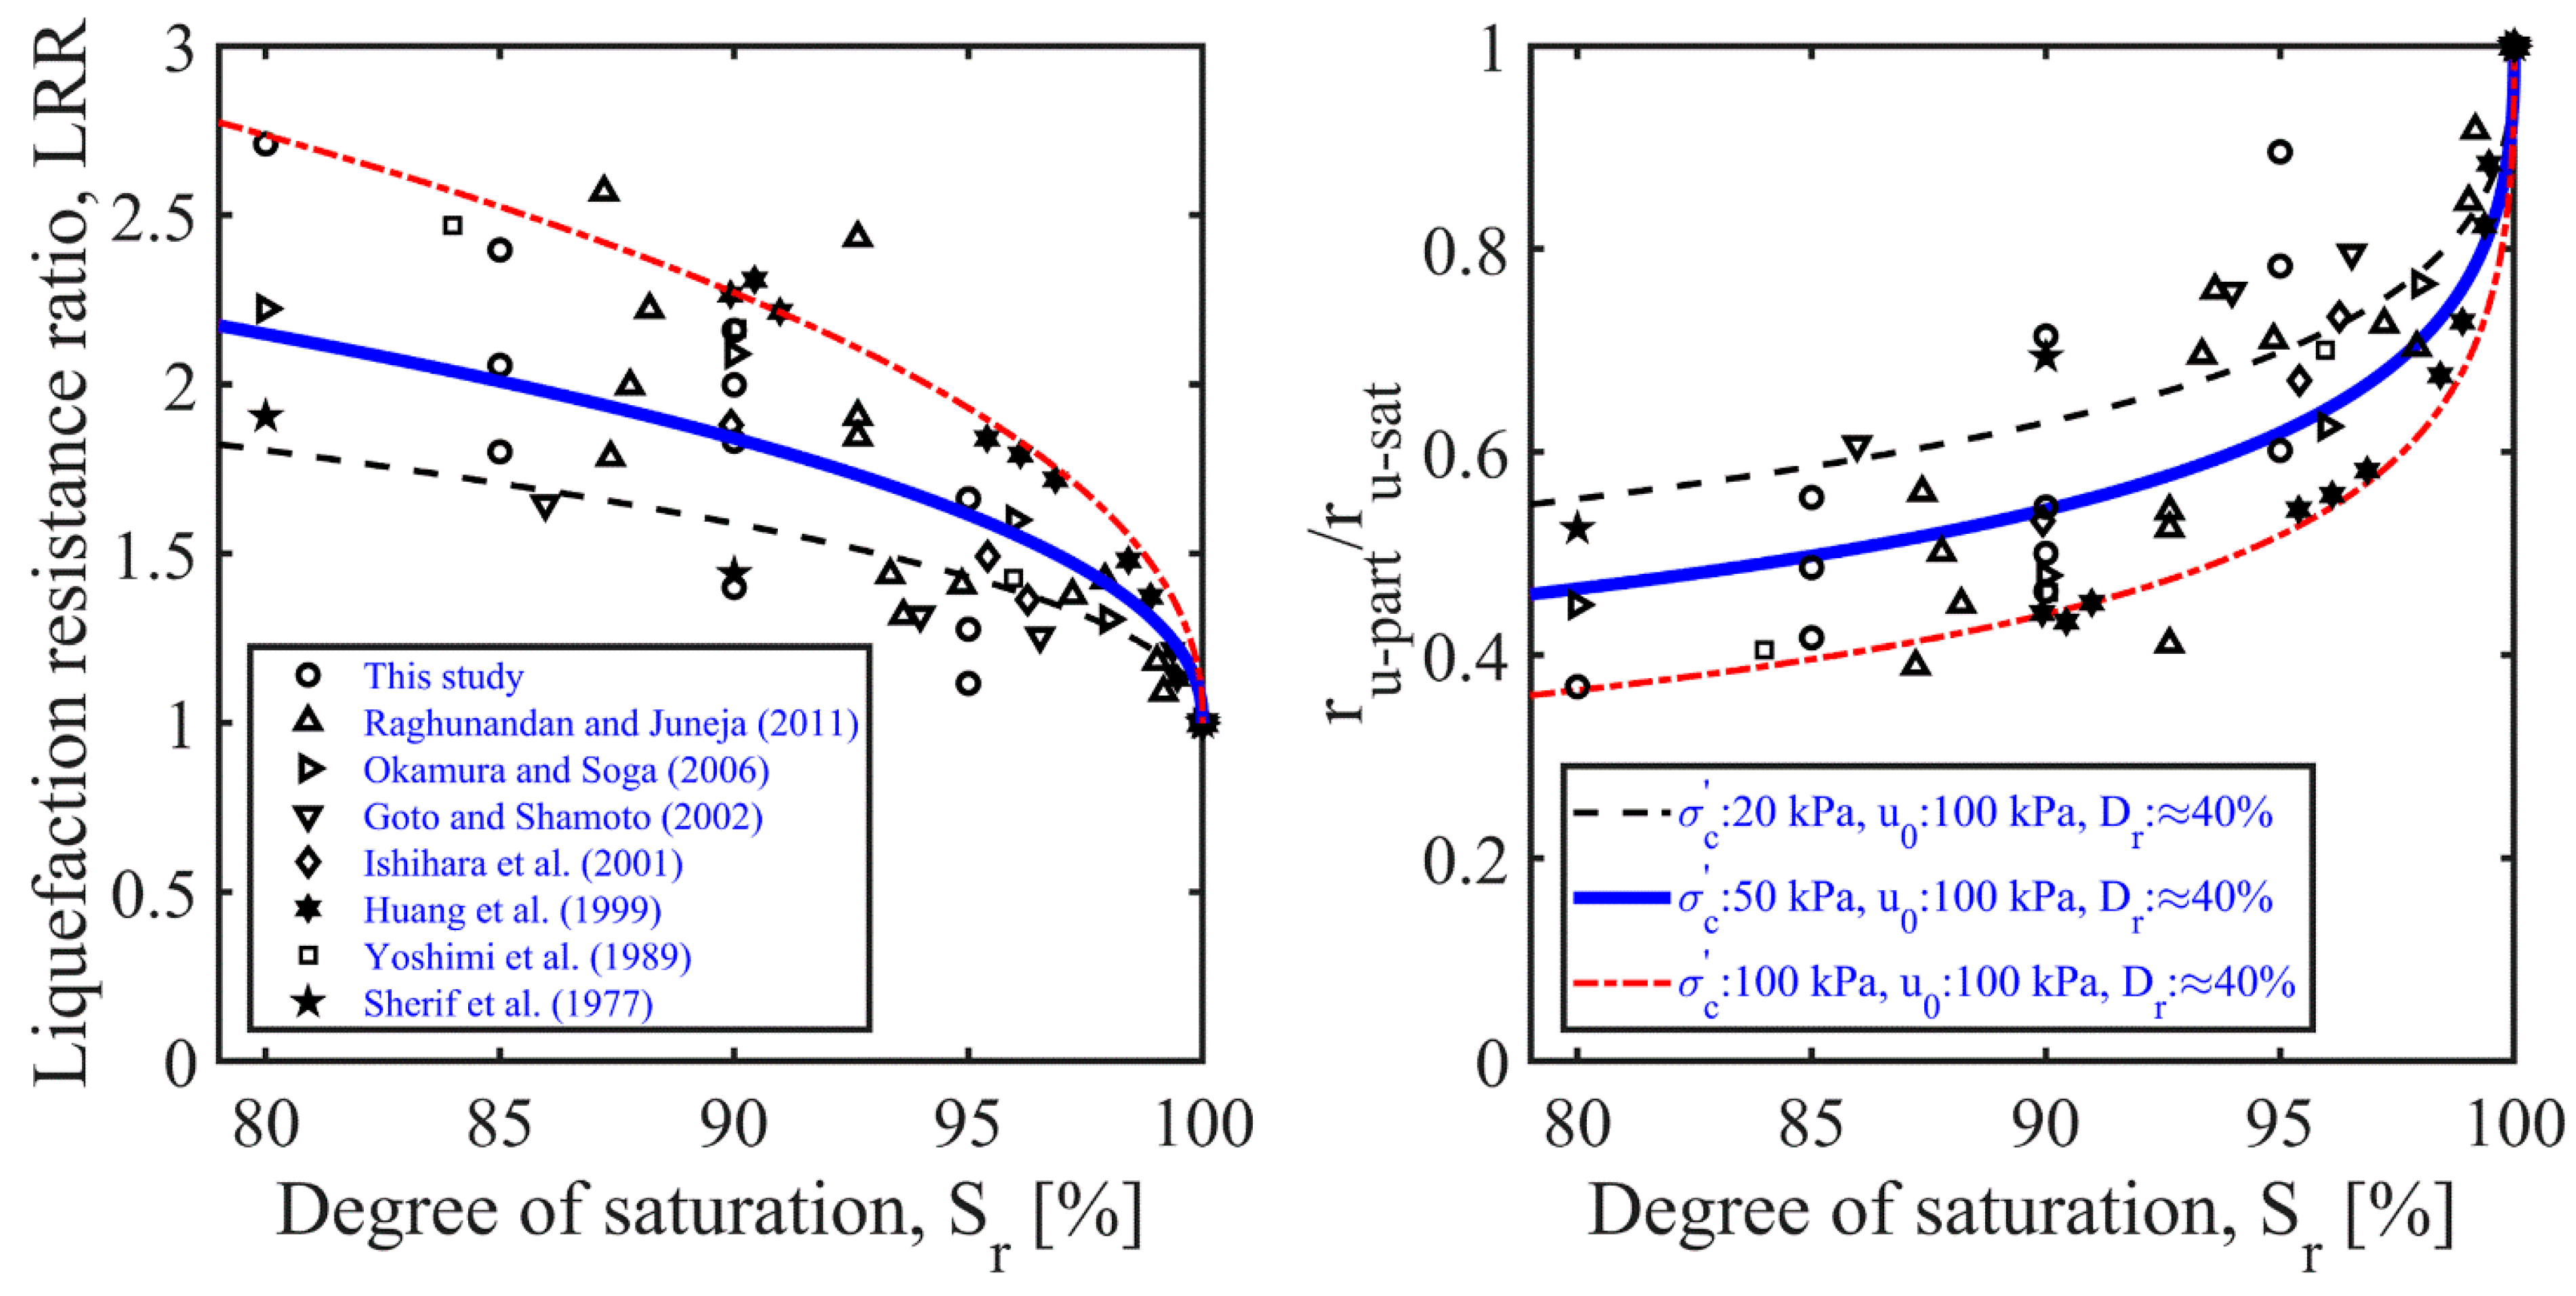
4.4. Liquefaction-Resistance Ratio

The aforementioned test results were presented herein in terms of the normalized liquefaction resistance—or simply the liquefaction resistance ratio ( L R R )—which will form the basis of the empirical relations developed in the subsequent sections. The liquefaction-resistance ratio was calculated as below:
L R R = ( C S R N = 20 ) p a r t ( C S R N = 20 ) s a t
where ( C S R N = 20 ) s a t and ( C S R N = 20 ) p a r t are the cyclic-stress ratios that correspond to 20 cycles for the nearly/fully saturated and partially saturated sands, respectively.
Figure 12 shows that for a given loading cycle ( N = 20), the liquefaction-resistance ratio ( L R R ) showed a tendency to increase with a decreasing degree of saturation. Similarly, as the effective confining stress increased, the L R R markedly increased in the partially saturated sand specimens and slightly decreased in the nearly/fully saturated sand specimens.
The effective confining stress plays a significant role in the stress–strain–strength behavior of saturated sands. Depending on the effective confining stress value, saturated sands may exhibit strain-softening or strain-hardening behavior during shear, and the sand behavior may change from contractive to dilative or vice versa [64]. Loose sand specimens at high effective confining stresses are expected to show a highly contractive behavior and suffer a larger build-up of excess pore pressures during undrained cyclic loading. The slight decrease observed in the liquefaction resistance of fully/nearly saturated sand specimens with increasing confining stress could be ascribed to the enhanced contractive tendency of the sand. On the other hand, the liquefaction behavior of the partially saturated sand specimens with occluded gas/air bubbles was controlled by the pore-fluid compressibility or potential volumetric strains. The occluded gas/air bubbles in the pore spaces played a role in absorbing the excess pore pressures and eventually increased the resistance of the sand to liquefaction. The compressibility of the pore fluid and hence the liquefaction resistance were enhanced by lowering the degree of saturation and/or increasing the effective confining stress.

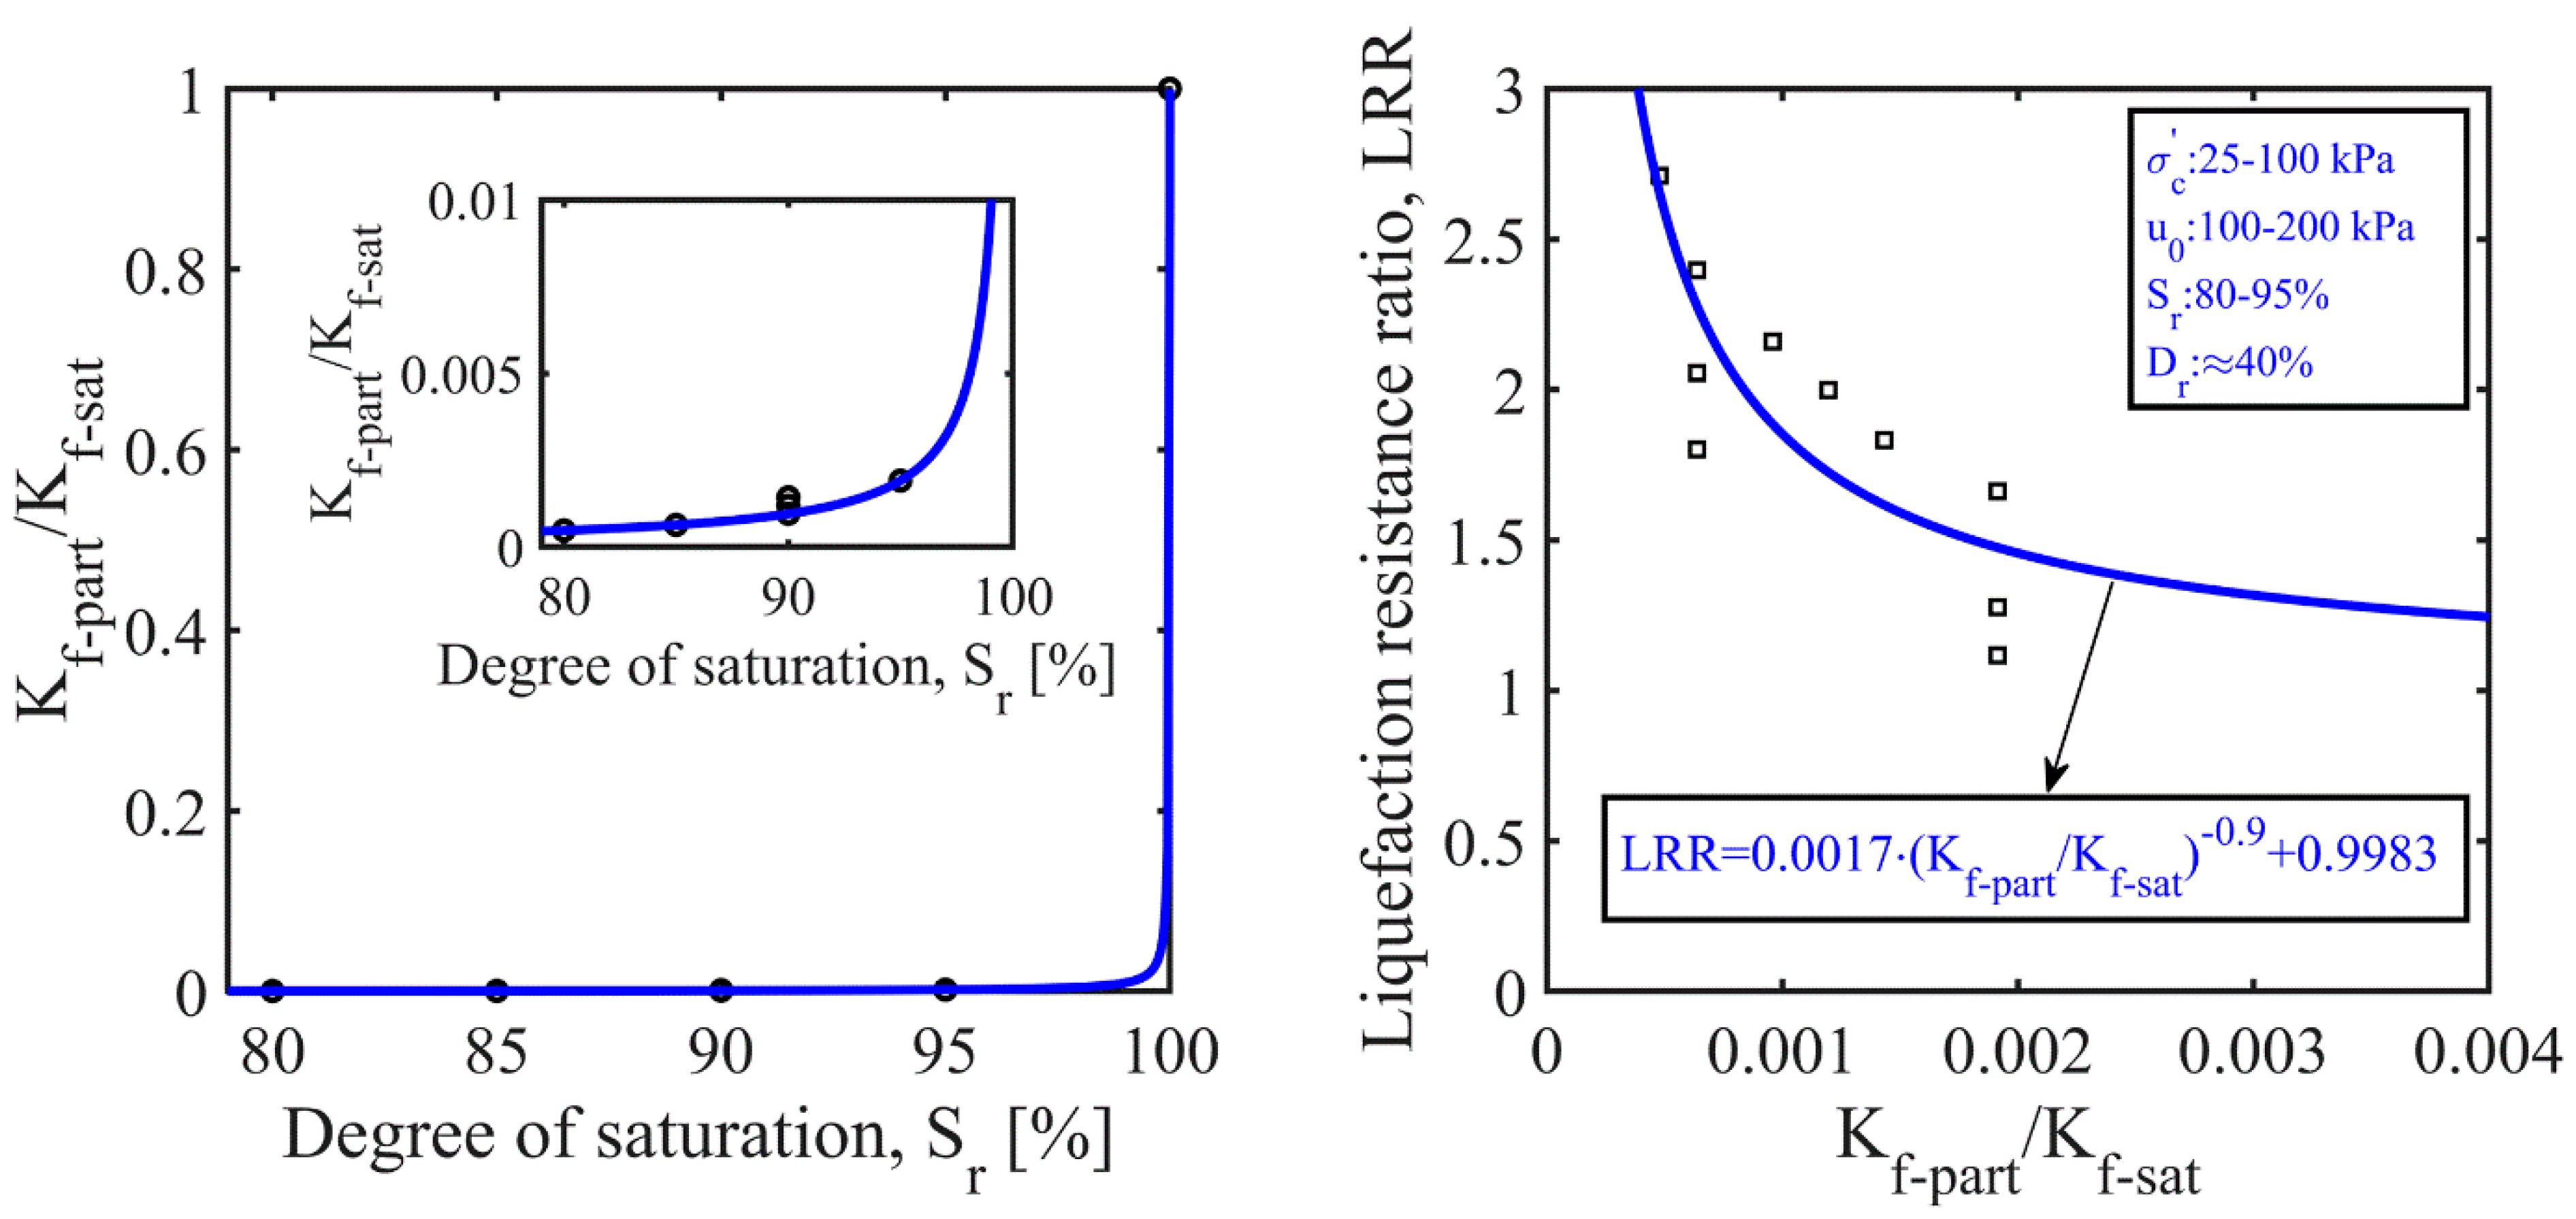
5. Proposed Empirical Functions

This section introduces empirical correlations for the practical assessment of the normalized liquefaction resistance of partially saturated soils in relation to the bulk modulus, maximum (potential) volumetric strain, and excess pore-pressure ratio. The empirical formulas were produced using the curve-fitting toolbox in MATLAB, and their estimations were validated using experimental data from the literature.

5.1. Bulk Modulus

As stated earlier, for partially saturated sands with occluded bubbles, the bulk modulus of the pore fluid (gas–water mixture) is an essential parameter that controls the liquefaction behavior. The bulk modulus of the pore fluid ( K f ) was calculated using Equation (2) for a range of experiments conducted at varying degrees of saturation, confining stress, and back pressures. The bulk modulus of the partially saturated sands ( K f p a r t ) was normalized with that of their saturated counterparts ( K f s a t ) and plotted against the degree of saturation ( S r ) and liquefaction-resistance ratio ( L R R ) as shown in Figure 13. A trend line was fitted to the data points that produced the relationship below:
L R R = 0.0017 ( K f p a r t K f s a t ) 0.9 + 0.9983
This function has a dependent variable of the liquefaction-resistance ratio ( L R R ) and an independent variable of the normalized bulk modulus ( K f p a r t K f s a t ) at its base. The exponent of −0.9 determines the growth/decay rate and shape of the function. The scaling factor of 0.0017 indicates the amplitude of the decrease/increase in the liquefaction resistance ratio, and the constant of 0.9983 corresponds to the effects of other factors. The negative exponent suggests the decay of the liquefaction-resistance ratio with the increasing normalized bulk modulus of the pore fluid.
It can be observed in Figure 13 that the bulk modulus of the pore fluid significantly dropped as gas bubbles were generated in the nearly/fully saturated sand specimens. The reduction in the degree of saturation of the partially saturated sands was followed by a reduction in the bulk modulus of the pore fluid. This figure also reveals that the liquefaction-resistance ratio increased with a decreasing pore-fluid bulk modulus or an increasing-pore fluid compressibility, which was the reciprocal of the bulk modulus ( C f = 1 K f ).

5.2. Maximum Volumetric Strains

The maximum volumetric strain ( ε v * ) incorporates the effects of several parameters that govern the liquefaction response of partially saturated sands. Establishing a direct correlation between the liquefaction-resistance ratio ( L R R ) and maximum volumetric strain is of great importance in engineering. The maximum volumetric strains were calculated using Equation (3) for different initial conditions that were considered during the experimental work in the present study. The calculated ε v * values are plotted against the liquefaction-resistance ratios ( L R R ) on the left-hand side of Figure 14; a power function describing the general trend was proposed as follows:
L R R = 0.9 ( ε v * ) 0.45 + 1
In this equation, the positive exponent (namely, 0.45) indicates the growth of the liquefaction-resistance ratio ( L R R ) with an increase in the normalized potential volumetric strains ( ε v * ). The amplitude of the increase in the liquefaction-resistance ratio with increasing normalized potential volumetric strains is characterized by a scaling factor of 0.9. As the exponent is smaller than 1, the slope of the curve is expected to continuously decrease.
The right-hand side of Figure 14 compares the predictions of the power law relationship in Equation (10) with previously published experimental data obtained for different types of sand tested under a wide range of initial conditions (e.g., S r and D r ) and stress levels (e.g., σ c and u 0 ). It appeared that the normalized liquefaction resistance of partially saturated sands increased with the maximum volumetric strains and followed a non-linear trend. Most of the experimental data points were successfully captured by the proposed empirical power function.
By considering a fully submerged sand element, the liquefaction-resistance ratios were estimated using Equation (10) and plotted against the degrees of saturation for five different field cases (Figure 15). In this analysis, back pressures corresponding to the pore water pressure in the field and the effective confining stresses used during the experimental studies were considered. For a buoyant unit weight of 10 kN / m 3 , Case 1 represents a condition in which the water table was at the ground surface, whereas the groundwater table was located at 5–10 m above the ground surface for other cases.
The evidence in Figure 15 indicates that irrespective of the sand’s depth and the position of the water table, the liquefaction-resistance ratios increased with decreasing degrees of saturation. In the right plot in the figure, it is apparent that the liquefaction-resistance ratio of sand under an equivalent depth (e.g., 10 m) slightly decreased as the water table rose, which caused an increase in the pore water pressure that acted on the sand element. This may be ascribed to the decrease in the pore-fluid compressibility with increasing back or pore water pressure [41]. It is also evident in the left plot that under a constant initial pore water pressure, the liquefaction resistance of the sand increased quite significantly with an increasing depth or effective confining stress. These results may imply that in comparison with the initial pore water pressure, the degree of saturation and effective confining stress played a more important role and were the controlling factors in the liquefaction resistance of the partially saturated sands.

5.3. Excess Pore-Pressure Ratios

The excess pore-pressure ratio ( r u ), which accommodates the effects of excess pore pressure and the initial effective confining stress, is an important design parameter. This study assumed that a reasonable assessment of excess pore-pressure ratios can be achieved by establishing an inverse correlation between the liquefaction-resistance ratio ( L R R ) and the normalized excess pore-pressure ratio ( r u p a r t r u s a t ) as described in Equation (11). A similar approach was undertaken in previous research [50,51].
r u p a r t r u s a t = 1 L R R
A group of experimental data was gathered from the literature through a comprehensive review of the elemental (e.g., undrained cyclic triaxial or simple shear) tests conducted on different types of sand with various degrees of saturation, effective confining stresses, and back pressures. The left window in Figure 16 shows the relationship between the liquefaction-resistance ratio and degree of saturation; this was obtained via an analysis of the test data from the present study and previous research. The right window in Figure 16 shows the normalized excess pore-pressure ratios ( r u p a r t r u s a t ) calculated using Equation (11) as a function of the degree of saturation. Figure 16 also compares the predictions of Equations (10) and (11) with the experimental data.
It is clear in Figure 16 that the proposed method successfully captured the decreasing trend in normalized excess pore-pressure ratios with decreasing degrees of saturation. A relative density of 40%; a back pressure of 100 kPa; and effective confining stresses of 20 kPa (shallower depth), 50 kPa (middle depth), and 100 kPa (deeper depth) provided an upper, an average, and lower boundaries for the normalized excess pore-pressure ratios, respectively. There were some discrepancies between the experimental and empirical results, particularly at an S r of 95%. From a design perspective, this variation was, however, understandable when considering the experimental uncertainties and complexities inherent in assessing the cyclic behavior of partially saturated sands.
The predictions of the empirical method were also compared with the physical modeling (e.g., centrifuge and shaking table) test data, which provided further validation of the results with different test and loading conditions. The excess pore-pressure data gathered from centrifuge tests [65] and 1 g shaking table tests [66] were processed and presented in the form of a relationship between the normalized excess pore-pressure ratio and degree of saturation (Figure 17). It appeared that the proposed methodology successfully captured the decreasing trend in the experimentally determined excess pore-pressure ratios with decreasing degrees of saturation. There were some differences in the measured and predicted values that can be mainly ascribed to a limited number of test data and experimental uncertainties such as the non-uniform distribution of the air/gas bubbles observed in physical model tests [65]. From an overall response perspective, this difference is expected to be acceptable in design practice when considering the complex nature of the problem under consideration.
The above results may suggest that when following the proposed methodology, the liquefaction resistance of partially saturated sand can be estimated if the liquefaction resistance of the nearly/fully saturated soils is known; the same applies to excess pore-pressure ratios.

6. Conclusions and Recommendations

Studies on the cyclic behavior of induced partially saturated sands are limited. Current design practices are mostly based on the methods developed for nearly/fully saturated soils, but these are unable to consider the effects of the presence of gas bubbles in soils. This study was intended to provide experimental insights into the testing parameters that affect the liquefaction behavior of partially saturated sands with occluded gas bubbles. Moreover, this study proposed an alternative and potentially simple empirical methodology in which the liquefaction-resistance ratios were related in a unique way to the bulk modulus, maximum volumetric strains, and excess pore-pressure ratios.
In this regard, a series of undrained dynamic triaxial tests were conducted on nearly/fully saturated and partially saturated sand specimens. The loose and dense specimens were reconstituted using the air-pluviation and dry-tamping methods. The partially saturated sands were prepared by percolating a sodium percarbonate–water solution through the specimens. The effects of four different testing parameters (namely, the degree of saturation, effective confining stress, back pressure, and relative density) were discussed with the aid of liquefaction-resistance curves. The validity and applicability of the proposed empirical approach were evaluated using the test results from the current study and the existing literature. The following conclusions were drawn:
(1)
The liquefaction behavior of sand was observed to change as the triaxial specimens were turned from nearly/fully saturated to a partially saturated state. The liquefaction resistance of the partially saturated sand specimens appeared to increase as the degree of saturation was reduced.
(2)
The undrained cyclic behavior of the partially saturated sand was not only sensitive to the degree of saturation but also to the level of the initial effective confining stress and back pressure (or initial pore water pressure) acting on the sand. At the same degrees of saturation, the partially saturated sands showed a greater resistance to liquefaction under larger initial effective confining stresses and lower back pressures. Amongst these parameters, the effect of the back pressure was less significant than those of the degrees of saturation and confining stress.
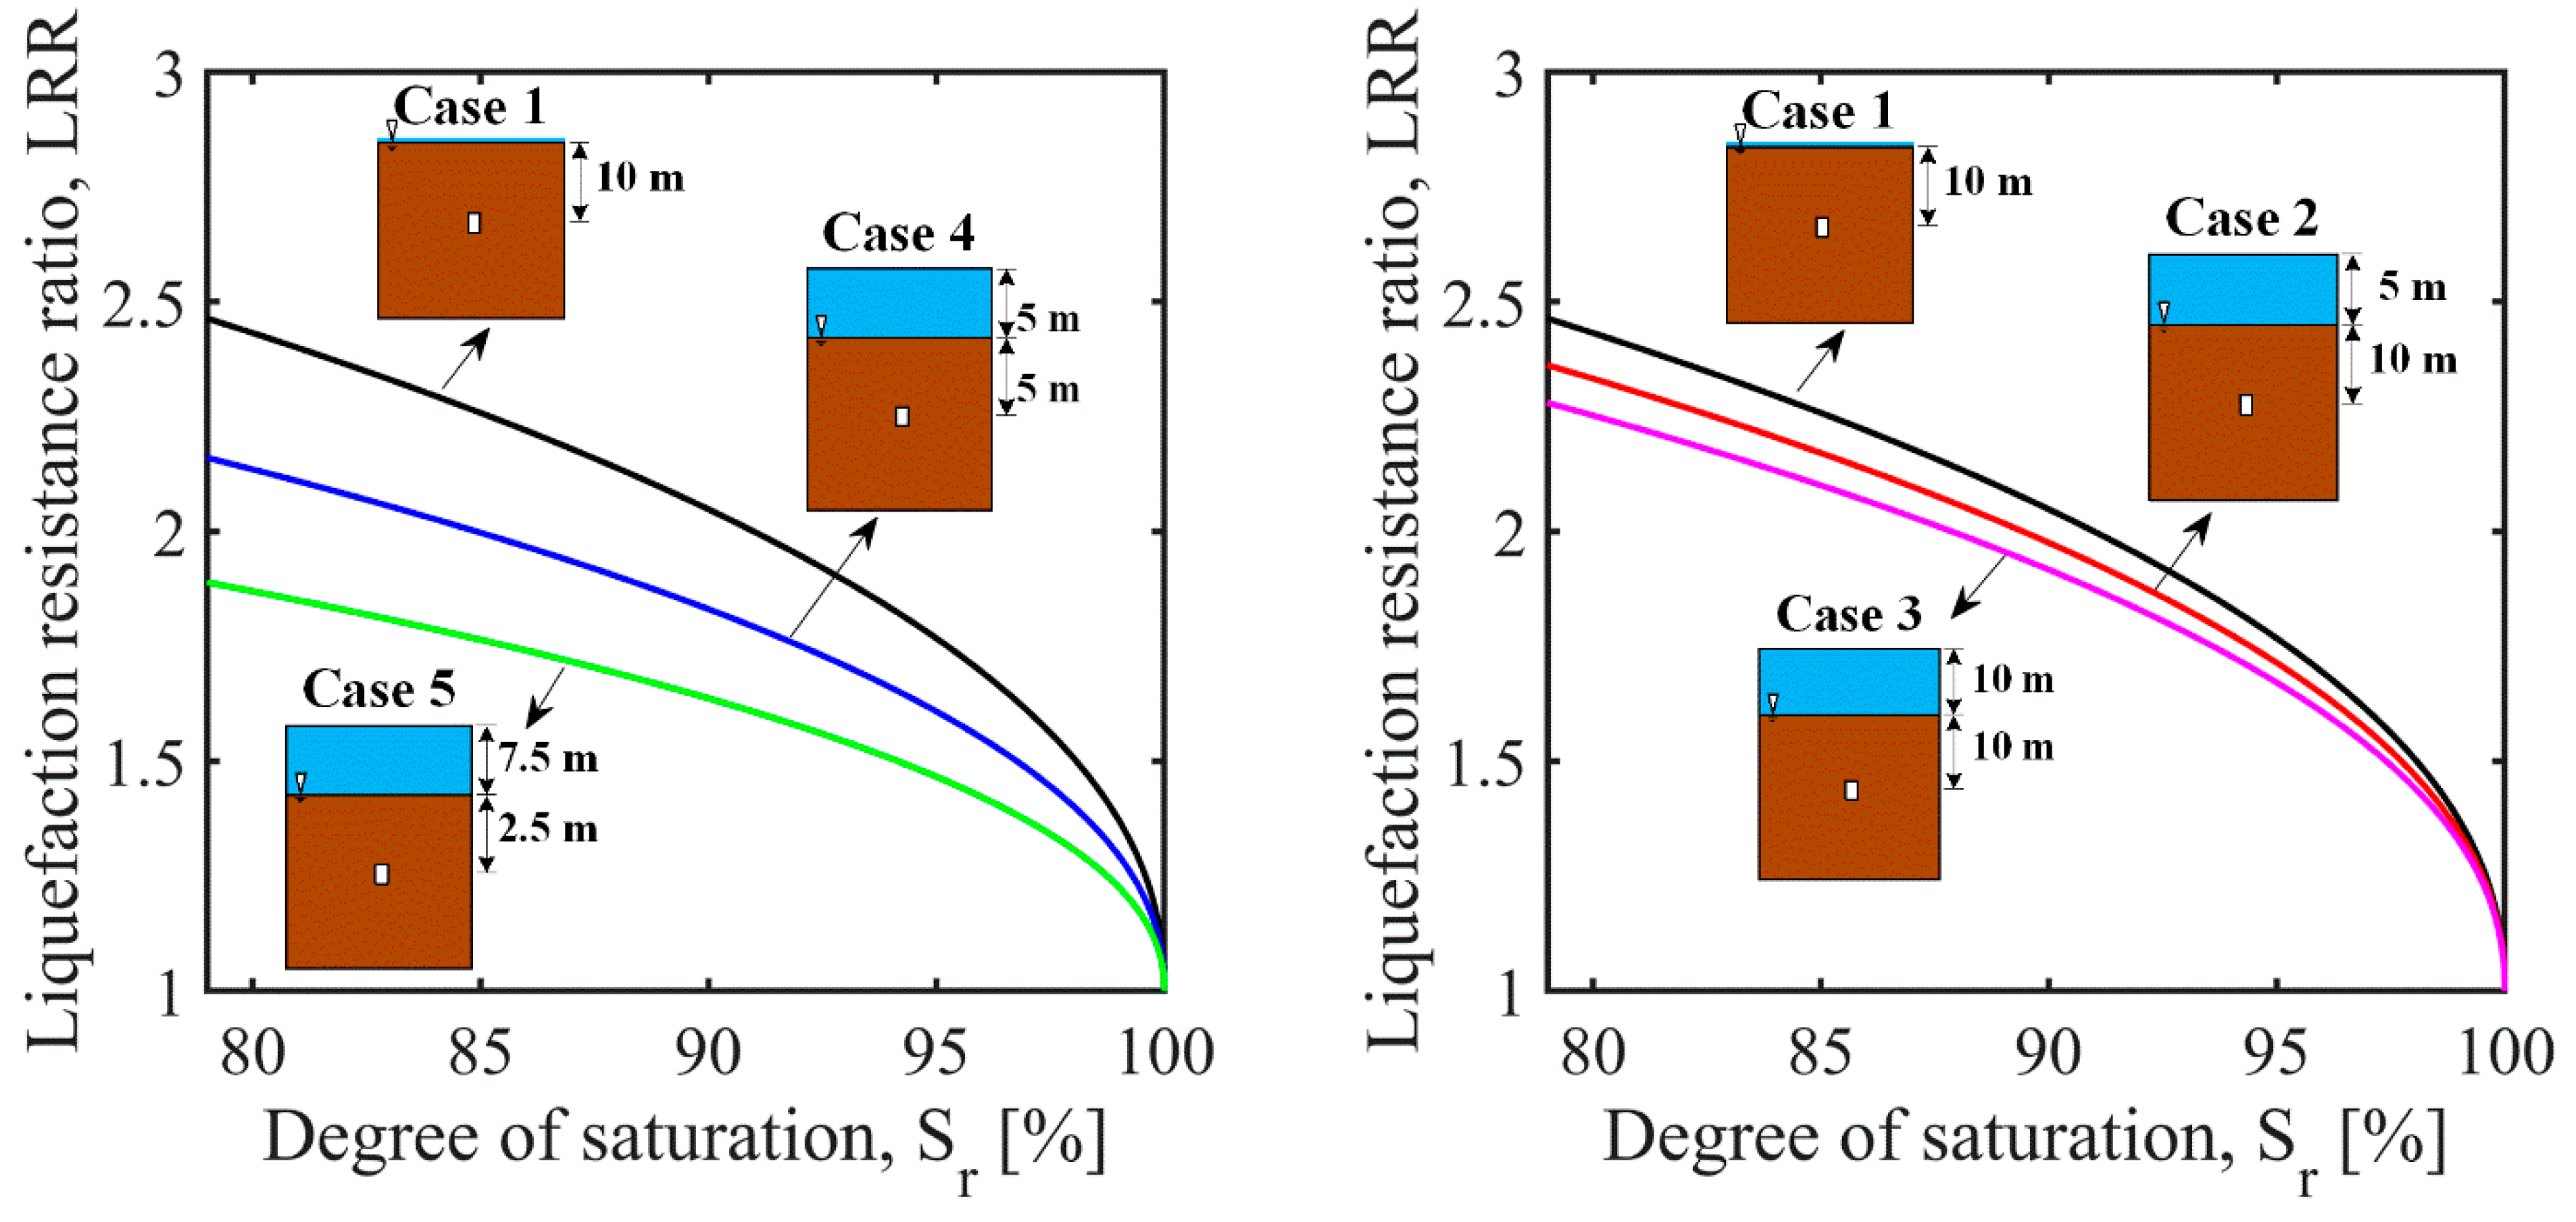
(3)
The positive effect of the confining stress and the adverse effect of the back pressure require consideration in design practice. During the practical application of IPS methods for the treatment of liquefiable deposits in the field, the shallower layers should be desaturated more than the deeper layers.
(4)
The proposed empirical approach was shown to enable a practical assessment of the normalized liquefaction resistance of partially saturated sands as a function of the pore-fluid bulk modulus, maximum volumetric strains, and normalized excess pore-pressure ratios. The model seemed to successfully capture the trends followed by the experimental data and produced physically sensible estimations for a complex topic of geotechnical earthquake engineering.
This study provided additional data and valuable insights that may enhance the scientific understanding of partially saturated soil behavior and the practical use of this particular IPS method in engineering projects. The experimental observations and empirical analysis were valid only for submerged, partially saturated clean sand specimens with occluded gas bubbles in which the effect of the matric suction was insignificant. Future studies should focus on sand deposits that contain some amount of silts and/or clays, and the robustness of the proposed methodology should be tested for different types of soils tested under a wider range of relative densities, degrees of saturation, and stress levels.

Funding

This research received no external funding.

Institutional Review Board Statement

Not applicable.

Informed Consent Statement

Not applicable.

Data Availability Statement

The data presented in this study are available from the author upon reasonable request.

Acknowledgments

The assistance and support of the technical staff at the Civil Engineering Laboratory of Mus Alparslan University are gratefully acknowledged.

Conflicts of Interest

The author declares no conflict of interest.

References

  1. Seed, H.B.; Idriss, I.M. Analysis of soil liquefaction: Niigata earthquake. J. Soil Mech. Found. Div. 1967, 93, 83–108. [Google Scholar] [CrossRef]
  2. Hamada, M.; O’ Rourke, T.D. Japanese case studies. In NCEER-92-0001: Case Studies of Liquefaction and Lifeline Performance during Past Earthquakes; Hamada, M., O’Rourke, T.D., Eds.; University of Buffalo: New York, NY, USA, 1992; Volume 1, pp. 31–199. [Google Scholar]
  3. Bray, J.; Sancio, R.; Durgunoglu, T.; Onalp, A.; Youd, T.; Stewart, J.; Seed, R.; Cetin, O.; Bol, E.; Baturay, M.; et al. Subsurface characterization at ground failure sites in Adapazari, Turkey. J. Geotech. Geoenviron. Eng. 2004, 130, 673–685. [Google Scholar] [CrossRef] [Green Version]
  4. Olson, S.M.; Green, R.A.; Lasley, S.; Martin, N.; Cox, B.R.; Rathje, E.; Bachhuber, J.; French, J. Documenting liquefaction and lateral spreading triggered by the 12 January 2010 Haiti Earthquake. Earthq. Spectra 2011, 27, 93–116. [Google Scholar] [CrossRef] [Green Version]
  5. Bertalot, D.; Brennan, A.J.; Villalobos, F.A. Influence of bearing pressure on liquefaction-induced settlement of shallow foundations. Géotechnique 2013, 63, 391–399. [Google Scholar] [CrossRef]
  6. Bhattacharya, S.; Hyodo, M.; Goda, K.; Tazoh, T.; Taylor, C.A. Liquefaction of soil in the Tokyo Bay area from the 2011 Tohoku (Japan) earthquake. Soil Dyn. Earthq. Eng. 2011, 31, 1618–1628. [Google Scholar] [CrossRef]
  7. Cubrinovski, M.; Bray, J.D.; Taylor, M.; Giorgini, S.; Bradley, B.; Wotherspoon, L.; Zupan, J. Soil liquefaction effects in the Central Business District during the February 2011 Christchurch Earthquake. Seismol. Res. Lett. 2011, 82, 893–904. [Google Scholar] [CrossRef]
  8. Avilés-Campoverde, D.; Chunga, K.; Ortiz-Hernández, E.; Vivas-Espinoza, E.; Toulkeridis, T.; Morales-Delgado, A.; Delgado-Toala, D. Seismically induced soil liquefaction and geological conditions in the city of Jama due to the M7.8 Pedernales Earthquake in 2016, NW Ecuador. Geosciences 2021, 11, 20. [Google Scholar] [CrossRef]
  9. Ortiz-Hernández, E.; Chunga, K.; Toulkeridis, T.; Pastor, J.L. Soil liquefaction and other seismic-associated phenomena in the city of Chone during the 2016 Earthquake of Coastal Ecuador. Appl. Sci. 2022, 12, 7867. [Google Scholar] [CrossRef]
  10. Seed, H.B.; Idriss, I.M. Simplified procedure for evaluating soil liquefaction potential. J. Soil Mech. Found. Div. 1971, 97, 1249–1273. [Google Scholar] [CrossRef]
  11. Tokimatsu, K.; Seed, H.B. Evaluation of settlements in sands due to earthquake shaking. J. Geotech. Geoenviron. Eng. 1987, 113, 861–878. [Google Scholar] [CrossRef]
  12. Ishihara, K.; Yoshimine, M. Evaluation of settlements in sand deposits following liquefaction during earthquakes. Soils Found. 1992, 32, 173–188. [Google Scholar] [CrossRef] [Green Version]
  13. Liu, L.; Dobry, R. Seismic response of shallow foundation on liquefiable sand. J. Geotech. Geoenviron. Eng. 1997, 123, 557–567. [Google Scholar] [CrossRef]
  14. Tsukamoto, Y.; Kawabe, S.; Matsumoto, J.; Hagiwara, S. Cyclic resistance of two unsaturated silty sands against soil liquefaction. Soils Found. 2014, 54, 1094–1103. [Google Scholar] [CrossRef] [Green Version]
  15. Zeybek, A.; Madabhushi, S.P.G. Closure to “Simplified procedure for prediction of earthquake-induced settlements in partially saturated soils” by Abdülhakim Zeybek and Santana Phani Gopal Madabhushi. J. Geotech. Geoenviron. Eng. 2021, 147, 07020027. [Google Scholar] [CrossRef]
  16. Fredlund, D.G.; Rahardjo, H. Soil Mechanics for Unsaturated Soils, 1st ed.; Wiley: New York, NY, USA, 1993. [Google Scholar]
  17. Okamura, M.; Soga, Y. Effects of pore fluid compressibility on liquefaction resistance of partially saturated sand. Soils Found. 2006, 46, 695–700. [Google Scholar] [CrossRef] [Green Version]
  18. Mitchell, J.K.; Santamarina, J.C. Biological considerations in geotechnical engineering. J. Geotech. Geoenviron. Eng. 2005, 131, 1222–1233. [Google Scholar] [CrossRef] [Green Version]
  19. Rebata-Landa, V.; Santamarina, J.C. Mechanical effects of biogenic nitrogen gas bubbles in soils. J. Geotech. Geoenviron. Eng. 2012, 138, 128–137. [Google Scholar] [CrossRef]
  20. Okamura, M.; Takebayashi, M.; Nishida, K.; Fujii, N.; Jinguji, M.; Imasato, T.; Yasuhara, H.; Nakagawa, E. In-situ desaturation test by air injection and its evaluation through field monitoring and multiphase flow simulation. J. Geotech. Geoenviron. Eng. 2011, 137, 643–652. [Google Scholar] [CrossRef]
  21. Zeybek, A.; Madabhushi, S.P.G. Influence of air injection on the liquefaction induced deformation mechanisms beneath shallow foundations. Soil Dyn. Earthq. Eng. 2017, 97, 266–276. [Google Scholar] [CrossRef] [Green Version]
  22. Zeybek, A.; Madabhushi, S.P.G.; Pelecanos, L. Seismic response of partially saturated soils beneath shallow foundations under sequential ground motions. Bull. Earthquake Eng. 2020, 18, 1987–2002. [Google Scholar] [CrossRef]
  23. Yegian, M.K.; Eseller-Bayat, E.; Alshawabkeh, A.; Ali, S. Induced partial saturation (IPS) for liquefaction mitigation: Experimental investigation. J. Geotech. Geoenviron. Eng. 2007, 133, 372–380. [Google Scholar] [CrossRef] [Green Version]
  24. He, J.; Chue, J.; Ivanov, V. Mitigation of liquefaction of saturated sand using biogas. Géotechnique 2013, 63, 267–275. [Google Scholar] [CrossRef]
  25. O’Donnell, S.T.; Rittmann, B.E.; Kavazanjian, E. MIDP: Liquefaction mitigation via microbial denitrification as a two-stage process. I: Desaturation. J. Geotech. Geoenviron. Eng. 2017, 143, 04017094. [Google Scholar] [CrossRef]
  26. Eseller-Bayat, E.E.; Yegian, M.K.; Alshawabkeh, A.; Gokyer, S. Liquefaction response of partially saturated sands. I: Experimental results. J. Geotech. Geoenviron. Eng. 2013, 139, 863–871. [Google Scholar] [CrossRef] [Green Version]
  27. Zeybek, A. Shaking table tests on seismic performance of shallow foundations resting on partially saturated sands. Arab. J. Geosci. 2022, 15, 774. [Google Scholar] [CrossRef]
  28. Okamura, M.; Ishihara, M.; Tamura, K. Degree of saturation and liquefaction resistances of sand improved with sand compaction pile. J. Geotech. Geoenviron. Eng. 2006, 132, 258–264. [Google Scholar] [CrossRef]
  29. Zeybek, A.; Madabhushi, S.P.G. Durability of partial saturation to counteract liquefaction. Proc. Inst. Civ. Eng. Ground Improv. 2017, 170, 102–111. [Google Scholar] [CrossRef]
  30. Takemura, J.; Igarashi, R.; Izawa, J.; Okamura, M.; Masuda, M. Centrifuge Model Tests on Soil Desaturation as a Liquefaction Countermeasure. In Proceedings of the 17th International Conference on Soil Mechanics and Geotechnical Engineering, Alexandria, Egypt, 5–9 October 2009; Hamza, M., Shahien, M., El-Mossallamy, Y., Eds.; IOS Press: Amsterdam, The Netherlands, 2009; pp. 502–505. [Google Scholar] [CrossRef]
  31. Ghayoomi, M.; McCartney, J.S.; Ko, H.-Y. Centrifuge test to assess the seismic compression of partially saturated sands. Geotech. Test. J. 2011, 34, 321–331. [Google Scholar] [CrossRef]
  32. Marasini, N.P.; Okamura, M. Air injection to mitigate liquefaction under light structures. Int. J. Phys. Model Geotech. 2015, 15, 129–140. [Google Scholar] [CrossRef]
  33. Zeybek, A.; Madabhushi, S.P.G. Centrifuge testing to evaluate the liquefaction response of air-injected partially saturated soils beneath shallow foundations. Bull. Earthq. Eng. 2017, 15, 339–356. [Google Scholar] [CrossRef]
  34. Sherif, M.A.; Tsuchiya, C.; Ishibashi, I. Saturation effects on initial soil liquefaction. J. Geotech. Eng. Div. 1977, 103, 914–917. [Google Scholar] [CrossRef]
  35. Yoshimi, Y.; Tanaka, K.; Tokimatsu, K. Liquefaction resistance of a partially saturated sand. Soils Found. 1989, 29, 157–162. [Google Scholar] [CrossRef] [PubMed] [Green Version]
  36. Huang, Y.; Tsuchiya, H.; Ishihara, K. Estimation of Partial Saturation Effect on Liquefaction Resistance of Sand Using P-Wave Velocity. Proc. Jpn. Geotech. Soc. 1999, 113, 431–434. [Google Scholar]
  37. Goto, S.; Shamoto, Y. Estimation Method for the Liquefaction Strength of Unsaturated Sandy Soil (Part2). In Proceedings of the Thirty-Seventh Japan National Conference on Geotechnical Engineering, Osaka, Japan, 14–16 July 2002; pp. 1985–1986. [Google Scholar] [CrossRef]
  38. Tsukamoto, Y.; Ishihara, K.; Nakazawa, H.; Kamada, K.; Huang, Y. Resistance of partly saturated sand to liquefaction with reference to longitudinal and shear wave velocities. Soils Found. 2002, 42, 93–104. [Google Scholar] [CrossRef] [PubMed] [Green Version]
  39. Yang, J.; Savidis, S.; Roemer, M. Evaluating liquefaction strength of partially saturated sand. J. Geotech. Geoenviron. Eng. 2004, 130, 975–979. [Google Scholar] [CrossRef]
  40. Raghunandan, M.E.; Juneja, A. A study on the liquefaction resistance and dynamic properties of de-saturated sand. Electron. J. Geotech. Eng. 2011, 16, 109–123. [Google Scholar]
  41. Eseller-Bayat, E.E.; Gulen, D.B. Undrained dynamic response of partially saturated sands tested in a DSS-C device. J. Geotech. Geoenviron. Eng. 2020, 146, 04020118. [Google Scholar] [CrossRef]
  42. Seed, H.B.; Idriss, I.M.; Makdisi, F.; Banerjee, N. EERC 75-29 Report: Representation of Irregular Stress Time Histories by Equivalent Uniform Stress Series in Liquefaction Analyses; Earthquake Engineering Research Center, University of California: Berkeley, CA, USA, 1975. [Google Scholar]
  43. Polito, C.P.; Green, R.A.; Lee, J. Pore pressure generation models for sands and silty soils subjected to cyclic loading. J. Geotech. Geoenviron. Eng. 2008, 134, 1490–1500. [Google Scholar] [CrossRef]
  44. Dobry, R.; Ladd, R.S.; Yokel, F.Y.; Chung, R.M.; Powell, D. Prediction of Pore Water Pressure Buildup and Liquefaction of Sands during Earthquakes by the Cyclic Strain Method. In NBS Building Science Series; Department of Commerce, National Bureau of Standards: Washington, DC, USA, 1982; pp. 138–150. [Google Scholar]
  45. Green, R.A.; Mitchell, J.K.; Polito, C.P. Energy-Based Excess Pore Pressure Generation Model for Cohesionless Soils. In Proceedings of Developments in Theoretical Geomechanics—The John Booker Memorial Symposium (Smith DW Carter JP, eds), Sydney, NSW, Australia, 16–17 November 2000; A.A. Balkema Publishers: Rotterdam, The Netherlands, 2000; pp. 383–390. [Google Scholar]
  46. Martin, G.R.; Finn, W.L.; Seed, H.B. Fundamentals of liquefaction under cyclic loading. J. Geotech. Geoenviron. Eng. 1975, 101, 423–438. [Google Scholar] [CrossRef]
  47. Finn, W.D.L.; Martin, G.R.; Byrne, P.M. Seismic response and liquefaction of sands. J. Geotech. Eng. Div. ASCE 1976, 102, 841–856. [Google Scholar] [CrossRef]
  48. Koning, H. Some Observations on the Modulus of Compressibility of Water. In Proceedings of the European Conference on SMFE; 1963; Volume 1, pp. 33–36. [Google Scholar]
  49. Mousavi, S.; Ghayoomi, M. A Semi-Empirical Model to Predict Excess Pore Pressure Generation in Partially Saturated Sand. In Proceedings of 4th European Conference on Unsaturated Soils (E-UNSAT 2020), E3S Web Conference; 2020; Volume 195, p. 02026. [Google Scholar] [CrossRef]
  50. Ghayoomi, M.; McCartney, J.S.; Ko, H.-Y. Empirical methodology to estimate seismically induced settlement of partially saturated sand. J. Geotech. Geoenviron. Eng. 2013, 139, 367–376. [Google Scholar] [CrossRef] [Green Version]
  51. Zeybek, A.; Madabhushi, S.P.G. Simplified procedure for prediction of earthquake-induced settlements in partially saturated soils. J. Geotech. Geoenviron. Eng. 2019, 145, 04019100. [Google Scholar] [CrossRef]
  52. Tsuchida, H. Prediction and Countermeasure against the Liquefaction in Sand Deposits. In Abstract of the Seminar at the Port and Harbour Research Institute; Ministry of Transport, 1970; pp. 3.1–3.33. [Google Scholar]
  53. ASTM D6913/D6913M-17; Standard Test Methods for Particle-Size Distribution (Gradation) of Soils Using Sieve Analysis. ASTM International: West Conshohocken, PA, USA, 2017.
  54. ASTM D854-14; Standard Test Methods for Specific Gravity of Soil Solids by Water Pycnometer. ASTM International: West Conshohocken, PA, USA, 2014.
  55. ASTM D4253-16e1; Standard Test Methods for Maximum Index Density and Unit Weight of Soils Using a Vibratory Table. ASTM International: West Conshohocken, PA, USA, 2019.
  56. ASTM D4254-16; Standard Test Methods for Minimum Index Density and Unit Weight of Soils and Calculation of Relative Density. ASTM International: West Conshohocken, PA, USA, 2016.
  57. Zeybek, A. Suggested method of specimen preparation for triaxial tests on partially saturated sand. Geotech. Test. J. 2022, 45, 20210168. [Google Scholar] [CrossRef]
  58. ASTM D5311/D5311M-13; Standard Test Method for Load Controlled Cyclic Triaxial Strength of Soil. ASTM International: West Conshohocken, PA, USA, 2013.
  59. Vaid, Y.P.; Chern, J.C.; Tumi, H. Confining pressure, grain angularity, and liquefaction. J. Geotech. Geoenviron. Eng. 1985, 111, 1229–1235. [Google Scholar] [CrossRef]
  60. Papadopoulou, A.; Tika, T. The effect of fines on critical state and liquefaction resistance characteristics of non-plastic silty sands. Soils Found. 2008, 48, 713–725. [Google Scholar] [CrossRef] [Green Version]
  61. Mousavi, S.; Ghayoomi, M. Liquefaction Mitigation of Silty Sands via Microbial Induced Partial Saturation. In Proceedings of the 8th International Conference on Case Histories in Geotechnical Engineering, Geo-Congress 2019: Earthquake Engineering and Soil Dynamics, Philadelphia, PA, USA, 24–27 March 2019; pp. 304–312. [Google Scholar] [CrossRef]
  62. Świdziński, W.; Smyczyński, M. Modelling of static liquefaction of partially saturated non-cohesive soils. Appl. Sci. 2022, 12, 2076. [Google Scholar] [CrossRef]
  63. Cordeiro, D.; Molina-Gómez, F.; Ferreira, C.; Rios, S.; Viana da Fonseca, A. Cyclic liquefaction resistance of an alluvial natural sand: A comparison between fully and partially saturated conditions. Geotechnics 2022, 2, 1–13. [Google Scholar] [CrossRef]
  64. Wang, X.; Wang, X.; Shen, J.; Zhu, C. Particle size and confining-pressure effects of shear characteristics of coral sand: An experimental study. Bull. Eng. Geol. Environ. 2022, 81, 97. [Google Scholar] [CrossRef]
  65. Zeybek, A. Air Injection Technique to Mitigate Liquefaction beneath Shallow Foundations. Ph.D. Thesis, University of Cambridge, Cambridge, UK, 2017. [Google Scholar]
  66. Eseller-Bayat, E.E. Seismic Response and Prevention of Liquefaction Failure of Sands Partially Saturated through Introduction of Gas Bubbles. Ph.D. Thesis, Northeastern University, Boston, MA, USA, 2009. [Google Scholar]
Figure 1. Dynamic triaxial test system at Mus Alparslan University.
Applsci 13 00081 g001
Figure 2. Particle size distribution curve for Sile sand and its comparison with different types of sand and liquefaction boundaries suggested by Tsuchida [52].
Applsci 13 00081 g002
Figure 3. Examples of test images recorded during the specimen preparation.
Applsci 13 00081 g003
Figure 4. Schematic representation of test stages: (a) Saturation; (b) Consolidation; (c) Shearing; (d) Dissipation of excess pore pressures.
Applsci 13 00081 g004
Figure 5. Relationship between the degree of saturation S r and Skempton’s pore-pressure parameter B .
Applsci 13 00081 g005
Figure 6. Typical test data for sand: (a) fully saturated sand; (b) partially saturated sand.
Applsci 13 00081 g006
Figure 7. Effect of confining stress on liquefaction resistance of nearly/fully saturated sand specimens.
Applsci 13 00081 g007
Figure 8. Effect of confining stress on liquefaction resistance of partially saturated sand specimens.
Applsci 13 00081 g008
Figure 9. Effect of degree of saturation on liquefaction resistance of partially saturated specimens.
Applsci 13 00081 g009
Figure 10. Effect of back pressure on liquefaction resistance of sand: (a) nearly/fully saturated sand specimens; (b) partially saturated sand specimens.
Applsci 13 00081 g010
Figure 11. Effect of relative density on liquefaction resistance of sand: (a) nearly/fully saturated sand specimens; (b) partially saturated sand specimens.
Applsci 13 00081 g011
Figure 12. Variation in liquefaction resistance and liquefaction-resistance ratio with the degree of saturation and effective confining stress.
Applsci 13 00081 g012
Figure 13. Variation in liquefaction-resistance ratio with normalized bulk modulus of pore fluid.
Applsci 13 00081 g013
Figure 14. Variation in liquefaction-resistance ratio with maximum volumetric strain [17,35,36].
Applsci 13 00081 g014
Figure 15. Variation in liquefaction-resistance ratio with the degree of saturation under different field conditions.
Applsci 13 00081 g015
Figure 16. Validation of the predictions against elemental testing data [17,34,35,36,37,38,40].
Applsci 13 00081 g016
Figure 17. Validation of the predictions against centrifuge [65] and 1 g shaking table [66] test data.
Applsci 13 00081 g017
Table 1. The index properties of Sile sand.
Properties of SandValueTest Standard
Average particle size, D 50 (mm)0.296
Coefficient of gradation, C c 0.974ASTM, D6913/D6913M-17 [53]
Uniformity coefficient, C u 1.352
Specific gravity, G s 2.65ASTM, D854-14 [54]
Minimum void ratio, e m i n 0.574ASTM, Method 1A, D4253-16e1 [55]
Maximum void ratio, e m a x 0.885ASTM, Method A in D4254-16 [56]
Soil classification SPUnified Soil Classification System (USCS)
Table 2. Test parameters and typical results for nearly or fully saturated sand specimens.
Test No.Test ID D r
(%)
S r
(%)
B σ 3
(kPa)
u 0
(kPa)
σ c
(kPa)
CSR N l i q
1FS1391000.984003001000.1071
2FS2391000.994003001000.12527
3FS3401001.004003001000.1510
4FS441990.894003001000.201
5FS5401000.97350300500.1085
6FS6391000.99350300500.12532
7FS739990.91350300500.1515
8FS8401000.98350300500.201
9FS9391000.995004001000.1079
10FS10381001.005004001000.12525
11FS11411000.985004001000.1510
12FS12401000.995004001000.201
13FS13831001.004003001000.20285
14FS14841000.974003001000.22565
15FS15831000.984003001000.2517
16FS1685990.884003001000.303
Table 3. Test parameters and typical results for partially saturated sand specimens.
Test No.Test ID D r
(%)
S r
(%)
B σ 3
(kPa)
u 0
(kPa)
σ c
(kPa)
CSR N l i q
1PS139950.332001001000.15110
2PS240940.292001001000.2033
3PS341960.412001001000.2510
4PS440960.392001001000.351
5PS539890.162001001000.2089
6PS638900.172001001000.2535
7PS741910.192001001000.3017
8PS840890.152001001000.402
9PS939850.112001001000.2565
10PS1040860.132001001000.3025
11PS1141850.112001001000.3513
12PS1239840.092001001000.453
13PS1337800.082001001000.25103
14PS1441800.122001001000.3521
15PS1540790.082001001000.4012
16PS1641810.102001001000.502
17PS1741960.43150100500.1569
18PS1842950.35150100500.2014
19PS1939950.36150100500.253
20PS2040940.27150100500.351
21PS2140940.3125100250.1529
22PS2241950.34125100250.205
23PS2340950.35125100250.252
24PS2439960.42125100250.351
25PS2541850.11150100500.2537
26PS2640840.11150100500.3015
27PS2739860.13150100500.358
28PS2840850.10150100500.451
29PS2942850.12125100250.2521
30PS3041860.15125100250.39
31PS3140840.11125100250.354
32PS3240860.13125100250.451
33PS3339900.192501501000.2072
34PS3440910.222501501000.2524
35PS3539890.172501501000.3011
36PS3640890.162501501000.401
37PS3739900.173002001000.2053
38PS3842910.213002001000.2518
39PS3939890.163002001000.306
40PS4041900.173002001000.401
41PS4184890.162001001000.25289
42PS4285880.142001001000.3065
43PS4383910.202001001000.3520
44PS4484900.172001001000.404
Disclaimer/Publisher’s Note: The statements, opinions and data contained in all publications are solely those of the individual author(s) and contributor(s) and not of MDPI and/or the editor(s). MDPI and/or the editor(s) disclaim responsibility for any injury to people or property resulting from any ideas, methods, instructions or products referred to in the content.

