Article

Data Acquisition System Based on the Bluesky Suite in the Shanghai Synchrotron Radiation Facility

Shanghai Synchrotron Radiation Facility, Shanghai Advanced Research Institute, Chinese Academy of Sciences, Shanghai 201210, China
*
Authors to whom correspondence should be addressed.
Appl. Sci. 2023, 13(10), 5829; https://doi.org/10.3390/app13105829
Submission received: 11 March 2023 / Revised: 6 May 2023 / Accepted: 7 May 2023 / Published: 9 May 2023
(This article belongs to the Special Issue Advanced Optoelectronic Devices and Systems)

Abstract

:

Featured Application

This system is characterized by multi-channel simultaneous acquisition capability, high signal-to-noise ratio and high universality. On one hand, the system is capable of being extended to other beamlines efficiently and easily. On the other hand, it improves the experimental efficiency and reduces experimental error.

Abstract

The Shanghai Synchrotron Radiation Facility Phase-II Project is now under construction and it consists of 16 newly built advanced beamlines. The experiments carried out at these new beamlines tend to be characterized by high flux, multi-mode, ultra-fast frequency, in situ and dynamic loading. To meet these emerging experimental demands of SSRF Phase-II beamlines, the authors have developed a unified and extensible data acquisition system based on Bluesky suite. It has been applied at the BL07U Spatial-resolved and Spin-resolved ARPES and magnetism beamline. The experiment results show that with up to 5 channel signals, the system is capable of collecting total electron yield signals of experimental sample and standard sample, and incident photon flux signals simultaneously. It improves the user experimental efficiency and quality. In addition, thanks to Bluesky suite, all devices can be abstracted as motors or detectors and then represented by a Python object. Therefore, with the architecture, modules and interface developed for BL07U, the system can be extended to more beamlines efficiently and easily.

1. Introduction

The Shanghai Synchrotron Radiation Facility (SSRF) is a third-generation synchrotron light source equipped with a 150 MeV linear accelerator, a 3.5 GeV booster, a 3.5 GeV storage ring, beamlines, experimental endstations, and supporting facilities. SSRF opened to users in 2009 with 7 Phase-I beamlines. Another 6 beamlines were built as part of the Follow-up Beamline Program (FBP) in the next few years. In 2016, SSRF launched the largest follow-up beamline construction project—SSRF Phase-II Beamline Project. Table 1 shows the detailed overview of the 16 state-of-the art beamlines of the SSRF Phase-II Beamline Project. When the Phase-II project completes by the end of 2023, Shanghai Light Source will have nearly 40 beamlines in operation supporting users all over the world [1,2].
The SSRF Phase-I and the FBP beamline control system are normally based on the Experimental Physics and Industrial Control System (EPICS) [3,4,5], while there is no unified, extensible and interface-standardized framework for the data acquisition system for the experimental endstations. Table 2 shows the development environment of the endstation data acquisition systems at the SSRF Phase-I Project and the FBP beamlines [6,7,8,9,10,11,12]. As can be seen from the table, the development environment is complex and diverse, from c language to Blu-Ice/DCS, which makes maintenance and upgrade of these data acquisition systems extremely difficult and labor-intensive.
Compared with the SSRF Phase-I and the FBP, the SSRF Phase-II Project aims to greatly expand the experimental capacity of SSRF, making the resolution of time, space, energy and momentum in SSRF almost reach the limit of the third-generation synchrotron radiation light source. The state-of-the art Phase-II beamlines bring great changes in many aspects, such as sample scan, hardware equipment and data amount. For example, the sample scan expands from one-dimensional and two-dimensional to a multi-dimensional continuous scan. The new generation hardware equipment includes a huge number of area detectors with a larger imaging area and smaller pixels. Additionally, high time resolution accompanied with fast sampling frequency results in a high data-generation rate and high requirements for data transmission peak value. More specifically, beamlines in the SSRF Phase-II Project will have ultra-high spatial resolution of 10 nanometer and ultra-fast time resolution of 100 picosecond. The existing data acquisition system can hardly adapt to the changes mentioned above and meet the requirements of these new beamlines. It is necessary and reasonable to develop a uniform and universal data acquisition system based on the common requirements of the SSRF Phase-II beamlines. With overall consideration and planning, and within a unified software environment and architecture, it can significantly avoid repeated development and reduce the workload for long-term operation, maintenance, and upgrades.
At present, the international mainstream data acquisition architectures for synchrotron radiation light sources and other large facilities are Bluesky suite [13], Sardana [14] and Generic Data Acquisition (GDA) [15]. Bluesky suite is a set of tools that can assist beamline scientists to realize complex experimental procedures with little understanding of low-level control or data. It is developed by the American National Synchrotron Light Source-II (NSLS-II). Additionally, NSLS-II has developed and fielded a data acquisition system based on Bluesky Suite at 12 NSLS-II beamlines. Bluesky suite currently only interface with EPICS. Sardana development was started at the ALBA synchrotron, which is a third-generation synchrotron light facility located in Barcelona that is supported today by a larger community, which includes several other laboratories and individuals (ALBA, Deutsches Elektronen Synchrotron (DESY), Swedish national synchrotron laboratory MaxIV, Solaris National Synchrotron Radiation Center, European Synchrotron Radiation Facility (ESRF)). Sardana is based on Tango. The GDA project is an open-source framework for creating customized data acquisition software for science facilities, such as neutron and X-ray sources. The software is Java/Eclipse-based, free and released under the GPLv3. The development team at Diamond light source have developed the GDA for the majority of beamlines across all the scientific techniques at Diamond.
SSRF beamline control systems are mainly based on EPICS. In addition, Bluesky suite is designed to interface with EPICS and possess experiment generality. Therefore, we adopt Bluesky suite to develop a uniform and universal data acquisition system for SSRF Phase-II beamlines. Bluesky suite contains three main parts: Bluesky, Python abstractions of hardware (ophyd) and databroker [6]. Bluesky and ophyd are the co-developed acquisition software. Bluesky orchestrates the execution of an experiment and communicates with low-level hardware via ophyd. Ophyd is a hardware abstraction library and it represents hardware in Python frame, as hierarchical objects grouping together related values form the underlying control system; it interfaces with EPICS via PyEpics. Many facilities use ophyd to integrate with control systems that use EPICS. Ophyd is typically used with the Bluesky Run Engine for experiment orchestration and data acquisition. Bluesky collects measurements and metadata into documents which are stored in databases and can be used in any live visualization or processing. Databroker can access these documents and export them into any desired format.
So far, data acquisition systems based on SSRF Bluesky suite have been developed and applied at the BL07U beamline and the BL16U1 beamline of SSRF. In particular, the BL07U data acquisition system has been highly evaluated after it opened to users [16,17].

2. Materials and Methods

2.1. Sub-Assemblies

X-ray absorption spectroscopy (XAS) is a technique that probes the local atomic structure and chemical environment of elements in a material by measuring the attenuation of X-rays as they pass through a sample [18,19,20]. The X-ray absorption spectrum obtained from XAS is characterized by a series of peaks and edges that correspond to the absorption of X-rays by the different electron shells of the absorbing atoms. XAS comprises two regions: X-ray absorption near edge structure (XANES/NEXAFS), which provides information about the unoccupied electronic states of the absorbing atoms, and extended fine structure (EXAFS), which provides information about the local atomic environment of the absorbing atoms. As a scientific experimental method, XAS plays an important role in material, physics, chemistry, and life sciences research [21,22,23,24,25]. XAS can be collected in multiple ways, such as the total electron yield (TEY) method, the total fluorescence yield (TFY) method, the constant final state (CFS) method, and the constant initial state (CIS) method [26]. The TEY method with the sample current mode is widely used because it can be obtained using a relatively simple experimental setup. However, because the escape depth of an electron in solids is from a few to a few-to-ten angstrom, the TEY method is employed to obtain sample surface information [27,28]. The TFY method measures the fluorescent X-ray that can arise from a deeper region of the sample.
The BL07U beamline adopts the TEY method and the TFY method for XAS. The BL07U beamline is a new extreme ultraviolet and soft X-ray beamline in the SSRF Phase-II Project. BL07U is the combination of XAS, X-ray magnetic circular dichroism (XMCD), X-ray magnetic linear dichroism (XMLD), Nano resolved-Angle resolved photoemission spectroscopy (Nano-ARPES) and Spin resolved-Angle resolved photoemission spectroscopy (Spin-ARPES) beamline. The beamline is equipped with a pair of elliptical polarized undulators (EPUs) and a variable-included-angle plane-grating monochromator, and delivers circularly polarized or linear-polarized X-rays in the energy range from 50 to 2000 eV. The beamline has two branches: one dedicated to Nano-ARPES, which has a minimum spot size of only 200 nm, and another branch dedicated to Spin-ARPES, vector magnetic field and high magnetic field endstations. The energy-resolving power of BL07U is over 9000 at 867 eV and 15,000 at 91 eV. The photo flux of BL07U is over 2.5 × 10¹¹ photons/s/0.01%BW at 867 eV and 2.6 × 10⁹ photons/s/0.01%BW at 91 eV. The spot size is 150 × 50 μ m 2 at 91 eV.
The TEY and TFY experiments can be carried out simultaneously at the BL07U beamline. Figure 1 shows the hardware of the BL07U XAS measurement system. It consists of 5 channels for measurement. The incident X-ray photon flux I0 can be measured in two channels. One channel detects I0 by a toroidal mirror (TM) with a gilded surface in the X-ray light path. Another channel detects I0 by a clean gold mesh in the X-ray light path. The sample signal can be obtained through three other channels. The standard sample current is connected to the input of the current amplifier by using a shield cable. The standard sample has a known high-purity composition; hence, it is commonly used to calibrate and test the performance of instruments at the beamline. It can also be used to infer the composition of the sample to be analyzed by comparing the spectra, as well as to reduce the error on the beam energy calibration if it is acquired simultaneously. The TFY method measures the fluorescent X-ray that can arise from a deeper region of the sample. For the TEY experiment, the sample current is also connected to the input of the current amplifier via a shield cable. For the TFY experiment, the fluorescence signal of the sample is detected by a photodiode (PD) that was placed in front of the sample and outside the X-ray light path. The PD signal is connected to the input of the current amplifier. All of the above 5 channel measurements can be removed, placed into the X-ray path, or half-cut by the X-ray by controlling the motor of the corresponding bracket.
Five Stanford SR570 amplifiers were used to measure the TM current, the gold mesh current, the standard sample current, and the TEY and the TFY signals, respectively. The SR570 has a sensitivity setting from 1 pA / V to 1 mA / V [29]. In the experiment, the sensitivity was set from 20 pA / V to 100 nA / V , which could cover the current range. The SR570 contains two first-order RC filters and users can configure cutoff frequency and type from the front panel. Together, the filters can be configured as a 6 or 12 dB/oct rolloff low-pass or high-pass filter, or as a 6 dB/oct rolloff band-pass filter. Cutoff frequencies are adjustable from 0.03 Hz to 1 MHz [29]. In the experiment, the SR570 was configured as a 12 dB/oct rolloff low-pass filter and the cutoff frequency was set at 30 Hz. This parameter setting could effectively suppress the noise caused by the low temperature, magnetic field and vibration of vacuum equipment. The SR570 provides an input offset-current adjustment to suppress any undesired DC background currents. Offset currents can be specified from ±1 pA to ±1 mA in roughly 0.1% increments [29]. In the experiment, the input offset current was set from 1 pA to 1 nA , which could suppress any unwanted DC background currents.
The SR570 converted current signal into direct voltage. Subsequently, the Volt-Frequency converter received the voltage and converted it to frequency to improve linearity and enhance anti-interference capacity. Each Volt-Frequency converter has two inputs, and three Volt-Frequency converters were used. Finally, the SIS3820 board received the frequency signals.
The SIS3820 combines the functionality of multi-scalers and standard counters and without compromising performance [30]. One key feature of the SIS3820 is that it has 32 channels, which ensures that 5 channels of data can be collected simultaneously during the experiment. The SIS3820 accepts inputs with a frequency of up to 250 MHz. In standard counter/scaler mode, it can read data on the fly with an accuracy to the least signal. No count is lost in read on the fly mode. Compared with the picoammeter, the SIS3820 can realize the fly scan function.
The SIS3820 counted the frequency signal according to the trigger signal from the embedded CPU MVME5500 board and sent the counting to the MVME5500 board. The MVME5500 and SIS3820 board ran in a Virtual Machine Environment (VME) machine and communicated via VME bus. The MVME5500 board transmitted these counting data to the computer via Ethernet according to the commands from the experimental computer.

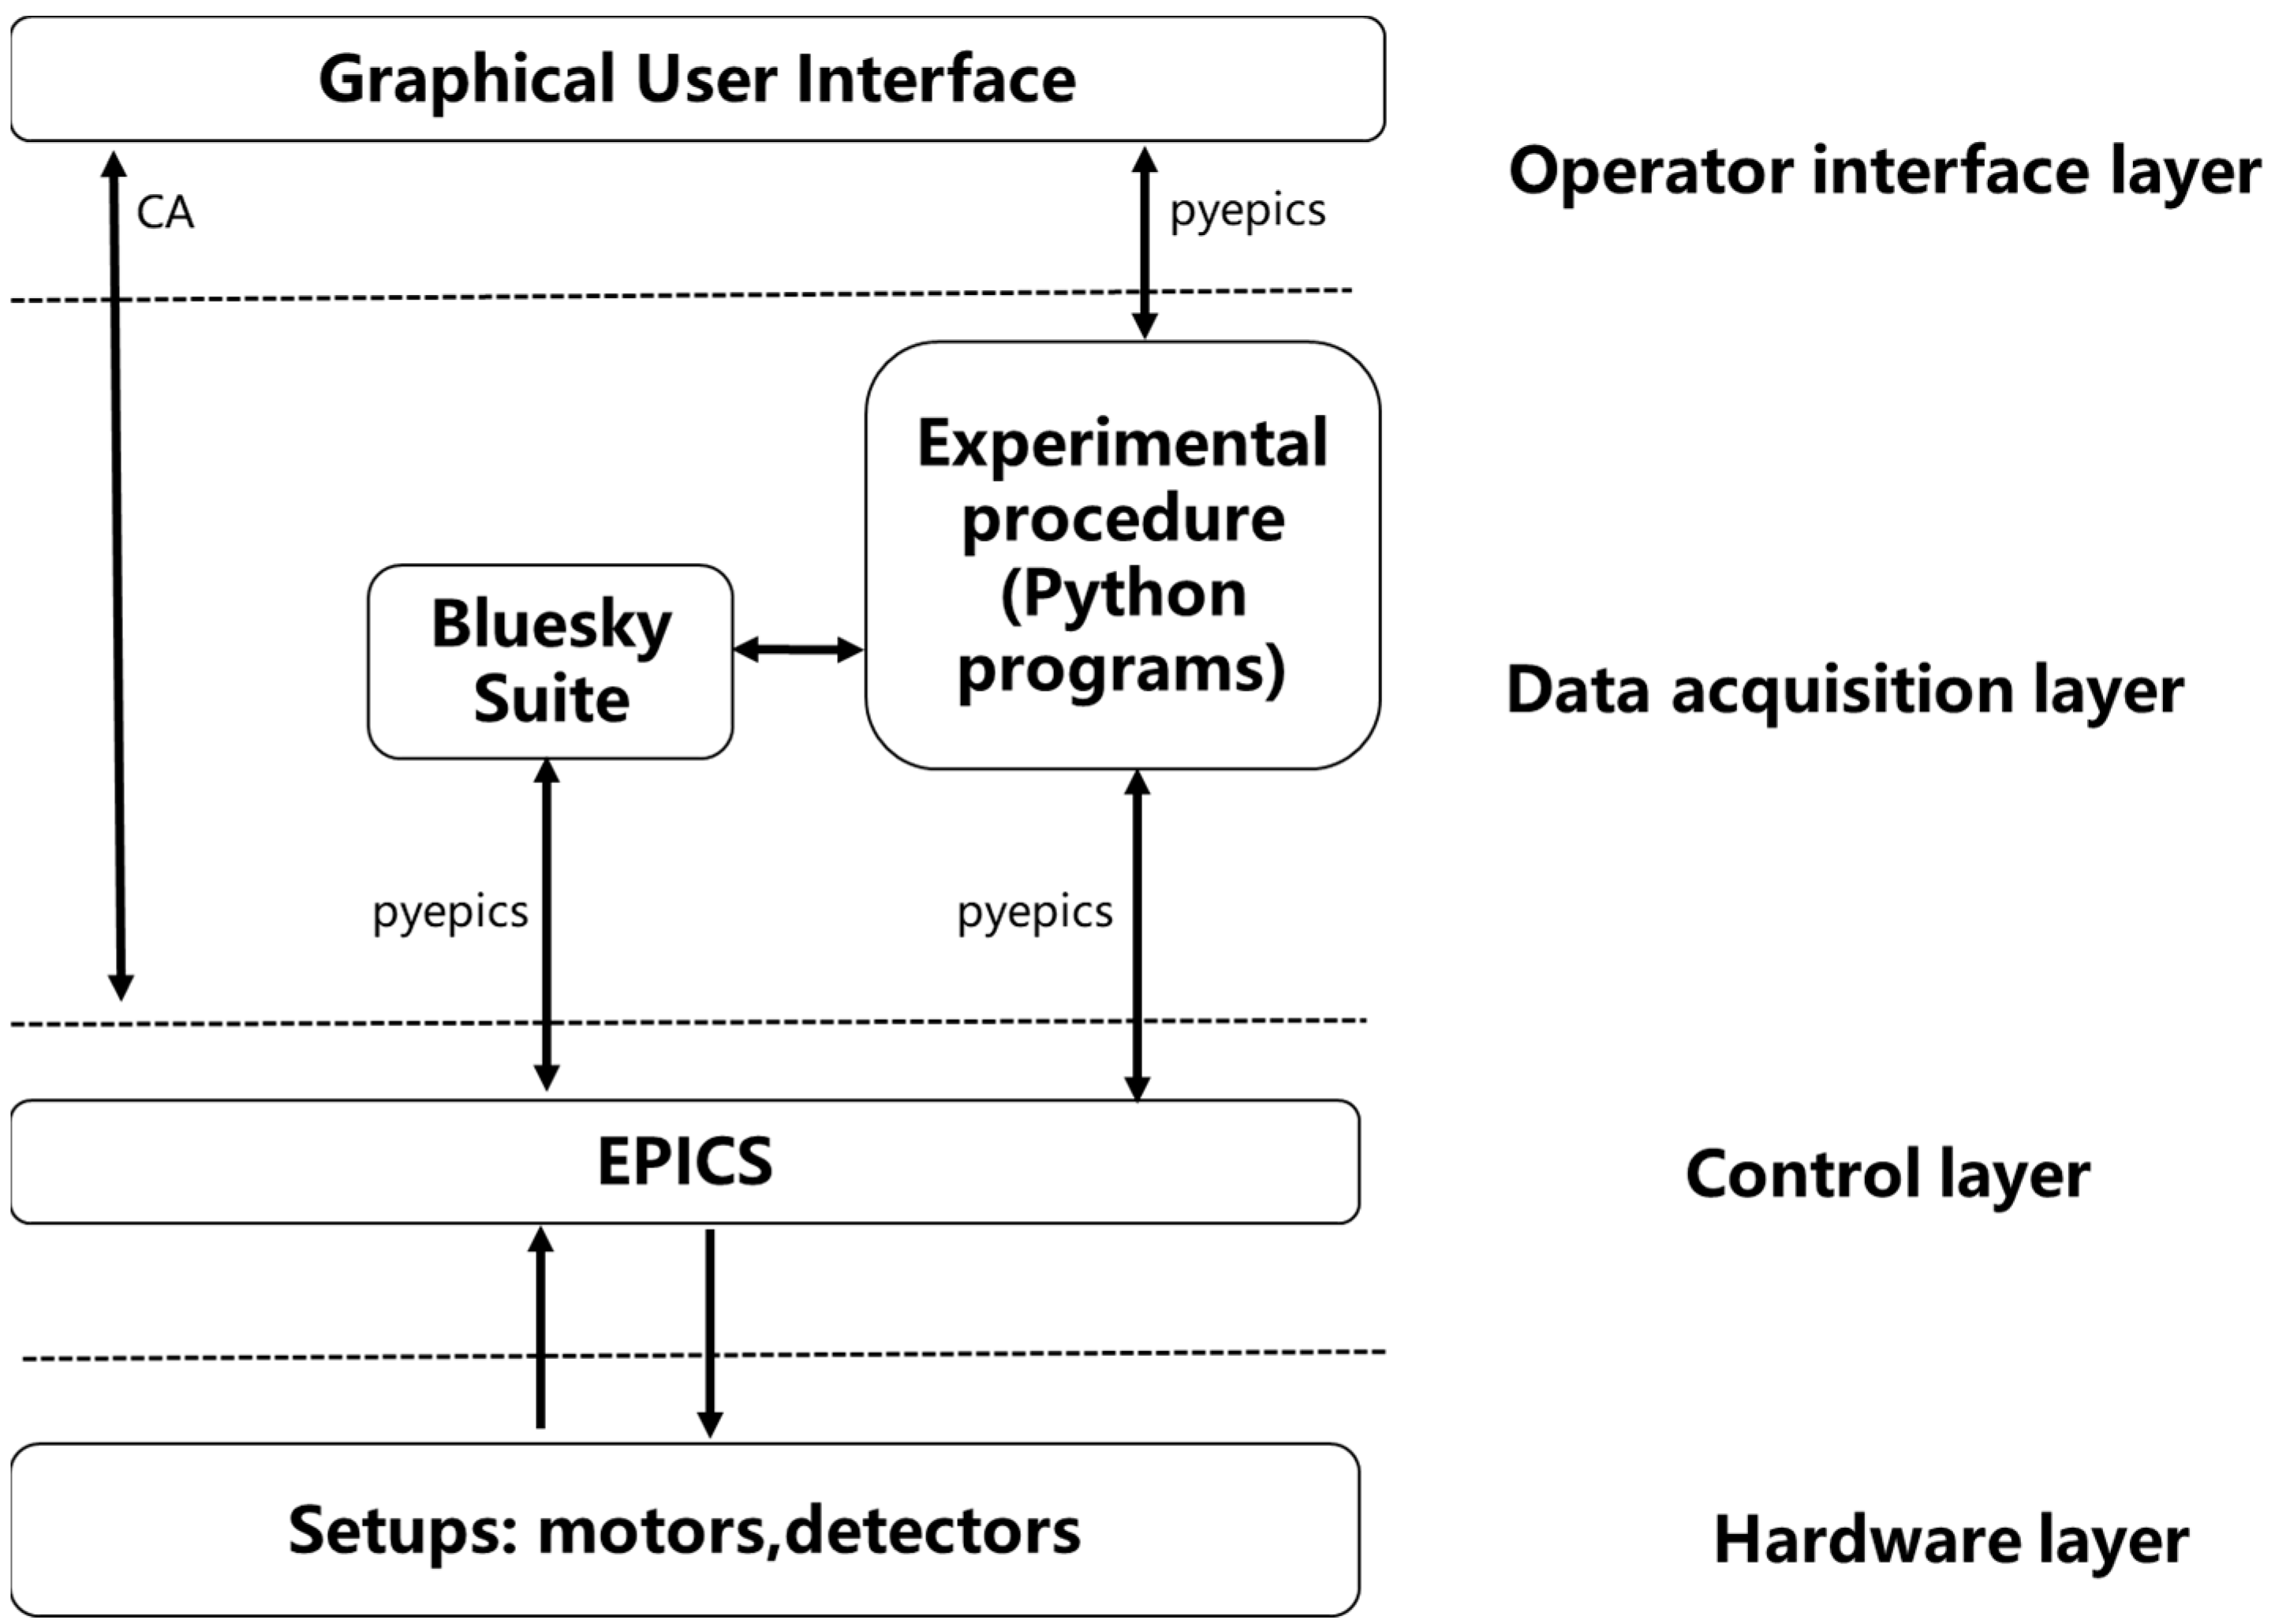
2.2. Control and Data Acquisition Architecture

The architecture, shown in Figure 2, of the control and data acquisition software developed for the BL07U line is based on Bluesky suite and EPICS. The design concepts of these packages allow for building a versatile data acquisition system. From the bottom to the top are the hardware layer, the control layer, the data acquisition layer and the operator interface layer.
Specifically, the hardware layer consists of all the setups, including one toroidal mirror, one double crystal monochromator, five SR570 amplifiers, three Volt-Frequency converters, one scaler SIS3820, one embedded CPU MVME5500 and one Virtual Machine Environment (VME) machine.
The control layer is developed based on EPICS. EPICS consists of two major components: Input/Output controller (IOC) and Operator Interface (OPI) [5,31]. The IOC uses Process Variables (PVs) to control spectroscopy setups. For example, via corresponding PVs, the monochromator can change its energy, angle and status; and the scaler SIS3820 can set its dwell time, status and 32-channel scaler value. IOC runs on the embedded CPU MVME5500 in the vxWorks operating system. OPI runs on the experimental computer in the CentOS operating system. OPI and IOC generally exchange PVs data by EPICS Channel Access (CA) protocol via Ethernet.
The data acquisition layer is developed based on Bluesky suite, which is a suite of Python code. EPICS provides CA application interface libraries with various high-level languages, and the interface with Python is PyEpics [5]. The control layer and the data acquisition layer communicate through the PyEpics mechanism.
The operator interface layer offers a graphical user interface (GUI), and the GUI is developed based on Control System Studio (CSS) [32]. CSS is an OPI application software supported by EPICS. CSS communicates with the control layer in real time through the CA mechanism and the data acquisition layer in real time through PyEpics, respectively.

2.3. Control and Data Acquisition Software

The control and data acquisition software of BL07U is developed based on the above architecture. Because of the design concepts of Bluesky suite and EPICS, using the above architecture as a base allows for building a versatile data acquisition system. The data acquisition system in BL07U consists of six types of working modules, which are the time scan module, the normal energy scan module, the segmented energy scan module, the monochromator and Elliptically Polarizing Undulator (EPU) 58 linkage module, the monochromator and EPU90 linkage module, and a plotting module. The data acquisition system has the capability of running different irradiation experiments simultaneously. Figure 3 shows the software flow of all scan modules. Figure 4 shows the GUI software and a live visualization result.
For the time scan module, users set the energy value and monitor the X-ray photon flux in real time. For the normal scan module, users set the starting and ending energy points and the dwell time, and run the function scripts by clicking the START button. For the segmented scan module, users can use different scan precision in different energy ranges. For the monochromator and EPU linkage module, users set the energy parameters, and the function scripts automatically calculate the corresponding gap value. By combining energy and gap, the quality of absorption spectrum measurement can be improved. The linkage module consists of linkage with EPU58 and EPU90. The linkage with EPU58 is suitable for the measuring of elements with large energy absorption edge, while the linage with EPU90 is suitable for the measuring of elements with small energy absorption edge.
For the plot module, users can use the saved data to reproduce spectra in one experiment or compare spectra in multiple experiments. Figure 5 shows the plot module interface. With the plot module, users can select XAS results in different experiments, and click the Plot button. The Python program can automatically read and compare data, so as to quickly and intuitively determine whether the samples have XMCD or XMLD signals.
For all scan modules, experiments can be run unattended, automatically suspending and resuming if needed. The data (live) are exported in .cvs format and saved on the experimental computer. During all the experiments, the data are available for online visualization and processing.
The development of BL07U software focuses on the use of the SIS3820 and the monochromator. EPICS offers two modules for SIS3820 control: mca [33] and std [34]. Drivers of the mca and std modules are both written to support the use of the SIS3820 as a multichannel scaler. Both modules offer 32 records corresponding to 32 channels of SIS3820. There are additional records to control the start-and-stop acquisition of the device, and control the dwell time and channel-advance source. The channel-advance source is used to tell the hardware whether to advance the current channel according to its internal clock, or in response to an external channel-advance signal. The main difference between the two modules is the data storage method during the experiment. The std module provides a variable for each channel that is used to update the real-time data. Meanwhile, the mca module provides an array for each channel that is updated to store real-time data.
After comprehensive consideration of live visualization and the ability given by mca and std, we decided whether to use std or mca module at control layer. Table 3 shows the configurations for these five scan modules. The time scan module adopted the mca module at control layer and adopted the array-friendly CSS to realize live visualization. In the experiment of the normal energy scan module and the segmented energy scan module, the SIS3820 should collect data once after each step of the monochromator. These two modules selected the std module at control layer and called EpicsMotor and blcgscaler class in the data acquisition layer. The EpicsMotor class is offered by ophyd. By calling EpicsMotor, data acquisition layer invocation of the monochromator can be achieved. The blcgscaler is a custom class. The blcgscaler class is inherited from the Device class in ophyd. The blcgscaler class added a parameter called spectrum and defined the spectrum value in the trigger function. This spectrum was used to display the absorption spectrum in real time. By calling the customized blcgscaler class, the system can collect the multi-channel data simultaneously and realize the live visualization of the multi-channel data.
Compared with the normal energy scan module and the segmented energy scan module, the EPU58 and EPU90 linkage module called two customized class gap58Motor and gap90Motor. The gap58Motor and gap90Motor class added a parameter called gap_value and defined the gap_value value in the trigger function. The gap_value value corresponds to the monochromator value. The gap_value value is assigned to the EPU when the monochromator reaches the target value, and the EPU then moves to the gap_value value. By calling gap58Motor and gap90Motor, the monochromator and EPU can be interlinked.
Moreover, Bluesky suite contains a number of pre-built devices for common hardware as well as the tools to build customized devices. Bluesky suite encapsulates many common functions such as scan and count. These ensure that the BL07U data acquisition system is very versatile.

3. Results

The experiment regarding the Ti L-edge absorption spectra of the standard sample TiO2 and the sample containing Ti element was carried out in BL07U using TEY method. This experiment adopted the normal energy scan module. The range of the scan energy was from 452 to 470 eV . The scan step was 0.1 eV . The dwell time at each energy point was 0.2 s. These preceding parameters were set through the GUI. The normal energy scan module can measure 32 channels of data simultaneously. In this experiment, the channel-2 was selected to measure the photon flux of standard sample TiO2 in semi-cut light state. The channel-4 was selected to measure the incident photon flux detected by a clean gold mesh. The channel-5 was selected to measure the photon flux of the sample. The selection of channels was achieved through the interface. After the samples were placed and the above parameters were set through the interface, the energy scan was carried out automatically by clicking the Start button. In the process of energy scan, the Python script realized live visualization by calling the LivePlot function. When the energy scan was completed, the experimental data was automatically saved to a .cvs file.
The above experimental data were processed, and the spectra of channel-2 and channel-5 were normalized to the incident photon flux of channel 4. The TEY spectrum of standard sample TiO2 is shown in Figure 6. The TEY spectrum of sample is shown in Figure 7. The incident photon flux is detected by a clean gold mesh and shown in Figure 8.

4. Discussion

Using the BL07U data acquisition system, users obtained the Ti L-edge absorption spectra of TiO2 standard sample and users’ samples at the same time. The peaks of absorption spectra in Figure 6 and Figure 7 were roughly the same, and Figure 6 is the standard sample of TiO2, so it indicated that the user’s sample was a Ti compound. The difference in the peaks’ shapes between Figure 6 and Figure 7 indicated that the coordination and valence states of Ti were different. The data in Figure 6 and Figure 7 were obtained simultaneously, so the difference in the peaks’ shapes was not caused by the difference in incident photon flux.
The simultaneous measurement of multiple channels has three advantages: First, it shortens the experiment time. Second, the experimental results suffer from less systematic uncertainties as the effect induced by the non-uniformity of the incident photon flux is ruled out. Third, the error on the beam energy calibration can be reduced by inquiring the theoretical value of the peak position of the standard sample.

5. Conclusions

A unified and extensible data acquisition system based on Bluesky suite has been developed. The data acquisition system can be invoked and executed through input instructions or through GUI. SSRF users prefer and are accustomed to using the GUI interface, so all user-defined parameters, initialization, composition, execution procedures, etc., are implemented through the GUI interface. In SSRF, massive data storage and full life-cycle management, real-time data analysis, data mining and artificial intelligence and automation are possible, and those functions are supported by the Big Data Science Center system [35,36].
The experiment result at BL07U shows that with up to five channel signals, the system is capable to collect signals of experimental sample, standard sample and incident photon flux simultaneously. For users, when conducting experiments at the BL07U, TEY and TFY data acquisition can be implemented at the same time thanks to the hardware layout of the beamline. In addition, the SR578 in the hardware layer filters out the medium and high frequency noise and suppresses the DC background current, giving the system the characteristics of low noise and high signal-to-noise ratio. User experimental efficiency and quality are highly improved.
In addition, for the Bluesky suite, all devices are abstracted into only two categories: motors and detectors. Whether they are motors or detectors, they can be represented by a Python object, in that they can be read or set. The interface is general enough to address every kind of hardware SSRF has encountered. Therefore, with the architecture, modules and interface developed for BL07U, the system can be extended to more beamlines efficiently and easily.

Author Contributions

Conceptualization, Z.Z., J.C., and Y.Z.; software, Y.Z. and Z.Z.; formal analysis, Y.Z., C.W., and J.C.; data curation, Y.Z.; writing—original draft preparation, Y.Z.; writing—review and editing, Y.Z., C.W., J.C., and C.H.; funding acquisition, Y.Z. All authors have read and agreed to the published version of the manuscript.

Funding

This research and the article processing charge were funded by National Natural Science Foundation of China (NO.12105351) and the Youth Innovation Promotion Association, CAS (Grant no. 2022290).

Institutional Review Board Statement

Not applicable.

Informed Consent Statement

Not applicable.

Data Availability Statement

The data presented in this study are available on request from the corresponding author.

Acknowledgments

The research team would like to thank all participants for participating in the study during the pandemic.

Conflicts of Interest

The authors declare no conflict of interest.

References

  1. Yin, L.; Tai, R.; Wang, D.; Zhao, Z. Progress and future of shanghai synchrotron radiation facility. J. Vac. Soc. Jpn. 2016, 59, 198–204. [Google Scholar] [CrossRef]
  2. Zhao, Y.; Zhou, Y.; Hu, C.; Zhang, X.; Zhang, Z. Git-based Version Control for Beamline Control System at the Shanghai Synchrotron Radiation Facility. In Proceedings of the 2018 5th International Conference on Systems and Informatics (ICSAI), Nanjing, China, 10–12 November 2018; IEEE: Piscataway, NJ, USA, 2018; pp. 134–138. [Google Scholar]
  3. Zheng, L.F.; Liu, P.; Zhang, Z.H.; Hu, C.; Mi, Q.R.; Wu, Y.F.; Gong, P.R.; Zhu, Z.X.; Li, Z. SSRF Beamline Control System. AIP Conf. Proc. Am. Inst. Phys. 2010, 1234, 805–808. [Google Scholar]
  4. Dalesio, L.R.; Kozubal, A.J.; Kraimer, M.R. EPICS Architecture; Los Alamos National Lab.: Santa Fe, NM, USA, 1991. [Google Scholar]
  5. Experimental Physics and Industrial Control System Website. Available online: http://www.aps.anl.gov/epics/ (accessed on 10 May 2022).
  6. Wang, Q.; Huang, S.; Sun, B.; Tang, L.; He, J. Control and data acquisition system for the macromolecular crystallography beamline of SSRF. Nucl. Tech. 2012, 35, 5–11. [Google Scholar]
  7. Zhou, P.; Yang, C.M.; Hong, C.X.; Bian, F.G.; Wang, Y.Z.; Wang, J. EPICS-based control system and data acquisition system of small angle X-ray scattering beamline. Atom. Energy Sci. Technol. 2017, 51, 1521. [Google Scholar]
  8. Cheng, Y.S.; Kuo, C.H.; Chen, J.; Liao, C.Y.; Chiu, P.C.; Chang, Y.T.; Hsu, K.T. Implementation of the EPICS data archive system for the TPS project. In Proceedings of the THPEA049, IPAC2013, Shanghai, China, 12–17 May 2013. [Google Scholar]
  9. Lan, X.; Yang, K.; Liang, D.; Yan, S.; Mao, C.; Li, A.; Wang, J. SPEC application for achieving inelastic X-ray scattering experiment in the SSRF. arXiv 2015, arXiv:1508.06726. [Google Scholar]
  10. Liu, H.; Zhou, Y.; Jiang, Z.; Gu, S.; Wei, X.; Huang, Y.; Zou, Y.; Xu, H. QXAFS system of the BL14W1 XAFS beamline at the Shanghai Synchrotron Radiation Facility. J. Synchrotron Radiat. 2012, 19, 969–975. [Google Scholar] [CrossRef]
  11. Li, N.; Li, X.; Wang, Y.; Liu, G.; Zhou, P.; Wu, H.; Hong, C.; Bian, F.; Zhang, R. The new NCPSS BL19U2 beamline at the SSRF for small-angle X-ray scattering from biological macromolecules in solution. J. Appl. Crystallogr. 2016, 49, 1428–1432. [Google Scholar] [CrossRef]
  12. Yu, H.; Wei, X.; Li, J. The XAFS beamline of SSRF. Nucl. Sci. Tech. 2015, 26, 4–10. [Google Scholar]
  13. Bluesky Suite Website. Available online: https://blueskyproject.io/ (accessed on 15 July 2021).
  14. Sardana Website. Available online: https://www.sardana-controls.org/ (accessed on 10 June 2019).
  15. GDA Website. Available online: https://www.opengda.org/OpenGDA.html (accessed on 8 May 2020).
  16. Yu, R.; Cao, J.F.; Meng, X.Y.; Zhu, F.Y.; Li, J.Q.; Qu, G.X.; Huang, Y.B.; Wang, Y.; Tai, R.Z. Highly Tunable Charge–Spin Conversion in Topological Insulator Cr0.08-(Bi0.37Sb0.63)1.92Te3 via Ferroelectric Polarization. ACS Appl. Mater. Interfaces 2022, 14, 48171–48178. [Google Scholar] [CrossRef]
  17. Pei, D.; Wang, B.; Zhou, Z.; He, Z.; An, L.; He, S.; Chen, C.; Li, Y.; Wei, L.; Liang, A.; et al. Observation of Γ-valley moiré bands and emergent hexagonal lattice in twisted transition metal dichalcogenides. Phys. Rev. X 2022, 12, 021065. [Google Scholar] [CrossRef]
  18. Liu, H.; Cao, J.; Wang, Y.; Chen, Z.; Yu, H.; Zhang, L.; Xu, Z.; Guo, Z.; Zhang, X.; Zhen, X.; et al. Soft x-ray spectroscopic endstation at beamline 08U1A of Shanghai Synchrotron Radiation Facility. Rev. Sci. Instr. 2019, 90, 043103. [Google Scholar] [CrossRef] [PubMed]
  19. Himpsel, F.J. Photon-in photon-out soft X-ray spectroscopy for materials science. Phys. Status Solidi (B) 2011, 248, 292–298. [Google Scholar] [CrossRef]
  20. Liu, X.; Yang, W.; Liu, Z. Recent progress on synchrotron-based in-situ soft X-ray spectroscopy for energy materials. Adv. Mater. 2014, 26, 7710–7729. [Google Scholar] [CrossRef] [PubMed]
  21. Xiao, Q.; Maclennan, A.; Hu, Y.; Hackett, M.; Leinweber, P.; Sham, T.K. Medium-energy microprobe station at the SXRMB of the CLS. J. Synchrotron Radiat. 2017, 24, 333–337. [Google Scholar] [CrossRef] [PubMed]
  22. Luo, J.; Niu, Q.; Jin, M.; Cao, Y.; Ye, L.; Du, R. Study on the effects of oxygen-containing functional groups on Hg0 adsorption in simulated flue gas by XAFS and XPS analysis. J. Hazard. Mater. 2019, 376, 21–28. [Google Scholar] [CrossRef]
  23. Sun, T.; Meng, X.; Cao, J.; Wang, Y.; Guo, Z.; Wang, Z.; Liu, H.; Zhang, X.; Tai, R. A portable data-collection system for soft x-ray absorption spectroscopy in the Shanghai Synchrotron Radiation Facility. Rev. Sci. Instr. 2020, 91, 014709. [Google Scholar] [CrossRef]
  24. Kéri, A.; Dähn, R.; Krack, M.; Churakov, S.V. Characterization of Structural Iron in Smectites—An Ab Initio Based X-ray Absorption Spectroscopy Study. Environ. Sci. Technol. 2019, 53, 6877–6886. [Google Scholar] [CrossRef]
  25. Isomura, N.; Kutsuki, K.; Kataoka, K.; Watanabe, Y.; Kimoto, Y. Distinguishing nitrogen-containing sites in SiO2/4H-SiC (0001) after nitric oxide annealing by X-ray absorption spectroscopy. J. Synchrotron Radiat. 2019, 26, 462–466. [Google Scholar] [CrossRef]
  26. Lapeyre, G.J.; Smith, R.J.; Knapp, J.; Anderson, J. Constant final energy and constant initial energy spectroscopy. Le J. De Phys. Colloq. 1978, 39, C4-134–C4-141. [Google Scholar] [CrossRef]
  27. Niibe, M.; Kotaka, T.; Mitamura, T. Investigation of analyzing depth of NK absorption spectra measured using TEY and TFY methods. In Journal of Physics: Conference Series; IOP Publishing: Bristol, UK, 2013; Volume 425, p. 132008. [Google Scholar]
  28. Stöhr, J. NEXAFS Spectroscopy; Springer Science & Business Media: Berlin, Germany, 2013. [Google Scholar]
  29. Low Noise Current Preamplifier SR570. Available online: https://www.thinksrs.com/products/sr570.html (accessed on 6 April 2021).
  30. SIS3820 VME Histogramming Scaler/Multiscaler/Counter. Available online: https://www.struck.de/sis3820.htm (accessed on 21 March 2021).
  31. Zhou, Y. Study and realization on QXAFS data acquisition system based on EPICS at SSRF. Ph.D. Thesis, Shanghai Institute of Applied Physics, Chinese Academy of Sciences, Shanghai, China, 2015. [Google Scholar]
  32. CS-Studio(Phoebus) Website. Available online: https://controlssoftware.sns.ornl.gov/css_phoebus/ (accessed on 10 May 2022).
  33. Experimental Physics and Industrial Control System Website. Available online: https://epics-controls.org/resources-and-support/modules/soft-support/ (accessed on 10 May 2022).
  34. Experimental Physics and Industrial Control System Website. Available online: https://epics.anl.gov/bcda/synApps/std/std.html (accessed on 10 May 2022).
  35. Wang, C.; Yu, F.; Liu, Y.; Li, X.; Chen, J.; Thiyagalingam, J.; Sepe, A. Deploying the big data science center at the Shanghai synchrotron radiation facility: The first superfacility platform in China. Mach. Learn. Sci. Technol. 2021, 2, 035003. [Google Scholar] [CrossRef]
  36. Wang, C.; Steiner, U.; Sepe, A. Synchrotron big data science. Small 2018, 14, 1802291. [Google Scholar] [CrossRef] [PubMed]
Figure 1. The hardware of BL07U measurement system.
Applsci 13 05829 g001
Figure 2. The BL07U control and data acquisition architecture.
Applsci 13 05829 g002
Figure 3. The software flow of four energy scan modules.
Applsci 13 05829 g003
Figure 4. The Graphical User Interface based on CSS and live visualization.
Applsci 13 05829 g004
Figure 5. The plot module interface.
Applsci 13 05829 g005
Figure 6. The Ti L-edge absorption spectra of TiO2 standard sample measured with semi-cut incident X-ray.
Applsci 13 05829 g006
Figure 7. The Ti L-edge absorption spectra of sample.
Applsci 13 05829 g007
Figure 8. The incident photon flux detected by a clean gold mesh.
Applsci 13 05829 g008
Table 1. Detailed overview of the 16 state-of-the art beamlines of the SSRF Phase-II Beamline Project.
IDNameSourceEnergy Range
BL20U1 BL20U2Energy Material Beamline (E-line)IVU+EPU130 eV~18 keV
BL11BHard X-ray Spectroscopy BeamlineBM5~30 keV
BL16U1Medium-energy Spectroscopy BeamlineU2.1~16 keV
BL07USpatial-resolved and Spin-resolved ARPES and Magnetism Beamline (S2-line)Twin
EPU
50~2000 eV
BL02U1Membrane Protein Crystallography BeamlineIVU7~15 keV
BL02U1Surface Diffraction BeamlineCPMU4.8~28 keV
BL03SBLaue Micro-diffraction BeamlineSB7~30 keV
BL13UHard X-ray Nanoprobe BeamlineIVU5~25 keV
BL18B3D Nano Imaging BeamlineBM5~14 keV
BL05U&
BL06B
Dynamics Beamline (D-line)IVU+BM5~25 keV
10~10,000 cm−1
BL10U1Time-resolved USAXS BeamlineIVU8~15 keV
BL16U2Fast X-ray Imaging BeamlineCPMU8.7~30 keV
BL10U2Biosafety P2 Protein Crystallography BeamlineIVU7~18 keV
BL13SSWRadioactive Materials BeamlineW5~50 keV
BL12SWUltra-hard X-ray Applications BeamlineSCW30~150 keV
BL03SS (ID)Laser Electron Gama Source Beamline (SLEGS)ID0.4~20 MeV
BL09BX-ray Test BeamlineBM4~30 keV
Table 2. The development environment of the endstation data acquisition system at the SSRF Phase-I Project and the FBP beamlines.
IDSoftware Development Environment
SSRF Phase-I ProjectBL08U1-A, BL13W1 C Language
BL08U1-B, BL15U1EPICS
BL14W1, BL16B1Labview
BL14B1SPEC
BL17U1Blu-Ice/DCS
FBPBL01B1, BL09UNiche business software
BL17B, BL18U, BL19U1Blu-Ice/DCS
BL19U2EPICS
BL02B, BL03U Niche business software
Table 3. The configurations of five scan modules.
Scan
Module
Live
Visualization
Hardware LayerControl layer
(EPICS Module: std or mca)
Data Acquisition
Layer (Bluesky Suite Pre-Built
Device)
Customized
Class
Time
scan
CSSSIS3820mca//
Normal
energy
scan
LivePlotMonochromator,
SIS3820
std, motorEpicsScaler,
EpicsMotor
blcgscaler
Segmented
energy scan
LivePlotMonochromator,
SIS3820
std, motorEpicsScaler,
EpicsMotor
blcgscaler
EPU58
linkage
LivePlotMonochromator,
SIS3820,
EPU58
std, motorEpicsScaler,
EpicsMotor
blcgscaler,
gap58Motor
EPU90
linkage
LivePlotMonochromator,
SIS3820,
EPU58
std, motorEpicsScaler,
EpicsMotor
blcgscaler,
gap90Motor
Disclaimer/Publisher’s Note: The statements, opinions and data contained in all publications are solely those of the individual author(s) and contributor(s) and not of MDPI and/or the editor(s). MDPI and/or the editor(s) disclaim responsibility for any injury to people or property resulting from any ideas, methods, instructions or products referred to in the content.

