Abstract
In this study, the optimum spraying performance of a pressurized vortex atomizer using water as the working fluid was investigated experimentally by modifying the geometry of auxiliary air holes via the Taguchi method. The experimental results were also examined by CFD simulations. The four control factors of the auxiliary air holes are their numbers, areas, inclination angles, and lengths. With five levels for each control factor, an L25 orthogonal table was selected. Each case of the L25 orthogonal table was test repeatedly three times to obtain key average results. The auxiliary air holes were designed by a KISSlicer CAD tool and fabricated by 3D printing. The 3D printing was carried out by fused deposition of PLA with a resolution of about 30 μm. In the experiments, the spraying jet patterns were recorded, and the water droplet weights were measured. By using the signal to noise ratios and the smaller-the-better quality characteristic, the effect of the control factors of the auxiliary air holes in descending order is the numbers, areas, inclination angles, and hole lengths, respectively. The optimum air hole configuration is the one with six holes, an inclination angle of 20°, an area of 18 mm2, and a length of 8 mm. The optimum condition was confirmed by a signal to noise ratio of 20.5 dB with 95% confidence interval. The resulting smaller jet opening angle is about 42°, close to the simulated angle of 45°. That is, by the novelty of combining 3D printing with the Taguchi method, this study obtains the optimum design with fast prototyping and relatively few experiments.
1. Introduction
Liquid spraying by atomizers is needed in various applications such as cooling, agriculture, and industries. They are even more important in areas/spaces requiring disinfection due to pandemic such as COVID-19 as human life is involved and threatened. In general, disinfection is carried out by atomized spraying via compression atomizers, ultrasonic atomizers, or mesh atomizers, depending on the atomizing functions, applications, and the environments. The requirement of the sprayed disinfectant is that the spray should cover uniformly over a large space for effective disinfection. The atomization of the liquids to be sprayed can be achieved usually via liquid filament breakups, liquid film breakups, or droplet breakups, basically through flow instability. Taking the instability liquid filament breakups as an example, Lefebvre and McDonell (2017) [1] indicated that at the ratio of the disturbance wavelength to the liquid filament diameter of 4.51, the liquid filament will breakup into droplets. As atomization is related to the stability of liquid breakups, various methods have been evaluated to improve its performance such as surface smoothing, air assisting, geometry variations, etc. For surface smoothing, Liang et al. (2023) [2] improved the performance of piezoelectric atomizers by using electrolytic polishing to increase the atomization amounts by up to 3.93 times.
For air assisting, flow swirl is always accompanied. Krawczyk and Badyda (2015) [3] proposed a CFD numerical design procedure for liquid-to-air atomizers to improve atomization performance. Ochowiak et al. (2020) [4], for their two-phase conical swirl atomizers, found that the discharge coefficient and spray angle are affected by the Reynolds number, flow rate, and atomizer geometry; Yadav et al. (2011) [5] showed that the droplets could be varied by changing the mass ratio of the air to liquid for their internally mixed atomizer; Chinn et al. (2015) [6] observed wave patterns in the liquid film of their air-core atomizers, whereas Wang et al. (2008) [7] observed flow branching and focusing in their air-assist micro-atomizer. Additionally, Wachter et al. (2022) [8] developed a model to scale the liquid mass flow in gas-assisted coaxial nozzles.
For geometric effects, Maly et al. (2018) [9] showed that a proper location for flow spill can stabilize the atomization process. Zhao et al. (2014) [10] showed that the exit area of the atomizer affected the morphology of the droplets of liquid jets. Levitsky and Tavor (2020) [11] studied a new mechanical atomizer with optimal geometric parameters for the swirler and a preliminary swirl stage, which was followed by a swirl chamber where air was introduced in an air-assisted atomizer.
Furthermore, the geometric effect is always coupled with the atomizing pressure. For example, Baltrėnas and Baltrėnaitė-Gedienė (2019) [12] showed the importance of the inner shield depth and pressure to the size of the droplets. Additionally, Li et al. (2019) [13] further pointed out, both numerically and experimentally, the importance of the shaping air holes of the atomizer, in addition to the importance of pressure. Wittner et al. (2019) [14] revealed that enlarging the exit size could decrease the atomization efficiency in the pressure range from 0.4 to 0.8 MPa. They were able to generate droplets with a Sauter mean diameter of 5~6 μm under high pressure. Alternately, Marchewicz et al. (2019) [15] studied the inductive charging effects on the droplets. Their results revealed that lower nozzle flow rates generated sprays with a higher specific charge due to a smaller Sauter mean diameter. The modeling and experimental results of Belhadef et al. (2012) [16] indicated that the formation of hollow conical sprays resulted in large droplets and the recirculation zones with small droplets.
In addition to coaxial air-assisted flows, cross flow situations have also been explored. As examples, Zhang et al. (2013) [17] revealed the presence of coherent structures that broke down flow stability and affected the flow mixing process significantly for hollow cone sprays in a crossflow. Tambe et al. (2005) [18] observed that the droplet size depended on the momentum ratios for subsonic liquid jets in a cross flow. Sallam et al. (2006) [19] showed different droplet breakup mechanisms for non-turbulent and turbulent liquid jets in cross flows. Moreover, Costa et al. (2006) [20] showed the importance of the jet angle to the cross flow.
The above literature clearly indicates that the behavior of the atomizers of pressured atomization of droplets depends on various factors, including atomizing pressure, nozzle diameter, momentum ratio, liquid jet angle, electrical charge, etc. Hence, an efficient approach to determine and validate the optimum control factors of the atomizers is essential for their effective timely utilization. Thus, in this study, the approach of combining both 3D printing and the Taguchi method was taken to explore and optimize the spray performance for practical applications with the goal of uniform spraying. The experimental results were also examined by CFD simulations.
2. Fabrication of Auxiliary Air Channels of the Vortex Atomizer by 3D Printing
This study adopted 3D printing to fabricate the vortex atomizers for its fast prototyping and low cost. Three-dimensional printing is a versatile, additive manufacturing technique. For economic parts, thermal plastic materials, such as environmentally friendly PLA, are always used. The structural strength of 3D printed parts can be increased by various methods. For example, Khosravani and Reinicke (2022) [21] incorporated nylon and fiberglass materials in their 3D printed parts and showed that the fracture resistance could be improved. Alternatively, printing directions also play a role as illustrated by Aranda et al. (2022) [22]. They showed that the fracture toughness increased by printing the fibers vertically instead of horizontally. Similarly, Chacon et al. (2017) [23] showed that the orientation, layer thickness, and feed rate of PLA samples affected the mechanical properties of 3D printed parts. Their results indicated that the upright orientation leads to weaker parts while those of on-edge and flat orientations were stronger and stiffer, yet increasing layer thickness and feed rate decreased ductility. That is, the mechanical properties of 3D printed parts can be enhanced by various techniques depending on the need. In a different perspective, more recently, for two phase flow in complex structures, Kanjirakat et al. (2023) [24] successfully altered the surface wettability of stereo-lithography based 3D printing by incorporating ultrasonic-atomized fine spraying. In other words, with the developments of functional materials and printing techniques, the versatility of 3D printing is enormous and is able to fit different applications as reviewed by Gul et al. (2018) [25].
For optimizing the performance of the present vortex atomizer, the key parameter considered was the auxiliary air holes which were fabricated by 3D printing. The physical pictures of the present atomizing nozzle, the disk with the auxiliary air holes, the air flow shield, and the corresponding assembly are shown in Figure 1. In this study, the focus is on the auxiliary air holes. The goal is to achieve a uniform spraying distribution across a larger distance under high pressure by changing the geometry of the auxiliary air holes.
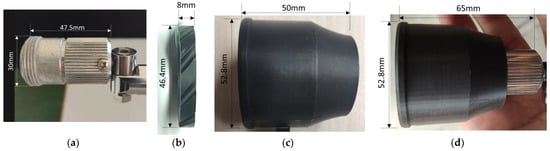
Figure 1.
Key components of the vortex atomizer. (a) Atomizing nozzle. (b) Auxiliary air holes. (c) Air flow shield. (d) Assembled diagram.
The air and liquid flows in the atomizer are shown in Figure 2. The disk with the auxiliary air holes in it was attached to the air flow shield (diameter of 46.4 mm), and together they were fixed to the atomization nozzle by a fixing seal. As shown in Figure 2a, liquid water flowed into the pipe (diameter of 5 mm) at the center of the atomizing nozzle from right to left, branched into two streams, and entered into the vortex swirler in a counterclockwise direction. Inside the vortex swirler, the flow was swirled and exited from the nozzle center hole (diameter of 2 mm) with an increased speed of 6.25 times due to area restriction, reaching 63 m/s. In the meantime, the air flowed into the passage between the air flow shield and the atomizing nozzle (also from right to left) and passed through the holes in the disk downstream of the nozzle with a speed of 4 m/s. The air flow was also swirled in a counterclockwise direction to interact with the already swirled vortex water jet and exited from the shield, as illustrated in Figure 2b. That is, both rotations of the air and water jets are counterclockwise. Thus, droplet atomization was greatly enhanced by rotation to improve the spraying performance.
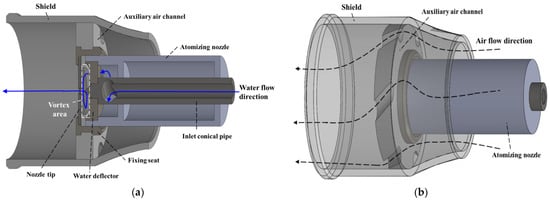
Figure 2.
Air and water flows in and out of the atomizer. (a) Water flow direction of atomizer. (b) Air flow direction of atomizer.
Both the auxiliary air holes and the air flow shield were designed by a KISSlicer CAD tool and made by 3D printing for fast prototyping and lower cost. Five disks having the designed auxiliary air holes were fabricated as shown in Figure 3. The air holes were evenly distributed circumferentially and oriented in such a way that their resulted swirl rotation was the same as that of the liquid jet. The designed data were transformed into the STL format by the KISSlicer software tool for 3D printing. The 3D printing was accomplished by the fused deposition method with a nozzle of 0.4 mm in diameter. The fusing temperature was 200 °C. The printing speed was 60 mm/s with a layer thickness of 0.2 mm. The material for printing was PLA for environmental reasons. The diameter of the PLA filament was 1.75 mm. The resolution of the 3D printing was about 30 μm. This printing technique was chosen because it could use PLA as its printing material with good resolution and enough mechanical strength for the needed atomizer parts.
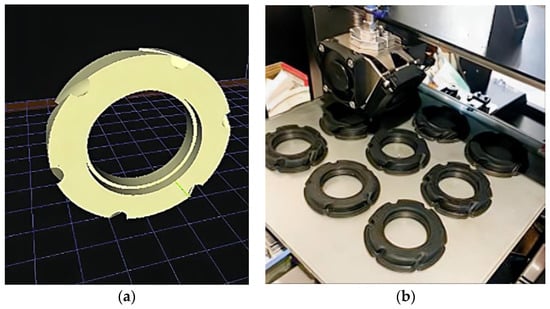
Figure 3.
Designed and fabricated rings with needed air holes. (a) Designed 3D model. (b) 3D printing fabricated rings with air holes.
3. Experimental Approach
A schematic diagram of the experimental setup, consisting of a water pump, a supporting steel table with a fixed bracket, an atomizer, and a water droplet weight measuring cups, is depicted in Figure 4a. Water was adopted as the spraying liquid. It was driven by a water pump to provide a gauge pressure of 33 kgf/cm2 (approximately 485 psig). The resulting Reynolds number of the liquid jet was about 125,400, namely, a turbulent liquid jet. Water was sprayed continuously for 60 s under the constant gauge pressure of 33 kgf/cm2. The atomizer was 120 cm above the ground floor. The water droplet weight measuring range was from 300 cm to 700 cm from the atomizer. The pitch of the measuring cups was constant with the value of 10 cm. In addition to the droplet weight measurements, the spraying patterns were also recorded for further analysis. A typical example of the sprayed pattern, as depicted in Figure 4b, shows that the jet is not symmetric due to the influence of gravity.
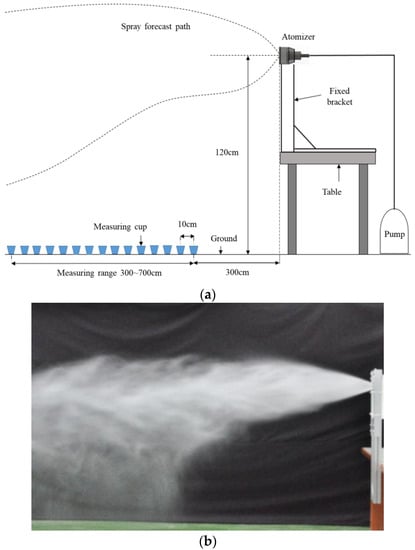
Figure 4.
Experimental setup and typical spraying pattern. (a) Schematic diagram of the experimental setup. (b) Typical spraying pattern.
The design parameters of the auxiliary air holes include their numbers, inclination angle, flow areas, and lengths. In order to deduce the optimum air hole configuration under a reasonable cost, the Taguchi method was applied in the design of experiments. The Taguchi method has been used frequently in reducing experimental tasks. For example, Shah et al. (2019) [26] proposed three novel designs for enhancing mixing in micro-fluidic devices, namely, passive, active, and a combination of both. Their simulation results showed that the pure active micro-mixer design had superior mixing ability and could be further optimized by using the Taguchi method.
In this study, the above four parameters were taken as the control factors in the experimental design. The experimental procedure is illustrated in Figure 5, beginning with the determination of the quality characteristic, followed by determining the noise factors, degree of freedom, and factor levels so that an appropriate orthogonal table could be selected. Afterwards, experiments were carried out while data were acquired and analyzed to determine the optimum experimental condition and subsequent validation. Details are as follows.
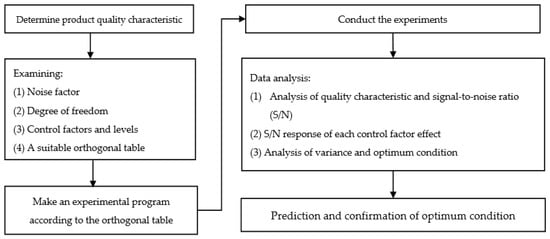
Figure 5.
Experimental procedure.
The total number of the control parameters is four. Five levels for each control factor were considered as illustrated in Table 1. These levels are deduced from the current field design of the nozzle. That is, the numbers of holes are five, six, seven, eight, and nine; the inclination angles are from 5° to 25° with an increment of 5°; the flow area of the air hole varies from 9 mm2 to 21 mm2 with an increment of 3 mm2; the lengths of the holes are 6, 7, 8, 9, and 10 mm, respectively. To accommodate the combination of these control factors and levels effectively, the L25 orthogonal table was chosen for this study. The symbol is L25 (54), representing 25 experimental cases, 4 control factors, and 5 levels for each control factor. Compared to the full factorial experimental design which requires 625 experimental cases, the 25 experimental cases by the Taguchi method dramatically reduced the time and cost of the experiments. Details of the twenty-five experimental cases of the chosen L25 orthogonal table are illustrated in Table 2 in which the symbols A, B, C, and D denote the control factors, and the numerals 1, 2, 3, 4, and 5 are the levels of the control factors, respectively. The reasons for choosing this L25 orthogonal table are twofold. One is that the experiments could be carried out with reasonable time and cost. The other is that the sensitivity of control factor can be determined reasonably accurately.

Table 1.
Control factors and their levels of the assisting air holes.
Table 2.
Details of L25 experimental arrangements.
As the goal of this study is to obtain a uniform spraying, the quality characteristic selected is the slope of the spraying pattern deduced from the droplet weights measurements using the measurement cups illustrated in Figure 4a. A more uniform spray implies a smaller slope. Thus, the smaller-the-better characteristic as shown in Formula (1) was adopted in this study, where yi is the slope of the linear regression line and n is the number of the repeated experiments.
Taking Exp. no. 1 of Case 1 as an example, as depicted in Figure 6, a linear regression line is deduced from the measured weights along the axis of the nozzle centerline, from which the slope is determined from the regression line. Each of the twenty-five cases was conducted three times; namely, a total of 75 experiments were conducted. The average slope of the three experiments for each case of Table 2 is used as the quality characteristic of this study.
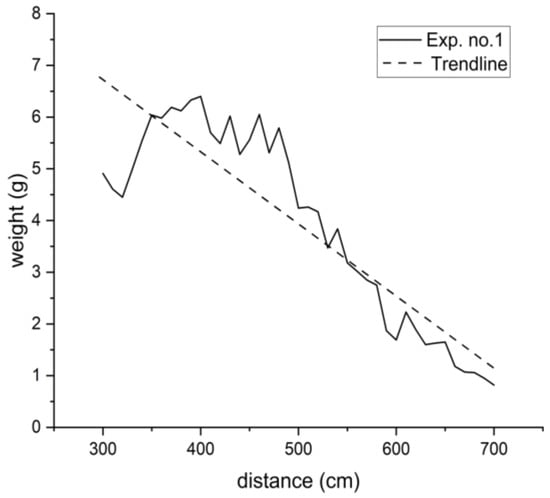
Figure 6.
Slope computed from the regression line of the weight distribution.
4. Results and Discussion
4.1. Spraying Patterns
Typical jet spraying patterns of the twenty-five experimental cases are shown in Table 3 where the color mark denotes the location of the droplets collection cups. The jets are from right to left. Qualitatively, the spraying patterns can be categorized into two groups, one with a larger axial spray distance as that of Case 6 (hole number of 6, inclination angle of 5°, area of 12 mm2, and length of 8 mm), the other smaller as that of Case 1 (hole number of 5, inclination angle of 5°, area of 9 mm2, and length of 6 mm). In other words, the control parameters do affect the spraying pattern noticeably. It is also clear that the surrounding air swirl in the same direction as that of the water jet can considerably delay the breakup of the water jet due to a reduced relative speed between the air and water jet. It is also clear that the sprays are all affected by gravity, thus leading to the asymmetric spraying patterns for all of the cases investigated.
Table 3.
Typical spraying patterns of the twenty-five experiments.
Quantitatively, the average droplet weight distributions along the nozzle centerline for the 25 experimental cases (three experiments per case for the average) are shown in Figure 7. The droplet weights along the centerline oscillate considerably due to the 10 cm pitch of the measurement cups. However, a clear trend, irrespective of the cases, shows that the droplet weights decrease as the distance from the nozzle exit increases as expected. Moreover, the curves in Figure 7 can be roughly categorized into two clusters; one consists of Cases 4 and 6; the other consists of the rest of the cases.
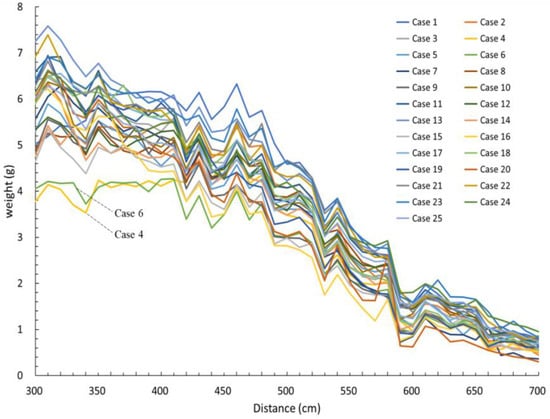
Figure 7.
Average droplet weight distributions along the nozzle centerline.
From the droplet weight distribution of each experiment, the individual slope of each curve was calculated by linear regression as illustrated previously in Figure 6. By the computed slopes, the signal to noise ratios and the quality characteristic were determined. The results are tabulated in Table 4 where y1, y2, and y3 represent the droplet weight distribution slope of the three experiments of each case, respectively, and S/N is the signal to noise ratio. It is clear that the S/N ratios of Cases 4 and 6 are 19.23 dB and 19.46 dB, respectively. They are larger than those of the rest cases; namely, these two nozzles perform better than the rest, similar to the results shown in Figure 7. Additionally, the S/N value for Case 1 is 16.38 dB, smaller than that of Case 6; the result is consistent with the corresponding smaller and larger axial spraying distances.
Table 4.
Computed slopes and S/N ratios.
4.2. Analysis of Signal to Noise Ratios and Quality Characteristic
The signal to noise ratios calculated from the results given in Table 4 for the twenty-five cases of the Taguchi table are summarized in Table 5 and depicted in Figure 8. The ranges of the signal to noise ratios (denoted by (S/N) given in Table 5 reveal that Control factor A exhibits the largest effect on the signal to noise ratio and Control factor D has the smallest effect. That is, the control factor effect of the auxiliary airholes in descending order is number of holes (A), flow area (C), inclination angle (B), and length (D), respectively. ANOVA shows that the contribution of both Control factors of hole numbers (A) and areas (C) is about 60%. Moreover, the optimum combination of the control factors and levels as illustrated in Figure 8 is A2, C4, B4, and D3. That is, the optimum uniform spraying is achieved by the auxiliary air holes with the configuration of 6 holes, area of 18 mm2, inclination angle of 20°, and length of 8 mm.
Table 5.
Control factor effect S/N response table.
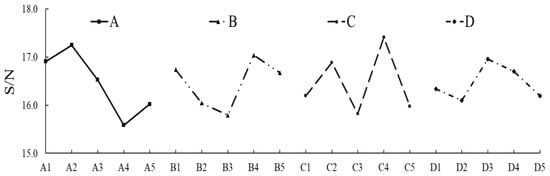
Figure 8.
Signal to noise response of the control factors.
A similar trend can also be observed from the quality characteristic drawn in Figure 9. The quality characteristic is the average slope of the three repeated experiments of each of the twenty-five cases given in Table 2. The optimum condition is identical to that of the S/N response of the control factors, namely, A2, C4, B4, and D3 for their minimum values of achieving the smaller-the-better goal.
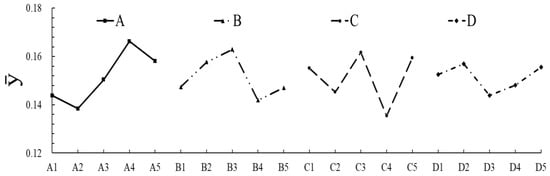
Figure 9.
Quality characteristic response of the control factors.
4.3. Validation
The deduced optimum condition of the control factors and levels from the above results is not in the twenty-five cases given in Table 2. Thus, the auxiliary air hole of A2, B4, C4, and D3 was further fabricated by 3D printing. The spraying pattern of this optimum configuration is shown in Figure 10, and the droplet weight distribution is illustrated in Figure 11 by the bold solid curve. Indeed, the spraying pattern shows that the jet extends to further downstream as compared to any of those shown in Table 3. The droplet weight distribution is also more uniform than any of the twenty-five cases conducted as described previously. To further examine the validity of the optimum configuration, the add-rule was applied to compare the predicted and measured S/Ns of this condition. The predicted S/N with 95% confidence interval is 19.28 ± 2.39 dB. In comparison, the measured S/N is 20.532 dB, close to that of the predicted one. Thus, the optimum condition is confirmed with a 95% confidence interval.
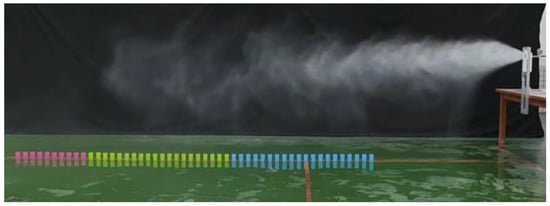
Figure 10.
Spray pattern of the optimum condition.
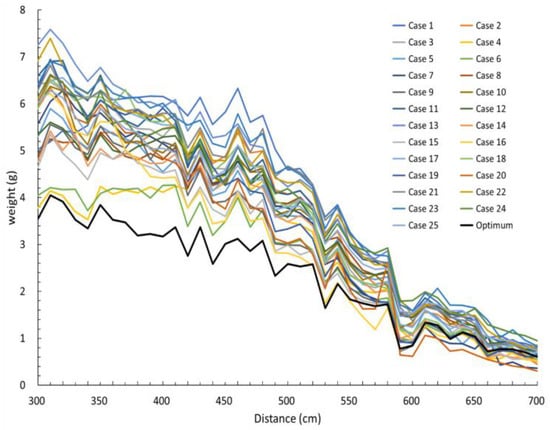
Figure 11.
Droplet weight distributions with the optimum condition.
4.4. CFD Simulation Validation
For CFD simulations of the designed atomizers, a commercial software Fluent was used. As the flow involves two phases of water and air, the Volume of Fluid (VoF) model was adopted [27] through the discrete phase model (DPM) [28] setup. For the VoF model, Lyras et al. (2023) [29] have demonstrated its accuracy in two-phase flow simulations, including three-dimensional turbulent liquid jets. The VoF model has been shown to to be suitable for two-phase. In this study, the two-phase VoF, air, and water were the primary and secondary phases, respectively. In the DFM setup, the discrete phase was initiated with a particle number of 50,000.
For the simulation of the present turbulent jets, the k-ω shear stress turbulent model was applied. The inlet and outlet pressures of the water jet were set to 3.236 × 10⁶ Pa gauge and 0 Pa gauge (i.e., 1.033 × 10⁵ Pa), respectively. In contrast, the inlet and outlet pressures of the air were set to 0 Pa gauge; i.e., the air was entrained by the water jets. The SIMPLEC algorithm with the second order upwind discretization for the momentum equation and the first order upwind discretization for the turbulent kinetic energy was used in the simulation. All simulations were run on a desk computer of 12 cores and a clock frequency of about 3 GHz by a tetrahedral element with 7,112,845 elements. Typically, it took about 60 h to run a case.
For comparion, the simulated spray patterns of the atomizers of Case 1 and the optimum case are shown in Figure 12, together with that of the experiment of the optimum atomizer. Figure 12a,b depicts the overall side views of the spray patterns of Case 1 and Case optimum atomizers, respectively. Qualitatively, the simulated patterns resemble those of the corresponding experiments. The jet spread opening angles are further examined by zooming in the regions close the jet exits marked by dashed squares in Figure 12a,b. These two closeups are shown correspondingly in Figure 12c,d. Quantitatively, the associated opening angles are about 60° and 45° for the atomizers of Case1 and Case optimum, respectively. That is, the optimum atomizer results in a smaller jet opening angle, thus leading to a more uniform spraying pattern as described in the previous experimental results. Moreover, for the optimum atomizer deduced from the Taguchi method, the simulated jet opening angle is about 42°, close to that of the experiment as shown in Figure 12d,e. Namely, the optimum atomizer indeed performs the best among all the fabricated atomizers as being validated by both simulation and experiments.
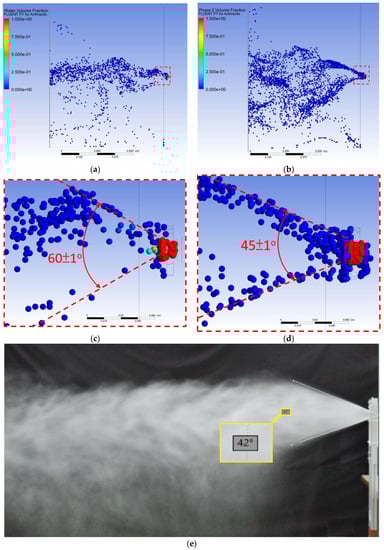
Figure 12.
Comparison of spray patterns of CFD simulations and experiments of two atomizers. (a) Spray distribution of Case1 atomizer (simulation) (b) Spray distribution of optimum atomizer (simulation). (c) Spray opening angle 60 ± 1° of Case1 atomizer(simulation) (d) Spray opening angle 45 ± 1° of optimum atomizer (simulation). (e) Spray opening angle 42° of optimum atomizer (experiment).
In comparison, the results of Li et al. (2019) [8] give the opening angles of about 32° (experiment) and 26° (simulation by Euler–Lagrange method), respectively, and are smaller than the present corresponding findings of 45° (simulation) and 42° (experiment). This is expected because the gravity in their case is parallel to the jet axis; hence, the opening angle will be reduced due to down pulling of the gravity. In contrast, in this study, the gravity is perpendicular to the jet axis; namely, the gravity will assist jet spreading.
5. Conclusions
In this study, both 3D printing and the Taguchi method were used to experimentally obtain the optimum configuration of the auxiliary air hole, with 3D printing for its versatility and fast prototyping features and with the Taguchi method for its efficiency in design and implement of experiments. The optimum result was also validated by CFD simulations using the VoF model. The control factors examined were the number of holes, area, inclination angle, and length with five levels for each control factor. An L25 orthogonal table was selected for this study. Both S/N and the quality characteristic of smaller-the-better were investigated.
The key results of this study are as follows. Firstly, the effect of the control factors in descending order is the number of holes (A), hole area (C), inclination angle (B), and length (D), respectively. Secondly, the optimum configuration is the one with six holes, area of 18 mm2, inclination angle of 20°, and length of 8 mm, respectively, with a 95% confidence interval. Thirdly, the optimum S/N ratio is about 20.5 dB, larger than any of the cases in the designed orthogonal table. Lastly, the simulated jet opening angle of about 45° is close to the experimental value of about 42° of the optimum design. Namely, the novelty of combining 3D printing and Taguchi method leads the present study to obtain the optimum atomizer efficiently.
Author Contributions
Conceptualization, J.-S.C.; Methodology, J.-S.C.; Software, J.-S.C.; Validation, J.-S.C.; Formal analysis, J.-S.C.; Investigation, J.-S.C.; Resources, J.-S.C.; Data curation, J.-S.C. and S.-R.L.; Writing—original draft, J.-S.C.; Writing—review & editing, J.-S.C.; Visualization, J.-S.C.; Supervision, J.-S.C.; Project administration, J.-S.C. All authors have read and agreed to the published version of the manuscript.
Funding
This research received no external funding.
Institutional Review Board Statement
Exclude this statement.
Informed Consent Statement
Exclude this statement.
Conflicts of Interest
The authors declare no conflict of interest.
References
- Lefebvre, A.H.; McDonell, V.C. Atomization and Sprays, 2nd ed.; Taylor & Francis, CRC Press: Boca Raton, FL, USA, 2017. [Google Scholar]
- Liang, J.-L.; Zhang, F.; Zhang, J.-H.; Huang, H.-Q.; Wen, Y.-X.; Chen, B.-C. Improvement of Mesh Atomizer Performance by Electrolytic Polishing. Appl. Sci. 2023, 13, 2572. [Google Scholar] [CrossRef]
- Krawczyk, P.; Badyda, K. A design procedure for “liquid to air” type atomizers based on air and water mixture outflow velocity. Chem. Process Eng. 2015, 36, 355–363. [Google Scholar] [CrossRef]
- Ochowiak, M.; Krupinska, A.; Włodarczak, S.; Matuszak, M.; Markowska, M.; Janczarek, M.; Szulc, T. The Two-Phase Conical Swirl Atomizers: Spray Characteristics. Energies 2020, 13, 3416. [Google Scholar] [CrossRef]
- Yadav, N.P.; Kushari, A. Spray Formation in a Twin-Fluid Internally Mixed Atomizer with Tangential Air Intake. Part. Part. Syst. Charact. 2011, 28, 25–32. [Google Scholar] [CrossRef]
- Chinn, J.J.; Cooper, D.; Yule, A.J.; Nasr, G.G. Stationary rotary force waves on the liquid–air core interface of a swirl atomizer. Heat Mass Transf. 2015, 52, 2037–2050. [Google Scholar] [CrossRef]
- Wang, M.R.; Yang, K.H.; Chiu, C.H.; Yang, C.J. Mechanisms and characteristics of spray formation with flow focusing in a new air-assist micro-atomizer. Mod. Phys. Lett. 2009, 23, 365–368. [Google Scholar] [CrossRef]
- Wachter, S.; Jakobs, T.; Kolb, T. Mass Flow Scaling of Gas-Assisted Coaxial Atomizers. Appl. Sci. 2022, 12, 2123. [Google Scholar] [CrossRef]
- Maly, M.; Jedelsky, J.; Slama, J.; Janackova, L.; Sapik, M.; Wigley, G. Internal flow and air core dynamics in Simplex and Spill-return pressure-swirl atomizers. Int. J. Heat Mass Transf. 2018, 123, 805–814. [Google Scholar] [CrossRef]
- Zhao, H.; Liu, H.F.; Tian, X.S.; Xu, J.L.; Li, W.F.; Lin, K.F. Influence of atomizer exit area ratio on the breakup morphology of coaxial air and round water jets. AIChE J. 2014, 60, 2335–2345. [Google Scholar] [CrossRef]
- Levitsky, I.; Tavor, D. Improved Atomization via a Mechanical Atomizer with Optimal Geometric Parameters and an Air-Assisted Component. Micromachines 2020, 11, 584. [Google Scholar] [CrossRef]
- Baltrėnas, P.; Baltrėnaitė-Gedienė, E. Research of Modified Atomizers and Their Application for Moistening of Air-Cleaning Device Charges. Sustainability 2019, 11, 5522. [Google Scholar] [CrossRef]
- Li, W.; Qian, L.; Song, S.; Zhong, X. Numerical Study on the Influence of Shaping Air Holes on Atomization Performance in Pneumatic Atomizers. Coatings 2019, 9, 410. [Google Scholar] [CrossRef]
- Wittner, M.O.; Karbstein, H.P.; Gaukel, V. Air-Core-Liquid-Ring (ACLR) Atomization: Influences of Gas Pressure and Atomizer Scale Up on Atomization Efficiency. Processes 2019, 7, 139. [Google Scholar] [CrossRef]
- Marchewicz, A.; Sobczyk, A.T.; Krupa, A.; Jaworek, A. Induction charging of water spray produced by pressure atomizer. Int. J. Heat Mass Transf. 2019, 135, 631–648. [Google Scholar] [CrossRef]
- Belhadef, A.; Vallet, A.; Amielh, M.; Anselmet, F. Pressure-swirl atomization: Modeling and experimental approach-es. Int. J. Multiph. Flow 2012, 39, 13–20. [Google Scholar] [CrossRef]
- Zhang, H.; Bai, B.; Liu, L.; Sun, H.; Yan, J. Droplet dispersion characteristics of the hollow cone sprays in crossflow. Exp. Therm. Fluid Sci. 2013, 45, 25–33. [Google Scholar] [CrossRef]
- Tambe, S.B.; Jeng, S.M.; Mongia, H.; Hsiao, G. Liquid Jets in Subsonic Crossflow. In Proceedings of the 43rd AIAA Aerospace Sciences Meeting and Exhibit, Reno, Nevada, 10–13 January 2005; pp. 1–12. [Google Scholar]
- Sallam, K.; Ng, C.; Sankarakrishnan, R.; Aalburg, C.; Lee, K. Breakup of Turbulent and Non-Turbulent Liquid jets in Gaseous Crossflows. In Proceedings of the 44th AIAA Aerospace Sciences Meeting and Exhibit, Reno, Nevada, 9–12 January 2006; pp. 1–13. [Google Scholar]
- Costa, M.; Melo, M.J.; Sousa, J.M.M.; Levy, Y. Spray Characteristics of Angled Liquid Injection into Subsonic Crossflows. Am. Inst. Aeronaut. Astronaut. 2006, 44, 646–653. [Google Scholar] [CrossRef]
- Khosravani, M.R.; Reinicke, T. Effects of fiber on the fracture behavior of 3D-printed fiber reinforced nylon. Procedia Struct. Integr. 2022, 35, 59–65. [Google Scholar] [CrossRef]
- Aranda, M.T.; Reinoso, J.; García, I.G. On different 3D printing methods and fracture performance in DCB composite specimens including structured interfaces. Theor. Appl. Fract. Mech. 2022, 122, 103552. [Google Scholar] [CrossRef]
- Chacona, J.M.; Caminerob, M.A.; García-Plazab, E.; Núñezb, P.J. Additive manufacturing of PLA structures using fused deposition modelling: Effect of process parameters on mechanical properties and their optimal selection. Mater. Des. 2017, 124, 143–157. [Google Scholar] [CrossRef]
- Kanjirakat, A.; Carvero, A.; Amani, M.; Retnanto, A. Surface modification of stereolithography-based 3D printed structures utilizing ultrasonic-atomised sprays. J. Mater. Sci. 2023, 58, 6931–6943. [Google Scholar] [CrossRef]
- Gul, J.Z.; Sajid, M.; Rehman, M.M.; Siddiqui, G.U.; Shah, I.; Kim, K.-H.; Lee, J.-W.; Choi, K.H. 3D printing for soft robotics—A review. Sci. Technol. Adv. Mater. 2018, 19, 243–262. [Google Scholar] [CrossRef] [PubMed]
- Shah, I.; Jeon, H.S.; Ali, M.; Yang, D.H.; Choi, K.-H. Optimal parametric mixing analysis of active and passive micromixers using Taguchi method. Proc IMechE Part E J. Process Mech. Eng. 2019, 233, 1292–1303. [Google Scholar] [CrossRef]
- Hirt, C.W.; Nichols, B.D. Volume of Fluid (VOF) Method for the Dynamics of Free Boundaries. J. Comput. Phys. 1981, 39, 201–225. [Google Scholar] [CrossRef]
- Luo, S.; Wang, H.; Gao, Z.; Wu, Y.; Wang, H. Interaction between high-velocity gas and liquid in gas atomization revealed by a new coupled simulation model. Mater. Des. 2021, 212, 110264. [Google Scholar] [CrossRef]
- Lyras, P.; Hubert, A.; Lyras, K.G. A conservative level set method for liquid–gas flows with application in liquid jet atomization. Exp. Comput. Multiph. Flow 2023, 5, 67–83. [Google Scholar] [CrossRef]


Disclaimer/Publisher’s Note: The statements, opinions and data contained in all publications are solely those of the individual author(s) and contributor(s) and not of MDPI and/or the editor(s). MDPI and/or the editor(s) disclaim responsibility for any injury to people or property resulting from any ideas, methods, instructions or products referred to in the content. |
© 2023 by the authors. Licensee MDPI, Basel, Switzerland. This article is an open access article distributed under the terms and conditions of the Creative Commons Attribution (CC BY) license (https://creativecommons.org/licenses/by/4.0/).