Article

Virtual Laboratory for the Full-Field Goniophotometer of Luminaires

Research Institute of Photonics, Dalian Polytechnic University, Dalian 116034, China
*
Authors to whom correspondence should be addressed.
Appl. Sci. 2023, 13(10), 5899; https://doi.org/10.3390/app13105899
Submission received: 13 April 2023 / Revised: 4 May 2023 / Accepted: 9 May 2023 / Published: 10 May 2023

Abstract

:
In order to solve the problem that students have insufficient understanding of the full-field goniophotometer instrumentation due to the expensive equipment and the high requirements of the experimental environment, virtual reality technology is used to complete the virtual laboratory of a light intensity distribution measurement of the full-field goniophotometer through Unity 3D. The virtual laboratory is designed for near-field measurement, mid-field measurement, and far-field measurement of light intensity. It combines 3D MAX and C# to realize the model building of laboratory, luminaire and full-field goniophotometer, the dynamic drawing of light distribution curves, and the simulation system can also be run on mobile phones. The experimental process is mainly through the manipulation of the virtual experimenter and each module to generate collision detection, pop-up buttons, and click on the button triggers an event and the operation prompt page appears. The light distribution curve is generated dynamically by reading and processing the IES file data to generate 3D coordinates. This virtual simulation laboratory is demonstrated on multiple platforms. The results proved that the virtual simulation restored the experimental process vividly and can complete the experimental teaching remotely.

1. Introduction

In the semiconductor lighting industry, goniophotometers are commonly used to make absolute measurements of the luminous flux of LED light sources and luminaires, as well as the distribution of light intensity [1]. The full-field goniophotometer is a new generation of goniophotometers for measuring lamps and light sources using advanced photometric principles to complete measurements such as the photometric distribution of light sources or lamps, which have an important position and role in the teaching of lighting and other professions [2].
Due to the practical operation of the full-field goniophotometer experiment, there are problems, such as a shortage of equipment, limited experimental time, experimental cost, and safety factors [3]. In the study of the full-field goniophotometer, as well as the practical operation existence, due to an insufficient understanding of the full-field goniophotometer and the phenomenon of instrument damage, virtual simulation experiments are used to solve the above problems [4,5]. Virtual experiments can use virtual reality technology to simulate the use of experimental instruments, establish virtual laboratories, improve the quality of experimental teaching, and so on [6,7].
The construction of a virtual simulation laboratory for lighting engineering is still in its initial stage. In 2018, Dalian Polytechnic University’s Institute of Photonics developed a virtual simulation experiment system for lighting construction and distribution based on mixed reality technology, developed to reproduce real scenes of urban lighting projects and restore the whole process from line laying, luminaire installation, and control system commissioning.
To sum up, this paper carries out a virtual simulation of light intensity distribution measurements based on a full-field goniophotometer, which combines unity3D, 3Dmax, etc.; restores the equipment of the distribution photometer and its operation process; and designs a virtual simulation experimental platform that enables a fuller understanding of the full-field goniophotometer, as well as the realization of online experiments [8].
The Section 2 is the construction of the virtual experiment platform, introducing the scene construction and the design of the model. Section 3 is an introduction to the key technologies, including descriptions of the whole experimental process, the transformation of luminaire positions, the measurement of spatial light intensity distribution, the selection of measurement results, the drawing of light distribution curves, and the control of the mobile phone terminal.

2. Design of the System Solution

The simulation system uses unity 3D and 3D MAX to restore part of the operation process of the full-field goniophotometer experiment and to show feedback to the user through the simulation UI interface and other displays, human–computer interaction, and so on.
This virtual simulation of the full-field goniophotometer first started by reading “GB/T9468-2008 General requirements for the photometry and goniophotometry of luminaries” [9]. The GO-5000 full-field goniophotometer was used as a template to establish a full-field goniophotometer, luminaire, bench scale, laser aligner, cabinet, display screen, showcase, etc., to improve the basic environment of the distribution photometer experiment and to follow its experimental procedure. Then, through C# programming, a virtual platform was established, mainly divided into laboratory scene and equipment construction, animation, interaction design, etc. The simulation system flow chart is shown in Figure 1.
The layout of the simulation laboratory for the virtual full-field goniophotometer is shown in Figure 2. As the measurement experiments of the distribution photometer need to be implemented in a light-free environment, the full-field goniophotometer is in a separate room on one side. In this room, the virtual experimenter can be manipulated to install lamps to the full-field goniophotometer. In another laboratory, it not only has lamps, weighing tables, operating tables and screens, and other experimental equipment placed, but also the initial position of the virtual experimenter is located here.

3. System Design Process

3.1. Overall Design

In unity 3D, the full-field goniophotometer model is built using 3D MAX and using the GO-5000 Goniophotometer as a template to achieve steps such as picking up the luminaire, obtaining information about the luminaire, electrical connection, luminaire connection, installing the luminaire, choice of measurement method, transient testing, presentation of test results, dynamic drawing of light distribution curves, and launch of virtual simulation labs on multiple platforms. As the third-person view retains the general field of view of the first-person view, it allows for better control of the virtual experimenter to reach the experiment site and easier angle adjustment. Therefore, this virtual simulation platform adds follow technology to the camera so that the user can control the movement of the virtual experimenter from a third-person perspective. The virtual experimenter adds colliders, rigid bodies, etc. In each experimental module, it adds cube colliders, etc. These additions can make the virtual experimenter in the experimental platform walk to the experimental module location to produce a collision effect and trigger the corresponding button; the user clicks on the button to trigger the binding of one or more events so as to complete the measurement of the goniophotometer [10,11].
In the luminaire pick-up simulation, the pick-up of the luminaire is mainly achieved through collision detection and the transformation of coordinates, as shown in Figure 3a. Getting information about the luminaire is the human–computer interaction module of the design, which is represented by the weighing of the luminaire, not only by the movement of the luminaire position, but also by the display of the weight through the mapping transformation, as shown in Figure 3b. The line connections are mainly divided into electrical connections and luminaire connections, both using object activation techniques, which simulates the electrical connections of the distribution photometer and the line connections of the luminaire before the installation of the luminaire, the mounting fixture, the laser calibration, etc. The electrical connections are shown in Figure 3c, and the luminaire connections are shown in Figure 3d. The installation of the luminaire is mainly through the conversion of coordinates to achieve the installation of the luminaire in the full space distribution. The luminaire is mounted at the luminaire mounting flange of the self-rotating axis of the photometer, thus completing the light intensity measurement of the luminaire, as shown in Figure 3f. The light for the transient test is a light source assembly to simulate the light emitted from a luminaire by switching on the light to achieve the basic conditions for the measurement, as shown in Figure 3e. The test results are displayed on the experimental platform by using the material switching technique to achieve the results of the distribution photometer output, as shown in Figure 3g. The light distribution curve plotting module is mainly used to read the IES file, to analyze and process the data into three-dimensional coordinates, and finally, to plot the light distribution curve. At the same time, the full spatial distribution photometer light intensity measurement needs to run under the dark room. By real-time camera, it captures the image as a texture paste to the virtual scene of the object. We achieve an understanding of the full spatial distribution photometer measurement process, as shown in Figure 3h. In the entire simulation process, as the experimental sites are scattered and the experimental steps are tedious, a prompt interface has been created in order to show the flow of the experiment and to guide the operator step-by-step, as well as to explain the buttons displaying different texts. The operation flow and the prompt screen for measurement selection are intercepted and shown in Figure 3i,j below, respectively.

3.2. Change in Position of Luminaires

Three typical luminaires were chosen for this simulation, namely a small roof lamp, large round lamp, and classic fluorescent lamp. Their models were built in 3D MAX, and their FBX files were imported into unity 3D. The three luminaires were placed on different operating tables, and the measurement of disc lamps was taken as an example during this simulation experiment.
During the continuous holding of the luminaire, the experiment is carried out mainly through the change of coordinate positions. This virtual simulation system uses unity’s world coordinate system. The position and rotation angle of the luminaire when it is on the virtual experimenter (i.e., the position of the virtual experimenter) and the position and rotation angle of the luminaire in the different modules (i.e., at the luminaire display, at the bench scale, and at the distribution luminometer) are defined, as shown in Figure 4.
When the user enters the interface, they can manipulate the virtual experimenter to come to the operating table and touch the collision block. When the toucher is detected as a lamp and there is no lamp at the virtual experimenter’s position, the “pick up” button pops up. When the “pick up” button is clicked, the disc lamp is placed on the back of the virtual experimenter. The weighing table and distribution photometer are also first judged to be empty; if empty, this is set as its own sub-object. The location and rotation data to be placed by the table scale or distribution photometer is assigned, and the luminaire is moved when the button is clicked, with the specific location information shown in Table 1 below.
The modules for picking up luminaires, obtaining luminaire information, and installing luminaires first determine whether the virtual experimenter has a luminaire; if not, then the position and rotation angle of the current luminaire is directly assigned to the position property.

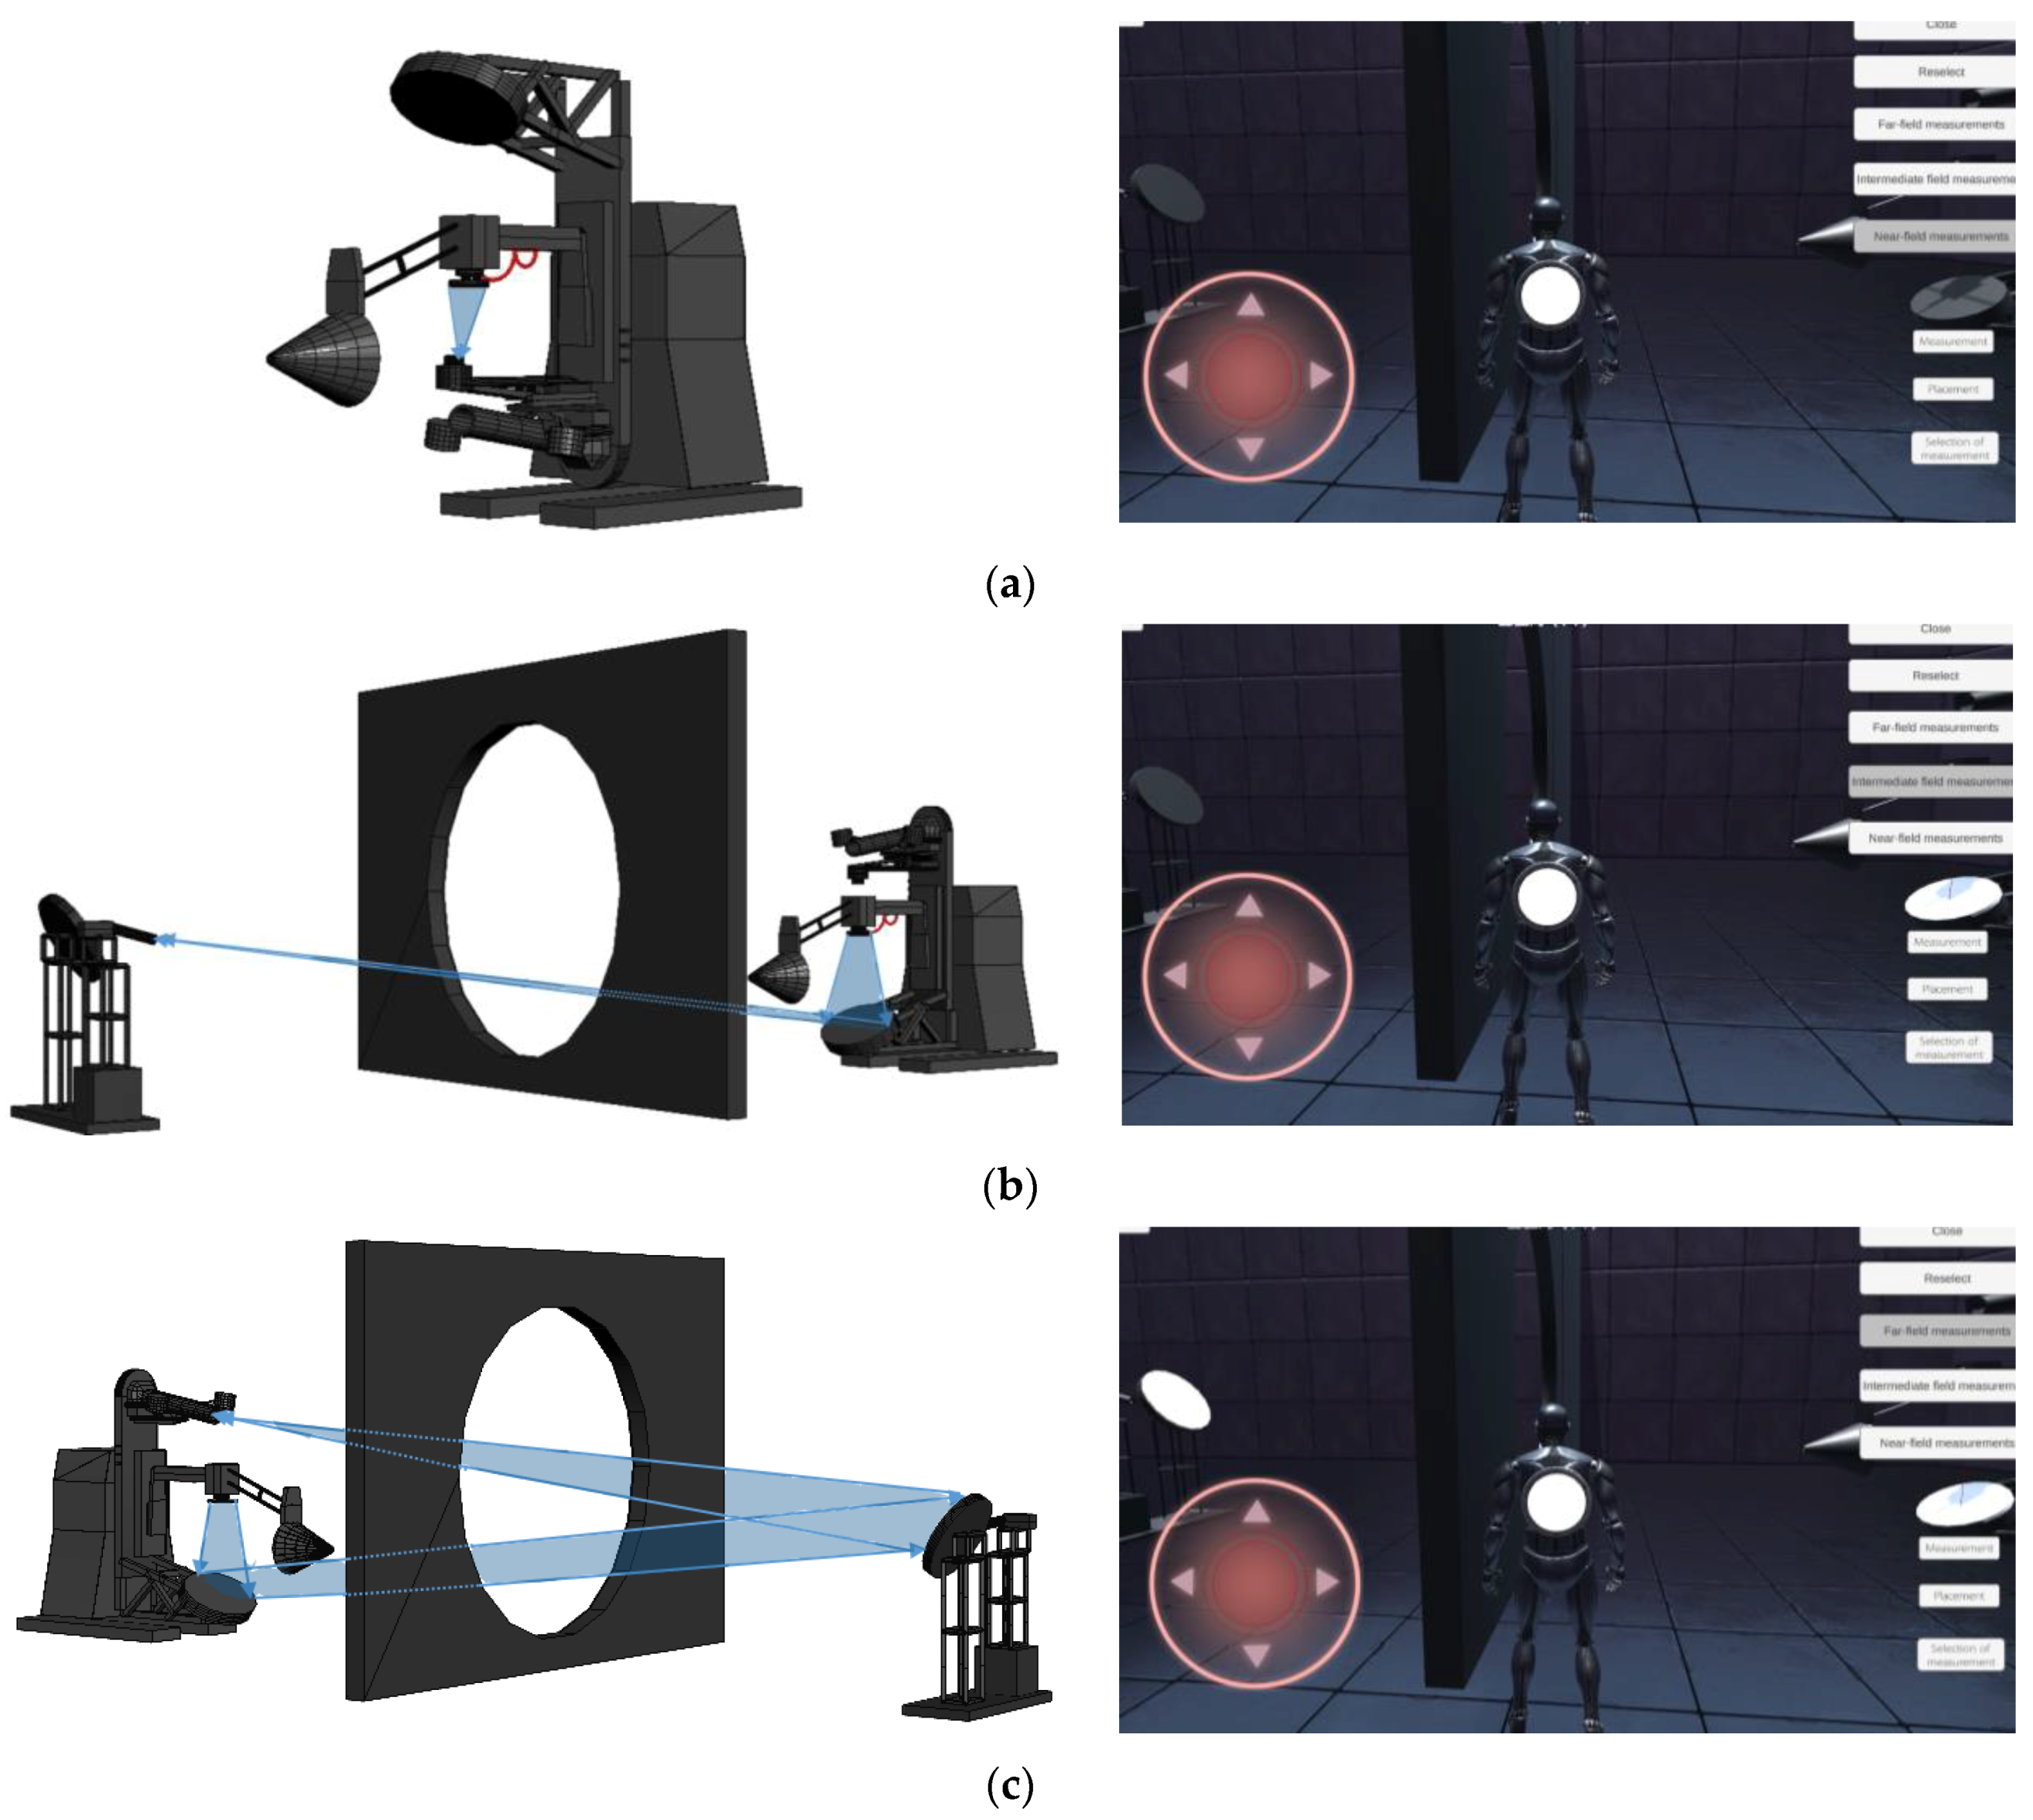
3.3. Measurement of Spatial Light Intensity Distribution

The simulation of spatial light intensity distribution measurements focuses on simulating the measurement options of a distribution photometer, allowing the user to understand the basic principles of near field, intermediate field, and far field measurements.
In the transient test session, the light is switched on and off to simulate the light emitted from the luminaire by the point source of the light source assembly.
By clicking on the measurement when the lamp is switched on, the swivel arm of the distribution photometer carrying the rotatable reflector, near-field, and far-field detectors starts to rotate around the γ-axis, allowing the light intensity of the luminaire to be measured at different angles in different planes. The luminaire is rotated around the C-axis in order to switch between different measurement planes, and then, the measurement of the light intensity of the luminaire is completed by the measurement mode that has been selected.
The measurement selection module simulates near-field measurements, intermediate field measurements, and far-field measurements by means of a material switching technique. In the virtual experiment, the rotatable reflector and fixed reflector of the distribution photometer are covered with black cloth by default, so they are represented by black material. When manipulating the virtual experimenter to the distribution photometer, the user clicks on the measurement selection button to bring up the near-field measurement, middle-field measurement, far-field measurement, reselect, and close buttons. When clicking on the near-field measurement, no material switch is made as the near-field detector receives the light source directly. When clicking on the middle-field measurement button, the material switch is made for the rotatable reflector to achieve the effect of the black cloth being uncovered as the light source passes through the rotatable reflector to the middle-field detector. When clicking on the far-field measurement button, the light emitted by the luminaire in all directions is reflected by the rotatable reflector through the diaphragm to the fixed reflector, which is then reflected by the fixed reflector through the diaphragm and incident on the far-field detector, so the material is switched for the rotatable reflector and fixed reflector. The user clicks on reselect to switch the material to the initial one, and the measurement selection module is shown in Figure 5.

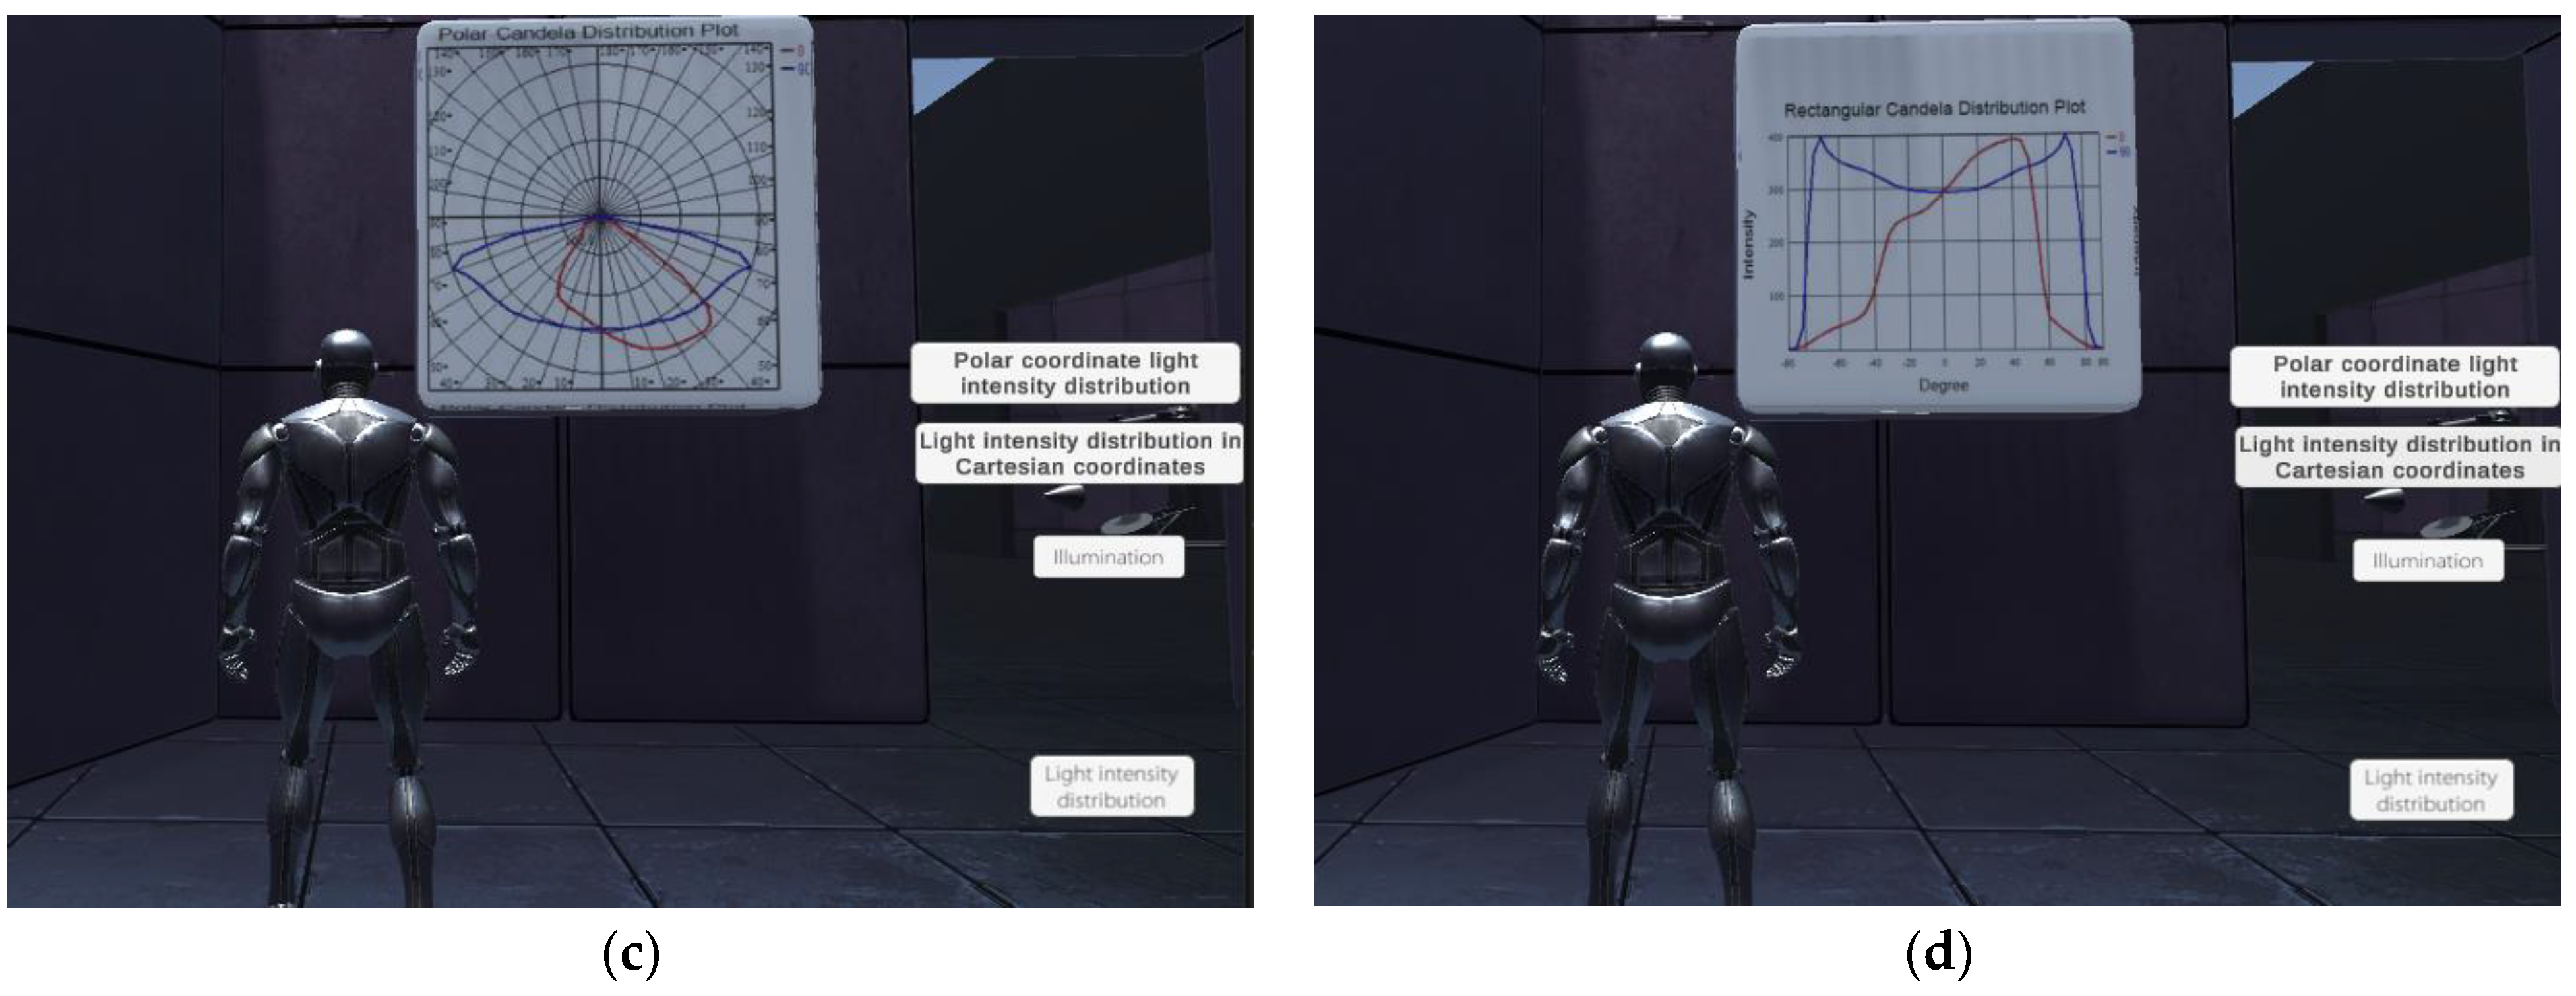
3.4. Selection of Measurement Results

Full-Field Goniophotometer not only measures the light intensity distribution, but also, with an imaging luminometer or a fast spectroradiometer, the luminance distribution and spectral distribution can be measured separately. When the full spatial distribution photometer is combined with an imaging luminometer, the spatial luminance distribution of a light source or luminaire is measured. The spatial luminance distribution test mainly tests the luminance of the light source or luminaire in space, the flashing area of the road luminaire, and other parameters in order to analyse the spatial luminance distribution of the light source or luminaire. The full spatial distribution photometer is used in conjunction with a fast spectroradiometer to measure the colour distribution and colour directional characteristics of light sources. The accuracy of the measurement of light colour parameters plays a vital role in the quality control of the photovoltaic industry and is also relevant to everyday life.
When manipulating the virtual experimenter to the full-field goniophotometer, the user completes the electrical connection and luminaire connection, clicks on the measurement selection button to bring up the measurement result selection button, and clicks on the button to bring up three buttons for spectral, luminance, and light intensity distribution, as shown in Figure 6a. The user adds listeners to each of the three buttons, and when clicked, it obtains the text of the clicked button and assigns it to the measurement result selection button, replacing its text. The user clicks on the light intensity distribution button as shown in Figure 6b, clicks on the brightness button as shown in Figure 6c, and clicks on the spectrum button, as shown in Figure 6d.
At the test results display of the experimental platform, the IES file is imported into TracePro to obtain the illuminance map and light intensity distribution map. Thus display results of the distribution photometer output are achieved through the material switching technique. Manipulating the virtual experimenter to the measurement results display, the illuminance distribution, and light intensity distribution buttons pop up after colliding with the touch block. Clicking on the illuminance measurement directly obtains the illuminance map through material switching while clicking on the light intensity distribution triggers a button event that pops up the right-angle coordinate light intensity distribution and polar coordinate light intensity distribution buttons, and by clicking on the buttons, obtains the right-angle coordinate and polar coordinate light intensity maps, respectively, as shown in Figure 7.
When a full-field goniophotometer is combined with an imaging luminometer, the luminosity of a luminaire can be measured. Driven by a rotary axis, the imaging luminometer rotates around the LED under the test and measures the luminance distribution of the LED under the test in all directions on the sphere surrounding the light source under the test. The full spatial distribution luminometer is paired with a fast spectroradiometer to measure the spectral distribution of the luminaire. The luminance and spectral results are plotted in the virtual simulation experiment platform as shown in Figure 8.

3.5. Handling of Experimental Data

The light distribution curve is the spatial light intensity distribution of the luminous flux of the luminaire set to 1000 lm. The distribution range of the light distribution curve of incandescent lamps, inflatable lamps, etc. is close to four spaces. However, as the LED is more directional, the light distribution curve of two spaces are few and far between, generally using polar coordinates to represent them.
The more popular international standards for luminaire light distribution curve file formats are CIBSE TM-14, CIE102, and IESNA LM-63 [12,13], of which IESNA LM-63 is one of the most popular standards, so this paper chose the IESNA LM-63-2002 version, referred to as the IES file [14].
In the experimental process, first, the user created a folder in unity, imported the IES file, and wrote its path. Second, the user determined whether the file started with ‘IESNA:LM-63-2002‘ as the IES file, then read the data from ‘TILT =’ as the beginning to read the data, separated by spaces to take out the data in the IES file, and finally, to read the data in the file for the IES file with the specified path. At the same time, due to the wide range of lamps on the market, the data of the horizontal and vertical angles in the IES file also varied, so the values of the last values of the vertical and horizontal angles in the IES file were confirmed by judging them. When the last horizontal angle was less than 360° and the last vertical angle was less than 180°, the length was expanded to twice the length of the original, and the value was 2 times the last value minus the corresponding angle. To output to a new sample, if it is greater than that, the data were output directly to the new array, and the light intensity value was taken as its corresponding value.
After unifying the angles, the user compared the size of the horizontal angle with 180°. If it was less than 180°, the horizontal angle was output in a positive order, and the negative vertical angle was output in reverse order. If it was greater than 180°, the negative horizontal angle was output in the positive order and the vertical angle was output in the reverse order. The output horizontal angle was converted so that the angle was controlled within the range of 270°–360° (0°)–90°. Next, the angular values of the vertical and horizontal angles were converted into radians to obtain φ and θ. The radius was normalised to obtain a real-time 3D coordinate map of the light distribution curve through the spherical coordinate system, the flow chart of which is shown in Figure 9. After the 3D coordinates were determined, the light distribution curve was drawn by connecting the start and end coordinates with the defined width and material through the indicator.
The actual and virtual light distribution curve plotted by the full-field goniophotometer instrument are shown below in Figure 10. The virtual experiment used one turn of the light distribution curve for each accuracy value to adjust using rotation around the C-axis. The second figure shows the light distribution curve plotted at the initial angle of rotation of the luminaire around the C-axis (i.e., zero degrees) with one rotation of the vertical axis. The third figure shows the light distribution curve when the light distribution curve is rotated around the C-axis to 360°, the combination of which is the realistic light distribution curve. Figure 6d is the 3D light distribution model diagram derived from Tracepro, which is the same as the final light distribution curve.

3.6. Mobile Emulation via Gyroscope Control

In this virtual simulation experiment, the gyroscope that comes with the mobile phone is used to obtain the 3D pose function of the mobile phone in space. To obtain the pose data of the camera, it enables the user to look around the environment, better understand the structure of the laboratory, and more easily manipulate the virtual experimenter to advance to the target location, thus better enhancing the user experience [15,16].
In the virtual experiment platform of the mobile phone, the gyroscope sensor in the mobile phone is mainly based on the quaternion to represent the offset of the pose angle, to control the rotational motion of the virtual camera in the laboratory, and to achieve the circumnavigation effect. The quaternion can be described as the rotation of a coordinate system with respect to a certain coordinate system. The use of quaternions not only enables the representation of rotational information in 3D space, but also avoids the gimbal lock problem that arises from using Eulerian rotation. Its quaternion formula is shown in Equation (1) below.
Q = [q0 q1 q2 q3] = [cos θ/2 − xsin θ/2 − ysin θ/2 − zsin θ/2]
When the quaternions are converted to Euler angles, the equation representing the angle of rotation in each direction in three-dimensional space is shown below in Equation (2).
[ Φ θ Ψ ] = [ arctan 2 ( q 0 q 1 + q 2 q 3 ) 1 2 ( q 1 2 + q 2 2 ) arcsin ( 2 ( q 0 q 2 q 1 q 3 ) ) arctan 2 ( q 0 q 3 + q 2 q 1 ) 1 2 ( q 3 2 + q 2 2 ) ] = [ a tan 2 ( 2 ( q 0 q 1 + q 2 q 3 ) , 1 2 ( q 1 2 + q 2 2 ) ) asin ( 2 ( q 0 q 2 q 1 q 3 ) ) a tan 2 ( 2 ( q 0 q 3 + q 2 q 1 ) , 1 2 ( q 3 2 + q 2 2 ) ) ]
The angles are the rotation angles of the phone model in each direction, and as shown in Figure 11, Φ is the angle of rotation around the y-axis, θ is the angle of rotation around the x-axis, and Ψ is the angle of rotation around the z-axis. Since the gyroscope data are in a right-handed coordinate system, and unity is in a left-handed coordinate system, we can convert it to see the scene in a certain direction by shifting it in a certain direction.
In the virtual simulation, when the gyroscope and its controller are turned on, the phone can be moved up and down as well as left and right. The phone can be turned from landscape to portrait, thus achieving a circular view of the laboratory environment. A better familiarity with the layout construction of the laboratory and the implementation of the experimental process and a real-time output of the direction, camera base settings, and gyroscope data are in the upper left corner, as in Figure 12.
The virtual experiment platform is presented on mobile phones using a gyroscope to assist the user to familiarize themselves with the basic layout of the laboratory and to assist the virtual experimenter and get to the location of each part of the experiment more quickly, thus making the simulated distribution photometer easier to manipulate and understand and greatly enhancing the user’s experience and immersion.

3.7. Multi-Platform Release

The computer side of this simulation system was tested on Huawei’s Window 11 system and Lenovo’s Window 10 system, respectively. In Huawei’s computer, the operation prompt interface appeared below the touch steering wheel, and the operation of the close button could not be achieved, so all the operation prompt interfaces were moved in unity, and the effect was achieved in Huawei and Lenovo computers after moving as shown in Figure 13a,b, respectively. The same was also achieved in desktop computers and tablets, respectively, as shown in Figure 13c,d below. The web end was verified in all five web pages and was able to manipulate the virtual experimenter to complete the whole experiment, and the pages of Lenovo browser and Google browser are now intercepted, as shown in Figure 13e,f below, respectively. The mobile phone side was also tested and verified at Xiaomi and Glory and could be manipulated normally, as shown in Figure 13g,h.

4. Conclusions

As full-field goniophotometer equipment is expensive and the experimental environment is demanding, this system combines virtual reality technology with the measurement of full-space distribution photometer luminaires, and it is completed with a virtual simulation system for the measurement of full-space distribution photometers through unity 3D. The system is based on the measurement of light intensity, and it combines 3D MAX and C# to achieve the construction of a laboratory. Through the constructions of a luminaire model and a model of a full-field goniophotometer, the drawing of a light distribution curve, and the use of a mobile phone, as well as publishing on multiple platforms, the system is simulated to bring the project closer to the actual experiment, allowing students to understand the equipment and learn the basics, familiarize themselves with the operating procedures, and gain a better understanding of the instrument. This virtual simulation is detached from realistic scenarios and does not take up real laboratory resources, allowing students to conduct full spatial distribution photometry experiments anytime and anywhere. At the same time, to improve the comprehension of the experiment, an operation prompt interface has been added to introduce both the experimental procedure and the results.

Author Contributions

Conceptualization, F.C. and N.Z.; methodology, S.L., F.C. and N.Z.; software, S.L. and F.C.; validation, S.L. and F.C.; formal analysis, S.L.; investigation, S.L.; resources, S.L.; data curation, S.L.; writing—original draft preparation, S.L.; writing—review and editing, S.L., F.C., X.H. and N.Z.; visualization, S.L. and F.C.; supervision, X.H. and N.Z. All authors have read and agreed to the published version of the manuscript.

Funding

This research received no external funding.

Institutional Review Board Statement

Not applicable.

Informed Consent Statement

Not applicable.

Data Availability Statement

The experimental data used to support the findings of this study are available from the corresponding author upon request.

Acknowledgments

Many thanks to Yahong Li for correcting and revising this article.

Conflicts of Interest

The authors declare no conflict of interest.

References

  1. Hu, Y. The application of distribution photometry in lighting engineering design. Light Sources Light. 2009, 4, 25–29. [Google Scholar]
  2. Hu, H.; Guo, Z.; Li, Q. Full-field Goniophotometer System for LED Road Lights. J. Light. Eng. 2009, 20, 59–61. [Google Scholar]
  3. Zhang, Y.; Cao, G.; Zou, N.; Xie, X.; Yuan, C.; Cao, X.; Liu, Q. Construction and research of experimental teaching platform for light source and lighting majors. Educ. Teach. Forum 2016, 10, 251–252. [Google Scholar]
  4. Cao, F.; Wang, B.; He, X.; Zou, N.l. Design of Goniophotometer virtual experiment platform. J. Electr. Electron. Teach. Learn. 2021, 43, 144–147. [Google Scholar]
  5. Pham, H.C.; Dao, N.-N.; Cho, S.; Nguyen, P.T.; Pham-Hang, A.-T. Construction Hazard Investigation Leveraging Object Anatomization on an Augmented Photoreality Platform. Appl. Sci. 2019, 9, 4477. [Google Scholar] [CrossRef]
  6. Elfakki, A.O.; Sghaier, S.; Alotaibi, A.A. An Efficient System Based on Experimental Laboratory in 3D Virtual Environment for Students with Learning Disabilities. Electronics 2023, 12, 989. [Google Scholar] [CrossRef]
  7. Liu, Z.; Xu, F. Research on Spectral Experiment Teaching Syatem Based on Unity 3D. Comput. Technol. Dev. 2019, 29, 119–124. [Google Scholar]
  8. Yan, S.; Qing, Z.; Liu, J.; Chen, J. Exploration on virtual simulation experiment teaching of fully mechanized mining technology based on Unity3D. Exp. Technol. Manag. 2020, 37, 137–140. [Google Scholar]
  9. GB/T9468-2008; General Requirements for the Photometry and Goniophotometry of Luminaries. GB National Standard: Beijing, China, 2008.
  10. Wen, G.; Xia, Y.; Wang, Y.; Hu, Z.; Wu, D. Design of virtual training system for horizontally oriented drill based on unity3D. J. Syst. Simul. 2020, 32, 801–807. [Google Scholar]
  11. Zhao, Q. An overview of virtual reality. China Sci. (Ser. F Inf. Sci.) 2009, 39, 2–46. [Google Scholar]
  12. Zou, J. Luminaire’s Photometric Curve and its Standard Format. J. Light. Eng. 2007, 18, 76–80. [Google Scholar]
  13. Qian, Q.; Su, T. Format Analysis and Application of Light Intensity Distribution Curve of Lighting Fixtures. J. Light. Eng. 2021, 32, 57–63. [Google Scholar]
  14. IESNA Standard File Format for the Electronic Transfer of Photometric Data and Related formation: ANSI/IESNA-LM-63-2002. Available online: https://fdocuments.net/document/ies-specification-lm-63-2002.html?page=1 (accessed on 10 April 2023).
  15. Guan, Y.; He, B.; Yu, R.; Ding, G. Implementation of quaternion based algorithm for solving gyroscope attitude angle. Comput. Program. Ski. Maint. 2015, 9, 32–34. [Google Scholar]
  16. Zhang, R.; Jia, H.; Chen, T.; Zhang, Y. Attitude solution for short-coupled inertial navigation systems based on the quadratic method. Opt. Precis. Eng. 2008, 10, 1963–1970. [Google Scholar]
Figure 1. Flow chart of the simulation system.
Applsci 13 05899 g001
Figure 2. Diagram of the virtual laboratory.
Applsci 13 05899 g002
Figure 3. Diagram of the various experimental modules. (a) Pick up the luminaire, (b) Get information about the luminaire, (c) Electrical connections, (d) Wiring connections for luminaires, (e) Transient tests, (f) Installation of light fittings, (g) Presentation of the test results, (h) Plotting light distribution curves, (i) Interface for operational processes, (j) Interface for measurement selection.
Applsci 13 05899 g003aApplsci 13 05899 g003b
Figure 4. Diagram the location of the light fittings: (a) At the Virtual Experimenter, (b) On the luminaire stand, (c) On the bench scale, (d) On Full-field Goniophotometer.
Applsci 13 05899 g004
Figure 5. Diagram of the various experimental modules. (a) Near-field Measurement models; (b) intermediate-field Measurement models; (c) far-field Measurement models.
Applsci 13 05899 g005
Figure 6. Switching of test results: (a) Interface for switching test results, (b) Switching to an interface for light intensity distribution, (c) Switching to the brightness screen, (d) Switching to the Spectrum interface.
Applsci 13 05899 g006
Figure 7. Results of light intensity distribution measurements: (a) Diagram of the results showcase, (b) Diagram showing illumination, (c) Graph showing polar co-ordinate light distribution curves, (d) Graph showing right-angle co-ordinate light distribution curves.
Applsci 13 05899 g007aApplsci 13 05899 g007b
Figure 8. Virtual measurement results: (a) Resulting graph of luminance distribution, (b) Graph showing the spectrum.
Applsci 13 05899 g008
Figure 9. Flow chart of data processing.
Applsci 13 05899 g009
Figure 10. Diagram of the light distribution curve. (a) Realistic light distribution curves; (b) Virtual light distribution curve at C0°; (c) Virtual drawing of the finished light distribution curve; (d) Model drawing of the 3D light distribution curve.
Applsci 13 05899 g010
Figure 11. Model drawing of the phone rotating.
Applsci 13 05899 g011
Figure 12. Model diagram of gyroscopically controlled rotation of the virtual experimenter’s view.
Applsci 13 05899 g012
Figure 13. Multi-platform testing of simulation systems: (a) Testing on Huawei PC, (b) Testing on Lenovo PC, (c) Tests on desktop computers, (d) Tablet test, (e) Testing on the Redmi mobile, (f)Testing on the Honor mobile, (g) Testing on SLBrowser, (h) Testing on Google Chrome.
Applsci 13 05899 g013
Table 1. Information on the location of the luminaire.
RegionLocationRotation
Virtual experimenter(19.5, 1.5, 50.0)(−90, 0, 0)
Table for lamps(0, 1.3, −0.1)(−180, 0, 0)
Bench scales(0, 0.1, 0)(−90, 0, 0)
Full-field Goniophotometer(−0.1, 1.1, 0.7)(−180, 0, 90)
Disclaimer/Publisher’s Note: The statements, opinions and data contained in all publications are solely those of the individual author(s) and contributor(s) and not of MDPI and/or the editor(s). MDPI and/or the editor(s) disclaim responsibility for any injury to people or property resulting from any ideas, methods, instructions or products referred to in the content.

