Article

Numerical Simulation and Optimization of the Airflow Field of a Forage Drum Mower

1
College of Mechanical and Electrical Engineering, Hunan Agricultural University, Changsha 410128, China
2
Hunan Key Laboratory of Intelligent Agricultural Machinery and Equipment, Changsha 410128, China
*
Author to whom correspondence should be addressed.
Appl. Sci. 2023, 13(10), 5910; https://doi.org/10.3390/app13105910
Submission received: 7 March 2023 / Revised: 7 May 2023 / Accepted: 8 May 2023 / Published: 11 May 2023
(This article belongs to the Section Agricultural Science and Technology)

Abstract

:
The repeated cutting of forage can cause grass breakage and affect the performance of the forage drum mower in harvesting forage. Also, it is worth paying attention to the effect of airflow around the cutter on the cutting and feeding processes. To explore the characteristics of the airflow field around the cutter and optimize the key parameters of the airflow, an analysis of the airflow field of the forage drum mower equipped with twisted blades, tilting discs, and guide plates was conducted through numerical simulation. Furthermore, an orthogonal experiment was carried out by using the numerical simulation model. According to the experimental results, the optimal velocity of the airflow for gathering, lifting, and feeding was reached when the disc speed was 2000 r/min, the blade twist angle was 8°, the disc tilt angle was 4°, and the number of guide plates was 2. On this basis, a prediction model of airflow parameters was constructed, and the parameters of airflow around the cutter were measured on a test bench. According to the measurement results, the results of prediction by the model were consistent with the simulation results. Also, compared with the data of airflow measurement, the average error of the model prediction value was −5.83% for the velocity of the gathering airflow, 2.37% for the velocity of the lifting airflow, and 4.20% for the velocity of the feeding airflow, which demonstrates the reliability of the simulation results and prediction model. The results of this research provide a practical reference for the optimal design of the forage drum mower.

1. Introduction

A mower conditioner is an essential device for forage harvesting, whose work performance has a direct impact on the outcome of forage harvesting and the quality of grass products. Currently, mowers are divided into drum mowers and reciprocating mowers, depending on the type of cutters used. As for the former, it relies on the rotary motion of the drum cutter to cut the stalk, which leads to a greater cutting capacity, lower stubble, and less vibration during service [1]. Therefore, it has been widely applied to forage harvesting.
The primary factors that affect the cutting performance of a drum cutter include its structure and operating parameters. In some studies, it has been shown that harvest loss is related to blade shape [2,3,4,5], cutter surface [6,7], and cutter speed [8,9,10,11]. The key factors affecting the shape and size of the cutting area are cutter size, blade arrangement, and cutting speed ratio [12,13,14], all of which should be thoroughly analyzed and taken into account for design. It has been demonstrated that the combination of twisted blades and tilting discs is effective in reducing harvest loss for leguminous forages such as alfalfa [15,16,17,18]. The twisted blades could lift the plant at the moment of cutting to reduce recutting, and the tilting discs are conducive to reducing stubble height and the smooth feeding of the plant to the subsequent condition roller.
In addition to the structure and operating parameters of the drum cutter, the airflow field around the cutter has a considerable impact on its cutting performance as well. At present, lawnmowers are the focus of research on the airflow field of cutters. Through Computational Fluid Dynamics (CFD) and other techniques, scholars have investigated the distribution of airflow [19,20,21] and air pressure [22,23] inside lawnmowers to figure out the effects of blade speed [24] and blade geometric parameters [25] on the airflow. Furthermore, the structural parameters of the cutter are optimized to determine the optimal parameters of the airflow field [26,27]. The lawnmower products even used airflow auxiliary systems such as airflow field management devices [28]. In addition, studies have shown that the internal airflow field has a substantial impact on the vibration and noisiness of lawnmowers, with the improvement of the airflow field demonstrated as one of the most effective solutions to reducing the noise made by lawnmowers [29,30,31,32]. In spite of this, there are still few studies conducted on the airflow field of forage drum mowers. It has been revealed that the aerodynamic action generated by the drum cutter is comparable to the weight of alfalfa, which means the airflow can affect the movement of alfalfa after cutting [16], thus affecting performance-related indicators such as recutting rate and loss rate. According to previous studies, when the cutter rotates, the airflow intersects and collides in front of the cutter, creating a lifting airflow and a feeding airflow above and behind the intersection point; these two airflows serve to reduce recutting and assist in feeding, respectively [17]. However, there is still a lack of clarity on the relationship between the cutter structure and operating parameters in the above-mentioned airflow field. Also, its effect on the airflow field is ignored by the existing design and optimization process of the cutter structure.
In summary, a double-drum cutter of 9GYZ-1.2 forage mower conditioner, equipped with twisted blades, tilting disc, and guide plates, is taken as the research object in this study to conduct numerical simulation and analysis of the airflow field around the cutter through CFD technology. Furthermore, the impact of the structure and operation parameters of the cutter on the airflow field is studied to optimize the design of the cutter structure and operating parameters, with consideration given to the airflow field parameters. The present study provides a reference for the design of cutters suitable for high-efficiency, low-loss forage harvesting.

2. Cutter Structure and Theory Analysis

2.1. Structure of Double-Drum Cutter

The cutter is one of the key components of the forage mower conditioner. As shown in Figure 1, the double-drum cutter of the 9GYZ series mower conditioner consists mainly of twisted blades, tilting discs, conical drums, and guide plates. The part of the twisted blade with the cutting edge is twisted and misaligned with the blade-mounting surface (i.e., the plane of the disc) at an angle of α, which is called the blade twist angle. With the inclined configuration of the discs of the cutter, the tilting disc forms an angle β, which is called the disc tilt angle, with the horizontal ground. A conical drum is mounted above the tilting disc, and multiple guide plates are mounted on the conical drum. When the cutter works, the two discs and drums rotate relatively at a high speed of 2000 rpm, while the twisted blades lift the forage plant while cutting off the forage stalk. Under the action of the guide plate, the forage is fed backward along the bevel of the disc into the conditioning device. This structure is effective in reducing the height of stubble and the recutting rate. Meanwhile, the high-speed rotating blades, discs, conical drums, and guide plates disturb the air to form an airflow, which has a significant effect on the process of lifting and feeding forage.

2.2. Theory Analysis of Airflow Field

The airflow field around a single drum was first analyzed. The single drum is basically a cylinder so the flow field around is approximately regarded as pure circulating flow [33].
As shown in Figure 2, the magnitude of the velocity v of a fluid microcluster at any point around a rotating drum is close to being inversely proportional to its polar radius r to the rotating center of the drum. Therefore, it can be expressed as follows:
v = c r
where c is a constant. The velocity v can be decomposed along the X- and Y-directions as follows:
v x = c r sin θ = c y x 2 + y 2 v y = c r cos θ = c x x 2 + y 2
where θ represents the angle between the line from the fluid microcluster to the rotating center and the X-direction. By substituting the above equation into the fluid continuity equation, the following can be obtained:
v x x + v y y = x ( c y x 2 + y 2 ) + y ( c x x 2 + y 2 ) = c 0 ( x 2 + y 2 ) 2 = 0
According to the above equation, the airflow around a single drum meets the conditions required for continuous flow. For a single fluid microcluster, the angular velocity is expressed as follows:
ω = 1 2 ( v y x v x y ) = 1 2 x ( c x x 2 + y 2 ) y ( c y x 2 + y 2 ) = c 2 0 ( x 2 + y 2 ) 2 = 0
Obviously, the airflow is an irrotational flow. In the context of a pure circulating flow, the velocity circulation of any curve enclosing the origin is constant and its magnitude is expressed as follows:
Γ = L v d s = 0 2 π c r r d θ = 2 π c
The flow function Ψ ( x , y ) , which can be derived from the above formula, is expressed as follows:
d Ψ = v x d y v y d x = Γ 2 π ( y x 2 + y 2 ) d y Γ 2 π ( x x 2 + y 2 ) d x = Γ 2 π d y 2 + d x 2 x 2 + y 2
By integrating it, the flow function can be expressed as:
Ψ = Γ 4 π ln ( x 2 + y 2 ) = Γ 2 π ln x 2 + y 2 = Γ 2 π ln r
For the velocity potential function φ ( x , y ) :
d φ = v x d x + v y d y = Γ 2 π ( y x 2 + y 2 ) d x + Γ 2 π ( x x 2 + y 2 ) d y = Γ 2 π x d y y d x x 2 + y 2 = Γ 2 π d ( y x ) 1 + ( y x ) 2
By integrating it, the velocity potential function can be expressed as:
φ = Γ 2 π arctg y x = Γ 2 π θ
From Equations (7) and (9), it can be seen that the lines of constant stream function of the airflow field around a single drum are a series of concentric circles centered on the rotational axis of the cutter and that the isopotential lines are half-rays from the center.
The above theory provides a reference for the analysis of the airflow field around a single-drum cutter. However, the airflow field around the cutter is also affected by various factors, including the structure of the blades and guide plates in practice (e.g., the shape and the position of the cutter), while the distribution and parameters of the airflow field tend to be inconsistent with the results of theoretical analysis. For the double-drum cutter, the two streams of airflow intersect and collide in front of the cutter, forming a relatively complex flow field. Consequently, it is difficult to build a theoretical model. Therefore, the CFD technique is applied in this study to numerically simulate the airflow field around the double-drum cutter for analysis.

3. Material and Method

3.1. Numerical Simulation

3.1.1. Simulation Scheme

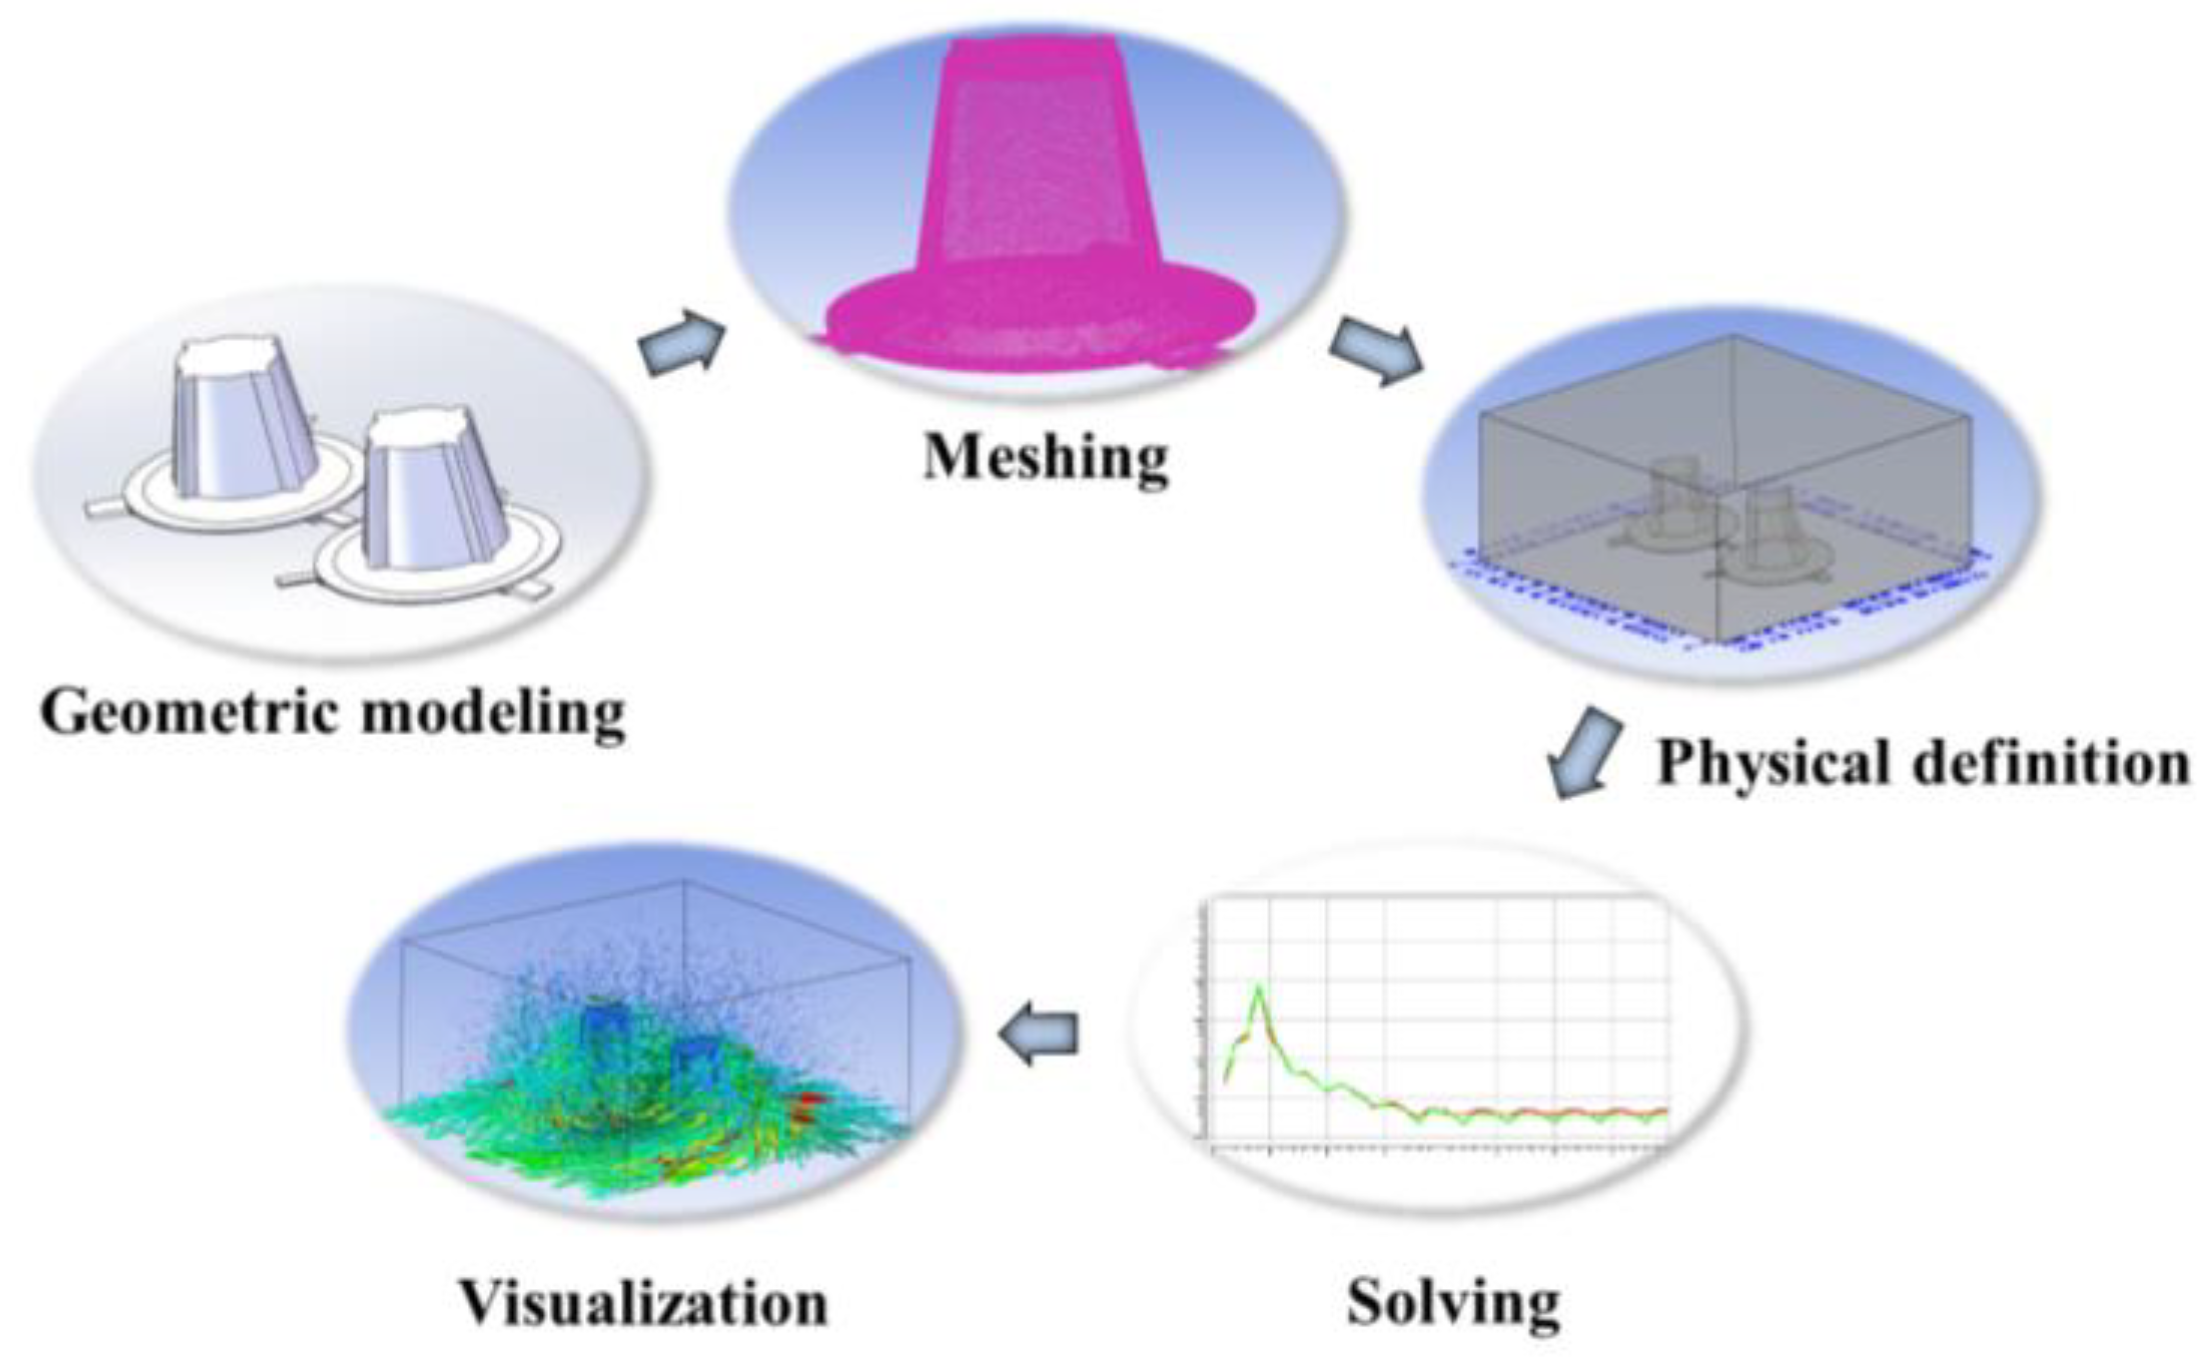
To simulate the airflow field around the double-drum cutter, the perturbation of the fluid by rotating components is required. In the present study, the airflow field is numerically simulated through the immersed solid calculation performed using the CFX software [15]. Figure 3 shows the flow scheme of the numerical simulation. Firstly, the geometric modeling of the double-drum cutter was performed using Solidworks software. Secondly, it was imported into ICEM software for meshing. Thirdly, the physical model was defined by the CFX-Pre module, such as setting the boundary conditions, initial conditions, motion parameters, and solving parameters of each solid and fluid domain. Finally, the numerical solution was obtained through the CFX-Solver module and the CFX-Post module was used to visualize the simulation results and extract data.

3.1.2. Simulation Parameters

The relevant simulation parameters include geometric parameters, meshing parameters, physical models, and solving parameters. As for the geometric model, the disc diameter was set to 223 mm. The conical drum was set to have a top diameter of 110 mm, a bottom diameter of 157 mm, and a height of 157 mm. As a convex rib with an isosceles triangle cross-section, the guide plate was mounted on the surface of the conical drum, with a width of 23 mm and a height of 14 mm. The blade was 60 mm long, 26 mm wide, and 4 mm thick, with 45° cutting edge on both sides. In accordance with the requirements of subsequent orthogonal experiments, the blade twist angle α, disc tilt angle β, and the number of guide plates were set, respectively. In addition to the solid domain of the cutter, it is also necessary to establish the geometric model of the fluid domain. The fluid domain model was constructed as a cuboid with a length of 800 mm, a width of 800 mm, and a height of 400 mm. The solid domain of the double-drum cutter was positioned in the middle of this cuboid region, with the distance between the tip of the blade and the bottom surface (used to simulate the ground) of the fluid domain cuboid set to 50 mm.
For the meshing, the mesh type was chosen to be Tera/Mixed, and the Robust (Octree) method was adopted to create the tetrahedral mesh. The Scale factor of 1 and the Max element of 3 were defined to control the size of the global mesh when the solid domain mesh was created, i.e., the maximum size of mesh in the solid domain was set to 3 mm. The Scale factor of 1 and the Max element of 15 were defined to control the size of the global mesh when the fluid domain mesh was created, i.e., the maximum size of mesh in the fluid domain was set to 15 mm.
For physical models and solving settings, the type of fluid was chosen to be air at 25 °C, and the k-epsilon turbulence model was treated as the computational solving model. The boundary condition for the bottom surface of the cuboid fluid domain was set to rough WALL with sand grain roughness of 20 mm for simulation of the ground, while the other five surfaces were set to OPENING for simulation of the free-flow air around the cutter. The solid domain was chosen to be immersed solid, the rotating motion was selected, and the parameters of the rotating speed were set according to the orthogonal test. The transient simulation was taken as the analysis type of solving, and the output variables include air-flow velocity and velocity components in each direction. The total simulation time was set to 2 s, and the simulation step size was set to 0.05 s when the cutter speed was 1500 r/min. To maintain the blades in the same position at the moment of 2 s at different disc speeds, the simulation step was adjusted accordingly when the rotating speed of the disc changed.

3.2. Orthogonal Experiments

3.2.1. Experimental Factors and Evaluation Indexes

In References [16,17], it is demonstrated that the gathering, lifting, and feeding airflows around the double-drum cutter can be used to promote the cutting and conveying of forage, which improves the outcome of harvesting. Also, the greater the airflow velocity, the more significant the positive effect. Therefore, orthogonal simulation experiments are carried out in this study through the numerical model as described previously to optimize the structure and operating parameters of the double-drum cutter with twisted blades and tilting discs by using the three airflow velocities mentioned above as evaluation indexes. Based on the existing research and experience, the disc speed, blade twist angle, disc tilt angle, and number of guide plates were taken as the test factors (coded as A, B, C, and D, respectively), with three levels set for each factor (Table 1). Also, orthogonal table L9(34) was used to perform the orthogonal experiments [34].

3.2.2. Measurement Methods of Evaluation Indexes

Through the post-processing module of CFX software, measurement points were set in the airflow field generated by numerical simulation. Besides, the data on airflow velocity were counted, while the magnitude of the gathering, lifting, and feeding airflows was calculated.
The measurement points of the gathering airflow velocity were set directly in front of the two drums (Figure 4) to measure the horizontal velocity of the airflow gathering towards the middle. The velocity of the gathering airflow was calculated as follows:
v g = i = 1 n ( v 1 i + v 2 i ) 2 n
where, vg denotes the velocity of the gathering airflow, in m/s; v1i represents the velocity of the airflow at the ith measurement point on line L1 in the +X-direction, in m/s; v2i indicates the velocity of the airflow at the ith measurement point on line L2 in the –X-direction, in m/s; n, which was set to 50, refers to the number of measurement points evenly distributed on line L1 and L2, respectively.
With the measurement points for the velocity of the lifting airflow set in the middle position in front of the cutter (Figure 5), the velocity of vertical upwards airflow was measured. The velocity of the lifting airflow was calculated as follows:
v l = i = 1 n v 3 i n
where, vl denotes the velocity of the lifting airflow, in m/s; v3i represents the velocity of the airflow at the ith measurement point on line L3 in the +Y-direction, in m/s; n, which was set to 50, refers to the number of measurement points evenly distributed on line L3.
The measurement points for the velocity of the feeding airflow were set in the middle position of the two conical drums (Figure 6) to measure the horizontal velocity of the airflow feeding backward. The velocity of the feeding airflow was calculated as follows:
v f = v P 1 + v P 2 + v P 3 3
where, vf denotes the velocity of the feeding airflow, in m/s; vP1 represents the velocity of the airflow at point P1 in the −Z-direction, in m/s; vP2 represents the velocity of the airflow at point P2 in the –Z-direction, in m/s; vP3 represents velocity of airflow at point P3 in the −Z-direction, in m/s.

3.2.3. Methodology of Statistical Analysis

The statistical analysis of orthogonal experimental data was performed in three steps. Firstly, to determine the degree of influence of each factor on the evaluation index and the optimal level of each factor, a range analysis was performed by calculating the mean and difference of each evaluation index under different levels of each factor. Secondly, an analysis of variance (ANOVA) was performed to determine the significance of the effect of the factors on the evaluation index, during which the least influential term in the range analysis was taken as the error term. Finally, multiple regression analysis was conducted on the results of nine groups of orthogonal experiments with the factors as independent variables and the evaluation indexes as dependent variables; the regression models could be used to predict the values of the evaluation indexes.

4. Results and Discussion

4.1. Distribution of Airflow Field

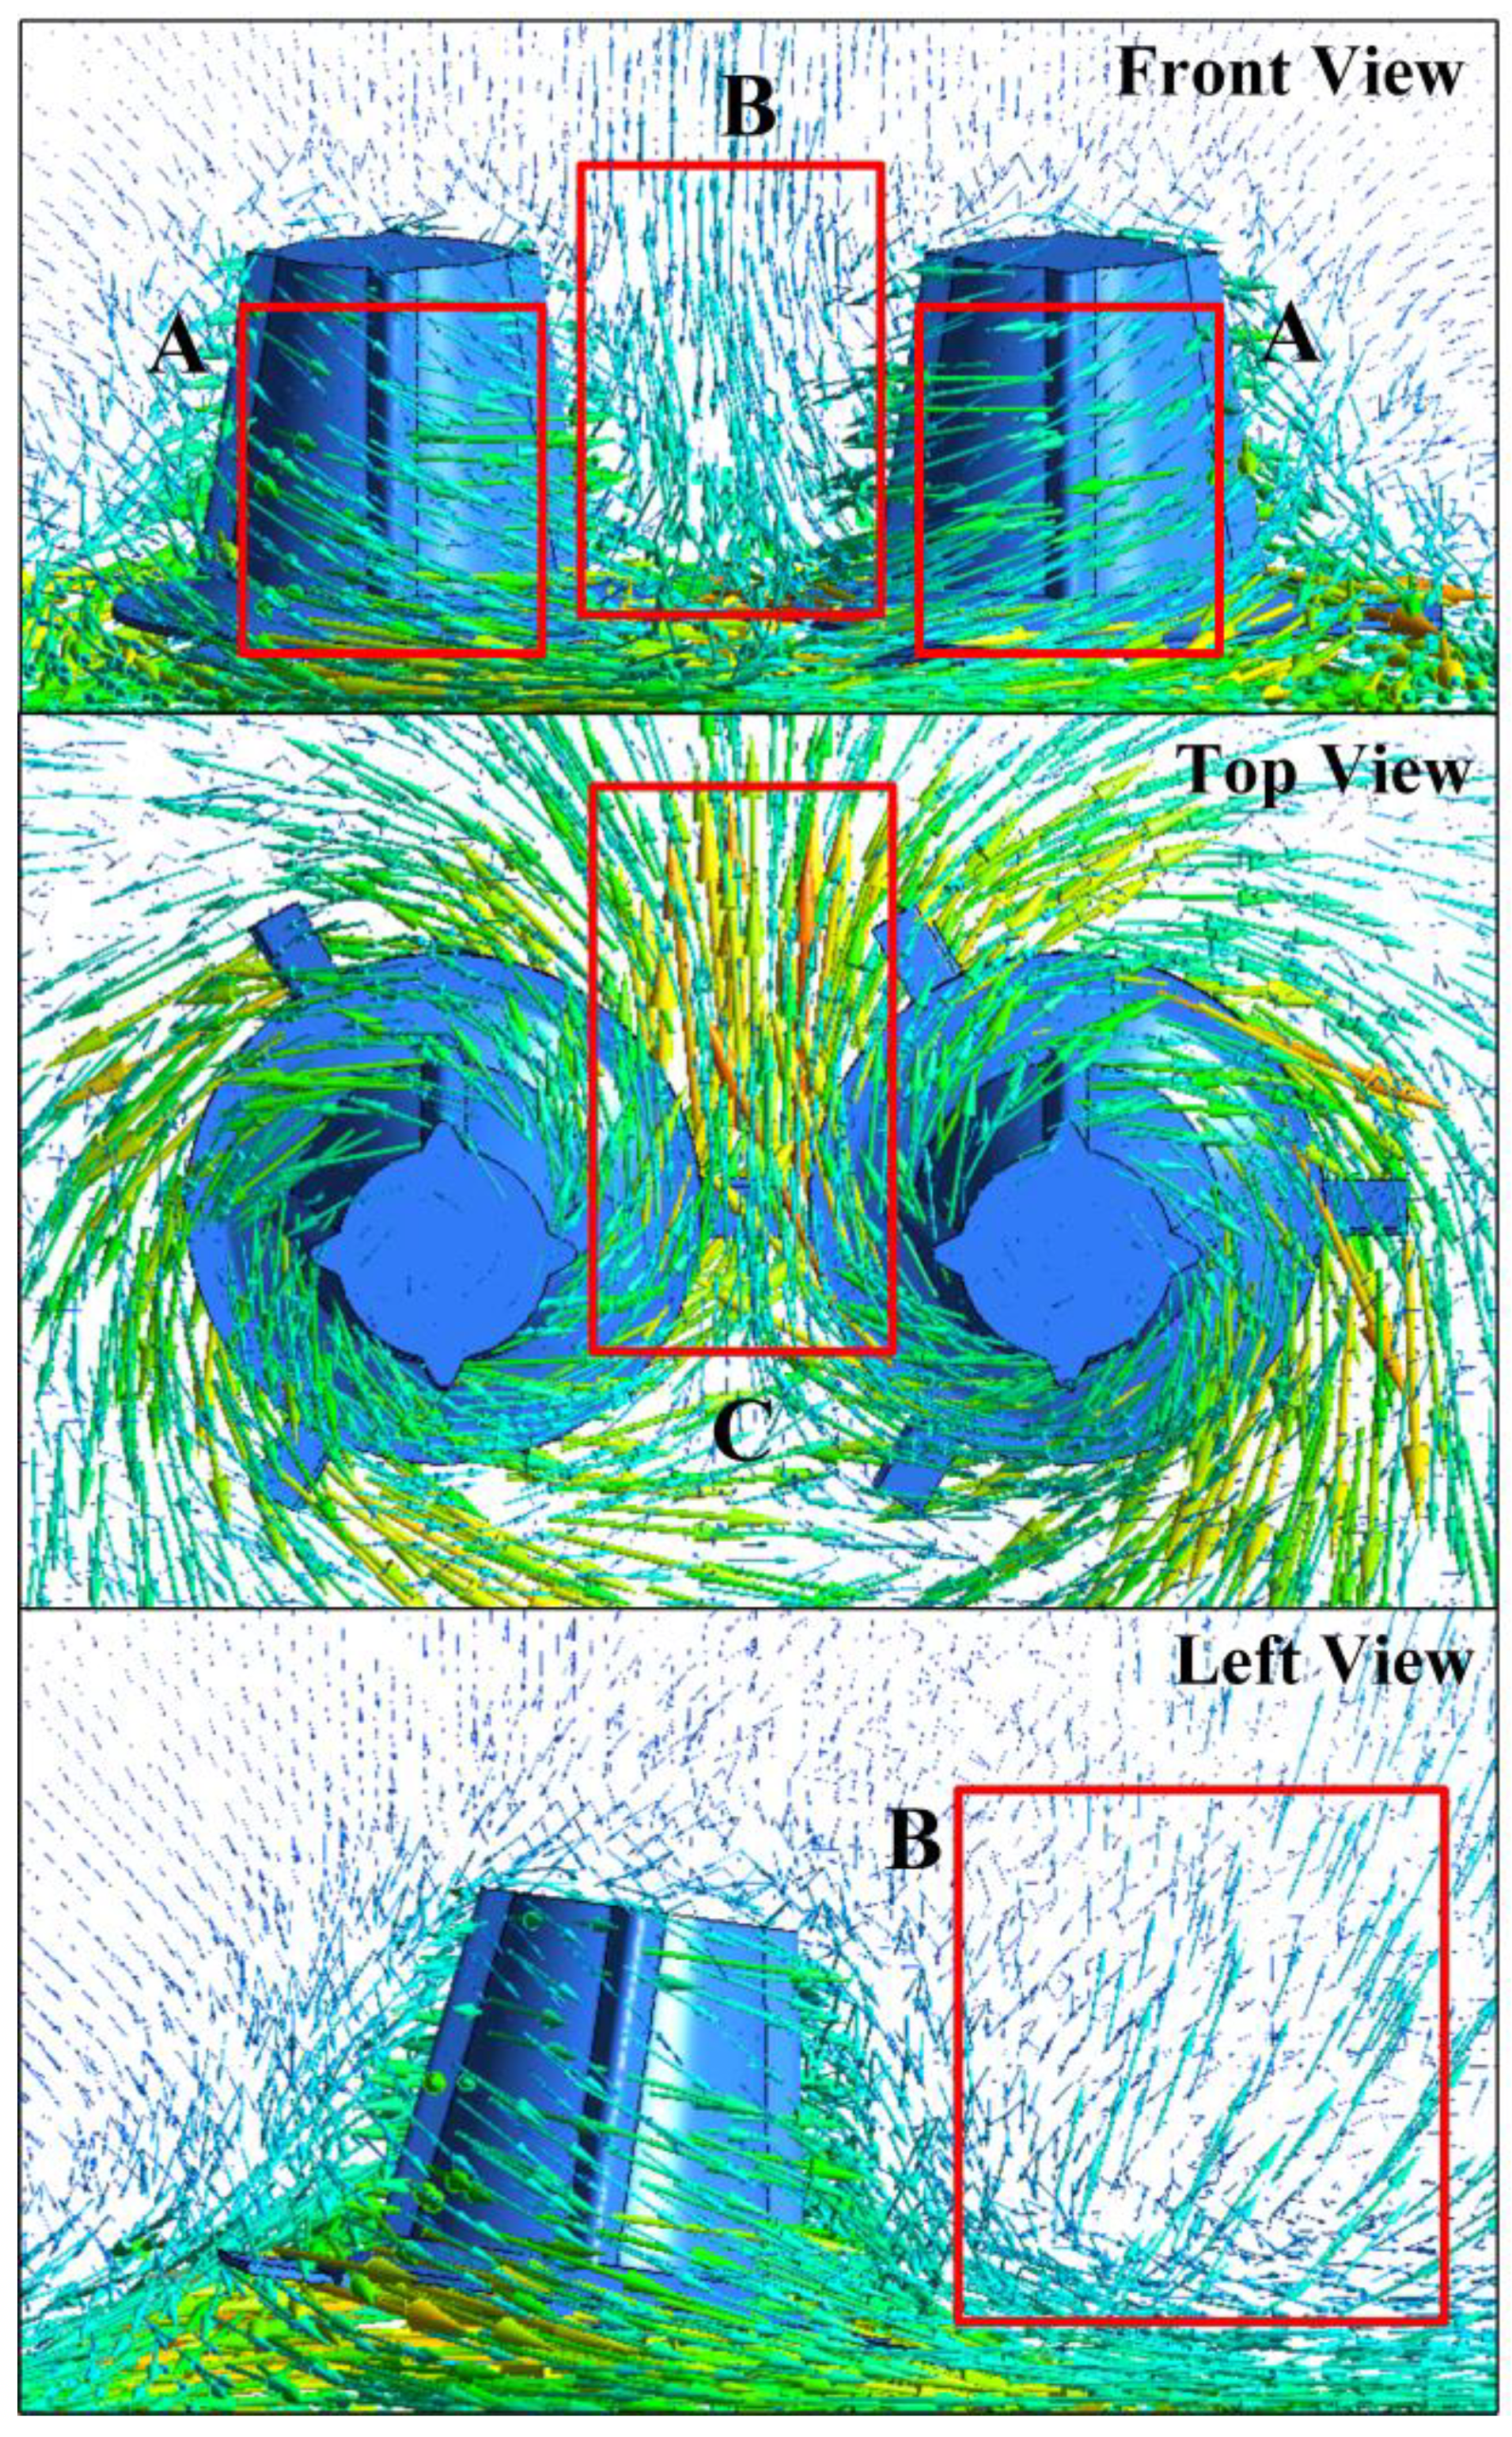
The results of the airflow field distribution around the double-drum cutter are shown in Figure 7.
When the two drums rotated relative to each other, the airflow was driven to collide in front of the cutter, thus forming the airflow field. Below is a qualitative analysis of airflow at the critical location and its effect on the harvesting process. As can be seen from Figure 7, area A is located right in front of the two conical drums, and the airflow in this area shifts from the two sides of the cutter to the middle, which is conducive to gathering the forage in the middle and ensuring the forage is transported backward during harvesting. This airflow is the gathering airflow, as mentioned above. Area B is located in the middle of the front of the cutters, where the airflow shifts from the bottom upwards, due to the collision of airflow coming from both sides. This lifting airflow can lift the forage plants upward and reduce the recutting by the blades. Area C is located between the two conical drums, where the airflow shifts from the front to the back. This airflow, known as the feeding airflow, transports the forage backward and assists its feeding into the rear conditioning device.

4.2. Results of Orthogonal Experiments

According to the orthogonal table arrangement, the data for each evaluation index were obtained through a simulation experiment. The results of the range analysis are shown in Table 2. For the velocity of the gathering air, the order of influence of each factor is as follows: A > D > C > B. For the velocity of the lifting air, the order of influence of each factor is as follows: C > A > D > B. For the velocity of the feeding air, the order of influence of each factor is as follows: A > C > D > B.
The ANOVA of the test results is shown in Table 3. According to the results of the range analysis, the blade twist angle has the least significant impact on the three evaluation indexes. Therefore, this factor was taken as the error term for variance analysis. At the significance level of 0.05, the effect of disc speed is significant when the gathering airflow velocity is treated as the evaluation index. When the velocity of the lifting airflow is taken as the evaluation index, the impact of disc speed and the disc tilt angle reaches a significant extent. When the velocity of the feeding airflow is taken as the evaluation index, a significant effect is exerted by the disc speed, disc tilt angle, and number of guide plates.

4.3. Optimal Parameters and Regression Models

In the above experiments, these three evaluation indexes are all expected to be large. The optimal combination of parameters was determined by using the integrated balance method, with consideration given to the results of range analysis and variance analysis. Factor A, i.e., the disc speed, exerts a significant effect on all three evaluation indexes, and the superior level is 3 for all three evaluation indexes. Therefore, the optimal parameter for disc speed is determined to be 2000 r/min. Factor B, i.e., blade twist angle, has no significant effect on the three evaluation indexes. The optimal level of blade twist angle is 3 for the velocity of the lifting and gathering airflow, and the superior level is 1 for the velocity of the feeding airflow. After careful consideration, the optimal parameter of the blade twist angle is determined to be 8°. Factor C, i.e., disc tilt angle, has a significant effect on the velocity of the lifting and feeding airflows rather than the gathering airflow. Thus, only its effect on the velocity of lifting and feeding airflows is considered. The range analysis reveals that the superior level for the velocity of the disc tilt angle on lifting and feeding airflows is 2, so the optimal parameter of the disc tilt angle is determined to be 4°. For factor D, i.e., the number of guide plates, its effect on the feeding airflow velocity reaches a significant extent, but its effect on the velocity of the lifting and gathering airflows is insignificant. Therefore, only its effect on the feeding airflow is taken into consideration. According to the results of the range analysis, the superior level is 2 for the number of guide plates on the velocity of feeding airflow. Thus, the optimal number of guide plates is determined as 2. In summary, to obtain the maximum lifting, feeding, and gathering airflows, the optimal structure and operating parameters of the double-drum cutter are determined as follows: a disc speed of 2000 r/min, a blade twist angle of 8°, a blade tilt angle of 4°, and 2 guide plates.
The orthogonal Latin square arrangement was adopted in the above experiments, which satisfied the orthogonal conditions of orthogonal polynomial regression. The model of airflow velocity prediction can be constructed by performing multiple linear regression based on the results of the orthogonal test so that the parameters of airflow field characteristics can be predicted according to the structure and operation parameters of the double-drum cutter.
For the velocity vg of the gathering airflow, the regression equation is established as follows:
vg = 2.4094 + 0.5351A + 0.056B − 0.2271C + 0.3036D
N = 9 R = 0.9345 F = 14.278 S = 0.2133
For the velocity vl of the lifting airflow, the regression equation is established as follows:
vl = 2.7325 + 0.9063A + 0.0943B + 0.6493C − 0.1955D
N = 9 R = 0.7152 F = 2.5113 S = 0.8777
For the velocity vf of the feeding airflow, the regression equation is established as follows:
vf = 5.6383 + 1.4228A − 0.0246B + 0.2955C + 0.2172D
N = 9 R = 0.9442 F = 12.9269 S = 0.4374

5. Verification Experiments

5.1. Simulation Verify Experiments

To verify the optimal parameters and the accuracy of the prediction model, the numerical simulation model was rebuilt using the optimal parameters as determined above and another simulation was conducted. Table 4 lists the simulation results and the comparison of them with the prediction results obtained using the regression model.
According to the results shown in Table 4 and the nine groups of orthogonal test results listed in Table 2, the optimal parameters of structural operation for the cutter lead to a high level of gathering, lifting, and feeding airflows. This parameter combination produces a better airflow field, thus achieving the purpose of optimization. In addition, the simulation results of the airflow field are basically consistent with the prediction results of the regression model, indicating the effectiveness of the regression model in predicting the parameters of airflow field characteristics with high accuracy.

5.2. Test Bench Verify Experiments

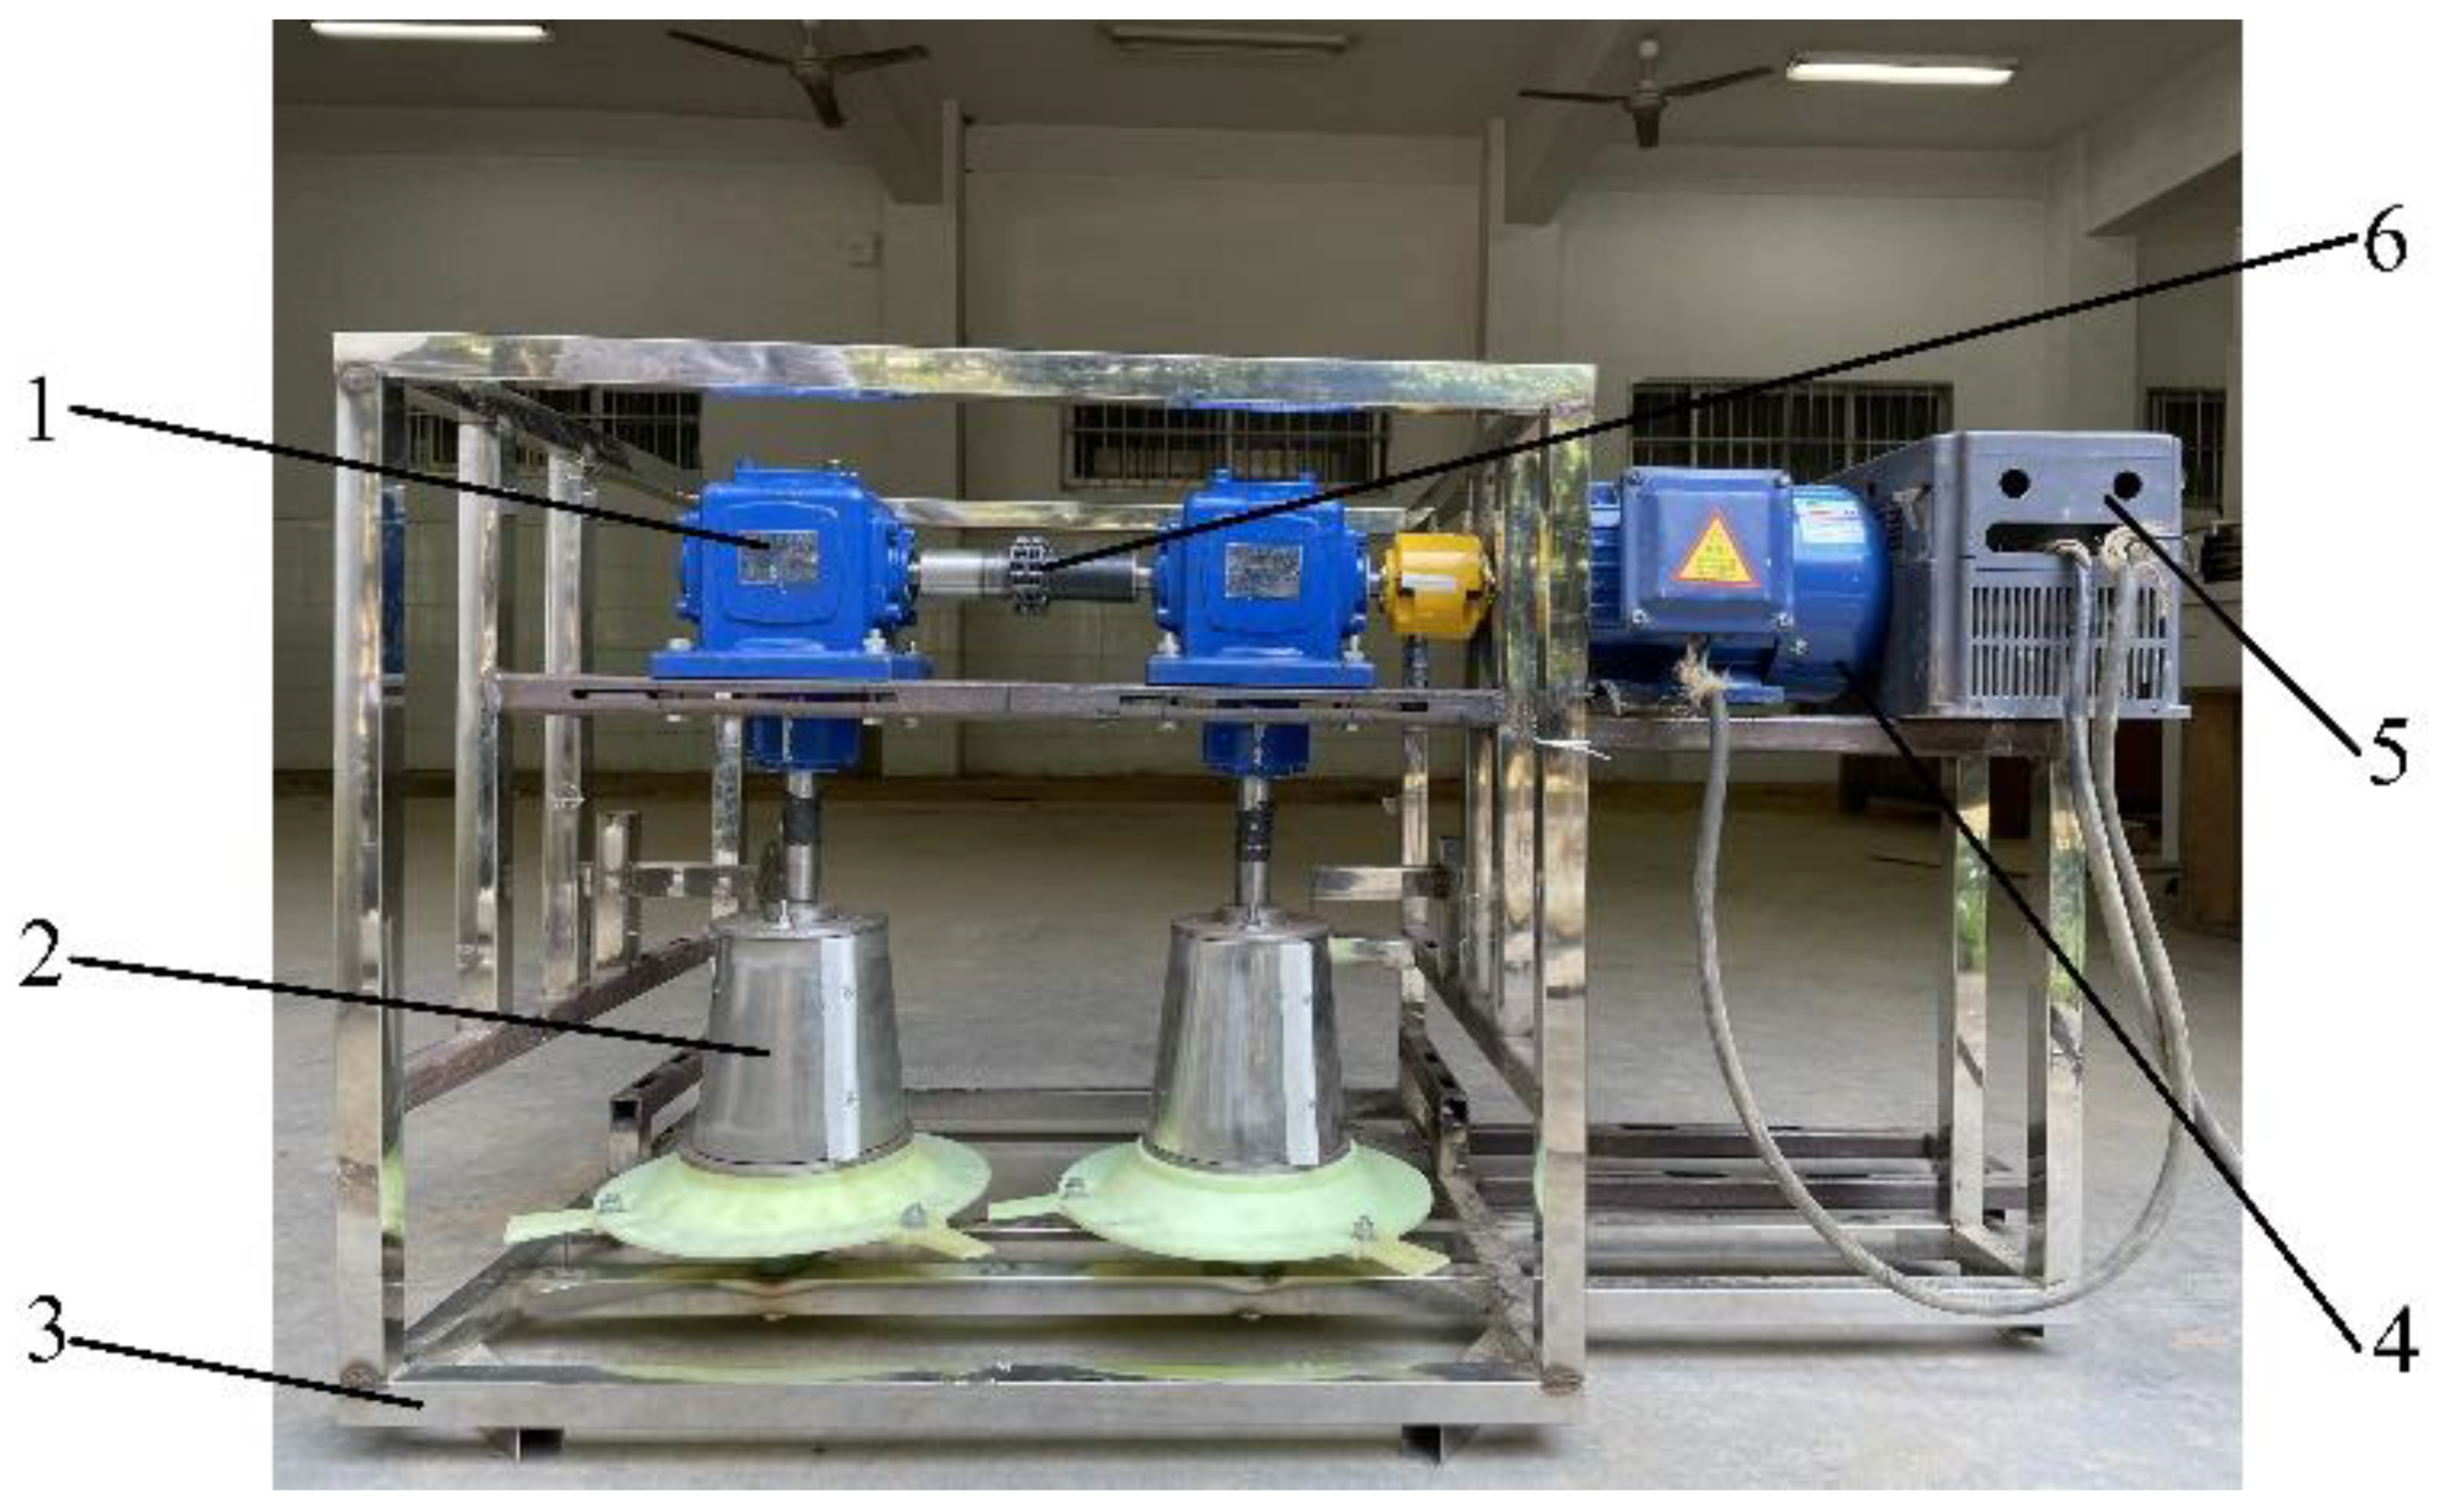
Although the prediction model has been verified in the above simulation verification experiments, neither the numerical simulation results nor the model prediction results have been compared with the actual airflow around the cutter, so it is necessary to build an actual test bench for measurement to verify the correctness of the above results. According to the optimal structural parameters as determined through the orthogonal test, a double-drum cutter test bench was built (Figure 8). The cutter was equipped with twisted blades, tilting discs, and guide plates. The twist angle was 8° for the blade, the tilt angle was 4° for the discs, the number of guide plates was 2, and the rotational speed of the discs was adjustable.
During the test, the disc was adjusted to three different rotational speeds: high, medium, and low. After the disc speed was stabilized, the photoelectric tachometer was used for measurement and recording. Then, according to the position and method of airflow velocity measurement, as shown in Figure 5, Figure 6 and Figure 7, the handheld hot-wire anemometer (TES-1314) was used to measure the airflow velocity at each measurement point. Then, the velocities of the gathering, lifting, and feeding airflows were calculated. Table 5 shows the results of the comparison between the airflow velocity predicted by the regression model and that as measured by the test bench at different disc speeds.
By comparing the results in Table 2, Table 4, and Table 5, it can be found out that the airflow velocity measured by the test bench is basically similar to that of the numerical simulation, and the variation trend of the airflow velocity under different disc speeds is also consistent, indicating that the numerical simulation results are reliable. In addition, the values of measured airflow velocity are basically consistent with that obtained by the regression model too, a further calculation was performed to reveal that compared with the results of airflow velocity measurement, the average error of the regression model is −5.83% for the predicted velocity vg of the gathering airflow, 2.37% for the predicted velocity vl of the lifting airflow, and 4.20% for the predicted velocity vf of the feeding airflow. These results confirmed the validity of the prediction model. Based on the above comparison and discussion, the airflow parameters in numerical simulations, model predictions, and actual measurements are relatively consistent; both numerical simulation and prediction model can provide support to evaluate the airflow field around the double-drum cutter. However, there are still limitations to the prediction model. Since this study is aimed at a specific structure of cutter (double-drum cutter with tilting disc, twisted blade, and guide plates) and the prediction model is based on this structure, the model could not be used for other structures of cutters, in that case, a new numerical simulation model is needed to analyze the airflow field.

6. Conclusions

In this paper, the airflow field around the double-drum cutter equipped with twisted blades, tilting discs, and guide plates was studied. Orthogonal experiments were carried out using the CFD numerical simulation model, with the structure and operating parameters optimized to generate a better airflow field. The main conclusions of this paper are presented as follows:
(1)
A theoretical analysis of the airflow field around the double-drum cutter was conducted to construct a numerical simulation model of the airflow field of the double-drum cutter for analysis of the distribution of the airflow field and its impact on the process of forage cutting.
(2)
A four-factor, three-level orthogonal simulation experiment was performed using a numerical simulation model of the airflow field of the double-drum cutter. Also, the optimal structure and operating parameters of the cutter were determined by using the integrated balance method as follows: a disc speed of 2000 r/min, a blade twist angle of 8°, a disc tilt angle of 4°, and 2 grass guide plates. Under these conditions, the numerical simulation of the airflow field was conducted to find out that the velocity of the lifting airflow was 7.5814 m/s, that of the feeding airflow was 11.4379 m/s and that of the gathering airflow was 4.1857 m/s. All of them are larger in terms of airflow speed, and the airflow field formed is expected to promote the feeding of forage and the reduction of recutting.
(3)
The model of airflow field characteristics parameters prediction was constructed, and a test bench was built according to the optimal structure parameters of the cutter. According to the results of verification experiments, the average error of the prediction model was −5.83% for the velocity of the gathering airflow, 2.37% for the lifting airflow, and 4.20% for the feeding airflow, which confirms the validity of the simulation results and the prediction model. The results of the study provide a practical reference for the optimal design of the double-drum cutter.

Author Contributions

Conceptualization, B.W. and Y.X.; methodology, B.W.; software, B.W., T.Z. and H.Q.; validation, T.Z. and Z.L.; H.Q. and T.H.; formal analysis, B.W. and T.Z.; investigation, B.W., T.Z. and T.H.; resources, B.W.; data curation, B.W. and T.Z.; writing—original draft preparation, B.W. and T.Z.; writing—review and editing, B.W.; visualization, B.W. and T.Z.; supervision, B.W.; funding acquisition, B.W. and Y.X. All authors have read and agreed to the published version of the manuscript.

Funding

This research was funded by the Scientific Research Fund of the Hunan Provincial Education Department (grant number 19B261), The Science and Technology Innovation Program of Hunan Province (grant number 2021NK1050-1) and Changsha Municipal Natural Science Foundation (grant number kq2208071).

Institutional Review Board Statement

Not applicable.

Informed Consent Statement

Not applicable.

Data Availability Statement

All data are presented in this article in the form of figures and tables.

Conflicts of Interest

The authors declare no conflict of interest.

References

  1. Li, B. Agricultural Mechanics, 2nd ed.; China Agriculture Press: Beijing, China, 2018. [Google Scholar]
  2. Atallah, M.M. Development of a mower for grass harvesting. J. Soil Sci. Agric. Eng. 2014, 5, 203–217. [Google Scholar] [CrossRef]
  3. Nguyen, T.K.; Minh, C.N.; Ngoc, T.T.; Trung, T.B. Experimental research to determine the optimal working regime of a twin-drum mower for the dragon fruit orchards in Vietnam. In AIP Conference Proceedings; AIP Publishing LLC: College Park, MD, USA, 2021; p. 020037. [Google Scholar] [CrossRef]
  4. Pruitt, M.E.; Nafziger, B.; Schroeder, J.W. Fixed Rotary Knife. U.S. Patent 13,399,630, 17 February 2012. [Google Scholar]
  5. Pruitt, M.E.; Nafziger, B.; Schroeder, J.W. Bell Knife for Rotary Mower. U.S. Patent 13,399,603, 23 August 2012. [Google Scholar]
  6. Pruitt, M.E.; Nafziger, B.; Schroeder, J.W. Fixed Rotary Knife with Multiple Cutting Surfaces. U.S. Patent 8,695,316, 15 April 2014. [Google Scholar]
  7. Dan, C.; Shao, X.; Liu, T.; Yang, M. Simulation of Minitype Grass Trimmer’s Cutter Deformation. Trans. Chin. Soc. Agric. Mach. 2010, 41, 80–83. [Google Scholar] [CrossRef]
  8. Kumawat, L.; Raheman, H. Laboratory Investigations on Cutting Torque and Efficiency for Topping of Onion Leaves Using Wire-Type Rotary Unit. J. Biosyst. Eng. 2022, 47, 428–438. [Google Scholar] [CrossRef]
  9. Hosseini, S.S.; Shamsi, M. Performance optimization of a rotary mower using Taguchi method. Agron. Res. 2012, 10, 49–54. [Google Scholar]
  10. Ismail, Z.; El-Hadidi, Y.; El-Saadany, M. The utilization of a developed disc mower to remove the vegetative tops of some tuber crops. Misr. J. Ag. Eng 1993, 10, 508–524. [Google Scholar]
  11. Wu, B.; Wang, D.; Wang, G.; Fu, Z.; Kang, C. Optimization and experiments of cut-condition device working parameter on mower conditioner. Trans. Chin. Soc. Agric. Mach. 2017, 48, 76–83. [Google Scholar] [CrossRef]
  12. Xie, S.; Zhao, H.; Yang, S.; Xie, Q.; Yang, M. Design, analysis and test of small rotary lawn mower of single-disc type. INMATEH-Agric. Eng. 2020, 62, 89–98. [Google Scholar] [CrossRef]
  13. Tuck, C.; O’Dogherty, M.; Baker, D.; Gale, G. Field experiments to study the performance of toothed disc mowing mechanisms. J. Agric. Eng. Res. 1991, 50, 93–106. [Google Scholar] [CrossRef]
  14. Kemper, S.; Lang, T.; Frerichs, L. Analysis of the overlaying cut in rotary mowers. Landtechnik 2012, 67, 346–349. [Google Scholar]
  15. Wang, D.; Fu, Z.; Wang, G.; Gao, D.; Yuang, H.; Ma, X.; Liang, F.; Sun, J. A Small Self-Propelled Alfalfa Mower Conditioner. China Patent ZL2012102037054, 20 June 2012. [Google Scholar]
  16. Fu, Z. Study on Cutting System for Two Discs Mower Conditioner. Ph.D. Thesis, China Agricultural University, Beijing, China, 2014. [Google Scholar]
  17. Wu, B. Optimization and Experimental Study on Mechanical System of Alfalfa Mower Conditioner. Ph.D. Thesis, China Agricultural University, Beijing, China, 2014. [Google Scholar]
  18. Wu, B.; Wang, D.; Wang, G.; Fu, Z.; Guo, Z. Simulation analysis and experiment of profiling device of small self-propelled mower. Trans. Chin. Soc. Agric. Mach. 2015, 46, 123–129. [Google Scholar] [CrossRef]
  19. Kim, H.J.; Kim, S.H. A Study on Air Flow Characteristics of Mid mower for Tractor (I). J. Korean Soc. Manuf. Proc. Eng. 2015, 14, 27–35. [Google Scholar] [CrossRef]
  20. Zhang, L. Study of the Airflow Field and Dynamics of the Blade of a Commercial Ride-On Lawn Mower. Master’s Thesis, Nanjing University of Science and Technology, Nanjing, China, 2009. [Google Scholar]
  21. Chon, W.; Amano, R.S. Experimental and computational investigation of triple-rotating blades in a mower deck. JSME Int. J. Ser. B-Fluid T. Eng. 2003, 46, 229–243. [Google Scholar] [CrossRef]
  22. Čedík, J.; Chyba, J.; Pexa, M.; Petrásek, S. Influence of shape of cutting tool on pressure conditions in workspace of mulcher with vertical axis of rotation. Agron. Res. 2017, 15, 1530–1539. [Google Scholar] [CrossRef]
  23. Giordano, A.J. Pressure mapping under an operating lawn mower deck. J. Acoust. Soc. Am. 1995, 98, 2884. [Google Scholar] [CrossRef]
  24. Chon, W.; Amano, R.S. Investigation of flow behavior around co-rotating blades in a double spindle lawn mower deck. Int. J. Rotating Mach. 2005, 2005, 763964. [Google Scholar] [CrossRef]
  25. Čedík, J.; Pexa, M.; Chyba, J.; Vondrášek, Z.; Pražan, R. Influence of blade shape on mulcher blade air resistance. Agron. Res. 2016, 14, 337–344. Available online: http://www.vuzt.cz/svt/vuzt/publ/P2016/018.pdf (accessed on 15 August 2022).
  26. Yu, Y.; Zhang, L.; Li, J.; Shi, W. The different air movement under the different blade angle in mower. Machinery 2010, 37, 1–2. [Google Scholar]
  27. Zu, L.; Zhang, L.; Wang, H.K. Optimization design of the lawn mowing vehicle’s blade based on aerodynamics. Adv. Mater. Res. 2011, 199, 173–181. [Google Scholar] [CrossRef]
  28. Mateski, C.J.; Haney, D.W.; Davey, A.L. Airflow Management. U.S. Patent 8,290,629, 16 October 2012. [Google Scholar]
  29. Li, W.; Zhou, X. Noise Testing and Analysis of Small Mowers. For. Mach. Woodwork. Equip. 2014, 42, 20–22. [Google Scholar] [CrossRef]
  30. Davidge, E.D. Study on Airflow and Vibraton in a Cutting/Collection/Discharge Lawn Care System. Ph.D. Thesis, Ryerson University, Toronto, ON, Canada, 2004. [Google Scholar]
  31. Gokool, T.; Chowdary, B.V. Design and Development of a Low-Noise Lawnmower Blade: Application of CAD, CAE and RP Tools and Techniques. West Indian J. Eng. 2017, 40, 11–16. Available online: https://sta.uwi.edu/eng/wije/vol4001_jul2017/documents/M02_17001_v40n1p11-16_TGokoolJul1707.pdf (accessed on 15 August 2022).
  32. Mahoney, D.P.; Mahoney, B.D.; Spear, J. Lawn Tractor Noise Reduction: Results of a Noise Dosimetry Study. Prof. Saf. 2017, 62, 52–57. Available online: https://www.jespear.com/documents/Lawn%20Tractor%20Noise%20Reduction%20Article.pdf (accessed on 15 August 2022).
  33. Jiang, E.; Jiang, Y. Studies on the Characteristics of Airflow Field Surrounding the Stripping Rotor with Triangle Plate Teeth. Trans. Chin. Soc. Agric. Eng. 2000, 16, 59–62. [Google Scholar]
  34. He, W. Optimization of Experimental Design Methods and Data Analysis; Chemical Industry Press: Beijing, China, 2014. [Google Scholar]
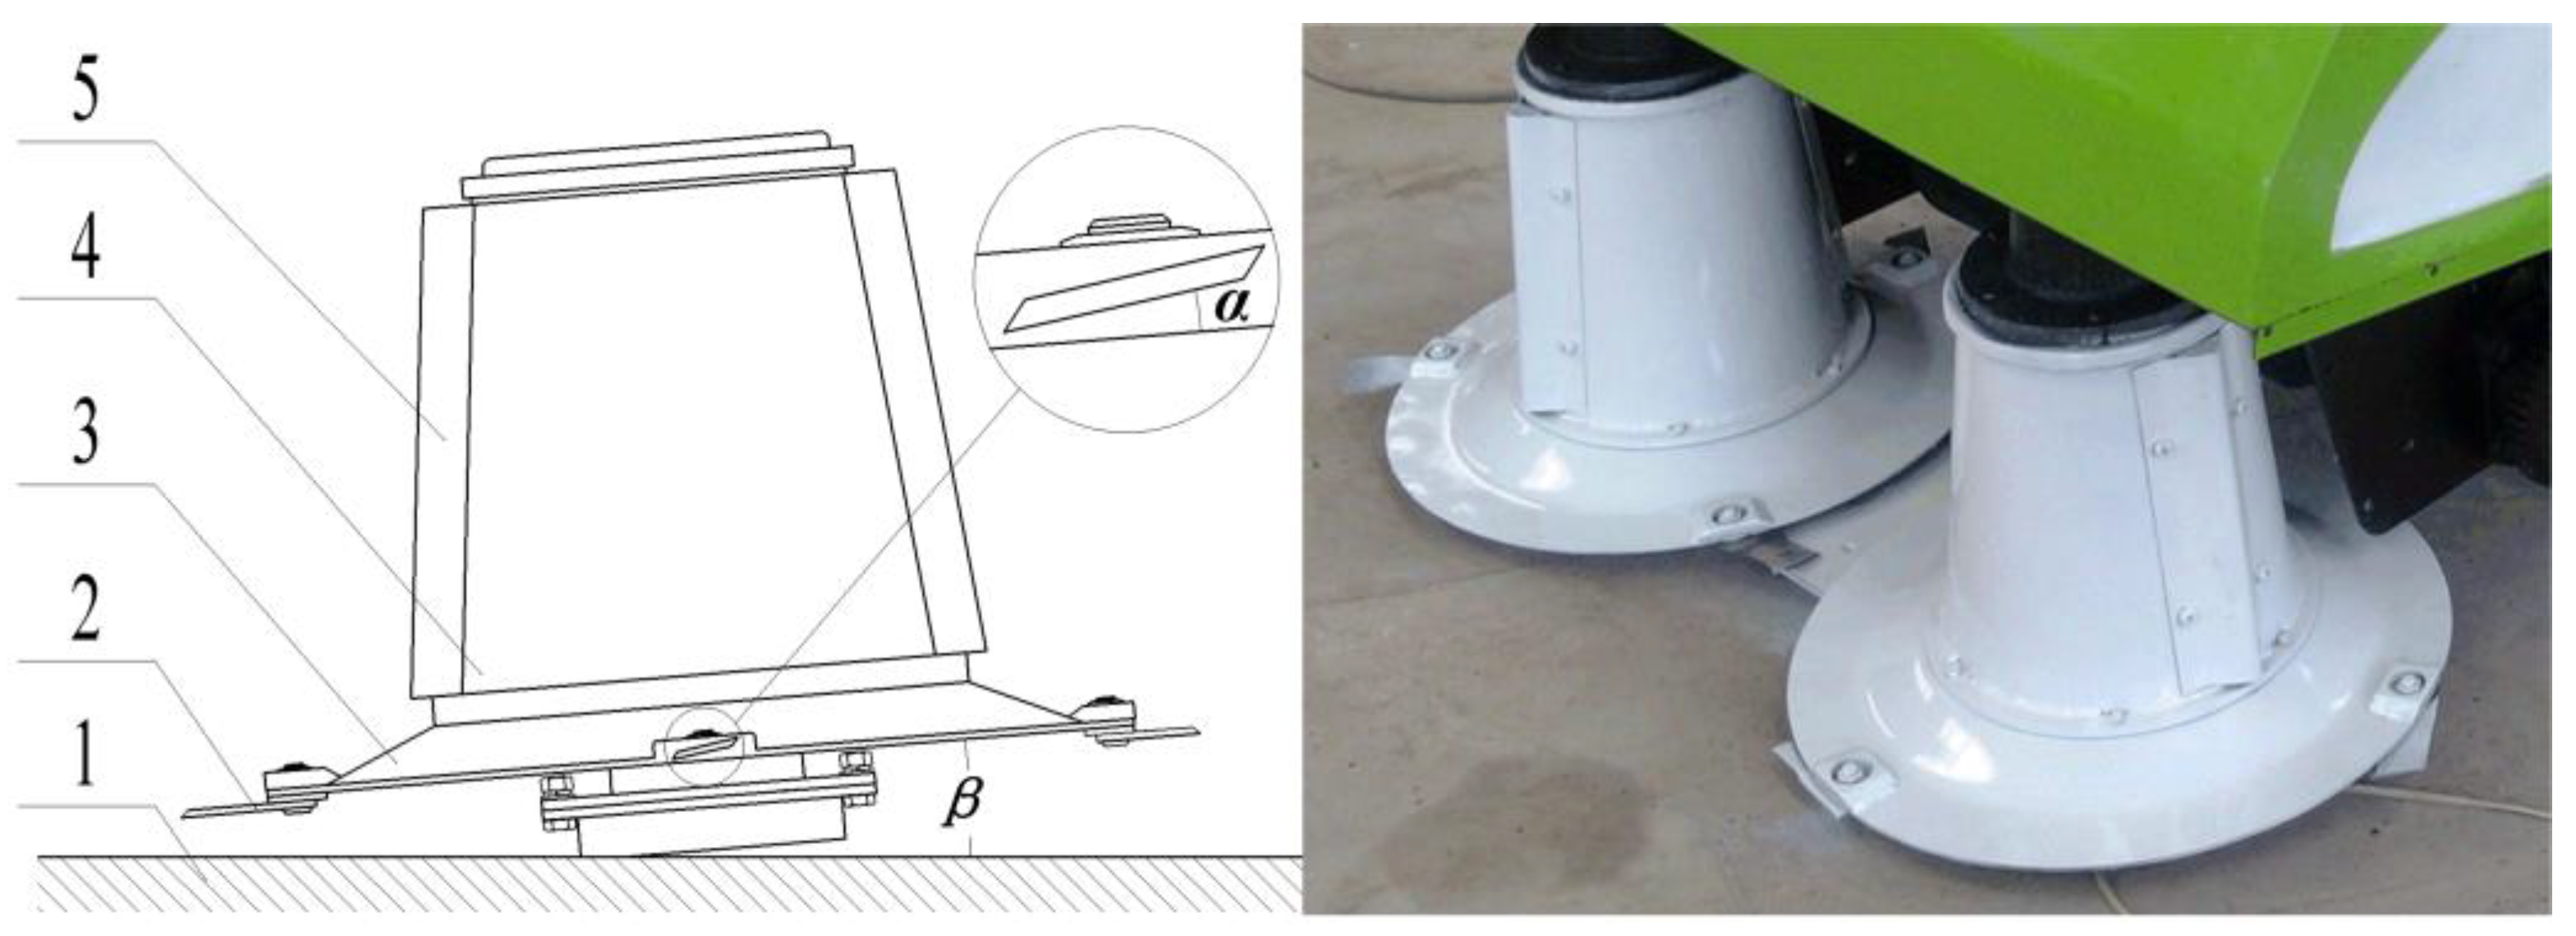
Figure 1. Structure of double-drum cutter. 1. Ground 2. Twisted blade 3. Tilting disc 4. Conical drum 5. Guide plates.
Applsci 13 05910 g001
Figure 2. Airflow velocity around a rotating drum.
Applsci 13 05910 g002
Figure 3. Flow chart of simulation.
Applsci 13 05910 g003
Figure 4. Measuring positions of the gathering airflow.
Applsci 13 05910 g004
Figure 5. Measuring positions of the lifting airflow.
Applsci 13 05910 g005
Figure 6. Measuring positions of the feeding airflow.
Applsci 13 05910 g006
Figure 7. Distribution of the airflow field.
Applsci 13 05910 g007
Figure 8. Test bench of double-drum cutter. 1. Gearbox 2. Cutter 3. Frame 4. Motor 5. Frequency converter 6. Shaft coupling.
Applsci 13 05910 g008
Table 1. Factors and Levels.
LevelFactors
ABCD
Number of Guide Plates
Disc SpeedBlade Twist AngleDisc Tilt Angle
(r/min)(Degrees)(Degrees)
11500000
21750442
32000884
Table 2. Results of Orthogonal Experiments and Range Analysis.
IndexesTest NO.ABCDvg/(m/s)vl/(m/s)vf/(m/s)
111113.0243.9157.3798
212223.0515.34648.6026
313333.2895.0118.356
421234.25096.2289.7953
522313.28865.95959.0892
623124.22244.59959.0434
731323.9276.683911.332
832134.62075.244310.581
933214.02667.78210.960
vgK13.12133.73403.95573.4464
K23.92063.65343.77623.7335
K34.19143.84603.50154.0535
R1.07010.19260.45420.6071
vlK14.75755.60904.58635.8855
K25.59575.51676.45215.5433
K36.57015.79755.88485.4944
R1.81260.28081.86590.3911
vfK18.11289.50269.00179.1433
K29.30939.42459.78629.6596
K310.9589.45349.59279.5777
R2.84570.07810.78460.5163
Table 3. Analysis of Variance for Orthogonal Experiments.
IndexesSource of VariationSum ofDegree ofMean SquareF Valuesp Values
SquaresFreedom
vgDisc speed1.85720.92833.0960.0293 *
Disc tilt angle0.31420.1575.5930.1517
Number of guide plates0.55320.2769.8620.0921
Error0.05620.028
Total128.979
vlDisc speed4.93722.468840.18130.0243 *
Disc tilt angle5.48922.744844.67320.0219 *
Number of guide plates0.27220.13622.21710.3108
Error0.12220.0614
Total297.2179
vfDisc speed12.24926.1241309.1180.0008 **
Disc tilt angle1.00220.501107.1190.0092 **
Number of guide plates0.46220.23149.3800.0198 *
Error0.00920.0047
Total819.1799
Note: * and ** indicated significance at 0.05 and 0.01 levels, respectively.
Table 4. Predicted value and result of the Verify test.
IndexesSimulated ValuesModel Predicted ValuesError (%)
(m/s)(m/s)
Gathering airflow velocity vg4.18574.3355+3.58
Lifting airflow velocity vl7.58146.6416−12.4
Feeding airflow velocity vf11.437910.8584−5.07
Table 5. Results of the verification experiments.
IndexesDisc Speed
(m/s)
Model Predicted Values
(m/s)
Measured Value
(m/s)
Error (%)
Gathering airflow velocity vg14802.622.88−9.03
17803.263.38−3.55
19604.254.47−4.92
Lifting airflow velocity vl14804.764.535.08
17805.845.692.64
19606.56.54−0.61
Feeding airflow velocity vf14807.467.213.47
17809.178.646.13
196010.6310.323.00
Disclaimer/Publisher’s Note: The statements, opinions and data contained in all publications are solely those of the individual author(s) and contributor(s) and not of MDPI and/or the editor(s). MDPI and/or the editor(s) disclaim responsibility for any injury to people or property resulting from any ideas, methods, instructions or products referred to in the content.